Integrated proteome and phosphoproteome analysis of gastric adenocarcinoma reveals molecular signatures capable of stratifying patient outcome
Abstract
Metastasis is one of the main causes of low survival rate of gastric cancer patients. Exploring key proteins in the progression of gastric adenocarcinoma (GAC) may provide new candidates for prognostic biomarker development and therapeutic intervention. We applied quantitative mass spectrometry to compare the proteome and phosphoproteome of primary tumor tissues between GAC patients with and without lymph node metastasis (LNM). We then performed an integrated analysis of the proteomic and transcriptomic data to reveal the molecular features. We quantified a total of 5536 proteins, and we found 218 upregulated and 49 downregulated proteins in tumor samples from patients with LNM compared to those without LNM. Clustering analysis identified a number of hub proteins that have been previously shown to play important roles in gastric cancer progression. We also found that two extracellular proteins, TNXB and SPON1, are overexpressed in patients with LNM, which correlates with poor survival of GAC patients. Overexpression of TNXB and SPON1 was validated by western blotting and immunohistochemistry. Furthermore, treating gastric cancer cells with anti‐TNXB antibody significantly reduced cell migration. Finally, quantitative phosphoproteomic analysis combined with activity‐based kinase capture revealed a number of activated kinases in primary tumor tissues from patients with LNM, among which GSK3 might be a new target that warrants further study. Our study provides a snapshot of the proteome and phosphoproteome of GAC tumor tissues that have metastatic potential, and identifies potential biomarkers for GAC progression.
Article type: Research Article
Keywords: biomarker, gastric adenocarcinoma, lymph node metastasis, SPON1, TNXB
Affiliations: Shanghai Key Laboratory of Regulatory Biology, School of Life Sciences East China Normal University Shanghai China; Department of General Surgery, Shanghai Tenth People’s Hospital, School of Medicine Tongji University Shanghai China; University of California San Diego La Jolla CA USA; Durbrain Medical Laboratory Hangzhou China; Department of Oncology The First Affiliated Hospital of Zhengzhou University China; Department of Gastric Surgery Fudan University Shanghai Cancer Center China; Department of Oncology, Shanghai Medical College Fudan University Shanghai China
License: © 2022 The Authors. Molecular Oncology published by John Wiley & Sons Ltd on behalf of Federation of European Biochemical Societies. CC BY 4.0 This is an open access article under the terms of the http://creativecommons.org/licenses/by/4.0/ License, which permits use, distribution and reproduction in any medium, provided the original work is properly cited.
Article links: DOI: 10.1002/1878-0261.13361 | PubMed: 36520032 | PMC: PMC9892830
Relevance: Moderate: mentioned 3+ times in text
Full text: PDF (12.6 MB)
Introduction
Gastric cancer is one of a leading cause of cancer‐related deaths worldwide [ref. 1], among which gastric adenocarcinoma (GAC) is the most common form [ref. 2]. Diagnosis of GAC is generally made at advanced stages when metastatic spreading occurs, which significantly reduces the efficacy of surgical treatment and contributes to poor patient survival [ref. 3, ref. 4]. Accurate detection of GAC and prediction of cancer progression at early stages hold great promise to improve the clinical outcomes.
At initial diagnosis, lymph node metastasis (LNM) occurs in more than half of gastric cancer patients, leading to poor prognosis [ref. 5]. Therefore, lymph node status can be used as a powerful prognostic indicator for gastric cancer patients 5 years after radical surgery [ref. 6]. Early‐stage gastric cancer patients with four or more metastatic lymph nodes have a higher recurrence rate and lower survival rate [ref. 7]. LNM involves a series of complex biological processes including reduced adhesion to adjacent cells, degradation of extracellular matrix (ECM), and lymphatic channel infiltration [ref. 8]. ECM contains proteins, glycoproteins, and proteoglycans, and it plays a critical role in regulating cell–cell or cell–matrix interaction and influencing tumor progression [ref. 9]. Overexpression of matricellular proteins (MCPs), which are then secreted into the ECM, is an important feature during tissue remodeling [ref. 10]. Tumor cells secrete MCPs into the tumor microenvironment, thereby promoting tumor progression [ref. 11]. Therefore, capturing the molecular features in the premetastatic ECM is indispensable to understand the biological processes of tumor metastasis.
Protein kinases are important drug targets for many diseases. As of 2021, nearly 70 novel small molecule kinase inhibitors have been approved by FDA to combat various cancers. In 2021 alone, four kinase inhibitors were approved to treat cholangiocarcinoma, non–small‐lung cell carcinoma, and renal cell carcinoma [ref. 12]. While quantitative proteomics analyses depict the expression levels of kinases, quantitative phosphoproteomic studies reveal the activity of the kinases.
Recently, a number of reports analyzed the proteomic differences between tumor and para‐tumor tissues from gastric cancer patients, and explored the underlying molecular subtyping [ref. 13, ref. 14, ref. 15] as well as the correlation between identified protein markers and clinical outcomes of LNM [ref. 16, ref. 17, ref. 18, ref. 19]. Nevertheless, many proteins may play important roles in promoting tumor progression and metastasis without showing differential expression between tumor and para‐tumor tissues. In addition, very little is known regarding the proteomic and phosphoproteomic features associated with gastric cancer progression and lymph node metastasis. Similarly, although phosphoproteomic analysis of gastric cancer has been conducted to compare tumor and para‐tumor tissues [ref. 20, ref. 21], few studies have revealed kinase activity profiles in gastric tumors from patients with lymph node metastasis.
Here, we applied proteomic analysis to compare primary tumor tissues from GAC patients with or without LNM, and we captured unique molecular features of GAC patients with LNM. Analysis of the phosphoproteome provided a snapshot of abnormal phosphorylation signaling pathways and abnormal kinases activities. Furthermore, we found that TNXB and SPON1, two ECM proteins, are associated with LNM in GAC patients and play important roles in cancer cell migration. Thus, our study suggests a number of proteins and kinases that has the potential to serve as prognosis markers to predict patient outcome.
Materials and methods
Human samples
A total of 23 tumor and 22 para‐tumor frozen tissues from gastric adenocarcinoma (GAC) patients were collected from Shanghai Tenth People’s Hospital. Except for one additional tumor tissue sample, each pair of tumor and para‐tumor tissues came from the same patient. All 45 tissue samples were analyzed using tandem mass tag (TMT)‐based quantitative proteomics and phosphoproteomics. T test (P value) and chi‐square test (P value*) are used to examine the clinical information, making sure that factors such as age and gender does not show statistical significance between tumor groups. The study conformed to the standards set by the Declaration of Helsinki and was approved by the Medical Ethics Committee of Shanghai Tenth People’s Hospital (license number SHDSYY‐2020‐3645). The tissues used in the experiment were sampled from the surgically resected specimens from the patients, which would not cause additional pain and injury to the patients. Before the operation, each patient signed an informed consent form, informing them that the resected specimens will be used for pathological examination and related medical research.
TMT‐based proteomics analysis of tumor tissues
Frozen tissues were lysed in urea buffer (8 m urea, 50 mm Tris–HCl, pH = 8.0) containing 1% V/V protease and phosphatase inhibitor cocktail (Cat. #78440; Thermo Scientific, Waltham, MA, USA), using a tissue homogenizer (Cat. #JXFSTPRP‐24/32; Jingxin, Ningbo, China) with two porcelain beads per sample. Tissues were homogenized for 8 min (70 Hz, running time 30 s, stop time 10 s), followed by sonication for 10 min and centrifugation at 16 000 g for 10 min at 4 °C. The supernatant protein concentration was quantified by BCA (Cat. #23225; Thermo Fisher Scientific), then 150 μg proteins were reacted with 10 mm DTT at 55 °C for 30 min and alkylated with 15 mm iodoacetamide under dark for 20 min, followed by the overnight treatment of six times the volume of acetone for protein precipitation. Afterward, the buffer was exchanged to 100 mm Triethylammonium bicarbonate (TEAB, Cat. #140023; Sigma‐Aldrich, St. Louis, MO, USA), proteins were digested with trypsin at 37 °C for 12 h, and 1/10 of each sample was combined as an internal standard. The resulting peptides were labeled with 10‐plex tandem mass tag (TMT) reagent (Cat. #90110; Thermo Scientific) according to the manufacturer’s instruction. After labeling for 1 h, 1% hydroxylamine was added to terminate the reaction. The labeled peptide samples in each batch of TMT labeling were then mixed, and 8% of each batch was used for quantitative proteomic analysis. Basic reversed‐phase (bRP) Kit (Cat. #84868; Thermo Fisher Scientific) was used for offline separation according to manufacturer’s instructions. The LC‐MS/MS analysis methods were the same as previously described [ref. 22].
Enrichment of phosphorylated peptides
The remaining 92% of the TMT‐labeled peptide samples from each batch were separated by HPLC as previously described [ref. 20]. The sample was resuspended using basic reversed‐phase (bRP) buffer A (2% acetonitrile (ACN), 5 mm NH4COOH, pH = 10), eluted in 18–38% bRP buffer B (90% ACN, 5 mm NH4COOH, pH = 10) at a flow rate of 1 mL·min−1 for 60 min. In each minute, one fraction of the HPLC‐separated mixture was collected. After the samples were dried, the 60 fractions were resuspended with TiO2 sample buffer (80% ACN, 1% trifluoroacetic acid, 0.2 g phthalic acid·mL−1) and combined in a serpentine fashion into four fractions. TiO2 beads (Cat. #5020‐75000; GL Sciences, Tokyo, Japan) were activated with 2,5‐dihydroxybenzoic acid (DHB) buffer (80% ACN, 0.5% acetic acid, 0.02 g DHB·mL−1) for 30 min, and added into the sample to enrich phosphopeptides. The enrichment procedure was repeated once. The supernatant was then removed by centrifugation at 3500 g for 1 min, and the beads were sequentially washed with wash buffer 1 (5 mm KH2PO4, 30% ACN, 350 mm KCl), wash buffer 2 (40% ACN, 0.5% acetic acid, 0.05% TFA), and wash buffer 3 (80% ACN, 0.5% acetic acid), followed by sequential elution with 5% NH3·H2O and 10% NH3·H2O in 25% ACN. The eluent was dried and analyzed by LC‐MS/MS as described previously [ref. 22].
Activity‐based protein profiling of tumor tissues
KiNative kit (Cat. #88310; Thermo Fisher Scientific) was used for kinase enrichment. Primary tumor tissues from GAC patients with primary tumor and with LNM (n = 4) were lysed using buffer (25 mm Tris, pH = 7.6, 150 mm NaCl, 1% Tergitol NP‐40, 1% V/V protease and phosphatase inhibitor cocktail, 1 mm EDTA, 5% glycerol), followed by homogenization, sonication, and centrifugation as described above. Buffer‐exchange was performed using sepharose‐based gel filtration (Cat# 88310; Thermo Fisher Scientific), and the protein concentration was quantified by BCA. Then, 2 mg proteins were reacted with 10 mg of desthiobiotin‐ATP probe at a final concentration of 20 mm. All the experimental procedures were strictly following the manufacturer’s instructions. The LC‐MS/MS analysis was following previously described procedures [ref. 22], except that each sample was analyzed in duplicate.
Proteomic data analysis
MS/MS spectra were searched using the maxquant (version 1.4.1.2, Max Planck Institute of Biochemistry, Planegg, Germany) software with a UniportKB human database. The precursor mass tolerance was set at 15 p.p.m., trypsin was set to the protease, and two missed cleavages were allowed. The false discovery rate (FDR) was set at 1% at both the peptide and protein level. For quantification, TMT 10‐plex (+229.1629 Da) on lysine and N terminus were added as static modifications. Serine, threonine, or tyrosine phosphorylation (+79.9663 Da) was set as variable modification, while oxidation of methionine (+15.9949 Da) and carbamidomethylation of cysteine (+57.0215 Da) were set as static modifications. For analysis of peptides modified by the KiNative probe, desthiobiotin on lysine residue (+196.121 Da) was set as variable modification.
The intensity of proteins or phosphorylation sites was first normalized by upper‐quantile, and then the samples were corrected by the internal standard within each TMT batch to remove batch effect. For differential expression analysis, proteins or phosphorylation sites with more than 50% missing values were removed. The expression of proteins or phosphorylation sites was tested for normality across all samples, then t‐test was applied for those with normal distribution, while Wilcoxon test was performed for those failed to pass normality test. In addition, differential expression analysis of phosphorylation sites was normalized to the expression of its proteins. r version 4.1.1 was used for most of statistical analyses.
For KiNative experiments, desthiobiotin‐modified lysine residues of kinases should cover lysine residues of kinase‐ATP binding site in Uniprot (https://www.uniprot.org/), including Lys1‐ATP binding site and Lys2‐active site [ref. 23]. After upper‐quantile normalization for all samples, the average intensity of desthiobiotin sites in two technical replicates was taken, and then the abnormal activity of kinases was analyzed by t‐test.
Transcriptome data analysis
limma package (version 3.48.3) [ref. 24] in r was performed for differential gene expression analysis comparing patients with primary tumor (T1‐4N0M0) and patients with LNM (T1‐4N1‐3M0). Data were downloaded from The Cancer Genome Atlas (TCGA) gastric adenocarcinoma datasets (Dataset ID: TCGA.STAD.sampleMap/HiSeqV2), TCGA breast cancer datasets (Dataset ID: TCGA.BRCA.sampleMap/HiSeqV2), TCGA colon cancer datasets (Dataset ID: TCGA.COAD.sampleMap/HiSeqV2), TCGA bladder cancer datasets (Dataset ID: TCGA.BLCA.sampleMap/HiSeqV2), TCGA cervical cancer datasets (Dataset ID: TCGA.CESC.sampleMap/HiSeqV2), TCGA thyroid cancer datasets (Dataset ID: TCGA.THCA.sampleMap/HiSeqV2). The age of the patients was between 40 and 90 years old.
GO and KEGG enrichment
Gene Ontology (GO) and Kyoto Encyclopedia of Genes and Genomes [ref. 25] enrichment analyses were performed using metascape (https://metascape.org/), David bioinformatics resource v6.8 (https://david.ncifcrf.gov/), and the package clusterprofiler [ref. 26] for r.
Protein–protein interaction and hub genes analysis
Analysis of protein–protein interaction network was performed using string (https://string‐db.org), with the minimum interaction score set to high confidence (0.7), and exported and constructed using cytoscape v3.9.0 (http://cytoscape.org).
Analysis of hub genes was performed using cytohubba (http://hub.iis.sinica.edu.tw/ciyohubba). Top 10 hub genes were calculated by the maximal clique centrality (MCC) method.
Mfuzz cluster analysis
mfuzz package [ref. 27] in r was applied to cluster proteins into six clusters based on samples from different stages of gastric cancer. Soft clustering was achieved by using the fuzzy c‐means algorithm. The membership value of a gene was between 0 and 1, indicating the degree of membership of the protein in a cluster.
Survival analysis
For Kaplan–Meier survival analysis, log‐rank test was applied to analyze differences in survival time [ref. 28]. The impact of gene expression on survival time was evaluated by the Cox proportional hazard model. Samples were stratified according to gene expression: samples with gene expression higher than 50% were considered as the high‐expression cohort, while samples with gene expression lower than 50% were considered as the low‐expression cohort. For survival analysis using TNXB and SPON1 as a panel, we used the intersection of the high‐expression cohort samples of the two genes as the new high‐expression cohort, and the intersection of the low‐expression cohort samples of the two genes as the new low‐expression cohort. The analysis was performed using r (4.1.1); TCGA stomach adenocarcinoma RNAseq dataset (Dataset ID: TCGA.STAD.sampleMap/HiSeqV2) and clinical information were downloaded from the UCSC genome browser (https://xenabrowser.net/).
Kinase activity prediction and visualization of Kinome tree
Kinase activity was predicted using KSEA [ref. 29], kinase‐substrate dataset was selected as “PhosphoSitePlus + NetworKIN,” while “NetworKIN score cutoff” was set as 2.5, “P‐value cutoff” was 0.05, and “substrate count cutoff” was 5. GPS5.0 (http://gps.biocuckoo.cn/) was used to verify downstream substrates of kinases, sequences of proteins were in FASTA format, and the threshold was set as “medium.” Kinome tree was conducted using kinmapbeta (http://www.kinhub.org/kinmap/).
Western blot
Frozen tissues were lysed by RIPA lysis buffer (150 mm NaCl, 0.5% SDC, 0.1% SDS, 50 mm Tris–HCl, pH = 7.6, 1.0% Triton X‐100, 1% V/V protease, and phosphatase inhibitor cocktail), followed by homogenized, sonication, and centrifugation as described above. The protein supernatant was added into 1 × Loading buffer and heated at 95 °C for 30 min. Subsequently, western blot was performed to protein expression as previously reported [ref. 22]. imagej and graphpad prism 8.0 (GraphPad Software Inc., San Diego, CA, USA) were applied to analyze the quantitative results with two‐tailed unpaired Student’s t‐test. The antibodies used were anti‐TNXB (1 : 500, Cat. #13595‐1‐AP; Proteintech, Wuhan, China), anti‐SPON1 (1 : 200, Cat. #Bs‐7520R; Bioss, Woburn, MA, USA), anti‐ACTB/β‐actin (1 : 5000, Cat. #30101‐ES10; Yeasen, China), anti‐mouse IgG (H + L) (1 : 10 000, Cat. #33219ES60; Yeasen, Shanghai, China), and anti‐rabbit (1 : 10 000, Cat. #33119ES60; Yeasen).
Wound‐healing assay
Human gastric cancer cell lines BGC‐823 (RRID: CVCL_3360), SGC‐7901 (RRID: CVCL_VU58), HGC27 (RRID: CVCL_XB28), and MGC803 (RRID: CVCL_5334) were obtained from the cell bank of the School of Life Sciences, East China Normal University. Before the experiment, cell lines were authenticated by morphology evidence to avoid misrepresentation. All experiments were performed with mycoplasma‐free cells.
Cells were cultured in six‐well plates. A wound in the center of the well was introduced with a pipette tip when the cells were confluent. The culture medium was replaced with fresh RPMI 1640 medium without fetal bovine serum (FBS). The cells in the treatment group were treated with 0.1% TNXB antibody (Cat. #13595‐1‐AP; Proteintech), while the cells in control group were treated with sterilized ddH2O. Microscopic images were taken at the time point of 0 and 24 h.
Trans‐well migration assay
The 4 × 10⁵ cells in 200 μL RPMI 1640 medium without FBS were plated onto the upper layer of the trans‐well chamber (Cat. #3422; Corning, Tewksbury, MA, USA), while the lower layer contains 600 μL of the same culture medium with 20% of FBS. A 0.1% TNXB antibody (Cat. #13595‐1‐AP; Proteintech) was added to treatment group, while sterilized ddH2O was added to the control group. After 24 h, the cells were fixed with 4% paraformaldehyde for 20 min and then stained with crystal violet for 15 min. The unmigrated cells in the upper layer of the chamber were carefully wiped out with a cotton swab. Each chamber was imaged using an inverted microscope.
Cell viability assay
The 2 × 10³ cells in 100 μL RPMI 1640 medium with 10% FBS were added to each well of the 96‐well plate, and 10 μL of CCK‐8 reagent (Cat. #40203ES76; Yeasen) in 90 μL of RPMI 1640 medium was used to react with the cells. After 2 h, the cells were measured at a wavelength of 450 nm.
Immunohistochemistry
Immunohistochemistry was performed by IHC kit (DAB, rabbit, Cat#: ENS004; NeoBioscience, Shenzhen, China). Formalin‐fixed paraffin‐embedding tissues were dewaxed with xylene twice, xylene : ethanol = 1 : 1, 100%, 95%, 85%, 75%, and 50% ethanol for 3 min, respectively, following heat‐induced antigen retrieval in 100 °C EDTA for 20 min. Then, the tissue sections were immersed in 3% H2O2‐methanol solution for 10 min and washed with PBS. The solution was replaced with blocking buffer and incubated for 10 min, and then primary antibody was added and incubated for 1 h (anti‐TNXB, 1 : 50, Cat. #13595‐1‐AP; Proteintech; anti‐SPON1, 1 : 30, Cat. #TA351750; Origene, Rockville, MD, USA). After washing with PBS three times, horse radish peroxidase (HRP)‐conjugated anti‐rabbit secondary antibody (NeoBioscience) was added to the tissue and incubated for 10 min. After washing with PBS three times, HRP substrate solution was added and incubated for 10 min, followed by staining with DAB solution. Hematoxylin was used to stain nucleus for 5 min, then decolorized with hydrochloric acid, followed by dehydration by a series of 3‐min incubation using 50%, 75%, 85%, 95%, 100% ethanol, 50% xylene–ethanol solution, and finally xylene incubation twice, respectively. The tissue sections were then mounted and sealed on glass slides and examined under a microscope, with all images captured with identical camera exposure condition.
Results
Quantitative proteomic comparison of GAC tissues between patients with and without lymph node metastasis
We systematically explored the proteomic and phosphoproteomic profiles of GAC primary tumor and para‐tumor tissues comparing patients with and without lymph node metastasis (LNM). We collected 45 frozen tissue samples from 23 GAC patients, with pairs of primary tumor and para‐tumor tissues from each of the 22 patients, plus one tumor tissue from an additional patient. Based on the clinical information (Table 1; Table S1), 11 patients were diagnosed as primary tumor (designated “no LNM” thereafter) and 12 patients were diagnosed as advanced tumor with lymph node metastasis (designated “LNM” thereafter). The flow chart of the experiment is illustrated in Fig. S1.
Table 1: Clinical information
| Characteristics | Tumor | Para‐tumor | Tumor, P value | |||
|---|---|---|---|---|---|---|
| No LNM | LNM | No LNM | LNM | |||
| Total cases | 11 | 12 | 11 | 11 | ||
| Age (years) | Mean ± SD | 66 ± 8.70 | 65 ± 11.35 | 66 ± 8.70 | 66 ± 8.20 | 0.7295 |
| Range | 49–85 | 53–81 | 49–85 | 53–81 | ||
| Sex | Male | 9 (81.8%) | 10 (83.3%) | 9 (81.8%) | 9 (81.8%) | 0.9336 |
| Female | 2 (18.2%) | 2 (16.7%) | 2 (18.2%) | 2 (18.2%) | ||
| Stage | I | 5 (45.5%) | 0 | 5 (45.5%) | 0 | 0.00006* |
| II | 6 (54.5%) | 1 (8.3%) | 6 (54.5%) | 1 (9.09%) | ||
| III | 0 | 11 (91.7%) | 0 | 10 (90.9%) | ||
| IV | 0 | 0 | 0 | 0 | ||
| T | 1 | 4 (36.4%) | 0 | 4 (36.4%) | 0 | 0.1415* |
| 2 | 1 (9.09%) | 1 (8.3%) | 1 (9.09%) | 1 (9.09%) | ||
| 3 | 4 (36.4%) | 7 (58.3%) | 4 (36.4%) | 6 (54.5%) | ||
| 4 | 2 (18.2%) | 4 (33.3%) | 2 (18.2%) | 4 (36.4%) | ||
| X | 0 | 0 | 0 | 0 | ||
| N | 0 | 11 (100%) | 0 | 11 (100%) | 0 | 0.00004* |
| 1 | 0 | 1 (8.3%) | 0 | 1 (9.09%) | ||
| 2 | 0 | 5 (41.7%) | 0 | 5 (45.5%) | ||
| 3 | 0 | 6 (50%) | 0 | 5 (45.5%) | ||
| X | 0 | 0 | 0 | 0 | ||
| M | 0 | 11 (100%) | 12 (100%) | 11 (100%) | 11 (100%) | — |
| 1 | 0 | 0 | 0 | 0 | ||
* indicates Chi‐square test, otherwise: student’s t‐test.
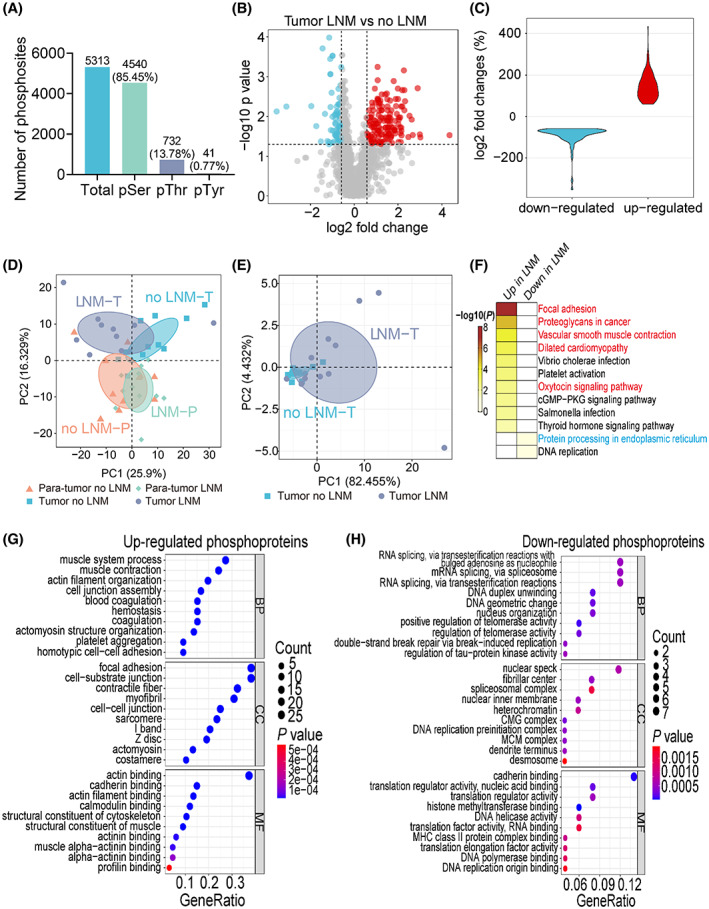
We applied high‐resolution quantitative mass spectrometry based on tandem mass tag (TMT) labeling for proteome and phosphoproteome measurements (Fig. S1, Table S1). In each of the five batches of labeling, we used the last channel as the internal standard (IS) to account for batch effects. The accuracy of the measurement is demonstrated by high correlation of the protein expression among the IS channels (Fig. S2A). The dynamic range of the signal intensity spans at least six orders of magnitude (Fig. S2B). In total, we quantified 5536 proteins from the 45 samples (Fig. S2C, Table S1). We normalized the data first by upper‐quantile intensity of each sample and then by the internal standard of each batch, resulting in a significant reduction of signal fluctuation among samples (Fig. S2D–F). Quantitative analysis revealed that there were 218 and 49 proteins significantly up‐ and downregulated in the LNM samples comparing to no LNM samples (Fig. 1A; Table S2). The overall fold change of differentially expressed proteins (DEPs) in tumor tissues was displayed in a violin diagram (Fig. 1B).
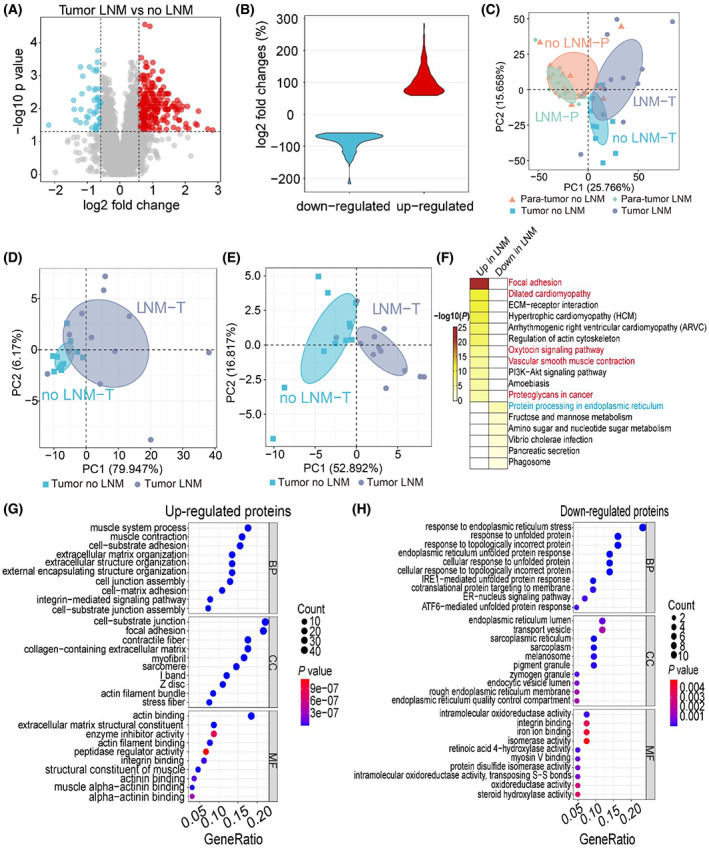
After correction for batch effects, principal component analysis (PCA) using the expression levels of all proteins separated the four types of samples relatively well (Fig. 1C), with the first component explaining nearly 25.8% of the variation, while the second component explaining 15.7%. That the first component separates tumor from para‐tumor indicated that the differences in protein expression in primary tumors between patients with and without LNM were less than that between tumor and para‐tumor tissues. Further PCA analyses of the proteome data were performed based on increased (Fig. 1D) and decreased (Fig. 1E) proteins, respectively, and the results showed that the DEPs distinguished tumor samples with better power. KEGG pathway analysis of the DEPs indicated that the increased proteins mainly contributed to focal adhesion, ECM–receptor interaction, and PI3K‐Akt signaling, while the decreased proteins involved in protein processing in endoplasmic reticulum, fructose, and mannose metabolism (Fig. 1F; Table S2). Consistent with gene ontology analysis, upregulated proteins mainly involved in cell–substrate adhesion and extracellular matrix organization (Fig. 1G; Table S2). In contrast, downregulated proteins mainly contributed to endoplasmic reticulum stress response and unfolded protein response (Fig. 1H).
Identification of biomarkers for GAC prognosis using c‐means clustering and hub protein analysis
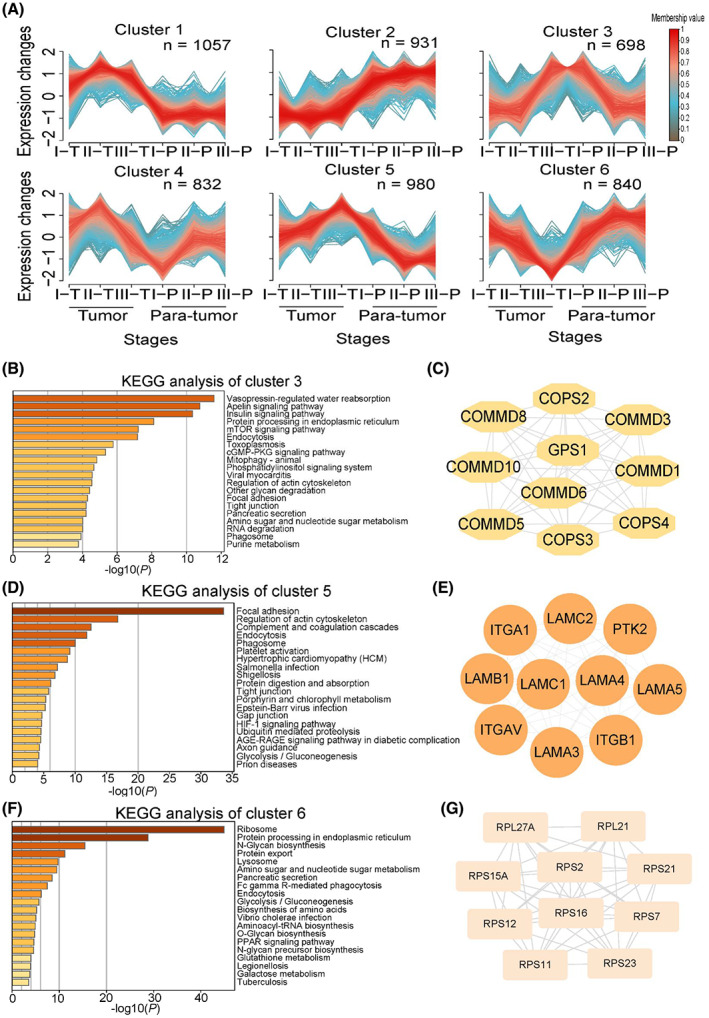
We then applied fuzzy c‐means clustering (m‐fuzz) to capture the dynamic protein expression among different stages of GAC, simultaneously considering both tumor and para‐tumor tissues. The analysis resulted in six distinct clusters of temporal expression patterns (Fig. 2A; Table S2). We focused on clusters that showed a trend of change among the three tumor stages. Clusters 3, 5, and 6 fit into this criterion. KEGG analysis of the 698 proteins in cluster 3 revealed that apelin signaling, insulin signaling, and mTOR signaling pathways are enriched (Fig. 2B), and the top 10 hub proteins in this cluster included GPS1, COPS2, and COMMD10 (Fig. 2C). On the other hand, focal adhesion and regulation of actin cytoskeleton are enriched among the 980 proteins in cluster 5 (Fig. 2D), the top 10 hub proteins in this cluster included ITGB1, ITGAV, PTK2 (FAK), and LAMA4 (Fig. 2E). For cluster 6, ribosome, protein processing in endoplasmic reticulum and N‐Glycan biosynthesis are enriched (Fig. 2F), the top 10 proteins included RPS2, RPS7, and RPS11 (Fig. 2G). Many of the hub proteins in these clusters have been shown to play a role in gastric cancer progression, including ITGB1, LAMA4, ITGAV, COMMD10, and LAMC1, and their expression at different GAC stages and Kaplan–Meier survival analysis related to each protein were shown in Fig. S3.
TNXB and SPON1 are biomarkers for lymph node metastasis in gastric adenocarcinoma
We used heatmap to display the top 50 most significantly changed proteins out of the 267 differentially expressed proteins (DEPs) in primary GAC tissues from patients with LNM (Fig. 3A). Comparing to the Plasma Proteome Database (PPD), we found that 216 proteins have been detected in plasma or serum previously, including 187 up‐ and 39 downregulated proteins. We plotted these differentially expressed plasma proteins in another heatmap (Fig. S4; Table S2), and they may serve as valuable resources for future biomarker studies. We then used the String database (https://string‐db.org/) to explore the protein–protein interaction of the 218 upregulated proteins with high confidence score of 0.7, and we used cytohubba to calculate the top 30 ranked proteins by means of maximal clique centrality (MCC). cytoscape was applied to construct the interaction network of the 30 proteins (Fig. 3B). A number of proteins have been reported to play important roles in gastric cancer metastasis, such as ITGB1, ITGAV, and LAMA4 [ref. 30, ref. 31, ref. 32, ref. 33, ref. 34, ref. 35]. To seek further evidence, we explored the upregulated proteins at the transcription level, utilizing TCGA stomach adenocarcinoma datasets (Dataset ID: TCGA.STAD.sampleMap/HiSeqV2) to analyze the differentially expressed genes (DEGs) in primary tumor tissues between patients with and without LNM. Interestingly, Spondin‐1 (SPON1) and Tenascin‐X (TNXB), two proteins that have not been associated with gastric cancer before, showed significant upregulation (Fig. 3C), consistent with our proteomic findings. Correlation analysis showed that the expression of TNXB significantly correlated with that of SPON1 at both protein and mRNA levels (Fig. 3D,E). The correlation was further verified in TIMER2.0 and GEPIA databases (Fig. S5A,B).
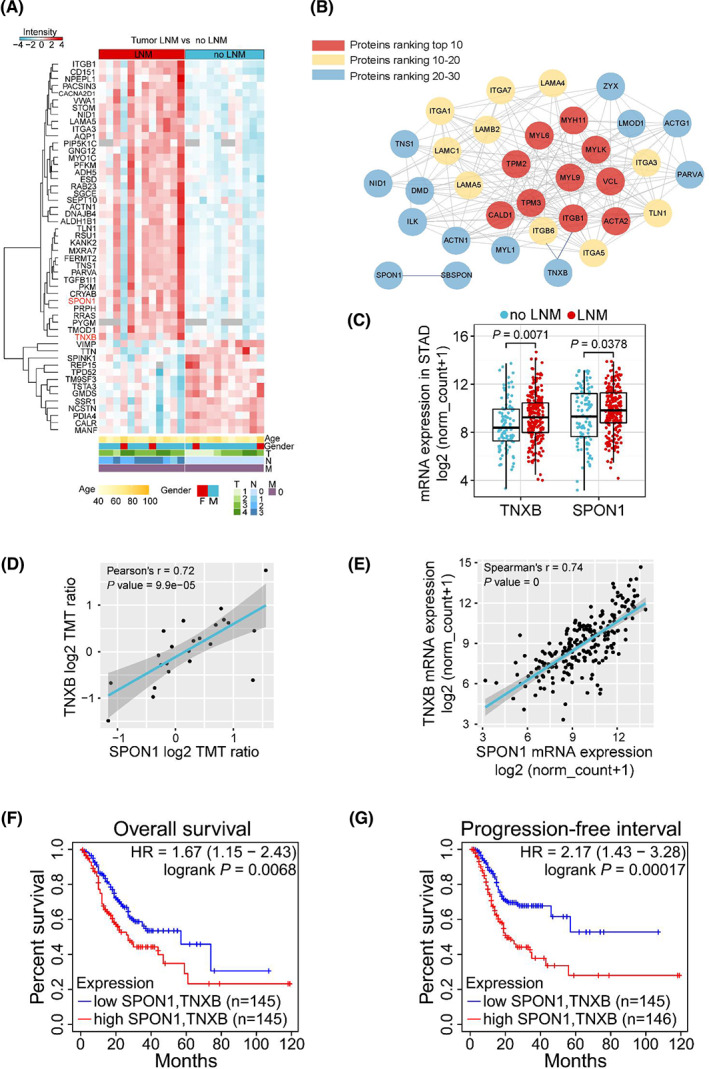
We then performed survival analysis to explore the correlation between TNXB or SPON1 expression and the survival of GAC patients. High expression of SPON1 showed significant correlation with poor overall survival (OS) and progression‐free interval (PFI) (Fig. S5C,D). Similarly, high expression of TNXB showed significant correlation with poor OS and PFI (Fig. S5E,F). Furthermore, when combining SPON1 and TNXB for a multivariate survival analysis, the OS and PFI showed better distinction and more statistical significance, with a lower P value and higher hazard ratio (Fig. 3F,G).
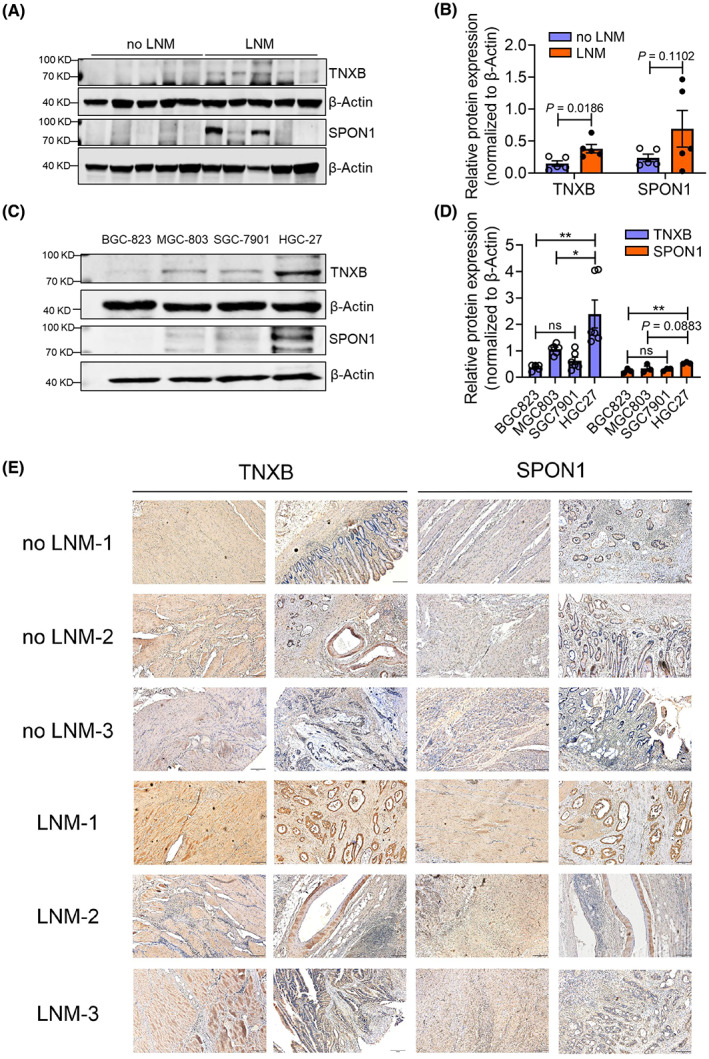
To seek experimental evidence, we applied western blot analysis and confirmed higher expression of TNXB and SPON1 in GAC tumor tissues from patients with LNM (Fig. 4A,B). In addition, both proteins showed much higher expression in a highly aggressive, LNM GC cell line HGC‐27, than other two nonmetastatic GC cell lines BGC‐823 and MGC‐803, while another LNM GC cell line SGC‐7901 showed mild expression (Fig. 4C,D). Furthermore, we performed immunohistochemistry analysis (IHC) to examine the expression of TNXB and SPON1 in formalin‐fixed paraffin‐embedding (FFPE) primary tumor samples, and we found that there was overall stronger staining of TNXB and SPON1 in GAC tumor tissues from patients with LNM than from patients without LNM (Fig. 4E). Together, we confirmed that TNXB and SPON1 were upregulated in GAC tumor tissues from patients with LNM, thus substantiated our proteomic data.
We further explored the mRNA expression of TNXB and SPON1 in other types of cancer from TCGA, similarly comparing the differences in primary tumor samples from patients with or without LNM. The analysis showed that TNXB was upregulated in patients with bladder cancer (BLCA), cervical cancer (CESC), colon cancer (COAD), and breast cancer (BRCA) (Fig. S6A), while SPON1 was upregulated in patients with LNM in thyroid cancer (THCA) and bladder cancer (Fig. S6B). Thus, it is compelling to speculate that these proteins have the potential to serve as pan‐cancer markers for tumor spreading and metastasis.
TNXB promotes the migration of gastric cancer cells
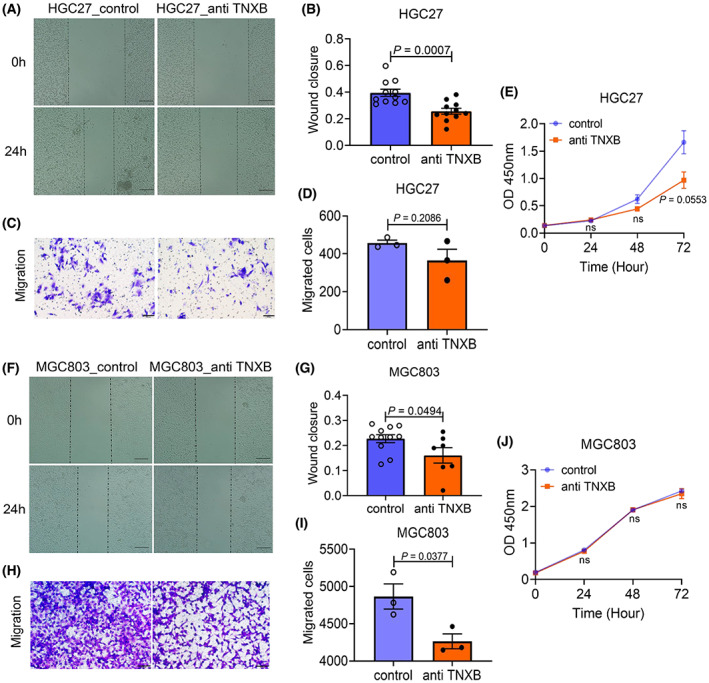
We selected two gastric cancer cell lines HGC27 and MGC803 in which TNXB was highly expressed to explore the function of TNXB in cell migration. In HGC‐27 cells, wound‐healing assay showed that TNXB antibody significantly reduced wound closure at 24 h (Fig. 5A,B). Although trans‐well assay failed to show statistical significance between cells with or without anti‐TNXB antibody treatment (P = 0.2086), there appeared to be a trend of reduced migration in cells after TNXB antibody treatment (Fig. 5C,D). TNXB antibody had minimal effect on cell proliferation at 24 or 48 h, although at 72 h, it significantly reduced proliferation (Fig. 5E). Similarly, in MGC‐803 cells, wound‐healing and trans‐well experiments also showed that TNXB antibody significantly reduced cell migration in both assays (Fig. 5F–I) without affecting cell proliferation (Fig. 5J). These results suggest that TNXB may promote tumor cell migration.
Protein–protein interaction analysis suggested that TNXB interacts with ITGB1 and ITGB6 (Fig. 3B). Increased expression of ITGB1 promotes invasion and migration of gastric cancer cells and is associated with poor prognosis and recurrence of GAC patients [ref. 36]. We went on to explore the correlation of expression between TNXB and ITGB1 and found that they show good correlation at both protein level (Fig. S7A) and mRNA level (Fig. S7B), a finding independently verified in two more databases GEPIA (Fig. S7C) and TIMER2.0 (Fig. S7D). These results suggest that TNXB promotes gastric adenocarcinoma progression potentially through interacting with ITGB1.
Relationship between TNXB, SPON1, and tumor immune microenvironment
Immune microenvironment plays an essential role in tumor occurrence and progression, with particularly important players are infiltrating immune cells including CD8+ and CD4+ T cells, macrophages, neutrophils, and dendritic cells. Therefore, we investigated the relationship between TNXB, SPON1, and immune cells in GAC using TIMER2.0. Expression of TNXB and SPON1 highly correlated with infiltrating macrophages and weakly correlated with neutrophils and myeloid dendritic cells (Fig. S8A). In addition, TNXB and SPON1 also displayed some correlation with CD4+ T cells, weak correlation with CD8+ T cells, and no correlation with B cells (Fig. S8B). These analyses suggested that TNXB and SPON1 may play important roles in tumor infiltrating immune cells, particularly macrophages, in gastric cancer.
In addition, we also analyzed the immune cell marker genes identified in our study. Nine differentially expressed proteins in primary GAC tissues from patients with LNM have been reported to be enriched in 24 types of immune cells [ref. 37]. Seven proteins showed significant upregulation, including THBS4, CMA1, CTSG, LDB3, KANK2, PDLIM4, and ALDH1B1. Two proteins including SULT1C2 and HPGD showed significant downregulation. TNXB showed significant positive correlation with THBS4, CMA1, LDB3, KANK2, PDLIM4, and ALDH1B1, while SPON1 showed significant positive correlation with all seven upregulated proteins. Thus, it appears that TNXB and SPON1 displayed certain degree of correlation with the tumor immune microenvironment (Fig. S8C).
Phosphoproteomic comparison of GAC tissues between patients with and without lymph node metastasis
Phosphoproteomic analysis of primary tumor and para‐tumor tissues identified 5313 phosphorylation sites, including 4520 serine (85.45%), 732 threonine (13.78%), and 41 tyrosine (0.77%) sites (Fig. 6A). Comparing to patients with only primary tumor, patients with LNM showed 118 upregulated and 78 downregulated phosphorylation sites (Fig. 6B; Table S3). The fold changes of differentially expressed phosphorylation sites were revealed by a violin diagram (Fig. 6C). PCA analysis revealed reasonable separation of tumor samples but not the para‐tumor tissue samples (Fig. 6D). Using upregulated phosphorylation sites, PCA showed better separation at the first component (Fig. 6E). KEGG pathway enrichment analysis for the differentially phosphorylated proteins revealed that they were mainly enriched in focal adhesion and proteoglycans in cancer (up), and protein processing in endoplasmic reticulum (down) (Fig. 6F, Table S3). GO functional enrichment analysis revealed that proteins with upregulated phosphorylation sites mainly involved in focal adhesion and acting binding, while proteins with downregulated phosphorylation sites mainly involved in RNA splicing (Fig. 6G,H; Table S3).
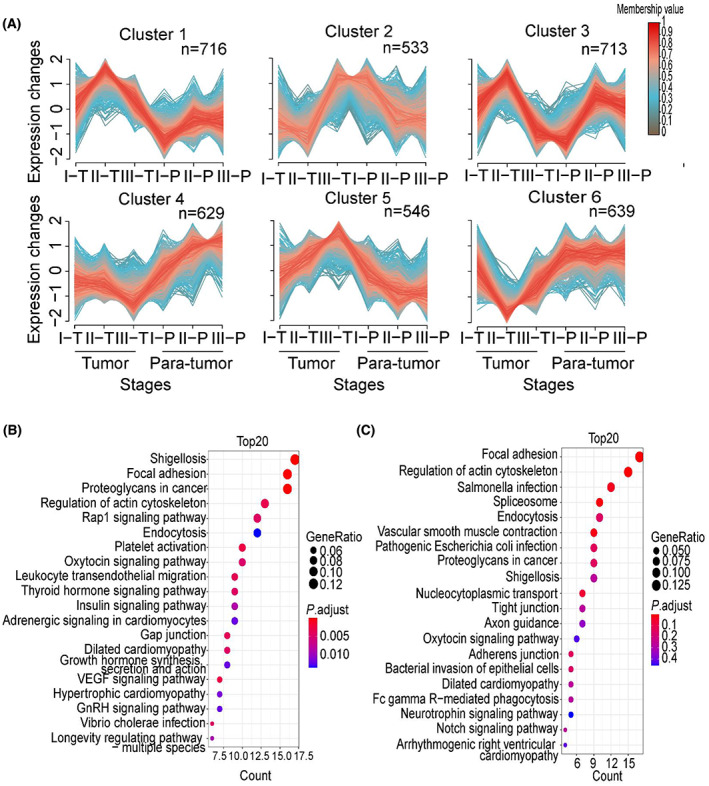
M‐fuzz analysis revealed a distinct expression pattern of six clusters (Fig. 7A; Table S3). Among these clusters, 533 phosphorylation sites corresponding to 313 phosphoproteins in cluster 2 showed a trend similar to cluster 3 in the proteome. KEGG pathway analysis also showed that these proteins mainly involved in focal adhesion, proteoglycans in cancer, and Rap1 signaling pathway (Fig. 7B). In addition, 546 phosphorylation sites corresponding to 320 phosphoproteins in cluster 5 exhibited a trend of increase in stages I–III tumor samples and decrease in the para‐tumor samples, which is similar to cluster 5 in the proteome. KEGG pathway enrichment further showed that most proteins contributed to focal adhesion, regulation of actin cytoskeleton pathways (Fig. 7C).
Abnormal activity of kinases in GAC primary tumor from patients with lymph node metastasis
Protein kinases are important targets for small molecule inhibitor drug development. Thirteen kinases differentially expressed at the protein level in GAC tumor tissues with lymph node metastasis were plotted in a heatmap, including known drug targets JAK1, MAP3K4, and PRKCB, among others (Fig. 8A). We used KSEA [ref. 29] to predict the upstream activity of kinases that might contribute to the altered phosphorylation events, based on two databases PhosphoSitePlus and NetworKIN. Twelve kinases, including GSK3A, GSK3B, and MAK, were predicted to display significantly increased activity. On the other hand, three kinases were predicted to display significantly decreased activity, including CLK1, a previously reported therapeutic target in gastric cancer [ref. 38] (P < 0.05, Fig. 8B; Table S4).
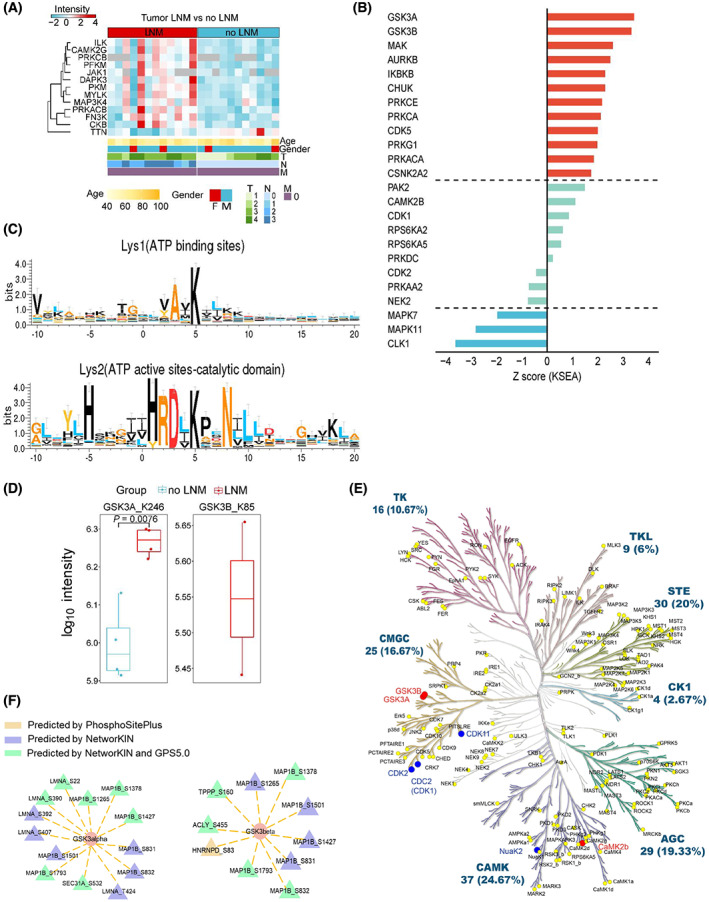
We then conducted activity‐based protein profiling (ABPP) experiment to quantitatively capture kinases that are able to bind ATP, which are activated kinases [ref. 39]. Primary tumor tissues from four patients with LNM and four patients without LNM were used for the analysis. According to Uniport (https://www.uniprot.org/), ATP‐binding lysine residues inside the kinase activity pocket were annotated as either ATP‐binding site (Lys1) or active site (Lys2). Motif analysis of the ABPP probe‐modified lysine residues revealed that the −2 position of Lys1 was alanine, while the −2 position of Lys2 was aspartic acid (Fig. 8C; Table S4), consistent with a previous report [ref. 39]. When comparing kinase activity between patients with or without LNM, we found that the active site of GSK3A (K246) displayed a higher ATP‐binding ability in tumor samples from patient with LNM, consistent with the predicted results from KSEA. This suggests that GSK3A may be overactivated in tumors from patients with LNM (Fig. 8D). GSK3B (K85) was identified in two tumor samples from patients with LNM, suggesting its overactivation, which is in contrast to a prior study [ref. 40].
Kinome tree showed kinases with abnormal activity in GAC patients with LNM that were validated by ABPP (Fig. 8E). The kinase–substrate relationship was constructed using KSEA based on NetworKIN and PhosphoSitePlus (Table S4), which was further verified by GPS5.0 (http://gps.biocuckoo.cn/) using a medium threshold. The phosphorylation substrates that were validated in both GPS5.0 and NetworKIN were presented as green triangles, which were predicted to be the downstream phosphorylation substrates of the respective kinase indicated by orange ovals (Fig. 8F).
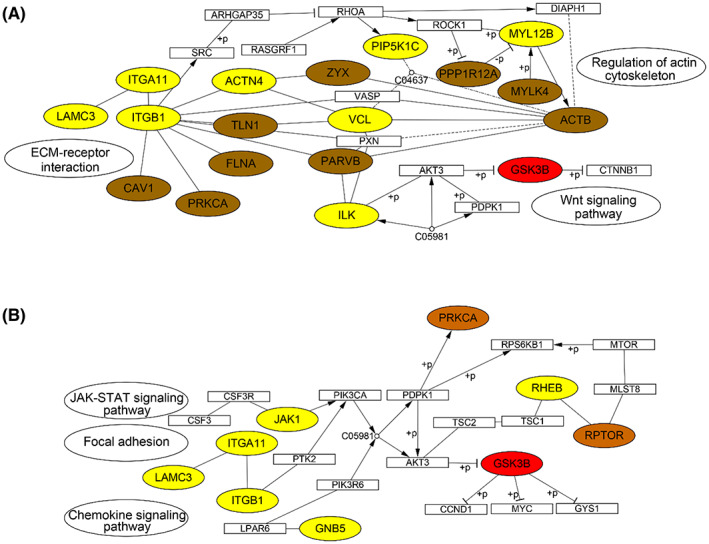
To reveal the molecular events underlying lymph node metastasis of GAC tumor, we utilized KEGG pathway analysis and mapped the upregulated proteins (yellow), phosphoproteins (orange), and kinases with abnormal activity (red) (Fig. 9). Consistent with alterations in the proteome, the reconstructed pathways revealed that focal adhesion and PI3K–AKT pathways were abnormally activated in GAC tumor tissues with LNM. The ECM proteins and integrins were also upregulated, involving integrin receptor binding to ECM proteins and leading to dimerization of focal adhesion kinase (FAK), which in turn led to autophosphorylation of FAK at Y397. The binding of SRC family kinases to the phosphorylation site of FAK forms the activated FAK–SRC complex [ref. 41]. FAK serves an important target for cancer progression, while FAK inhibitors have been under preclinical trial in combinatorial therapy [ref. 42]. Our study also found a number of activated signaling nodes in PI3K–AKT pathway. PI3K–AKT–mTOR pathway plays a significant role in progression of various cancers such as gastric cancer [ref. 43] and breast cancer [ref. 44]. Abnormal activation of PI3K–AKT–mTOR promotes cell survival by inhibiting apoptosis and also plays a role promoting metastasis [ref. 43].
Discussion
While a few previous reports investigated the correlation between abnormal proteins or kinases and lymph node metastasis in gastric adenocarcinoma, they primarily focused on comparing tumor tissues and adjacent tissues. It is difficult to identify biomarkers that may play important roles in GAC progression if they express at similar level between tumor and para‐tumor tissues. To the best of our knowledge, this study is the first comprehensive proteomic and phosphoproteomic comparison of GAC tumor tissues between patient with or without lymph node metastasis. Through analysis of upregulated proteins in tumor tissues from patients carrying LNM, we found that focal adhesion and ECM proteins are the most significantly enriched biological pathways, which faithfully captured the initial step of GAC tumor spreading and metastasis. Our further analysis identified overexpression of TNXB and SPON1 in GAC patients with LNM. Although these two proteins have been reported in other cancer types, but this study is the first to describe their abnormal expression in GAC tumors with LNM. Experimental validation and functional studies indicate that TNXB may be involved in gastric cancer cell migration and spreading. Finally, phosphoproteomic analysis combined with activity‐based kinase profiling identified abnormal activation of GSK3 in primary tumor tissues from GAC patients with LNM. Together, these results provide a valuable resource for a deeper understanding of molecular events dictating GAC tumor spreading and metastasis.
A number of proteins whose abnormal expression are consistent with previous reports. For example, we found that AQP1 was upregulated in tumors from patients with LNM, and the upregulation of AQP proteins has been reported to associate with lymph node metastasis, recurrence, and low overall survival rate in multiple cancers [ref. 45]. We also found overexpression of integrin family members including ITGB1 and ITGAV, which is associated with poor overall survival of gastric cancer patients. Both ITGB1 and ITGAV play important roles promoting the invasion and migration of gastric cancer cells in vitro and are associated with poor prognostic outcomes [ref. 30, ref. 31]. Furthermore, overexpression of LAMA4 significantly impairs proliferation, invasion, and migration of ovarian, breast, and hepatocellular cancer cells [ref. 32, ref. 33, ref. 34]. We found that LAMA4 was increased during the progression of gastric adenocarcinoma, and its overexpression significantly correlated with poor overall survival of GAC patients, consistent with a previous report [ref. 35]. In addition, our data show for the first time that GPS1 is associated with the progression of gastric adenocarcinoma. GPS1 (also known as CSN1) is known to form a complex and play multiple roles in cellular and developmental processes including cell cycle regulation, DNA repair, and others. In hepatocellular carcinoma cells, GPS1 promotes cell proliferation and migration by upregulating the expression of cyclin A2 [ref. 46]. Thus, upregulated proteins in our proteomic data provide a rich resource for further understanding of GAC progression.
Our study found for the first time that TNXB and SPON1 are highly expressed in the primary tumor tissues of GAC patients with lymph node metastasis, and that overexpression of TNXB and SPON1 is associated with poor prognosis of GAC patients. When combining the two proteins, their power of predicting the prognosis of GAC patients was more significant. SPON1 is a cell adhesion molecule that promotes neurite extension and expresses at high levels in the floor plate [ref. 47], and has been shown to upregulate in other cancer types. SPON1 upregulation is closely related to metastasis and progression of osteosarcoma, promoting migration and invasion of osteosarcoma cells in vivo and in vitro, as well as activating FAK (PTK2) and SRC in osteosarcoma cells [ref. 48]. In addition, SPON1 is the direct target of miR‐506 via its binding to 3′‐UTR of SPON1 gene. Overexpression of miR‐506 suppressed hepatocellular carcinoma both in vitro and in vivo and reduced the accumulation of SPON1 both in hepatocellular carcinoma (HCC) cells and mouse tissues [ref. 49]. On the other hand, TNXB is an extracellular matrix (ECM) protein capable of direct interacting with a number of ECM molecules [ref. 50], playing different roles in different type of cancer. TNXB is overexpressed in malignant mesothelioma tumor tissues comparing to normal tissues, and it is also a new diagnostic marker of malignant mesothelioma [ref. 51, ref. 52]. Tenascin X (TNX) plays a role in gastric function, while TNX‐deficient mice had significantly promoted vagal afferent response to gastric distention and accelerated gastric empties [ref. 53]. Taken together, our study suggested that TNXB and SPON1 may be potential biomarkers for GAC progression.
Phosphorylation of GSK3B at S9 affects the binding of GSK3B to substrates, and resulting in inhibition of the kinase. Previous studies have shown that S9 phosphorylation promotes the growth and migration of gastric cancer cells [ref. 54, ref. 55], whereas constitutive activation of GSK3B correlated to better prognosis of gastric cancer patients [ref. 40]. In this study, we predicted kinase activity based on differential phosphorylation and experimentally verified the kinase activity using ABPP. We found that GSK3A and GSK3B are activated in GAC tumor tissues with lymph node metastasis. ABPP probes the binding of kinases with ATP at their conserved domains, which are generally the activation domain of the kinase. In the case of GSK3B, the activation residue locates at K85, and mutation of K85 reduced ATP binding of GSK3B, leading to reduced activity [ref. 56]. Our study found that GSK3B binds to ATP probe in two of four samples from tumor tissues of GAC with LNM, but not in the control group (Fig. 7D). This suggests an increased activity of GSK3B in tumor tissues from these patients. In addition, we found the upregulation of CD151 in the proteomic data, which is a known activator of GSK3B and positive regulator of β‐catenin expression, promoting osteosarcoma metastasis [ref. 57]. We postulate that GSK3B may potentially initiate this pathway to promote lymph node metastasis in gastric adenocarcinoma. On the other hand, there has been no report regarding the role of GSK3A in gastric cancer, although GSK3A was shown to promote the survival of lung cancer cells [ref. 58], and both GSK3A and GSK3B are abnormally activated in non‐type bladder cancer cells [ref. 59]. Thus, our study discovered that GSK3A and GSK3B are significantly activated in GAC primary tumor tissues from patients with lymph node metastasis, suggesting GSK3 may serve as a potential therapeutic target which warrants further validations.
The major limitation of this study is a relatively small sample size, which at present compromises the generalization of our findings in clinical settings. With dramatically improved sample size, one could perform independent and potentially multiple center validation experiments. When sample size reaches the scale of hundreds, one can also apply machine learning modeling, using TNXB, SPON1, and other differentially expressed proteins also found in plasma as biomarkers, to stratify patients between localized primary tumor and tumors with the tendency to metastasize to nearby lymph nodes. Another limitation of this study is that the exact mechanism of action of TNXB and SPON1 remains elusive. Based on the clues that both extracellular proteins interact with integrin family members, further studies could aim toward deciphering how these proteins interact with and promote integrin signaling. In perspective, further validation of potential protein biomarkers discovered in our study can identify GAC patients with higher probability of metastasis, guiding toward more aggressive treatment, and in turn dramatically improve the survival of GAC patients.
Conclusion
Our study identified molecular features for lymph node metastasis in GAC, including prognostic biomarkers TNXB and SPON1, potential kinase targets GSK3, as well as abnormal signaling pathways at the levels of protein expression and phosphorylation. In addition, we also identified prognostic markers and signaling pathways associated with progression of GAC by M‐Fuzz clustering. Overall, these results provide new targets for prognosis and potential treatment of gastric adenocarcinoma.
Conflict of interest
The authors declare no conflict of interest.
Author contributions
LL conceived the idea and directed the study. XL performed the majority of the experiments and analyzed the data. YF performed the majority of the bioinformatic and statistical analysis. XL and YF prepared the figures. YZ and TW contributed to some experimental data. AYL contributed to some data analysis and edited the manuscript. LG and DZ contributed to clinical samples. BJ contributed to clinical consultation. LL and XL wrote the manuscript.
Peer review
The peer review history for this article is available at https://publons.com/publon/10.1002/1878‐0261.13361.
Supplementary Materials
- Fig. S1. Schematic workflow of experiment design. (PDF)
- Fig. S2. Proteomic data assessment and preprocessing. (PDF)
- Fig. S3. Overall survival analysis of hub proteins. (PDF)
- Fig. S4. Heatmap of significantly DEPs in primary tumor from GAC patients in Plasma Proteome Database (PPD). (PDF)
- Fig. S5. (A) Correlation analysis of SPON1 and TNXB expression at transcriptional level in TIMER 2.0 dataset. (B) Correlation expression analysis of SPON1 and TNXB in GEPIA dataset. (C–D) Overall survival (C) and progression‐free interval (D) of GAC patients using Kaplan–Meier estimator stratified by SPON1 expression, using 50% as the expression cutoff. (E–F) Overall survival (E) and progression‐free interval (F) of GAC patients using Kaplan–Meier estimator stratified by TNXB expression, using 50% as the expression cutoff. (PDF)
- Fig. S6. (A–B) mRNA expression of TNXB (A) and SPON1 (B) in other types of cancer from TCGA database between patients with only primary tumor versus patients with LNM. (PDF)
- Fig. S7. (A–D) Correlation expression analysis of ITGB1 and TNXB at protein level (A), transcription level in TCGA dataset (B), GEPIA (C), and TIMER 2.0 (D). (PDF)
- Fig. S8. (A–B) Correlation of TNXB, SPON1 expression, and infiltrating immune cells in gastric adenocarcinoma based on ITMER 2.0 dataset, including macrophages, neutrophils, myeloid dendritic cells (A), and T cells CD4+, CD8+, B cells (B). (C) Correlation of TNXB and SPON1 with immune cell‐specific marker genes at the protein level. * P < 0.05, ** P < 0.01, *** P < 0.001, n.s. P > 0.05. (PDF)
- Table S1. Clinical information for proteomics, phosphoproteomics, and kinome. (XLSX)
- Table S2. Differential expression analysis and KEGG enrichment of proteome, related to Fig. 1 and Fig. 2. (XLSX)
- Table S3. Differential expression analysis and KEGG enrichment of phosphoproteome, related to Fig. 6 and Fig. 7. (XLSX)
- Table S4. Prediction and validation of kinase activity based on phosphorylation and activity‐based protein profiling, related to Fig. 8. (XLSX)
References
- Global cancer statistics 2020: GLOBOCAN estimates of incidence and mortality worldwide for 36 cancers in 185 countries.. CA Cancer J Clin., 2021. [PubMed]
- Gastric cancer.. Lancet., 2016. [PubMed]
- Patient symptom experience prior to a diagnosis of oesophageal or gastric cancer: a multi‐methods study.. BJGP Open., 2020
- Targeting metastatic cancer.. Nat Med., 2021. [PubMed]
- Clinical significance of lymph node metastasis in gastric cancer.. World J Gastroenterol., 2014. [PubMed]
- Analysis of 154 actual five‐year survivors of gastric cancer.. J Gastrointest Surg., 2000. [PubMed]
- Prognostic significance of the number of metastatic lymph nodes in early gastric cancer.. Dig Surg., 2003. [PubMed]
- Molecular background of the regional lymph node metastasis of gastric cancer.. Oncol Lett., 2018. [PubMed]
- Tumor microenvironment: extracellular matrix alterations influence tumor progression.. Front Oncol., 2020. [PubMed]
- The matrix revolution: matricellular proteins and restructuring of the cancer microenvironment.. Cancer Res., 2020. [PubMed]
- Matricellular proteins: priming the tumour microenvironment for cancer development and metastasis.. Br J Cancer., 2013. [PubMed]
- Properties of FDA‐approved small molecule protein kinase inhibitors: a 2022 update.. Pharmacol Res., 2022. [PubMed]
- A proteomic landscape of diffuse‐type gastric cancer.. Nat Commun., 2018. [PubMed]
- Proteogenomic characterization of human early‐onset gastric cancer.. Cancer Cell., 2019. [PubMed]
- Proteomic signatures of diffuse and intestinal subtypes of gastric cancer.. Cancer., 2021
- Quantitative global proteome and lysine succinylome analyses provide insights into metabolic regulation and lymph node metastasis in gastric cancer.. Sci Rep., 2017. [PubMed]
- iTRAQ‐based quantitative proteomics approach identifies novel diagnostic biomarkers that were essential for glutamine metabolism and redox homeostasis for gastric cancer.. Proteomics Clin Appl., 2019. [PubMed]
- NAD(P)‐dependent steroid dehydrogenase‐like protein and neutral cholesterol ester hydrolase 1 serve as novel markers for early detection of gastric cancer identified using quantitative proteomics.. J Clin Lab Anal., 2021. [PubMed]
- Identification and validation of PGLS as a metabolic target for early screening and prognostic monitoring of gastric cancer.. J Clin Lab Anal., 2022. [PubMed]
- Phosphoproteomics enables molecular subtyping and nomination of kinase candidates for individual patients of diffuse‐type gastric cancer.. iScience., 2019. [PubMed]
- Comprehensive characterization of the phosphoproteome of gastric cancer from endoscopic biopsy specimens.. Theranostics., 2020. [PubMed]
- Analysis of neuronal phosphoproteome reveals PINK1 regulation of BAD function and cell death.. Cell Death Differ., 2018. [PubMed]
- Functional interrogation of the kinome using nucleotide acyl phosphates.. Biochemistry., 2007. [PubMed]
- Limma powers differential expression analyses for RNA‐sequencing and microarray studies.. Nucleic Acids Res., 2015. [PubMed]
- KEGG: kyoto encyclopedia of genes and genomes.. Nucleic Acids Res., 2000. [PubMed]
- clusterProfiler: an R package for comparing biological themes among gene clusters.. OMICS., 2012. [PubMed]
- Mfuzz: a software package for soft clustering of microarray data.. Bioinformation., 2007. [PubMed]
- An integrated TCGA pan‐cancer clinical data resource to drive high‐quality survival outcome analytics.. Cell., 2018. [PubMed]
- The KSEA app: a web‐based tool for kinase activity inference from quantitative phosphoproteomics.. Bioinformatics., 2017. [PubMed]
- Integrin subunit alpha V promotes growth, migration, and invasion of gastric cancer cells.. Pathol Res Pract., 2019. [PubMed]
- hTERT promotes the invasion of gastric cancer cells by enhancing FOXO3a ubiquitination and subsequent ITGB1 upregulation.. Gut., 2017. [PubMed]
- LncRNA MEG3 suppressed the progression of ovarian cancer via sponging miR‐30 e‐3p and regulating LAMA4 expression.. Cancer Cell Int., 2020. [PubMed]
- Identification of molecular determinants of primary and metastatic tumour re‐initiation in breast cancer.. Nat Cell Biol., 2015. [PubMed]
- LAMA4, highly expressed in human hepatocellular carcinoma from Chinese patients, is a novel marker of tumor invasion and metastasis.. J Cancer Res Clin Oncol., 2008. [PubMed]
- Effect of LAMA4 on prognosis and its correlation with immune infiltration in gastric cancer.. Biomed Res Int., 2021. [PubMed]
- MicroRNA‐29c mediates initiation of gastric carcinogenesis by directly targeting ITGB1.. Gut., 2015. [PubMed]
- The immune contexture of hepatocellular carcinoma predicts clinical outcome.. Sci Rep., 2018. [PubMed]
- Phosphoproteomic analysis identifies CLK1 as a novel therapeutic target in gastric cancer.. Gastric Cancer., 2020. [PubMed]
- Kinome profiling reveals abnormal activity of kinases in skeletal muscle from adults with obesity and insulin resistance.. J Clin Endocrinol Metab., 2020. [PubMed]
- Constitutive activation of glycogen synthase kinase‐3beta correlates with better prognosis and cyclin‐dependent kinase inhibitors in human gastric cancer.. BMC Gastroenterol., 2010. [PubMed]
- FAK in cancer: mechanistic findings and clinical applications.. Nat Rev Cancer., 2014. [PubMed]
- Targeting focal adhesion kinase in cancer cells and the tumor microenvironment.. Exp Mol Med., 2020. [PubMed]
- PI3K/AKT/mTOR signaling in gastric cancer: epigenetics and beyond.. Life Sci., 2020. [PubMed]
- Targeting PI3K/AKT/mTOR signaling pathway in breast cancer.. Cancer., 2021
- Aquaporins 1, 3 and 5 in different tumors, their expression, prognosis value and role as new therapeutic targets.. Pathol Oncol Res., 2020. [PubMed]
- CSN1 facilitates proliferation and migration of hepatocellular carcinoma cells by upregulating cyclin A2 expression.. Mol Med Rep., 2021. [PubMed]
- F‐spondin: a gene expressed at high levels in the floor plate encodes a secreted protein that promotes neural cell adhesion and neurite extension.. Cell., 1992. [PubMed]
- Spondin 1 promotes metastatic progression through Fak and Src dependent pathway in human osteosarcoma.. Biochem Biophys Res Commun., 2015. [PubMed]
- microRNA‐506 regulates proliferation, migration and invasion in hepatocellular carcinoma by targeting F‐spondin 1 (SPON1).. Am J Cancer Res., 2015. [PubMed]
- Interactions of human tenascin‐X domains with dermal extracellular matrix molecules.. Arch Dermatol Res., 2007. [PubMed]
- Tenascin XB is a novel diagnostic marker for malignant mesothelioma.. Anticancer Res., 2019. [PubMed]
- Tenascin‐X is a novel diagnostic marker of malignant mesothelioma.. Am J Surg Pathol., 2009. [PubMed]
- A novel role for the extracellular matrix glycoprotein‐tenascin‐X in gastric function.. J Physiol., 2019. [PubMed]
- PI3K/Akt‐dependent phosphorylation of GSK3β and activation of RhoA regulate Wnt5a‐induced gastric cancer cell migration.. Cell Signal., 2013. [PubMed]
- Hypoxic inactivation of glycogen synthase kinase‐3β promotes gastric tumor growth and angiogenesis by facilitating hypoxia‐inducible factor‐1 signaling.. APMIS., 2016. [PubMed]
- Effect of mutation K85R on GSK‐3beta: molecular dynamics simulation.. Biochem Biophys Res Commun., 2008. [PubMed]
- CD151 knockdown inhibits osteosarcoma metastasis through the GSK‐3β/β‐catenin/MMP9 pathway.. Oncol Rep., 2016. [PubMed]
- GSK‐3α is a novel target of CREB and CREB‐GSK‐3α signaling participates in cell viability in lung cancer.. PLoS One., 2016. [PubMed]
- Phosphoproteomic profiling identifies aberrant activation of integrin signaling in aggressive non‐type bladder carcinoma.. J Clin Med., 2019. [PubMed]