Meta-analysis of epigenome-wide association studies in neonates reveals widespread differential DNA methylation associated with birthweight
Abstract
Birthweight is associated with health outcomes across the life course, DNA methylation may be an underlying mechanism. In this meta-analysis of epigenome-wide association studies of 8,825 neonates from 24 birth cohorts in the Pregnancy And Childhood Epigenetics Consortium, we find that DNA methylation in neonatal blood is associated with birthweight at 914 sites, with a difference in birthweight ranging from −183 to 178 grams per 10% increase in methylation (PBonferroni < 1.06 x 10⁻⁷). In additional analyses in 7,278 participants, <1.3% of birthweight-associated differential methylation is also observed in childhood and adolescence, but not adulthood. Birthweight-related CpGs overlap with some Bonferroni-significant CpGs that were previously reported to be related to maternal smoking (55/914, p = 6.12 x 10−74) and BMI in pregnancy (3/914, p = 1.13×10⁻³), but not with those related to folate levels in pregnancy. Whether the associations that we observe are causal or explained by confounding or fetal growth influencing DNA methylation (i.e. reverse causality) requires further research.
Article type: Research Article
Keywords: Epigenetics, DNA methylation, Epidemiology, Paediatric research
Affiliations: 0004 1936 7603grid.5337.2MRC Integrative Epidemiology Unit, University of Bristol, Bristol, UK; 0004 1936 7603grid.5337.2Population Health Sciences, Bristol Medical School, University of Bristol, Bristol, UK; 0000 9558 4598grid.4494.dUniversity of Groningen, University Medical Center Groningen, Department of Epidemiology, Groningen, The Netherlands; 0001 0791 5666grid.4818.5Division of Human Nutrition and Health, Wageningen University, Wageningen, The Netherlands; Xgrid.5645.2The Generation R Study Group, Erasmus MC, University Medical Center Rotterdam, Rotterdam, The Netherlands; Xgrid.5645.2Department of Epidemiology, Erasmus MC, University Medical Center Rotterdam, Rotterdam, The Netherlands; Xgrid.5645.2Department of Pediatrics, Erasmus MC, University Medical Center Rotterdam, Rotterdam, The Netherlands; 0004 1936 7603grid.5337.2School of Oral and Dental Sciences, University of Bristol, Bristol, UK; 0001 2181 7878grid.47840.3fChildren’s Environmental Health Laboratory, Division of Environmental Health Sciences, School of Public Health, University of California, Berkeley, CA USA; 0001 2179 2404grid.254880.3Department of Epidemiology, Geisel School of Medicine at Dartmouth College, Hanover, NH USA; 0004 1763 3517grid.434607.2ISGlobal, Bacelona Institute for Global Health, Barcelona, Spain; grid.17703.32Epigenetics Group, International Agency for Research on Cancer, Lyon, France; 0001 1541 4204grid.418193.6Centre for Fertility and Health, Norwegian Institute of Public Health, Oslo, Norway; 0004 0389 8485grid.55325.34Oslo Centre for Biostatisitcs and Epidemology, Oslo University Hospital, Oslo, Norway; 0001 2110 5790grid.280664.eEpidemiology Branch, National Institute of Environmental Health Sciences, National Institutes of Health, Department of Health and Human Service, Research Triangle Park, Durham, NC USA; 0000 9497 5095grid.419548.5Department of Translational Research in Psychiatry, Max-Planck-Institute of Psychiatry, Munich, Germany; 0001 0703 675Xgrid.430503.1Department of Epidemiology, Colorado School of Public Health, University of Colorado Anschutz Medical Campus, Aurora, CO USA; 0004 1936 7558grid.189504.1Department of Biostatistics, Boston University School of Public Health, Boston, MA USA; 0001 2297 6811grid.266102.1HDF Comprehensive Cancer Center, University of California, San Francisco, CA USA; 0001 2297 6811grid.266102.1Computational Biology and Informatics, UCSF, San Francisco, CA USA; 0001 2173 6074grid.40803.3fDepartment of Biological Sciences, North Carolina State University, Raleigh, NC USA; 0001 2173 6074grid.40803.3fCenter for Human Health and the Environment, North Carolina State University, Raleigh, NC USA; 0001 2156 6853grid.42505.36Department of Preventive Medicine, University of Southern California, Los Angeles, CA 90089 USA; 0001 0081 2808grid.411172.0Centre de recherche du Centre hospitalier universitaire de Sherbrooke, Sherbrooke, QC Canada; 0001 0670 2351grid.59734.3cDepartment of Environmental Medicine and Public Health, Icahn School of Medicine at Mount Sinai, New York, NY USA; grid.214458.eDepartment of Epidemiology, School of Public Health, University of Michigan, Ann Arbor, MI USA; 0004 1936 9297grid.5491.9Clinical and Experimental Sciences, Faculty of Medicine, University of Southampton, Southampton, UK; Human Development and Health, Faculty of Medicine, University of Southampton, Southampton General Hospital, Southampton, UK; 0001 0941 6502grid.189967.8Department of Environmental Health, Rollins School of Public Health at Emory University, Atlanta, GA USA; 0000 9558 4598grid.4494.dUniversity of Groningen, University Medical Center Groningen, Department of Pediatric Pulmonology and Pediatric Allergology, Beatrix Children’s Hospital, Groningen Research Institute for Asthma and COPD, Groningen, The Netherlands; 0000 9558 4598grid.4494.dUniversity of Groningen, University Medical Center Groningen, Department of Genetics, Groningen, The Netherlands; 0004 1936 7910grid.1012.2Telethon Kids Institute, University of Western Australia, Perth, Australia; 0000 9558 4598grid.4494.dUniversity of Groningen, University Medical Center Groningen, Department of Epidemiology and Groningen Research Institute for Asthma and COPD (GRIAC), Groningen, The Netherlands; 0001 2113 8111grid.7445.2Department of Epidemiology and Biostatistics, MRC–PHE Centre for Environment & Health, School of Public Health, Imperial College London, London, UK; 0004 1937 0626grid.4714.6Institute of Environmental Medicine, Karolinska Institutet, Stockholm, Sweden; 0004 1937 0626grid.4714.6Department of Medical Epidemiology and Biostatistics, Karolinska Institutet, Stockholm, Sweden; 0004 0410 2071grid.7737.4Helsinki Collegium for Advanced Studies, University of Helsinki, Helsinki, Finland; 0004 0410 2071grid.7737.4Department of Psychology and Logopedics, Faculty of Medicine, University of Helsinki, Helsinki, Finland; 0004 1754 9227grid.12380.38Department of Biological Psychology, Netherlands Twin Register, Vrije Universiteit Amsterdam, Amsterdam, The Netherlands; grid.6717.7VITO – Health, Mol, Belgium; 0001 0604 5662grid.12155.32Theoretical Physics, Faculty of Sciences, Hasselt University, Hasselt, Belgium; 0001 0604 5662grid.12155.32Centre for Environmental Sciences, Hasselt University, Hasselt, Belgium; 0001 0728 0170grid.10825.3eResearch Unit for Gynaecology and Obstetrics, Department of Clinical Research, University of Southern Denmark, Odense, Denmark; Xgrid.5645.2Department of Pediatrics, Division of Respiratory Medicine and Allergology, Erasmus MC, University Medical Center Rotterdam, Rotterdam, The Netherlands; Xgrid.5645.2Department of Pediatrics, Division of Neonatology, Erasmus MC, University Medical Center Rotterdam, Rotterdam, The Netherlands; 0001 2110 5790grid.280664.eBiostatistics and Computational Biology Branch, National Institute of Environmental Health Sciences, NIH, Research Triangle Park, Durham, NC USA; 0001 0703 675Xgrid.430503.1Department of Biostatistics and Informatics, Colorado School of Public Health, University of Colorado Anschutz Medical Campus, Aurora, CO USA; 0001 0604 5662grid.12155.32Centre for Environmental Sciences, Hasselt University, Diepenbeek, Belgium; grid.14105.31MRC/PHE Centre for Environment and Health School of Public Health Imperial College London, St Mary’s Campus, Norfolk Place, London, UK; Channing Division of Network Medicine, Brigham and Women’s Hospital, Harvard Medical School, Boston, MA USA; 0001 2173 6074grid.40803.3fBioinformatics Research Center, North Carolina State University, Raleigh, NC USA; grid.11478.3bBioinformatics and Genomics Program, Centre for Genomic Regulation (CRG), Barcelona, Spain; 0001 2172 2676grid.5612.0Universitat Pompeu Fabra (UPF), Barcelona, Spain; 0000 9314 1427grid.413448.eCIBER Epidemiología y Salud Pública (CIBERESP), Barcelona, Spain; 0000 9064 6198grid.86715.3dDepartment of Medicine, Universite de Sherbrooke, Sherbrooke, QC Canada; 0004 1936 9684grid.27860.3bDepartment of Public Health Sciences, School of Medicine, University of California Davis MIND Institute, Sacramento, CA USA; 0000 9560 654Xgrid.56061.34Division of Epidemiology, Biostatistics and Environmental Health, School of Public Health, University of Memphis, Memphis, TN USA; Children’s Environmental Health & Disease Prevention Research Center at Dartmouth, Hanover, NH USA; grid.5477.1Institute for Risk Assessment Sciences, Utrecht University, Utrecht, The Netherlands; 0004 1936 7910grid.1012.2Medical School, University of Western Australia, Perth, Australia; 0001 0941 4873grid.10858.34Center for Life Course Health Research, Faculty of Medicine, University of Oulu, 90014 Oulu, Finland; 0001 0941 4873grid.10858.34Biocenter Oulu, University of Oulu, Oulu, Finland; 0004 4685 4917grid.412326.0Unit of Primary Care, Oulu University Hospital, Oulu, Finland; 0001 2326 2191grid.425979.4Center for Occupational and Environmental Medicine, Stockholm County Council, Stockholm, Sweden; 0001 2150 1785grid.17088.36College of Veterinary Medicine, Michigan State University, East Lansing, MI USA; 0004 0410 2071grid.7737.4Obstetrics and Gynaecology, University of Helsinki and Helsinki University Hospital, Helsinki, Finland; 0004 0425 469Xgrid.8991.9Medical Research Council Unit The Gambia at the London School of Hygiene and Tropical Medicine, London, UK; 0001 2322 6764grid.13097.3cDepartment of Women and Children’s Health, King’s College London, London, UK; 0001 0674 042Xgrid.5254.6Novo Nordisk Foundation Center for Basic Metabolic Research, Section of Metabolic Genetics, Faculty of Health and Medical Sciences, University of Copenhagen, Copenhagen, Denmark; 0001 0674 042Xgrid.5254.6Department of Public Health, Section of Epidemiology, Faculty of Health and Medical Sciences, University of Copenhagen, Copenhagen, Denmark; 0001 0703 675Xgrid.430503.1Division of Biomedical Informatics and Personalized Medicine, Department of Medicine, University of Colorado Anschutz Medical Campus, Aurora, CO USA; 0001 0668 7884grid.5596.fDepartment of Public Health & Primary Care, Leuven University, Leuven, Belgium; 0004 1936 8403grid.9909.9School of Food Sciences and Nutrition, University of Leeds, Leeds, UK; 0001 2336 6580grid.7605.4Department of Medical Sciences, University of Turin, Turin, Italy; 0004 1756 876Xgrid.420240.0AOU Citta della Salute e della Sceinza, CPO Piemonte, Turin, Italy; 0004 1767 8811grid.411142.3IMIM (Hospital del Mar Medical Research Institute), Barcelona, Spain; 0001 2181 7878grid.47840.3fCenter for Environmental Research and Children’s Health, School of Public Health, University of California, Berkeley, CA USA; 0004 1754 9227grid.12380.38Department of Biological Psychology, Amsterdam Public Health Research Institute, Vrije Universiteit Amsterdam, Amsterdam, The Netherlands; grid.189509.cDepartment of Community and Family Medicine, Duke University Medical Center, Raleigh, NC USA; 0004 1936 8948grid.4991.5The George Institute for Global Health, Nuffield Department of Women’s & Reproductive Health, University of Oxford, Oxford, UK; 0000 9064 6198grid.86715.3dDepartment of Biochemistry, Université de Sherbrooke, Sherbrooke, QC Canada; ECOGENE-21 Biocluster, Chicoutimi Hospital, Saguenay, QC Canada; grid.21729.3fLaboratory of Precision Environmental Biosciences, Columbia University Mailman School of Public Health, New York, NY USA; grid.21729.3fDepartment of Environmental Health Sciences, Mailman School of Public Health, Columbia University, New York, NY USA; 0000 9957 7758grid.280062.eDivision of Research, Kaiser Permanente Northern California, Oakland, CA USA; 0001 2113 8111grid.7445.2Department for Genomics of Common Diseases, School of Public Health, Imperial College London, London, UK; 0004 0410 2071grid.7737.4Folkhälsan Institute of Genetics, Helsinki, and Research Programs Unit, Molecular Neurology, University of Helsinki, Helsinki, Finland; 0004 1937 0626grid.4714.6Department of Biosciences and Nutrition, Karolinska Institutet, Huddinge, Sweden; 0001 2322 6764grid.13097.3cSchool of Basic and Medical Biosciences, King’s College London, Guy’s Hospital, London, UK; David Hide Asthma and Allergy Research Centre, Isle of Wight, UK; 0004 0410 2071grid.7737.4HUSLAB and the Department of Clinical Chemistry, University of Helsinki, Helsinki, Finland; 0004 1936 8403grid.9909.9LICAMM, School of Medicine, Univeristy of Leeds, Leeds, UK; 0004 1754 9227grid.12380.38Amsterdam Public Health Institute, Vrije Universiteit Amsterdam, Amsterdam, The Netherlands; 0001 2171 9311grid.21107.35Center for Epigenetics, Johns Hopkins University School of Medicine, Baltimore, MA USA; 0001 2181 3113grid.166341.7AJ Drexel Autism Institute, Drexel University, Philadelphia, PA USA; 0001 0668 7884grid.5596.fKU Leuven – University of Leuven, Department of Neurosciences, Experimental Neurology and Leuven Institute for Neuroscience and Disease (LIND), Leuven, Belgium; grid.11486.3aVIB, Center for Brain & Disease Research, Laboratory of Neurobiology, Leuven, Belgium; 0001 2171 9311grid.21107.35Department of Mental Health, Bloomberg School of Public Health, Johns Hopkins University, Baltimore, MD USA; grid.416452.0Sachs’ Children’s Hospital, Stockholm, Sweden; 0001 1013 0499grid.14758.3fNational Institute for Health and Welfare, Helsinki and Oulu, Oulu, Finland; 0000 9950 5666grid.15485.3dHospital for Children and Adolescents, Helsinki University Hospital and University of Helsinki, Helsinki, Finland; 0004 4685 4917grid.412326.0PEDEGO Research Unit, MRC Oulu, Oulu University Hospital and University of Oulu, Oulu, Finland; 0000 9241 5705grid.24381.3cPediatric Allergy and Pulmonology Unit at Astrid Lindgren Children’s Hospital, Karolinska University Hospital, Stockholm, Sweden; 0004 0415 0102grid.67104.34Department of Population Medicine, Harvard Medical School, Harvard Pilgrim Health Care Institute, Boston, MA USA; 0001 0703 675Xgrid.430503.1Department of Epidemiology, Colorado School of Public Health, and Department of Pediatrics, University of Colorado School of Medicine, University of Colorado Anschutz Medical Campus, Aurora, CO USA; 0004 1936 7910grid.1012.2Centre for Genetic Origins of Health and Disease, School of Biomedical Sciences, University of Western Australia, Perth, Australia; 0004 0375 4078grid.1032.0School of Pharmacy and Biomedical Sciences, Curtin University, Perth, Australia; Xgrid.38142.3cDepartment of Global Health and Social Medicine, Harvard Medical School, Boston, MA USA; 0004 0386 9924grid.32224.35Diabetes Unit, Massachusetts General Hospital, Boston, MA USA; 0001 1541 4204grid.418193.6Norwegian Institute of Public Health, Oslo, Norway; 0004 0389 8485grid.55325.34Department of Pediatric Oncology and Hematology, Oslo University Hospital, Oslo, Norway; grid.189509.cDepartment of Obstetrics and Gynecology, Duke University Medical Center, Durham, NC USA; 0001 2297 6811grid.266102.1Department of Epidemiology and Biostatistics, University of California, San Francisco, CA USA; 0001 0941 6502grid.189967.8Department of Psychiatry and Behavioral Sciences, Emory University School of Medicine, Altanta, GA USA; 0004 1936 7443grid.7914.bDepartment of Global Public Health and Primary Care, University of Bergen, Bergen, Norway; 0001 1541 4204grid.418193.6Department for Non-Communicable Diseases, Norwegian Institute for Public Health, Oslo, Norway
License: © The Author(s) 2019 CC BY 4.0 Open Access This article is licensed under a Creative Commons Attribution 4.0 International License, which permits use, sharing, adaptation, distribution and reproduction in any medium or format, as long as you give appropriate credit to the original author(s) and the source, provide a link to the Creative Commons license, and indicate if changes were made. The images or other third party material in this article are included in the article’s Creative Commons license, unless indicated otherwise in a credit line to the material. If material is not included in the article’s Creative Commons license and your intended use is not permitted by statutory regulation or exceeds the permitted use, you will need to obtain permission directly from the copyright holder. To view a copy of this license, visit http://creativecommons.org/licenses/by/4.0/.
Article links: DOI: 10.1038/s41467-019-09671-3 | PubMed: 31015461 | PMC: PMC6478731
Relevance: Moderate: mentioned 3+ times in text
Full text: PDF (186 KB)
Introduction
Intrauterine exposures, such as maternal smoking, pre-pregnancy body mass index (BMI), hyperglycaemia, hypertension, folate and famine are associated with fetal growth and hence birthweight1–6. Observational studies show that birthweight is also associated with later-life health outcomes, including cardio-metabolic and mental health, some cancers and mortality7–11. In these long-term associations, birthweight may act as a proxy for potential effects of intrauterine exposures12,13. Several mechanisms may explain the associations of intrauterine exposures with birthweight and later-life health as we illustrate in Fig. 1. Our overall conceptual framework in this study was that the intrauterine environment induces epigenetic alterations, which influence fetal growth and hence correlate with birthweight. This is partly supported by previous large-scale epigenome-wide association studies (EWAS) that have reported associations of relevant maternal pregnancy exposures, including smoking, air pollution and BMI, with DNA methylation in offspring neonatal blood14–16. However, whilst four previous EWAS have observed associations of DNA methylation with birthweight17–20, the evidence to date has been limited in scale and power with sample sizes ranging from approximately 200 to 1000.
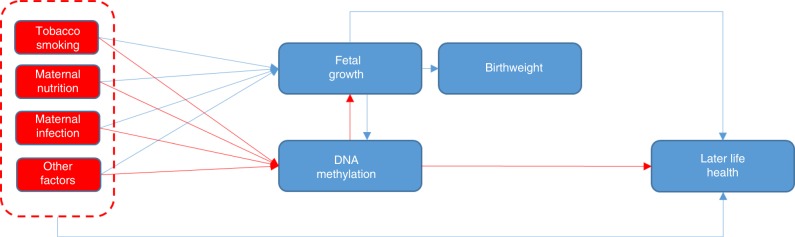
In this study, we hypothesised that there are associations between DNA methylation and birthweight. We further aimed to explore if these epigenetic alterations are associated with later disease outcomes (Fig. 1). If birthweight is a proxy for a range of adverse prenatal exposures, we might expect neonatal blood DNA methylation to be associated with birthweight. However, we acknowledge that any associations of DNA methylation with birthweight may be explained by confounding21 or reflect fetal growth influencing DNA methylation.
Here we present a large meta-analysis of multiple EWAS to explore associations between neonatal blood DNA methylation and birthweight. In further analyses, we explore whether any birthweight-associated differential methylation persists at older ages. To aid functional interpretation, we (i) explore the overlap of identified cytosine-phosphate-guanine sites (CpGs) that are differentially methylated in relation to birthweight with those known to be associated with intrauterine exposure to smoking, famine and different levels of BMI and folate; (ii) associate DNA methylation at identified CpGs with gene expression and (iii) explore potential causal links with birthweight and later-life health using Mendelian randomization (MR)22. We show that DNA methylation in neonatal blood is associated with birthweight and some of the differential methylation is also observed in childhood and adolescence, but not in adulthood. Also, we show overlap between birthweight-related CpGs and CpGs related to intrauterine exposures. Potential causality of the associations needs to be studied further.
Results
Participants
We used data from 8825 neonates from 24 studies in the Pregnancy And Childhood Epigenetics (PACE) Consortium, representing mainly European, but also African and Hispanic ethnicities with similar proportions of males and females. Details of participants used in all analyses are presented in Table 1, Supplementary Data 1 and study-specific Supplementary Methods.
Table 1: Characteristics for the participating studies in the main meta-analysis for the association between neonatal blood DNA methylation and birthweight
| Study | Total N | Normal birthweight, N (%) | High birthweight, N (%) | Birthweight (g) | Gestational age (wk) | Ethnicity | Boys, N (%) |
|---|---|---|---|---|---|---|---|
| ALSPAC | 633 | 547 (86.4) | 79 (12.5) | 3512 ± 443 | 39.7 ± 1.3 | European | 301 (47.6) |
| CBCa: Hispanic | 127 | 106 (83.5) | 19 (15.0) | 3445 ± 484 | 39.8 ± 1.3 | Hispanic | 74 (58.3) |
| CBCa: Caucasian | 136 | 108 (79.4) | 26 (19.1) | 3625 ± 472 | 39.7 ± 1.5 | European | 79 (58.1) |
| CHAMACOS | 283 | 236 (83.4) | 44 (15.5) | 3520 ± 446 | 39.3 ± 1.2 | Hispanic | 142 (50.1) |
| CHSa | 199 | 168 (84.4) | 28 (14.1) | 3486 ± 476 | 40.2 ± 1.2 | Mixed | 79 (39.7) |
| EARLI | 131 | 113 (86.3) | 16 (12.2) | 3507 ± 480 | 39.3 ± 1.0 | Mixed | 70 (53.4) |
| EXPOsOMICS: Rhea, Environage and Piccolipiu | 324 | 297 (91.7) | 22 (6.8) | 3368 ± 437 | 39.4 ± 1.2 | European | 169 (52.1) |
| GECKO | 255 | 206 (80.8) | 46 (18.0) | 3543 ± 533 | 39.7 ± 1.3 | European | 136 (53.3) |
| Gen3G | 162 | 145 (89.5) | 15 (9.3) | 3408 ± 431 | 39.5 ± 1.1 | European | 74 (45.7) |
| Generation R | 717 | 589 (82.1) | 122 (17.0) | 3572 ± 465 | 40.2 ± 1.1 | European | 372 (51.9) |
| GOYAb | 947 | 649 (68.5) | 294 (31.0) | 3750 ± 501 | 40.4 ± 1.3 | European | 483 (51.0) |
| Healthy Start: African American | 77 | – | – | 3059 ± 358 | 38.9 ± 1.3 | African American | 42 (54.5) |
| Healthy Start: Hispanic | 115 | – | – | 3322 ± 395 | 39.1 ± 1.1 | Hispanic | 55 (47.8) |
| Healthy Start: Caucasian | 240 | 220 (91.7) | 14 (5.8) | 3325 ± 425 | 39.3 ± 1.1 | European | 125 (52.1) |
| INMA | 166 | – | – | 3297 ± 400 | 39.9 ± 1.2 | European | 82 (49.4) |
| IOW F2 | 118 | 97 (82.2) | 17 (14.4) | 3432 ± 525 | 39.7 ± 1.6 | European | 59 (50.0) |
| MoBa1 | 1066 | 795 (74.6) | 251 (23.5) | 3644 ± 544 | 39.5 ± 1.6 | European | 568 (53.3) |
| MoBa2 | 587 | 435 (74.1) | 146 (24.9) | 3701 ± 487 | 40.1 ± 1.2 | European | 329 (56.0) |
| MoBa3 | 205 | 153 (74.6) | 51 (24.9) | 3706 ± 491 | 39.8 ± 1.2 | European | 106 (51.7) |
| NCLa | 792 | 592 (74.7) | 192 (24.2) | 3671 ± 506 | 40.0 ± 1.3 | European | 453 (57.2) |
| NEST: African American | 99 | – | – | 3197 ± 534 | 39.3 ± 1.2 | African American | 47 (47.5) |
| NEST: Caucasian | 111 | 94 (84.7) | 13 (11.7) | 3446 ± 471 | 39.5 ± 1.2 | European | 50 (45.0) |
| NHBCS | 96 | 84 (87.5) | 12 (12.5) | 3509 ± 453 | 39.6 ± 1.1 | European | 53 (55.2) |
| PREDO | 540 | 428 (79.3) | 99 (18.3) | 3572 ± 478 | 40.1 ± 1.2 | European | 264 (48.8) |
| PRISM | 138 | – | – | 3385 ± 441 | 39.5 ± 1.1 | Mixed | 76 (55.1) |
| PROGRESS | 143 | – | – | 3124 ± 387 | 38.6 ± 1.1 | Hispanic | 77 (53.8) |
| RICHS | 89 | 52 (58.4) | 23 (25.8) | 3335 ± 734 | 38.9 ± 1.2 | European | 35 (39.3) |
| Project Viva | 329 | 263 (79.9) | 64 (19.5) | 3623 ± 473 | 40.0 ± 1.2 | European | 168 (51.1) |
| Total N | 8825 | 6377 | 1593 |
Results are presented as mean ± SD or N (%). Normal birthweight: 2500−4000 g, high birthweight: >4000 g, low birthweight: <2500 g. Studies with mixed ethnicities analysed all participants together with adjustment for ethnicities. g: grams, wk: weeks, y: years. Full study names can be found in study-specific Supplementary Methods. For some studies the sample size for defining normal/high BW was too small
aCBC, CHS and NCL used heel prick blood spot samples instead of cord blood
bGOYA is a case-cohort study (cases are mothers with BMI>32 and controls are mothers randomly sampled from the underlying study population in which the cases were identified), in analyses where we included a random sample with a normal BMI distribution results were essentially the same as in the main analyses
Meta-analysis
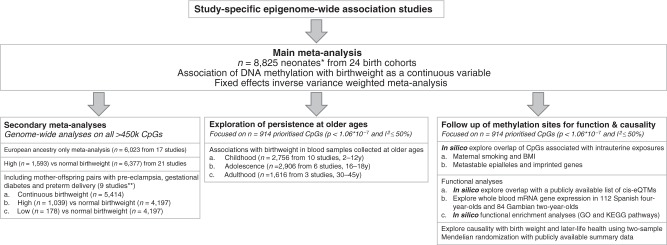
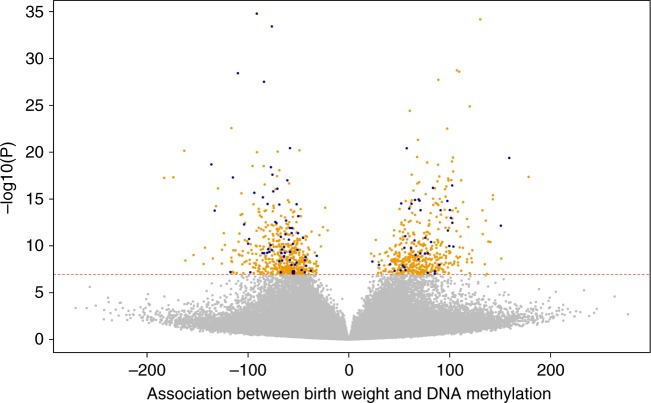
Primary, secondary and follow-up analyses are outlined in the study design in Fig. 2. Methylation at 8170 CpGs, measured in neonatal blood using the Illumina Infinium® HumanMethylation450 BeadChip assay and adjusted for cell-type heterogeneity23–25, was associated with birthweight (false discovery rate (FDR) <0.05), of which 1029 located in or near 807 genes survived the more stringent Bonferroni correction (p < 1.06 × 10⁻⁷, Supplementary Data 2). We observed both positive (45%) and negative (55%) directions of associations between methylation levels of these 1029 CpGs and birthweight (Fig. 3) and these CpGs were spread throughout the genome (orange track (1) in Fig. 4 and Supplementary Fig. 1). We found evidence of between-study heterogeneity (I2 > 50%) for 115 of the 1029 sites (Supplementary Data 2), thus we prioritised 914 CpGs, located in or near 729 genes, based on p < 1.06 × 10⁻⁷ and I2 ≤ 50% for further analyses (Fig. 3 and orange track (1) in Fig. 4). The CpG with the largest positive association was cg06378491 (in the gene body of MAP4K2). For each 10% increase in methylation at this site, birthweight was 178 g higher (95% confidence interval (CI): 138, 218 g). The CpG with the largest negative association was cg10073091 (in the gene body of DHCR24), which showed a 183 g decrease in birthweight per 10% increase in methylation (95% CI: −225, −142 g). The CpG with the smallest P-value and I2 ≤ 50% was cg17714703 (in the gene body of UHRF1), which showed a 130 g increase in birthweight for 10% increase in methylation (95% CI: 109, 151 g).
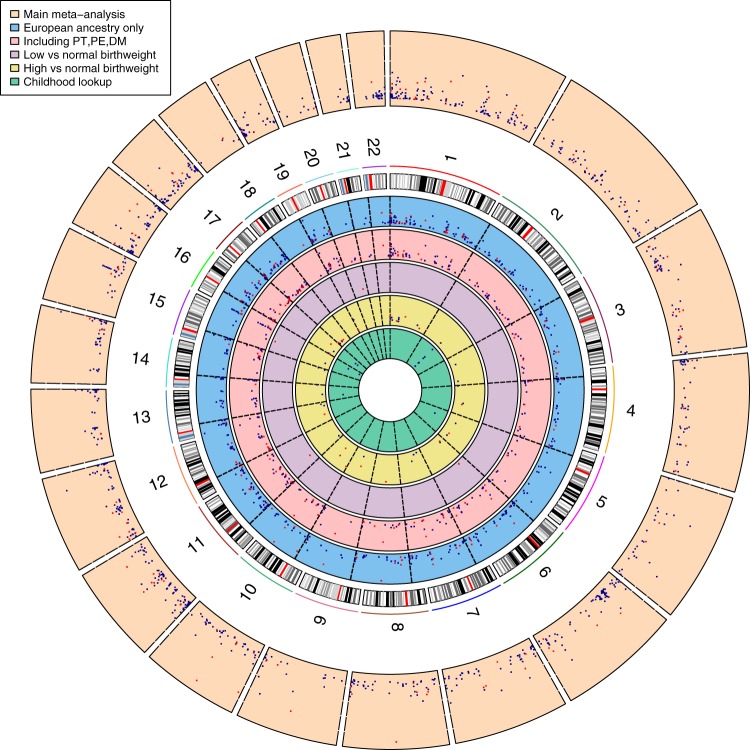
Findings were consistent with results from our main analyses when restricted to participants of European ethnicity, with a Pearson correlation coefficient for effect estimates of 0.99 for the 914 birthweight-associated CpGs (Supplementary Fig. 2, blue track (2) in Fig. 4 and Supplementary Data 3) and 0.90 for all 450k CpGs. Comparing the main meta-analysis to the four Hispanic cohorts and the two African cohorts revealed that 94.9% and 74.0% of the 914 CpGs showed consistent direction of association, with Pearson correlation coefficients for point estimates of 0.82 and 0.48, respectively (Supplementary Data 3). In leave-one-out analyses, in which we reran the main meta-analysis repeatedly with one of the 24 studies removed each time, there was no strong evidence that any one study influenced findings consistently across the 914 differentially methylated CpGs that passed Bonferroni correction and for which between-study heterogeneity had an I2 ≤ 50%. For 139/914 CpGs (15.2%) the difference in mean birthweight for a 10% greater methylation at that site varied by ≥20% with removal of a study, but the study resulting in the change was different for different CpGs. Supplementary Fig. 3.1-3.20 show the results for a random 10 plots where removal of one study changed the result by 20% or more and a random 10 where this was not the case; full results are available on request from the authors. Findings were broadly consistent when birthweight was categorised to high (>4000 g, n = 1593) versus normal (2500–4000 g, n = 6377) (Supplementary Data 4, yellow track (5) in Fig. 4) and when we did not exclude neonates born preterm or to women with pre-eclampsia or diabetes (Supplementary Fig. 4 and Supplementary Data 5A and 5C, and red track (3) in Fig. 4). Without these exclusions, we were able to examine associations with low (<2500 g, n = 178) versus normal (2500–4000 g, n = 4197) birthweight, though statistical power was still limited. Four CpGs were associated with low versus normal birthweight (Bonferroni-corrected threshold), none of which overlapped with the 914 CpGs from the main analysis (Supplementary Data 5B, purple track (4) in Fig. 4). We identified that 161 of the 914 differentially methylated CpGs potentially contained a single-nucleotide polymorphism (SNP) at cytosine or guanine positions (i.e. polymorphic CpGs; Supplementary Data 6). Polymorphic CpGs may affect probe binding and hence measured DNA methylation levels26,27. We used one of the largest studies (ALSPAC; n = 633) to explore this. We found no indication of bimodal distributions for any of the 161 CpGs suggesting SNPs had not markedly affected methylation measurements at these sites (dip test p-values: 0.299–1.00)28–30.
Analyses at older ages
We took the 914 neonatal blood CpGs that were associated with birthweight at Bonferroni-corrected statistical significance and with I2 ≤ 50% and examined their associations with birthweight when measured in blood taken in childhood (2–13 years; n = 2756 from 10 studies), adolescence (16–18 years; n = 2906 from six studies) and adulthood (30–45 years; n = 1616 from three studies). Only participants from ALSPAC, CHAMACOS and Generation R had also contributed to the main neonatal blood EWAS. In childhood, adolescence and adulthood, we observed 87, 49 and 42 of the 914 CpGs to be nominally associated with birthweight (p < 0.05). All these CpGs showed consistent directions of association. Ten CpGs showed differential methylation across all four age periods. However, only a minority survived Bonferroni correction for 914 tests (p < 5.5 × 10⁻⁵): 12 (1.3%), 1 (0.1%) and 0 CpGs in childhood, adolescence and adulthood, respectively (Supplementary Data 7; the 12 CpGs that persisted in childhood are presented in the green track (6) in Fig. 4). Of the 914 CpGs, 50, 52 and 49% showed consistency in direction of association in childhood, adolescence and adulthood, but correlations of the associations of DNA methylation and birthweight between methylation measured in infancy and that measured in childhood, adolescence and adulthood were weak (Pearson correlation coefficients: 0.15, 0.06 and 0.02, respectively).
Intrauterine factors
We observed enrichment of previously published maternal smoking-related CpGs in the birthweight-associated CpGs14 (55/914 (6.0%) penrichment = 6.12 × 10−74, of which cg00253658 and cg26681628 also showed persistent methylation differences in the look-up in childhood). We additionally found enrichment of maternal BMI-related CpGs in the list of birthweight-related CpGs15 (3/914 (0.3%) penrichment = 1.13 × 10⁻³). All directions of association were consistent with the birthweight-lowering influence of maternal smoking or the positive association of maternal BMI with birthweight (Supplementary Data 8). We did not find evidence for overlap with plasma folate31. For famine, we were unable to explore overlap with DNA methylation at the Bonferroni-significant level as the previous EWAS of famine only reported results that reached a FDR level of statistical significance32. In additional analyses for overlap between all FDR hits from the birthweight EWAS with those FDR hits presented in the smoking, maternal BMI, folate and famine EWAS, we found an overlap of 430/8170 CpGs (5.3%, penrichment = 7.38 × 10−132) for smoking, 584/8170 CpGs (7.1%, penrichment = 3.34 × 10−62) for maternal BMI and 14/8170 (0.2%, penrichment = 0.02) for folate. For famine we did not observe overlap.
Metastable epialleles and imprinted genes
We tested the birthweight-associated CpGs for enrichment of metastable epialleles (loci for which the methylation state is established in the periconceptional period33,34). We additionally tested for enrichment of CpGs annotated to imprinted genes (loci that depend on the maintenance of parental-origin-specific methylation marks in the pre-implantation embryo, some of which are known to regulate fetal growth35,36). We did not find evidence of enrichment for metastable epialleles (3/1936 metastable epialleles overlap a birthweight-associated CpG), imprinting control regions (0/741) or imprinted gene transcription start sites (5/1728) (Supplementary Data 9).
Comparison with GWAS for birthweight
To compare these EWAS results to those from genetic studies, we used the 60 recently published fetal SNPs associated with birthweight in a GWAS meta-analysis of 153,781 newborns37 and mapped the CpG sites identified in the EWAS to these SNPs to seek evidence of co-localisation of genetic and epigenetic variation (Supplementary Data 10). We repeated this for the 10 recently published maternal SNPs associated with birthweight in a GWAS meta-analysis of 86,577 women38 (Supplementary Data 11). We observed that one or more of the 914 birthweight-associated CpGs were within +/−2Mb of 34/60 fetal and all 10 maternal birthweight-associated SNPs. Of the 34 fetal SNPs, three were located in the same gene as the CpG, as was one of the ten maternal SNPs. Ten fetal and four maternal SNPs were within 100 kb of identified CpGs. In a look-up of the fetal and maternal SNPs from GWAS of birthweight in an online cord blood methylation quantitative trait loci (mQTL) database (mqtldb.org39), 35 fetal and four maternal SNPs affected methylation at some CpG(s), but none at the 914 birthweight-associated CpGs specifically.
Functional analyses
We compared the 914 birthweight-related CpGs with a recently published list of 18,881 expression quantitative trait methylation sites (cis-eQTMs, +/−250 kb around the transcription start site), CpG sites known to correlate with gene expression, from whole blood samples of 2101 Dutch adult individuals. We found that 82 of the 914 birthweight-associated CpGs were associated with gene expression of 98 probes (cis-eQTMs)40 (penrichment < 1.73 × 10⁻¹¹, Supplementary Data 12). Additionally, in 112 Spanish 4-year-olds41, we observed that 19 CpGs were inversely associated with whole blood mRNA gene expression and four CpGs were positively associated with gene expression (FDR<0.05, Supplementary Data 13). Of these 23 CpGs, 13 were also found in the publicly available cis-eQTM list40. In 84 Gambian children (age 2 years)42, we found two CpGs that were inversely associated with whole blood mRNA gene expression, but neither were found in the Spanish results or the publicly available cis-eQTM list. The 914 birthweight-associated CpGs showed no functional enrichment of Gene Ontology (GO) terms or Kyoto Encyclopedia of Genes and Genomes (KEGG) terms (FDR<0.05).
Mendelian randomization
We aimed to explore causality using MR analysis, in which genetic variants associated with methylation levels (methylation quantitative trait loci (mQTLs)) are used as instrumental variables to appraise causality. For 788 (86%) of the 914 birthweight-associated CpGs, no mQTLs were identified in a publicly available mQTL database39. For 108 (86%) of the remaining 126 CpGs, only one mQTL was identified and for the remainder none had more than four mQTLs (Supplementary Data 14 provides a complete list of all mQTLs identified for these 126 CpGs). Many of the currently available methods that can be used as sensitivity analyses to explore whether MR results are biased by horizontal pleiotropy (a single mQTL influencing multiple traits) require more than one genetic instrument (here mQTLs) and even with two or three this can be difficult to interpret43. Having determined that it was not possible to undertake MR analyses of 86% of the birthweight-related differentially methylated CpGs (because we did not identify any mQTLs), and for the majority of the remaining CpGs we would not have been reliably able to distinguish causality from horizontal pleiotropy (because only one mQTL could be identified), we decided not to pursue MR analyses further.
Discussion
This large-scale meta-analysis shows that birthweight is associated with widespread differences in DNA methylation. We observed some enrichment of birthweight-associated CpGs among sites that have previously been linked to smoking during pregnancy14 and pre-pregnancy BMI15, consistent with the hypothesis that epigenetic pathways may underlie the observational associations of those prenatal exposures with birthweight21,44,45. However, the actual overlap in this analysis was modest, likely explained by the adjustments for maternal smoking and BMI in the EWAS analyses. The overlap that we observed with pregnancy smoking-related CpGs may reflect the possibility that smoking-related CpGs capture smoking better than self-report46,47, in line with expectations of pregnant women underreporting their smoking behaviour. Adjustment for maternal smoking and BMI may have masked a greater level of overlap between our results and EWAS of these two maternal exposures. The fact that we find an association of DNA methylation across the genome with birthweight provides some support for our conceptual framework shown in Fig. 1. However, we acknowledge that the associations that we have observed may also be explained by causal effects of maternal pregnancy exposures on both DNA methylation and fetal growth, as well as subtle inflammatory responses in cell-type proportions associated with maternal smoking that might not have been completely captured with the currently available cell type estimation methods.
The differential methylation associated with birthweight in neonates persisted only minimally across childhood and into adulthood. Larger (preferably longitudinal) studies are needed to explore persistent differential methylation in more detail and with better power at older ages. It is possible that inclusion of the Gambia study in the childhood EWAS (which was the only non-European study in these analyses and was not included in the main meta-analyses with neonatal blood) might have impacted these results, although this study made up just 7% of the total child follow-up sample. A rapid attenuation of differential methylation in relation to birthweight in the first years after birth has previously been reported19, but our sample size for these analyses may have been too small to detect persistence. This rapid decrease, if real, may indicate a reduction in the dose of the child’s exposure to maternal factors such as smoking once the offspring is delivered, with that reduction continuing as the child ages. Persistence of birthweight-related differential DNA methylation may not necessarily be a prerequisite for long-term effects, as transient differential methylation in early life may cause lasting functional alterations in organ structure and function that predispose to later adverse health effects.
Methylation is known to be associated with gene expression48. However, we found no consistent associations between birthweight-related methylation and gene expression in two childhood studies. This could be due to the relatively small sample sizes, differences in ethnicities, age, or platforms to measure gene expression. The use of blood, which is likely only a possible surrogate tissue for fetal growth phenotypes, for gene expression analysis might also explain the lack of findings. We did find multiple cis-eQTMs among the birthweight-related CpGs at which methylation was related to gene expression in blood when using a publicly available database from a larger adult sample40, providing some evidence that birthweight-related differentially methylated CpGs may be associated with gene expression. These initial in silico association analyses need further exploration to establish any underlying causal mechanisms.
In observational studies, birthweight has repeatedly been associated with a range of later-life diseases. Change in DNA methylation has been hypothesized as a potential mechanism linking early exposures, birthweight and later health (Fig. 1). We originally aimed to explore this using MR analysis. For the vast majority of the birthweight-associated CpGs, no genetic instrumental variables were available. For the remaining 126 CpGs, only one mQTL was available, which would make it impossible to disentangle causality from horizontal pleiotropy. To ensure a strong basis for future MR analyses on this topic, there is a clear need for a more extensive mQTL resource.
Strengths of this study are its large sample size and the extensive analyses that we have undertaken. In a post hoc power calculation based on the sample size of 8825 with a weighted mean birthweight of 3560 g (weighted mean standard deviation (SD): 483 g) and with an alpha set at the Bonferroni-corrected level of P < 1.06 × 10⁻⁷ we had 80% power, with a two-sided test, to detect a minimum difference of 0.13 SD (63 g) in birthweight for each SD increase in methylation. The difference in methylation corresponding to a 1 SD increase differs per CpG, as it depends on the distribution of the methylation values. We acknowledge that smaller differences which might be clinically or biologically relevant may not have been identified in the current analysis. Nonetheless, to our knowledge this analysis has brought together all studies currently available with relevant data and is the largest published study of this association. DNA methylation patterns in neonatal blood, whilst easily accessible in large numbers, may not reflect the key tissue of importance in relation to birthweight. DNA methylation and gene expression in placental tissue may be important targets for future studies. DNA methylation varies between leucocyte subtypes49 and we used an adult whole blood reference to correct for this in the main analyses23,24, as the study-specific analyses were completed before the widespread availability of specific cord blood reference datasets50,51. However, we observed very similar findings in two studies (Generation R and GECKO) when we compared the results with those using one of the currently available cord blood references50. Although we adjusted for potential major confounders that may affect both methylation and fetal growth, we acknowledge that the main results cannot ascertain causality. That is, whilst we have hypothesised that variation in fetal DNA methylation influences fetal growth and hence birthweight, and undertaken the analyses accordingly, we cannot exclude the possibility that differences in neonatal blood DNA methylation are caused by variation in fetal growth itself, or that the association is confounded by factors, including maternal smoking and BMI, that independently influence both fetal growth and DNA methylation (as suggested in Fig. 1). The 450k array that was used to measure genome-wide DNA methylation only covers 1.7% of the total number of CpGs present in the genome and specifically targets CpGs in promoter regions and gene bodies52. We removed the CpGs that were flagged as potentially cross-reactive, as the measured methylation levels may represent methylation at either of the potential loci. Also, although we did not find evidence for polymorphic effects for the 161 potentially polymorphic CpGs in ALSPAC, we cannot completely exclude these potential polymorphic effects in the meta-analysed results. The majority of participants were of European ethnicity and when analyses were restricted to those of European ethnicity the results were essentially identical to those with all studies included. Direct comparisons of the main analysis with analyses in those of Hispanic or of African ethnicity for the 914 hits suggested strong correlations with Hispanic but weaker with African ethnicity. However, these results need to be treated with caution. First, we had very few studies of Hispanic and African populations. Second, we only compared the initial hits from the main meta-analysis with all ethnicities included. A detailed exploration of ethnic differences would require similar large samples for each ethnic group and within ethnic EWAS, which is beyond the scope of the data currently available.
Neonatal blood DNA methylation at many sites across the genome is associated with birthweight. Further research is required to determine if these are causal and if so whether they mediate any long-term effect of intrauterine exposures on future health.
Methods
Participants
In the main EWAS meta-analysis we explored associations of neonatal blood DNA methylation with birthweight using data from 8825 neonates from 24 studies in the PACE Consortium53 (Table 1). We removed multiple births from all analyses and excluded preterm births (<37 weeks) and offspring of mothers with pre-eclampsia or diabetes (three major pathological causes of differences in fetal growth). In follow-up analyses, we explored whether any sites found in the main analysis were discernible in relation to birthweight when examined in DNA from blood drawn during childhood (2–13 years; 2756 children from 10 studies), adolescence (16–18 years; 2906 adolescents from six studies) or adulthood (30–45 years; 1616 adults from three studies), see Supplementary Data 1B. Informed consent was obtained from all participants, and all studies received approval from local ethics committees. Study-specific methods and ethical approval statements are provided in Supplementary Methods.
Birthweight, DNA methylation and covariates
Our primary outcome was birthweight on a continuous scale (grams), adjusted for gestational age, and measured immediately after birth or retrospectively reported by mothers in questionnaires. In secondary analyses, we categorised and compared associations with high (>4000 g, n = 1593) versus normal (2500–4000g, n = 6377) birthweight. We also explored all associations with (continuous and categorical) birthweight in analyses that did not exclude women with pre-eclampsia, diabetes or preterm delivery, which also resulted in enough cases to explore low (<2500 g, n = 178) versus normal (2500–4000 g, n = 4197) birthweight (Supplementary Data 1C shows the characteristics of participants). Primary, secondary and follow-up analyses are outlined in the study design in Fig. 2. DNA methylation was measured in neonatal blood samples using the Illumina Infinium® HumanMethylation450 BeadChip assay. All participants had cord blood samples except for three studies with heel stick blood spots (n = 1254 [14.2%]). After study-specific laboratory analyses, quality control, normalisation, and removal of control probes (n = 65) and probes that mapped to the X (n = 11,232) and Y (n = 370) chromosomes, we included 473,864 CpGs. DNA methylation is expressed as the proportion of cells in which the DNA was methylated at a specific site and hence takes values from zero to one. We converted this to a percentage and present differences in mean birthweight per 10% higher DNA methylation level at each CpG. All analyses were adjusted for gestational age at delivery, child sex, maternal age at delivery, parity (0/≥1), smoking during pregnancy (no smoking/stopped in early pregnancy/smoking throughout pregnancy), pre-pregnancy BMI, socio-economic position, technical variation, and estimated white blood cell proportions (B-cells, CD8+ T-cells, CD4+ T-cells, granulocytes, NK-cells and monocytes)23–25. In studies with participants from multiple ethnic groups, each group was analysed separately and results were added to the meta-analyses as separate studies. Further details are provided in the study-specific Supplementary Methods.
Statistical methods
Robust linear (birthweight as a continuous outcome) or logit (binary birthweight outcomes) regression EWAS were undertaken within each study according to a pre-specified analysis plan. Quality control, normalisation and regression analyses were conducted independently by each study. After confirming comparability of study-specific summary statistics54, we combined results using a fixed effects inverse variance weighted meta-analysis55. The meta-analysis was done independently by two study groups and the results were compared in order to minimise the likelihood of human error. We show (two-sided) results after correcting for multiple testing using both the FDR<0.0556 and the Bonferroni correction (p < 1.06 × 10⁻⁷). We completed follow-up analyses for differentially methylated CpGs that reached the Bonferroni-adjusted threshold and did not show large between-study heterogeneity57 (I2 ≤ 50%). We annotated the nearest gene for each CpG using the UCSC Genome Browser build hg1958,59. We explored whether between-study heterogeneity might be explained by differences in ethnicity between studies, by repeating the meta-analysis including only participants of European ethnicity, which was by far the largest ethnic subgroup (n = 6023 from 17 studies) (Fig. 2). Ethnicity was defined using maternal or self-report, unless specified otherwise in study-specific Supplementary Methods. We also did meta-analyses only including the Hispanic studies and only including the African American studies and present those results for illustrative purposes only, given the much smaller sample size. All analyses were performed using R60, except for the meta-analysis which was performed using METAL55. We removed CpGs that co-hybridised to alternate sequences (i.e. cross-reactive sites), because we cannot distinguish whether the differential methylation is at the locus that we have reported or at the one that the probe cross-reacts with. We compared the birthweight-related CpGs to lists of CpGs that are potentially influenced by a SNP (polymorphic sites)26,27. For these CpGs, we determined if DNA methylation levels were influenced by nearby SNPs, by assessing whether their distributions deviated from unimodality using Hartigans’ dip test28,29 and visual inspection of density plots in n = 742 cord blood samples in the ALSPAC study.
Analyses at older ages
Analyses of the associations with DNA methylation in blood collected in childhood, adolescence and adulthood followed the same covariable adjustment and methods as for the main analyses (p < 5.5 × 10⁻⁵ for 914 tests). All participants and studies in these analyses at older ages had not been included in the main meta-analysis in neonatal blood, except for ALSPAC (n = 633 in neonatal analyses, n = 605 in childhood and n = 526 in adolescence), CHAMACOS (n = 283 in neonatal analyses and n = 191 in childhood) and Generation R (n = 717 in neonatal analyses and n = 372 in childhood). Characteristics are shown in study-specific Supplementary Methods and Supplementary Data 1B.
Intrauterine factors
We used a hypergeometric test to explore the extent to which any of the birthweight-related CpGs overlapped with those previously associated with intrauterine exposure to smoking14 (n = 568 CpGs), BMI15 (n = 104 CpGs) and plasma folate31 (n = 48 CpGs), using the same (Bonferroni-corrected) cut-off for statistical significance. No CpGs reached the Bonferroni-corrected cut-off for famine32. We additionally appraised this overlap using the FDR<0.05 cut-off for all traits (n = 8170 birthweight-related CpGs, n = 6703 smoking-related CpGs, n = 16,067 BMI-related CpGs, n = 443 folate-related CpGs, n = 7 famine-related CpGs). These FDR results were available from the publications for smoking, folate and famine, and we obtained them from the corresponding author for BMI.
Metastable epialleles and imprinted genes
We tested the birthweight-associated CpGs for enrichment of metastable epialleles and CpGs associated with imprinted genes. The metastable epialleles were derived from a recently published study that identified 1936 putative metastable epialleles34. For imprinted genes, we first identified a set of CpGs falling within a curated set of imprinting control regions; differentially methylated regions controlling the parental-specific expression of one or more imprinted genes36. Second, we extracted the set of imprinting control region controlled genes from the above source and identified all 450k CpGs within +/−10kbp of the gene transcription start site, including all known alternative TSS identified in grch37.ensembl.org using biomaRt61,62.
Comparison with GWAS for birthweight
We compared the birthweight-associated CpGs with the 60 SNPs from the most recent GWAS meta-analyses of fetal genotype associations with birthweight in >150,000 newborns37 and with the 10 SNPs from the most recent GWAS meta-analysis of maternal genotype associations with birthweight in >86,000 women38. With this comparison we checked if the EWAS top hits were located within a 4 Mb window (+/− 2 Mb) surrounding these SNPs. We additionally checked whether SNPs and CpGs were located in the same gene.
Functional analyses
To explore the association of methylation with gene expression, we compared birthweight-related CpGs with a recently published list of 18,881 cis-eQTMs from whole blood samples of 2101 Dutch adult individuals40. With a hypergeometric test, we calculated enrichment of cis-eQTMs in the list of birthweight-associated CpGs. We further explored methylation of birthweight-associated CpGs in relation to whole blood mRNA gene expression (transcript levels) within a 500 kb region of the CpGs (+/−250 kb, FDR<0.05) in 112 Spanish 4-year-olds41 and 84 Gambian 2-year-olds42 (Supplementary Methods). To better understand the potential mechanisms linking DNA methylation and birthweight, we explored the potential functions of the birthweight-associated CpGs using GO and Kyoto Encyclopedia of Genes and Genomes (KEGG) enrichment analyses. We used the missMethyl R package63, which enabled us to correct for the number of probes per gene on the 450k array, based on the November 2018 version of the GO and KEGG source databases. To filter out the large, general pathways we set the number of genes for each gene set between 15 and 1000, respectively. We calculated FDR at 5% corrected P-values for enrichment.
Mendelian randomization
MR uses genetic variants as instrumental variables to study the causal effect of exposures on outcomes64,65. We aimed to use two-sample MR22,66 to explore (a) evidence of a causal association of methylation levels at the identified CpGs with birthweight and (b) evidence of a causal association of these CpGs with later-life health outcomes (i.e. to explore our hypothesised causal mechanisms shown in Fig. 1). We did this by first searching a publicly available mQTL database39 to identify cis-mQTLs within 1 Mb of each of the Bonferroni-corrected, with I2 ≤ 50%, birthweight-related differentially methylated CpGs. These mQTLs could then be used as genetic instrumental variables for methylation levels of the birthweight-related CpGs. We then aimed to determine the association of these mQTLs with birthweight and later-life health outcomes from publicly available summary GWAS results66.
Reporting summary
Further information on experimental design is available in the Nature Research Reporting Summary linked to this article.
Supplementary Materials
- Supplementary Information (PDF)
- Peer Review File (PDF)
- Description of Additional Supplementary Files (PDF)
- Supplementary Data 1 (XLSX)
- Supplementary Data 2 (XLSX)
- Supplementary Data 3 (XLSX)
- Supplementary Data 4 (XLSX)
- Supplementary Data 5 (XLSX)
- Supplementary Data 6 (XLSX)
- Supplementary Data 7 (XLSX)
- Supplementary Data 8 (XLSX)
- Supplementary Data 9 (XLSX)
- Supplementary Data 10 (XLSX)
- Supplementary Data 11 (XLSX)
- Supplementary Data 12 (XLSX)
- Supplementary Data 13 (XLSX)
- Supplementary Data 14 (XLSX)
- Reporting Summary (PDF)
References
- J Tyrrell. Genetic evidence for causal relationships between maternal obesity-related traits and birth weight. JAMA, 2016. [DOI | PubMed]
- J Tyrrell. Genetic variation in the 15q25 nicotinic acetylcholine receptor gene cluster (CHRNA5-CHRNA3-CHRNB4) interacts with maternal self-reported smoking status during pregnancy to influence birth weight. Hum. Mol. Genet., 2012. [DOI | PubMed]
- R Bakker, EAP Steegers, A Hofman, VWV Jaddoe. Blood pressure in different gestational trimesters, fetal growth, and the risk of adverse birth outcomes: the generation R study. Am. J. Epidemiol., 2011. [DOI | PubMed]
- DA Lawlor. Association of existing diabetes, gestational diabetes and glycosuria in pregnancy with macrosomia and offspring body mass index, waist and fat mass in later childhood: Findings from a prospective pregnancy cohort. Diabetologia, 2010. [DOI | PubMed]
- EM van Uitert, RPM Steegers-Theunissen. Influence of maternal folate status on human fetal growth parameters. Mol. Nutr. Food. Res., 2013. [DOI | PubMed]
- RC Painter, TJ Roseboom, OP Bleker. Prenatal exposure to the Dutch famine and disease in later life: an overview. Reprod. Toxicol., 2005. [DOI | PubMed]
- PH Whincup. Birth weight and risk of type 2 diabetes a systematic review. JAMA, 2008. [DOI | PubMed]
- DA Lawlor, G Ronalds, H Clark, G Davey Smith, DA Leon. Birth weight is inversely associated with incident coronary heart disease and stroke among individuals born in the 1950s: findings from the Aberdeen children of the 1950s prospective cohort study. Circulation, 2005. [DOI | PubMed]
- KJ O’Donnell, MJ Meaney. Fetal origins of mental health: the developmental origins of health and disease hypothesis. Am. J. Psychiatry, 2017. [DOI | PubMed]
- VA McCormack, IDS Silva, I Koupil, DA Leon, HO Lithell. Birth characteristics and adult cancer incidence: Swedish cohort of over 11,000 men and women. Int. J. Cancer, 2005. [DOI | PubMed]
- KR Risnes. Birthweight and mortality in adulthood: a systematic review and meta-analysis. Int. J. Epidemiol., 2011. [DOI | PubMed]
- RM Freathy. Can genetic evidence help us to understand the fetal origins of type 2 diabetes?. Diabetologia, 2016. [DOI | PubMed]
- M Hanson. Birth weight and the fetal origins of adult disease. Pediatr. Res., 2002. [PubMed]
- BR Joubert. DNA methylation in newborns and maternal smoking in pregnancy: genome-wide consortium meta-analysis. Am. J. Hum. Genet., 2016. [DOI | PubMed]
- GC Sharp. Maternal BMI at the start of pregnancy and offspring epigenome-wide DNA methylation: findings from the pregnancy and childhood epigenetics (PACE) consortium. Hum. Mol. Genet., 2017. [DOI | PubMed]
- O Gruzieva. Epigenome-wide meta-analysis of methylation in children related to prenatal NO2 air pollution exposure. Environ. Health Perspect., 2017. [DOI | PubMed]
- RM Adkins, FA Tylavsky, J Krushkal. Newborn umbilical cord blood DNA methylation and gene expression levels exhibit limited association with birth weight. Chem. Biodivers., 2012. [DOI | PubMed]
- SM Engel. Neonatal genome-wide methylation patterns in relation to birth weight in the Norwegian Mother and Child Cohort. Am. J. Epidemiol., 2014. [DOI | PubMed]
- AJ Simpkin. Longitudinal analysis of DNA methylation associated with birth weight and gestational age. Hum. Mol. Genet., 2015. [DOI | PubMed]
- G Agha. Birth weight-for-gestational age is associated with DNA methylation at birth and in childhood. Clin. Epigenetics, 2016. [DOI | PubMed]
- DA Lawlor, C Relton, N Sattar, SM Nelson. Maternal adiposity—a determinant of perinatal and offspring outcomes?. Nat. Rev. Endocrinol., 2012. [DOI | PubMed]
- DA Lawlor. Commentary: Two-sample Mendelian randomization: opportunities and challenges. Int. J. Epidemiol., 2016. [DOI | PubMed]
- EA Houseman. DNA methylation arrays as surrogate measures of cell mixture distribution. BMC Bioinformatics, 2012. [DOI | PubMed]
- LE Reinius. Differential DNA methylation in purified human blood cells: implications for cell lineage and studies on disease susceptibility. PLoS. ONE., 2012. [DOI | PubMed]
- MJ Aryee. Minfi: A flexible and comprehensive Bioconductor package for the analysis of Infinium DNA methylation microarrays. Bioinformatics, 2014. [DOI | PubMed]
- YA Chen. Discovery of cross-reactive probes and polymorphic CpGs in the Illumina Infinium HumanMethylation450 microarray. Epigenetics., 2013. [DOI | PubMed]
- H Naeem. Reducing the risk of false discovery enabling identification of biologically significant genome-wide methylation status using the HumanMethylation450 array. BMC Genomics, 2014. [DOI | PubMed]
- J Hartigan, P Hartigan. The dip test of unimodality. Ann. Stat., 1985. [DOI]
- 29.Maechler, M. Hartigan’s dip test statistic for unimodality – corrected. R package. (2015).
- CL Relton. Data resource profile: accessible resource for integrated epigenomic studies (ARIES). Int. J. Epidemiol., 2015. [DOI | PubMed]
- BR Joubert. Maternal plasma folate impacts differential DNA methylation in an epigenome-wide meta-analysis of newborns. Nat. Commun., 2016. [DOI | PubMed]
- EW Tobi. Early gestation as the critical time-window for changes in the prenatal environment to affect the adult human blood methylome. Int. J. Epidemiol., 2015. [DOI | PubMed]
- VK Rakyan, ME Blewitt, R Druker, JI Preis, E Whitelaw. Metastable epialleles in mammals. Trends Genet., 2002. [DOI | PubMed]
- TE Van Baak. Epigenetic supersimilarity of monozygotic twin pairs. Genome. Biol., 2018. [DOI | PubMed]
- GE Moore. The role and interaction of imprinted genes in human fetal growth. Philos. Trans. R. Soc. Lond. B. Biol. Sci., 2015. [DOI | PubMed]
- 36.Monk, D. et al. Recommendations for a nomenclature system for reporting methylation aberrations in imprinted domains. Epigenetics 1–5 10.1080/15592294.2016.1264561 (2016).
- M Horikoshi. Genome-wide associations for birth weight and correlations with adult disease. Nature, 2016
- RN Beaumont. Genome-wide association study of offspring birth weight in 86 577 women identifies five novel loci and highlights maternal genetic effects that are independent of fetal genetics. Hum. Mol. Genet., 2018. [DOI | PubMed]
- TR Gaunt. Systematic identification of genetic influences on methylation across the human life course. Genome. Biol., 2016. [DOI | PubMed]
- MJ Bonder. Disease variants alter transcription factor levels and methylation of their binding sites. Nat. Genet., 2016. [DOI | PubMed]
- M Guxens. Cohort profile: the INMA—INfancia y Medio Ambiente—(environment and childhood) project. Int. J. Epidemiol., 2012. [DOI | PubMed]
- SE Moore. A randomized trial to investigate the effects of pre-natal and infant nutritional supplementation on infant immune development in rural Gambia: the ENID trial: early nutrition and immune development. BMC Pregnancy Childbirth, 2012. [DOI | PubMed]
- G Hemani, J Bowden, G Davey Smith. Evaluating the potential role of pleiotropy in Mendelian randomization studies. Hum. Mol. Genet., 2018. [DOI | PubMed]
- RC Richmond, NJ Timpson, TIA Sørensen. Exploring possible epigenetic mediation of early-life environmental exposures on adiposity and obesity development. Int. J. Epidemiol., 2015. [DOI | PubMed]
- LK Küpers. DNA methylation mediates the effect of maternal smoking during pregnancy on birthweight of the offspring. Int. J. Epidemiol., 2015. [DOI | PubMed]
- L Valeri. Misclassified exposure in epigenetic mediation analyses. Does DNA methylation mediate effects of smoking on birthweight?. Epigenomics, 2017. [DOI | PubMed]
- 47.Reese, S. E. et al. DNA methylation score as a biomarker in newborns for sustained maternal smoking during pregnancy. Env. Heal. Perspect.10.1289/EHP333 (2016).
- R Jaenisch, A Bird. Epigenetic regulation of gene expression: how the genome integrates intrinsic and environmental signals. Nat. Genet., 2003. [DOI | PubMed]
- AE Jaffe, RA Irizarry. Accounting for cellular heterogeneity is critical in epigenome-wide association studies. Genome. Biol., 2014. [DOI | PubMed]
- KM Bakulski. DNA methylation of cord blood cell types: applications for mixed cell birth studies. Epigenetics., 2016. [DOI | PubMed]
- K Gervin. Cell type specific DNA methylation in cord blood: a 450K-reference data set and cell count-based validation of estimated cell type composition. Epigenetics., 2016. [DOI | PubMed]
- 52.Dedeurwaerder, S. et al. Evaluation of the infinium methylation 450K technology. Epigenomics10.2217/epi.11.105 (2011).
- JF Felix. Cohort profile: pregnancy and childhood epigenetics (PACE) consortium. Int. J. Epidemiol., 2017
- PJ van der Most, LK Küpers, H Snieder, I Nolte. QCEWAS: automated quality control of results of epigenome-wide association studies. Bioinformatics, 2017. [PubMed]
- CJ Willer, Y Li, GR Abecasis. METAL: fast and efficient meta-analysis of genomewide association scans. Bioinformatics, 2010. [PubMed]
- Y Benjamini, Y Hochberg. Controlling the false discovery rate: a practical and powerful approach to multiple testing. J R Stat. Soc B, 1995
- JPT Higgins, SG Thompson. Quantifying heterogeneity in a meta-analysis. Stat. Med., 2002. [DOI | PubMed]
- 58.Triche, T. FDb.InfiniumMethylation.hg19: annotation package for Illumina Infinium DNA methylation probes. R package version 2.2.0 (2014).
- 59.Carlson, M. & Maintainer, B. TxDb.Hsapiens.UCSC.hg19.knownGene: annotation package for TxDb object(s). R package version 3.2.2 (2015).
- 60.R Core Team. R: A language and environment for statistical computing. (Austria, 2013).
- S Durinck. BioMart and Bioconductor: a powerful link between biological databases and microarray data analysis. Bioinformatics, 2005. [DOI | PubMed]
- S Durinck, PT Spellman, E Birney, W Huber. Mapping identifiers for the integration of genomic datasets with the R/Bioconductor package biomaRt. Nat. Protoc., 2009. [DOI | PubMed]
- B Phipson, J Maksimovic, A Oshlack. missMethyl: an R package for analyzing data from Illumina’s HumanMethylation450 platform. Bioinformatics, 2016. [PubMed]
- G Davey Smith, S Ebrahim. ‘Mendelian randomization’: Can genetic epidemiology contribute to understanding environmental determinants of disease?. Int. J. Epidemiol., 2003. [DOI | PubMed]
- DA Lawlor, RM Harbord, JAC Sterne, N Timpson, G Davey Smith. Mendelian randomization: using genes as instruments for making causal inferences in epidemiology. Stat. Med., 2008. [DOI | PubMed]
- G Hemani. The MR-Base platform supports systematic causal inference across the human phenome. eLife, 2018. [DOI | PubMed]