Pan‐cancer analysis reveals the oncogenic role of 3‐hydroxy‐3‐methylglutaryl‐CoA synthase 1
Abstract
Background:
Emerging studies reveals that 3‐hydroxy‐3‐methylglutaryl‐CoA synthase 1 (HMGCS1) plays vital oncogenic roles in a broad spectrum of human cancers, but there is no pan‐cancer evidence on the relationship between HMGCS1 and various tumor types.
Aim:
To explore the potential role of HMGCS1 across various tumor types based on big clinical data.
Methods:
We conducted a pan‐cancer analysis across more than 30 tumor types, based on the most comprehensive database available, including TCGA, GSCA, clinical proteomic tumor analysis consortium, Kaplan–Meier Plotter dataset, GEPIA2, TIMER2, STRING, and GDSC dataset.
Results:
HMGCS1 was highly expressed and negatively correlated with the prognosis in most cancer types. The infiltration levels of cancer associated fibroblast and CD8+ T‐cell were closely associated with HMGCS1 expression. Amplification was the most common genetic alteration of HMGCS1 in different cancers, while the frequency of mutation was low. Besides, ACAT2 and MVD were closely correlated and bind to HMGCS1. Pathway enrichment analysis indicated that HMGCS1 was actively involved in steroid biosynthesis. Moreover, high HMGCS1 expression could reduce the sensitivity to most drugs in the GDSC dataset.
Conclusions:
Our study revealed the potential oncogenic role of HMGCS1 in cancers.
Article type: Research Article
Keywords: cancer, drug sensitivity, genetic alteration, HMGCS1, mevalonate pathway, prognosis
Affiliations: Department of Hematology Xiangya Hospital, Central South University Changsha Hunan China; Department of Geriatric Neurology Xiangya Hospital, Central South University Changsha Hunan China
License: © 2021 The Authors. Cancer Reports published by Wiley Periodicals LLC. CC BY 4.0 This is an open access article under the terms of the http://creativecommons.org/licenses/by/4.0/ License, which permits use, distribution and reproduction in any medium, provided the original work is properly cited.
Article links: DOI: 10.1002/cnr2.1562 | PubMed: 34549901 | PMC: PMC9458500
Relevance: Moderate: mentioned 3+ times in text
Full text: PDF (4.8 MB)
INTRODUCTION
The etiology of cancer is complicated, with both genetic and epigenetic alterations involved. It is significant to conduct a pan‐cancer expression analysis of particular gene of interest and assess its correlation with diagnosis, treatment, prognosis, and potential molecular mechanisms.ref. cnr21562-bib-0001, ref. cnr21562-bib-0002
The mevalonate (MVA) pathway is known as synthesizing sterols and isoprenoids, playing a key role in multiple cellular processes.ref. cnr21562-bib-0003, ref. cnr21562-bib-0004 Recent studies highlighted the importance of MVA metabolism in cancer, especially the intermediates involved in this pathway.ref. cnr21562-bib-0003, ref. cnr21562-bib-0005, ref. cnr21562-bib-0006, ref. cnr21562-bib-0007 For instance, cholesterol, an essential component of most cellular membranes, provides building blocks for highly proliferative cancer cells. Cholesterol also contributes to drug resistance and affect immune surveillance in cancer.ref. cnr21562-bib-0008, ref. cnr21562-bib-0009 Besides, farnesyl‐diphosphate and geranylgeranyl diphosphate are requisites for protein isoprenylation, which are vital for intracellular signaling. For example, after isoprenylation, small GTPases such as RAS are transferred to cell membrane and exert oncogenic function of transforming cells.ref. cnr21562-bib-0010
The 3‐hydroxy‐3‐methylglutaryl‐CoA reductase (HMGCR) is the rate‐limiting enzyme in the MVA pathway. However, other enzymes in the pathway have also been showed to work as controlling points.ref. cnr21562-bib-0007, ref. cnr21562-bib-0011 The 3‐hydroxy‐3‐methylglutaryl‐CoA synthase 1 (HMGCS1) catalyzes the synthesis of HMG‐CoA, which is the substrate for HMGCR.ref. cnr21562-bib-0012, ref. cnr21562-bib-0013 Our previous study has proved that HMGCS1 promoted cell growth in leukemia (data not shown) and BRAFV600E‐positive human cancers.ref. cnr21562-bib-0014 Emerging studies showed that HMGCS1 contributed to the progression of a variety of cancers, including gastric, colon, and cervical cancer.ref. cnr21562-bib-0015, ref. cnr21562-bib-0016, ref. cnr21562-bib-0017 Further, the high HMGCS1 expression level was correlated with poor prognosis in breast cancer.ref. cnr21562-bib-0018 However, there is no pan‐cancer evidence on the relationship between HMGCS1 and various tumor types based on big clinical data.
In this study, we conducted a pan‐cancer analysis across more than 30 tumor types, based on the most comprehensive database available. Our study revealed the potential oncogenic role of HMGCS1 in cancers.
MATERIALS AND METHODS
Gene expression analysis
By using the “search‐expression” module of ATACdb, a comprehensive human chromatin accessibility database (http://www.licpathway.net/ATACdb/), the expressions of HMGCS1 in primary/nonprimary cells and normal tissues were displayed from NCBI GEO/SRA database. In the “Expression” module of GSCA (Gene Set Cancer Analysis, http://bioinfo.life.hust.edu.cn/GSCA/), we analyzed the HMGCS1 expression data from The Cancer Genome Atlas (TCGA) program, which was obtained from both tumor and adjacent normal tissues of various tumors or tumor subtypes. For some tumors without or with only a few normal tissues, we analyzed the difference of HMGCS1 expression between the tumor and the corresponding normal tissues by GEPIA2 (Gene Expression Profiling Interactive Analysis, version 2, http://gepia2.cancer-pku.cn/). The “expression analysis‐box plots” module was used. In addition, we presented the HMGCS1 expression in every pathological stage (stage I–stage IV) of TCGA tumors by violin plots using the “pathological stage plot” module of GEPIA2.
To compare the level of HMGCS1 protein in tumors and normal tissues, we utilized the UALCAN portal (http://ualcan.path.uab.edu/analysis-prot.html) to analyze the data from the clinical proteomic tumor analysis consortium (CPTAC) dataset.
Survival prognosis analysis
The correlation between HMGCS1 expression and prognosis of tumors was presented by Kaplan–Meier plotter (http://www.kmplot.com/analysis/) and the GEPIA2 database. We calculated the log‐rank p value and hazard ratio (HR) with 95% confidence intervals.
Immune infiltration analysis
We utilized the “immune‐gene” of TIMER2 (http://timer.cistrome.org/) to evaluate the correlation of HMGCS1 expression with immune infiltration (IF) across all tumors in TCGA project. The “Gene_Corr” module of TIMER2 was employed to investigate the association between HMGCS1 expression and IF in different cancer types and in adjacent normal tissues of the TCGA project. Correlations between HMGCS1 expression and IF were analyzed using the purity‐adjusted partial Spearman’s correlation test. The data was displayed by heatmaps and scatter plots. CIBERSORT, CIBERSORT‐ABS, EPIC, MCPCOUNTER, QUANTISEQ, TIDE, and XCELL algorithms were used. The infiltrated immune cells include cancer‐associated fibroblasts (CAF) and CD8+ T cells.
Genetic alteration analysis
We utilized the cBioPortal data (https://www.cbioportal.org/) to look at HMGCS1 alterations and clinical outcomes in the TCGA pipeline. We obtained the alteration frequency, mutation type, and copy number alteration of the HMGCS1 gene via the “cancer types summary” module of cBioPortal. The mutated site information of HMGCS1 was displayed either in the schematic diagram of the protein structure or in the 3D structure using the “mutations” module. The “comparison” module was used to acquire the mRNA and protein expression differences between the TCGA cancer cases with or without HMGCS1 genetic alteration. The heatmaps of HMGCS1 mRNA expression were generated by the TBtools. The Venn diagram was generated by the Xiantao web (https://www.xiantao.love). The “Comparison” module of cBioPortal was employed to explore the correlation between HMGCS1 genetic alterations and prognoses, including overall survival (OS), progress free survival (PFS), and disease‐free survival (DFS). We built the bivariate linear regression models to study the relationship between HMGCS1 mutations and expression levels.
HMGCS1‐related gene enrichment analysis
We used the STRING (https://string-db.org/) database to analyze the protein–protein interactions (PPI) of HMGCS1. Using the STRING website, we obtained a list of top‐50 HMGCS1‐binding proteins by setting the following parameters: minimum required interaction score (“low confidence [0.150]”), meaning of network edges (“evidence”), max number of interactors to show (“no more than 50 interactors” in first shell), and active interaction sources (“experiments”). GEPIA2 was utilized to obtain the top 50 HMGCS1‐correlated targets. A pairwise gene Pearson correlation analysis was performed. A heatmap was generated by the TIMER2. To analyze the intersection between the HMGCS1‐binding and interacted genes, the Venn diagram viewer of the Xiantao web (https://www.xiantao.love) was utilized. Besides, Kyoto encyclopedia of genes and genomes (KEGG) and Gene Ontology (GO) enrichment analysis were analyzed using the “KEGG/GO enrichment visualization” tool of XianTao.
Drug sensitivity analysis
We performed an unbiased comparison of the drug screening data using GSCA, which integrated over 10 000 genomic data in 33 cancer types from TCGA and over 750 small molecule drugs from genomics of drug sensitivity in cancer (GDSC) and cancer therapeutics response portal.
RESULTS
. The expression of HMGCS1 in cancers
First, we studied the expression of HMGCS1 in various primary/nonprimary cells and normal tissues based on ATACdb database. HMGCS1 was expressed abundantly in normal tissues. The top five normal tissues with highest HMGCS1 mRNA expression were vagina, liver, skin, salivary gland, and esophagus (Figure 1A). In primary cells, keratinocyte cells had the highest HMGCS1 expression, followed by neurosphere, foreskin keratinocyte, mucoepidermal cells (MEC) and fibroblast of lung cells. However, the expression was low in various blood cells, including PBMC, CD14+ monocyte, T‐cell, CD4+ alpha‐beta T cell, natural killer cell, B cell, and common myeloid progenitor CD34+ cell (Figure 1B). Interestingly, we found that HMGCS1 was obviously over‐expressed in tumor cell lines, especially in hematological malignancies and sarcoma (Figure 1C).
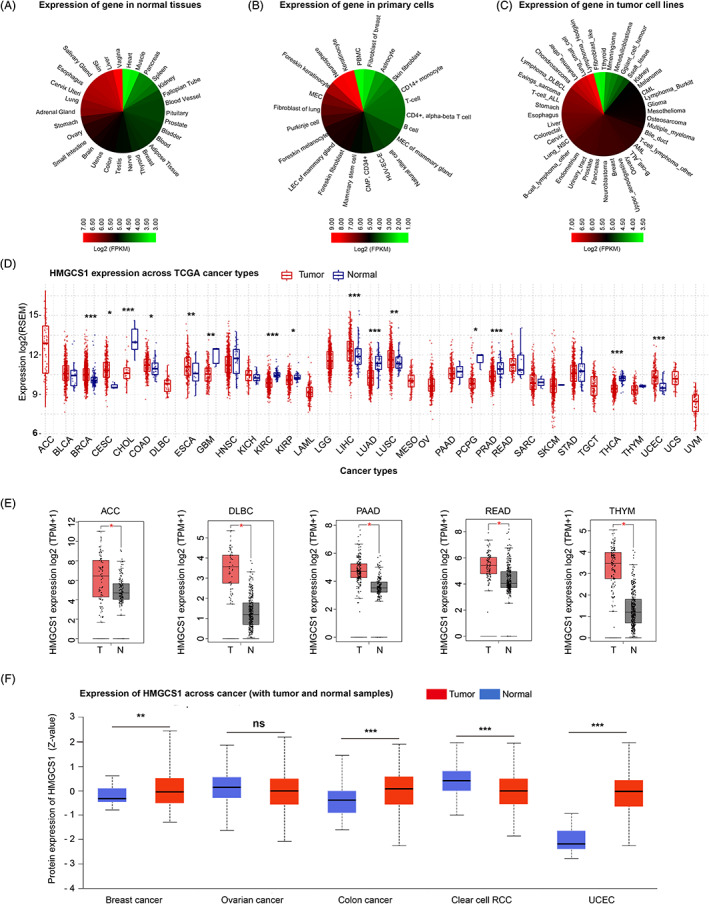
Next, we analyzed the HMGCS1 expression of normal and tumor tissues from GSCA approach across different cancer types in TCGA (Figure 1D). Compared to adjacent control tissues, HMGCS1 was over‐expressed in the tumor tissues of breast invasive carcinoma (BRCA), cervical squamous cell carcinoma (CSCA) and endocervical adenocarcinoma (CESC), colon adenocarcinoma (COAD), esophageal carcinoma (ESCA), liver hepatocellular carcinoma (LIHC), lung squamous cell carcinoma and uterine corpus endometrial carcinoma (UCEC), and lower in tumor tissues of cholangiocarcinoma (CHOL), glioblastoma multiforme, kidney renal clear cell carcinoma (KIRC), kidney renal papillary cell carcinoma (KIRP), lung adenocarcinoma (LUAD), pheochromocytoma and paraganglioma (PCPG), prostate adenocarcinoma, and thyroid carcinoma (THCA) (Figure 1D). Furthermore, we used the data of normal tissue from the GTEx dataset as controls to compare the HMGCS1 expression between the tumor and normal tissues. We found that HMGCS1 level was significant higher in adrenocortical carcinoma (ACC), diffuse large B‐cell lymphoma, pancreatic adenocarcinoma, rectum adenocarcinoma (READ), and thymoma (THYM) tumor tissues (Figure 1E), and lower in skin cutaneous melanoma and acute myeloid leukemia (AML) tumor tissues, compared with normal tissues (Figure S1A). However, for other tumors such as LHIC (LGG), ovarian serous cystadenocarcinoma (OV), testicular germ cell tumors (TGCT), and uterine carcinosarcoma (UCS), the expression of HMGCS1 was not significantly different from their controls (Figure S1B). Using the pathological stage plot module of GEPIA2, we observed significantly negative correlation between HMGCS1 expression and pathological stages of KIRC, OV, and THCA (Figure S1C).
In addition, CPTAC dataset was utilized to analyze the HMGCS1 protein level difference among cancers. Compared to normal tissues, HMGCS1 protein was higher in the primary tissues of breast cancer, colon cancer, and UCEC, but was lower in clear cell RCC (also known as KIRC) (Figure 1F).
The correlation of HMGCS1 expression with prognosis in cancers
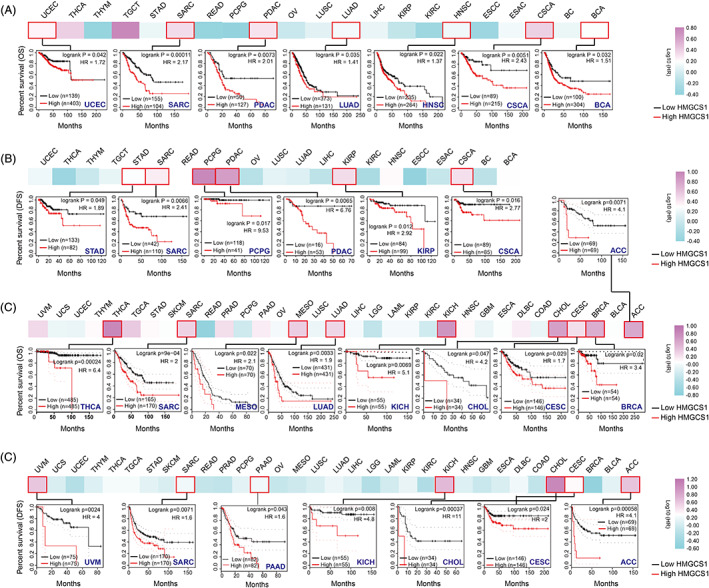
We utilized the Kaplan–Meier lotter dataset and GEPIA2 to investigate the correlation between HMGCS1 level and OS/DFS. In Kaplan–Meier Plotter dataset, we found that higher level of HMGCS1 was linked to shorter OS in multiple tumor types, including BCA (bladder carcinoma), CSCA, HNSC, PDAC, SARC, UCEC, BRCA, CESC, CHOL, KICH, LUAD, MESO, and THCA (Figure 2A, C). However, highly expressed HMGCS1 was correlated with better prognosis in a few types of tumors including LGG, READ, and KIRC (Figure S2A). Similarly, HMGCS1 expression was negatively correlated with the DFS of ACC, CESC, KIRP, PDAC, PCPG, SARC, STAD, CHOL, KICH, and UVM (Figure 2B, D), but positively correlated with the DFS of KIRC and LGG (Figure S2B). Collectively, HMGCS1 expression was negatively correlated with both OS and DFS in CSCA, PDAC, SARC, ACC, CESC, CHOL, and KICH, while positive associations were found in LGG and KIRC. In conclusion, high expression of HMGCS1 was correlated with poor prognosis in most tumor types, but good prognosis for a small number of tumors.
The correlation between HMGCS1 expression and IF in cancers
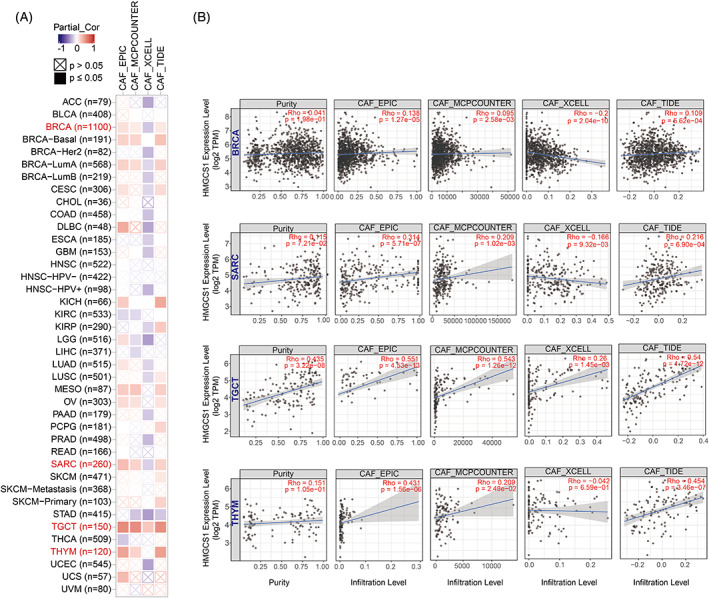
HMGCS1 expression was negatively correlated with the IF of CD8+ T‐cells in most cancers, such as CESE, HNSC, STAD, and THYM (Figure S3A, B). In addition, HMGCS1 expression was positively correlated with the estimated infiltration value (EIV) of CAF in the TCGA tumors of BRCA, BRCA−basal, BRCA−LumA, SARC, TGCT, THYM, MESO, and OV (Figures 3A, B). Collectively, we found that the expression of HMGCS1 was correlated with the IF in most cancers.
Genetic alterations of HMGCS1 in cancers
We analyzed the genetic alterations of HMGCS1 in various tumors based on the TCGA dataset. We found that gene amplification (copy gain) was far more common than other forms of genetic alterations in HMGCS1, such as mutation, deep deletion (copy loss) and fusion (Figure 4A). Sarcoma had the highest HMGCS1 genetic alteration frequency, among which amplification was the primary type. It was noteworthy that the proportions of mutation were significant in UMEC (100%) and UEC (Figure 4A). Figure 4B displayed the types, distribution, and case numbers of HMGCS1 genetic alterations. Missense mutation was the most common type. The R277Q site mutation in the C‐terminal was detected in one case of UCEC, while R277W mutation was detected in one case of COAD. The R277Q/W site mutation resulted in a truncated form of HMGCS1 protein, impairing its function. Figure 4C showed the 3D structures of HMGCS1 with or without R277 mutation.
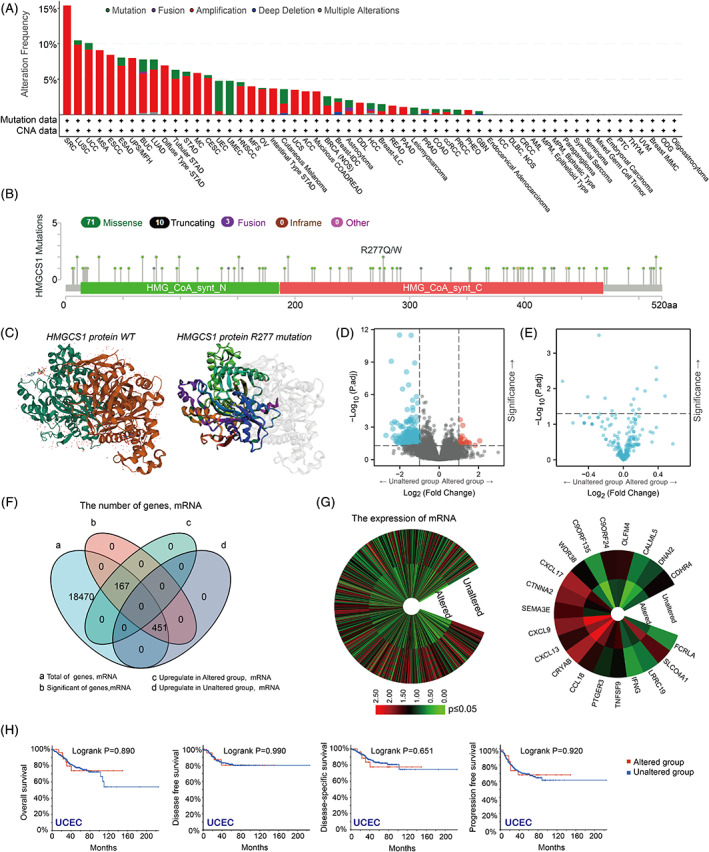
In addition, we aimed to study the relationship between HMGCS1 mutations and expression levels. We found that the mRNA levels were different between gene‐altered and gene‐unaltered group (Figure 4D). However, there is no significant difference of protein level between HMGCS1 altered and unaltered group (Figure 4E). The mRNA expression of total 618 genes, consisting of 167 up‐regulated genes in the gene‐altered group and 451 up‐regulated genes in the gene‐unaltered group, were associated with HMGCS1 mutation (Figure 4F). Left panel of Figure 4G displayed the difference of mRNA expression between altered and unaltered group. The top 20 differentially expressed genes were also shown (Figure 4G, right panel). Furthermore, we compared the OS, DFS, disease‐specific survival, and PFS between patients with and without genetic alterations. Kaplan–Meier analysis revealed that there was no significant difference UCEC (Figure 4H). Together, these data suggested that HMGCS1 mutation was correlated with alterations of transcriptome and proteome in tumors. However, R277 mutation had no significant effect on the prognosis of UCEC.
Enrichment analysis of HMGCS1‐related partners
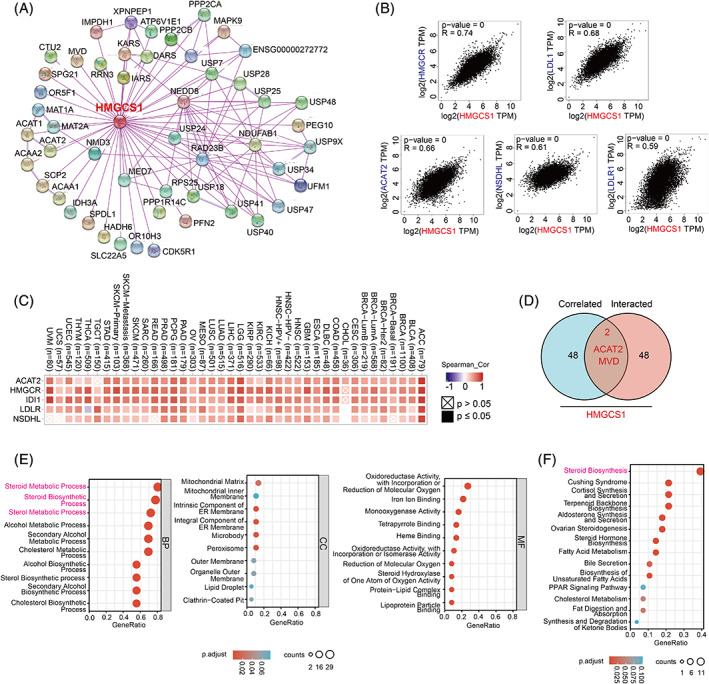
Next, we tried to find the HMGCS1‐binding proteins as well as the HMGCS1 expression‐correlated genes, and further conducted pathway enrichment analyses. First, we searched the PPI networks using STRING online tools, and screened out fifty HMGCS1‐binding proteins with the closest relationship (Figure 5A). In addition, GEPIA2 was utilized to obtain the top 50 HMGCS1 expression correlated genes. The top five genes were HMGCR, LDL1 (low‐density lipoprotein 1), ACAT2 (acetyl‐CoA acetyltransferase 2), NSDHL (NAD[P] dependent steroid dehydrogenase‐like), and LDLR1 (low‐density lipoprotein receptor 1) (Figure 5B), all of which were positively correlated with HMGCS1 in most cancer types (Figure 5C). An intersection analysis of top 50 members from STRING and GEPIA2 showed two common members, namely ACAT2 and MVD (Figure 5D). Further, we utilized these 98 members to conduct KEGG and GO enrichment analyses to establish the functions of HMGCS1. GO analysis showed that the top three enriched terms in the biological process ontology were steroid metabolic process, steroid biosynthetic process, and sterol metabolic process. For the cellular component ontology, the top three enriched terms included mitochondrial matrix, mitochondrial inner membrane, and intrinsic component of endoplasmic reticulum membrane. For the molecular function ontology, the top three terms were oxidoreductase activity, with incorporation or reduction of molecular oxygen; iron ion binding; and monooxygenase activity (Figure 6E). KEGG pathway analysis disclosed involvement of HMGCS1 in steroid biosynthesis, Cushing syndrome, cortisol synthesis and secretion, and so forth (Figure 6F).
The prediction of the correlation between HMGCS1 expression and drug sensitivity
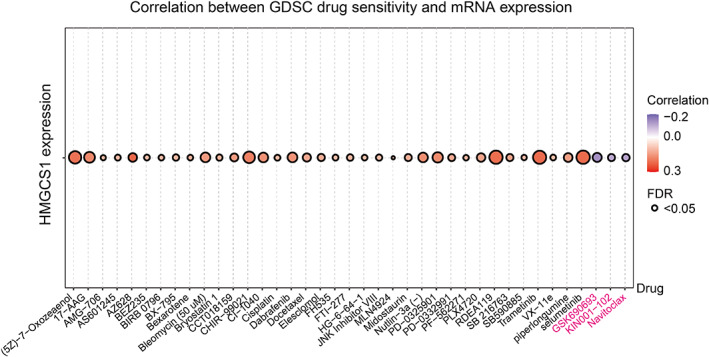
For drug sensitivity analysis, we conducted drug response predictions using the GDSC database. We assessed the correlation between HMGCS1 expression and IC50 values of molecules, and found that high HMGCS1 expression could reduce the drug sensitivity of most drugs. Interestingly, high expression of HMGCS1 enhanced the sensitivity to three drugs or small molecules, which included GSK690693, KIN001‐102, and navitoclax (Figure 6). These results indicated that HMGCS1 was a potential therapeutic target in cancer.
DISCUSSION AND CONCLUSION
Mounting evidence demonstrated a close link between HMGCS1 and the initiation and progression of various tumors.ref. cnr21562-bib-0014, ref. cnr21562-bib-0015, ref. cnr21562-bib-0016, ref. cnr21562-bib-0017 To elucidate the general role of HMGCS1 in different tumors, we conducted a pan‐cancer analysis of HMGCS1 in 33 different cancers based on the data from the most comprehensive database available, such as TCGA and CPTAC databases. We analyzed the gene expressions and genetic alterations of HMGCS1 in various caner types, and explored the impact of HMGCS1 on disease survival, IF and drug sensitivity.
HMGCS1 was highly expressed in multiple tumor types, such as tumors originated from alimentary tract, breast, and uterus (Figure 1D). Correlations of increased HMGCS1 expression with a shortened survival were seen in most types of cancer (Figure 2). In BRCA, both HMGCS1 mRNA and protein level were significantly elevated (Figure 1D, F). High HMGCS1 expression was closely correlated with poor OS as well as PFS (Figure 2). In addition, there was a positive correlation between the HMGCS1 expression and the EIV of CAF (Figure 3). Consistently, Walsh et al identified HMGCS1 as a specific marker of cancer stem cell, whose expression strikingly indicated aggressive feature of breast cancer.ref. cnr21562-bib-0006 Like BRCA, HMGCS1 expression was elevated and negatively associated with OS and PFS in tumors of uterus, including CESC and UCEC (Figure 1D and 2). In CESC, there was a significantly negative correlation between the HMGCS1 expression and IF of CD8+ T‐cells (Figure S3). Further study is warranted to understand more about the function of HMGCS1 in CESC and UCEC. Taken together, these data highlighted the oncogenic role of HMGCS1 in cancer.
Our data showed that HMGCS1 had increased mRNA expression in most alimentary tract related cancers, including COAD, ESCA, and READ, with a few exceptions like STAD (Figure 1D, E). For colon cancer, the HMGCS1 protein level was also elevated (Figure 1F). It is well known that RAS and RAF mutations are the most common genetic alteration in colon cancer (approximately 39%–53%), which are closely related to poor PFS, OS and nonresponse.ref. cnr21562-bib-0019 Previously, we reported that HMGCS1 was a synthetical partner of BRAFV600E‐expressing colon and melanoma cancer cells.ref. cnr21562-bib-0014 Sheng et al recently reported that HMGCS1 was overexpressed in colon cancer cells and tissues, promoting proliferation, migration, and invasion. Simultaneous targeting HMGCS1 could enhance the sensitivity of MEK inhibitor.ref. cnr21562-bib-0020 Thus, targeting HMGCS1 could overcome RAF/RAS mutation mediated drug resistance, which might be a promising therapeutic strategy for patients with colon cancer. Notably, I‐Han et al. reported higher HMGCS1 expression in STAD tumor cells (n = 261) and metastatic lymph nodes (n = 26) compared to adjacent corresponding control tissues (n = 261) using q‐PCR method.ref. cnr21562-bib-0015 However, in our study, the expression difference between control tissues (n = 32) and tumor tissues (n = 375) was not significant in STAD (p = 0.345), according to the TCGA data analysis (Figure 1D). The reason for the inconsistency may be the relatively small size of control sample in TCGA dataset. Interestingly, I‐Han et al. also discovered the nonmetabolic function of HMGCS1. Cytosolic HMGCS1 could translocate to nucleus and further bind and activated the promoters of downstream targets, contributing to the progression of gastric cancer.ref. cnr21562-bib-0015 In conclusion, HMGCS1 is a promising target in alimentary tract related cancers.
It is also noteworthy that HMGCS1 may exert oncogenic function in tumors without overexpression. For instance, HMGCS1 was not overexpressed in prostate cancer cells but was in stroma. Through an autocrine/paracrine mechanism, the stromal cells with increased HMGCS1 expression could promote the growth of prostate cancer cells.ref. cnr21562-bib-0021 Another example is AML. We have found that HMGCS1 was not significantly overexpressed in newly diagnosed AML patients. However, HMGCS1 expression was raised in refractory and relapsed AML, which played a vital role in reducing chemotherapy sensitivity (data not shown). More studies are required to understand the role of HMGCS1 in some tumors without elevated expression.
HMGCS1 was negatively correlated with both OS and DFS in LGG and KIRC. Currently, there is no report concerning about how HMGCS1 affects LGG. In KIRC, differential expression of HMGCS1 was reported by Huang et al..ref. cnr21562-bib-0022 By analyzing data from TCGA, they identified HMGCS1 as one of good prognosis biomarkers.ref. cnr21562-bib-0022 However, further research is needed to elucidate its role in KIRC.
Immune cells niched in the tumor microenvironment are closely linked to tumorigenesis.ref. cnr21562-bib-0023 CAF, differentiated from stroma cells, are potent tumor‐promoting cells. Their proliferation was positively correlated with HMGCS1 expression in multiple cancer types. However, the proliferations of tumor‐antagonizing cells, such as CD8+ T‐cells, were overall negatively correlated with HMGCS1 level (Figure 3 and S2). These results indicated the role of HMGCS1 in modulating tumor‐infiltrating immune cells, which has not been reported yet and require further exploration.
As shown in Figure 4, amplification was the most frequent genetic alteration in tumors, which was consistent with previous data, which showed that HMGCS1 was overexpressed and closely related with prognosis in multiple tumor types including COAD and UCEC. Mutations were seen in several cancer types, though at a quite low frequency. We found R277Q mutation in one case of UCEC, and R277W mutation in one case of COAD. By further analysis in UCEC, we found that this missense mutation did not show prominent impact on OS, DFS, and PFS. By consulting the uniport website and literature,ref. cnr21562-bib-0024, ref. cnr21562-bib-0025 we identified the active sites of HMGCS1, which included Glu95, Cys129, and His264, and the binding sites for Coenzyme A, which included Asn167, Ser221, Lys269, and Lys273. Currently, no mutation on these sites was found in tumors. The impact of R277Q mutation on prognosis was minimal, as the mutation seemed not to decrease the activity of HMGCS1. However, HMGCS1 mutation could cause obvious alterations in the expressions of multiple genes. It will be interesting to study the impact of these expression alterations on UCEC cancer cells.
As we can see in Figure 5, HMGCS1 was closely correlated and interacted with ACAT2 and MVD. All of three are involved in the MVA pathway and regulated by sterol regulatory element binding protein 2 (SREBP2).ref. cnr21562-bib-0026 It has been reported that, after statin treatment, cancer cells could sustain the MVA metabolism by upregulating the expression of other genes in the MVA pathway via the feedback regulation of SREBP2.ref. cnr21562-bib-0027 As MVA pathway is complicatedly intertwined, combined inhibition of multiple targets may enhance the cytotoxicity effects. Furthermore, enrichment analysis indicated a prominent role of HMGCS1 in steroid metabolism (Figure 5F). It is widely known that MVA‐derived steroids are the raw material for the synthesis of many gonadal steroid hormones, contributing to the development and progression of hormone dependent tumors such as prostate and breast cancer.ref. cnr21562-bib-0028, ref. cnr21562-bib-0029 As mentioned before, several reports have demonstrated the oncogenic role of HMGCS1 in prostate and breast cancer. Besides, steroid biosynthesis has been shown to play a central role in T cells to achieve immune evasion.ref. cnr21562-bib-0030 In conclusion, HMGCS1 is a promising target in cancer treatment.
High HMGCS1 expression could reduce the sensitivity of many drugs, indicating its potential role in drug resistance. However, HMGCS1 enhanced the sensitivity of GSK690693, KIN001‐102, and navitoclax (Figure 6). GSK690693 and KIN001‐102 are Akt inhibitors, while navitoclax is a BCL‐2 inhibitor. This finding sheds lights on the potential clinical application of these drugs to overcome HMGCS1 mediated drug resistance. Hymeglusin is the specific HMGCS1 inhibitor,ref. cnr21562-bib-0031 which functions through binding to Cys‐129.ref. cnr21562-bib-0025 We have proved its functions of suppressing cell growth and promoting apoptosis (data not shown). Further studies are required to know more about its functions and sides effects.
There were several limitations about our study. The evaluation of HMGCS1 alone may not recapitulate the whole characteristics of the MVA pathway. Therefore, it is important to further explore other vital genes and metabolites in this pathway to comprehensively uncover the function of MVA pathway in pan‐cancer. Additionally, a negative correlation between HMGCS1 expression and survival outcomes was presented after data analysis in this study. To make the conclusion more convincing, more basic and clinical research were needed. Furthermore, according to our and others previous reports, HMGCS1 also had impacts on cell proliferation, apoptosis, and immunity. The detailed mechanisms needed to be studied further.
Taken together, our pan‐cancer analysis provides a broad perspective of the oncogenic roles of HMGCS1 across different tumors and points out new directions for the treatment of cancer.
CONFLICT OF INTEREST
The authors declare that they have no conflict of interest.
AUTHOR CONTRIBUTIONS
C.Z.; Conceptualization (lead); data curation (lead); writing – original draft (equal). Z.W.; Conceptualization (equal); data curation (equal); funding acquisition (equal); writing – original draft (equal). Y.C.; Data curation (supporting). L.Z.; Conceptualization (supporting); funding acquisition (lead); supervision (lead); writing – review and editing (lead).
ETHICS STATEMENT
This study is exempt from institutional review board approval.
References
- Transcriptional landscape of human cancers.. Oncotarget., 2017. [PubMed]
- A pan‐cancer analysis of the oncogenic role of staphylococcal nuclease domain‐containing protein 1 (SND1) in human tumors.. Genomics., 2020. [PubMed]
- The mevalonate pathway, a metabolic target in cancer therapy.. Front Oncol., 2021. [PubMed]
- Network analysis of the MVA and MEP pathways for isoprenoid synthesis.. Annu Rev Plant Biol., 2013. [PubMed]
- The interplay between mutant p53 and the mevalonate pathway.. Cell Death Differ., 2018. [PubMed]
- The mevalonate precursor enzyme HMGCS1 is a novel marker and key mediator of cancer stem cell enrichment in luminal and basal models of breast cancer.. PLoS One., 2020. [PubMed]
- The interplay between cell signalling and the mevalonate pathway in cancer.. Nat Rev Cancer., 2016. [PubMed]
- The roles of cholesterol and its metabolites in Normal and malignant hematopoiesis.. Front Endocrinol (Lausanne)., 2019. [PubMed]
- Role of de novo cholesterol synthesis enzymes in cancer.. J Cancer., 2020. [PubMed]
- Protein prenylation: unique fats make their mark on biology.. Nat Rev Mol Cell Biol., 2016. [PubMed]
- The potential of the mevalonate pathway for enhanced isoprenoid production.. Biotechnol Adv., 2016. [PubMed]
- Mevalonate metabolism in cancer.. Cancer Lett., 2015. [PubMed]
- Regulation of mevalonate metabolism in cancer and immune cells.. Biochim Biophys Acta., 2013. [PubMed]
- HMG‐CoA synthase 1 is a synthetic lethal partner of BRAF(V600E) in human cancers.. J Biol Chem., 2017. [PubMed]
- Mevalonate pathway enzyme HMGCS1 contributes to gastric Cancer progression.. Cancers (Basel)., 2020
- Sevoflurane suppresses cell viability and invasion and promotes cell apoptosis in colon cancer by modulating exosome‐mediated circ‐HMGCS1 via the miR‐34a‐5p/SGPP1 axis.. Oncol Rep., 2020. [PubMed]
- The STAT3‐miR‐223‐TGFBR3/HMGCS1 axis modulates the progression of cervical carcinoma.. Mol Oncol., 2020. [PubMed]
- Dysregulation of the mevalonate pathway promotes transformation.. Proc Natl Acad Sci U S A., 2010. [PubMed]
- BRAF, PIK3CA, and PTEN mutations: implications for targeted therapies in metastatic colorectal cancer.. Lancet Oncol., 2011. [PubMed]
- Dipyridamole enhances the Cytotoxicities of Trametinib against Colon Cancer cells through combined targeting of HMGCS1 and MEK pathway.. Mol Cancer Ther., 2020. [PubMed]
- Stromal regulation of prostate cancer cell growth by mevalonate pathway enzymes HMGCS1 and HMGCR.. Oncol Lett., 2017. [PubMed]
- MicroRNA related prognosis biomarkers from high throughput sequencing data of kidney renal clear cell carcinoma.. BMC Med Genomics., 2021. [PubMed]
- Immune cells within the tumor microenvironment: biological functions and roles in cancer immunotherapy.. Cancer Lett., 2020. [PubMed]
- Crystal structures of human HMG‐CoA synthase isoforms provide insights into inherited ketogenesis disorders and inhibitor design.. J Mol Biol., 2010. [PubMed]
- Binding site for fungal beta‐lactone hymeglusin on cytosolic 3‐hydroxy‐3‐methylglutaryl coenzyme a synthase.. Biochim Biophys Acta., 2004. [PubMed]
- Targeting SREBP‐2‐regulated mevalonate metabolism for Cancer therapy.. Front Oncol., 2020. [PubMed]
- Immediate utility of two approved agents to target both the metabolic mevalonate pathway and its restorative feedback loop.. Cancer Res., 2014. [PubMed]
- Targeting steroid hormone receptor pathways in the treatment of hormone dependent cancers.. Curr Pharm Biotechnol., 2004. [PubMed]
- Molecular pathways: inhibiting steroid biosynthesis in prostate cancer.. Clin Cancer Res., 2013. [PubMed]
- Tumors induce de novo steroid biosynthesis in T cells to evade immunity.. Nat Commun., 2020. [PubMed]
- Inhibition of hydroxymethylglutaryl‐coenzyme a synthase by L‐659,699.. Proc Natl Acad Sci U S A., 1987. [PubMed]