
Clinical significance and functional characterization of RRN3 in gastric cancer: insights from pan-cancer analysis and experimental validation
Abstract
Introduction:
RRN3 is a nucleolar protein required for ribosome biogenesis, but its role in cancer remains insufficiently defined. This study aimed to systematically evaluate the clinical relevance, molecular characteristics, immune-related features, and biological function of RRN3 across cancers, with a particular focus on gastric cancer (GC).
Methods:
Public databases were used to analyze RRN3 expression, clinicopathological associations, survival outcomes, ROC curves, genomic alterations, epigenetic and epitranscriptomic features, immune-related characteristics, drug-response profiles, and co-expression networks. Functional enrichment analysis and a putative ceRNA regulatory network were further explored. Clinical tissue validation, in vitro rescue experiments, and in vivo xenograft assays were used to evaluate the involvement of RRN3 in GC progression.
Results:
Pan-cancer analysis showed that RRN3 was upregulated in multiple tumor types, including GC, and that high RRN3 expression was associated with unfavorable overall survival in several cancers. In GC, RRN3 expression was associated with RNA methylation regulators, immune checkpoint genes, tumor mutation burden, microsatellite instability, immune cell infiltration, and drug-response-related signatures. Enrichment analyses suggested that RRN3-associated genes were mainly involved in nucleocytoplasmic transport, spliceosome function, mRNA surveillance, and ribosome biogenesis. Clinical validation showed that RRN3 was upregulated in GC tissues and associated with several clinicopathological features related to tumor progression. Functional experiments showed that RRN3 knockdown inhibited GC cell proliferation, colony formation, migration, and invasion, whereas RRN3 re-expression partly reversed these effects. In vivo xenograft experiments further supported the role of RRN3 in promoting tumor growth.
Discussion:
These findings suggest that RRN3 is associated with GC progression and may represent a candidate molecule for further investigation in GC.
Article type: Research Article
Keywords: gastric cancer, immune infiltration, pan-cancer analysis, prognosis, ribosome biogenesis, RRN3
Affiliations: Department of Gastrointestinal Surgery 2 Section, The First Affiliated Hospital of Fujian Medical University, Fuzhou, China; Key Laboratory of Gastrointestinal Cancer (Fujian Medical University), Ministry of Education, Fuzhou, China; Department of Internal Medicine-Oncology, Fujian Cancer Hospital and Fujian Medical University Cancer Hospital, Fuzhou, China; Department of Gastrointestinal Surgery, National Regional Medical Center, Binhai Campus of the First Affiliated Hospital, Fujian Medical University, Fuzhou, China; Department of Urology, Fuzhou Hospital of Traditional Chinese Medicine Affiliated to Fujian University of Traditional Chinese Medicine, Fuzhou, China; Department of Gastrointestinal Surgical Oncology, Clinical Oncology School of Fujian Medical University, Fujian Cancer Hospital, Fuzhou, China
License: Copyright © 2026 He, Xing, Liu, Lin, Lin and Ye. CC BY 4.0 This is an open-access article distributed under the terms of the Creative Commons Attribution License (CC BY). The use, distribution or reproduction in other forums is permitted, provided the original author(s) and the copyright owner(s) are credited and that the original publication in this journal is cited, in accordance with accepted academic practice. No use, distribution or reproduction is permitted which does not comply with these terms.
Article links: DOI: 10.3389/fonc.2026.1832473 | PMC: PMC13213868
Relevance: Moderate: mentioned 3+ times in text
Full text: PDF (14.0 MB)
Introduction
Gastric cancer (GC) remains one of the leading causes of cancer-related mortality worldwide, particularly imposing a high disease burden in developing countries (ref. 1–ref. 3). Owing to its insidious onset and marked metastatic potential, most GC cases are diagnosed at advanced stages, which markedly limits the effectiveness of current therapeutic strategies. Although endoscopic and imaging techniques are available for early detection, their sensitivity, specificity, and accessibility remain suboptimal. Therefore, the identification of novel molecular factors associated with GC progression remains important for improving early diagnosis and expanding therapeutic options for GC.
RRN3, also known as TIF-IA, is a critical regulatory factor in ribosomal RNA (rRNA) transcription. As a transcription initiation factor for RNA polymerase I (Pol I), RRN3 recruits Pol I to ribosomal DNA (rDNA) promoter regions to initiate rRNA transcription, thereby playing an essential role in ribosome biogenesis and cell proliferation (ref. 4, ref. 5). Dysregulation of the RRN3/Pol I axis has been implicated in several pathological processes, including neurological disorders and cellular stress responses (ref. 6–ref. 8). Recent studies have also linked abnormal ribosome biogenesis and Pol I transcriptional activity to cancer progression (ref. 9). RRN3 may contribute to this process because of its central role in Pol I-dependent rRNA transcription. For example, elevated RRN3 expression has been associated with enhanced proliferation, invasiveness, chemoresistance, and poor prognosis in pancreatic cancer (ref. 10). CX-5461, a selective Pol I inhibitor, suppresses RRN3-dependent transcription initiation, leading to reduced rRNA synthesis, nucleolar stress, DNA damage, and cancer cell death (ref. 11). In colorectal cancer, pharmacological doses of aspirin have been shown to induce RRN3 degradation, inhibit rDNA transcription, and promote tumor cell apoptosis (ref. 12). In addition, RRN3 has been reported to function as a downstream effector of c-Myc-mediated metabolic activation and ribosome biogenesis in medulloblastoma (ref. 13). More recently, EGR1 was shown to promote Pol I-directed transcription and cancer cell growth partly by activating RRN3 expression, further supporting the relevance of RRN3-related transcriptional regulation in cancer (ref. 14). In addition to its canonical role in rRNA transcription, recent evidence suggests that RRN3 may also participate in stress-induced RNA processing programs. For example, nutrient stress was reported to divert RRN3 from rRNA transcription to alternative polyadenylation regulation of autophagy-related mRNAs in ovarian cancer (ref. 15).
With the rapid development of multi-omics datasets and computational biology tools, pan-cancer analysis has become a powerful strategy for investigating gene expression patterns, genetic alterations, clinical relevance, and immune characteristics across different tumor types (ref. 16–ref. 19). Compared with studies focused on a single cancer type, pan-cancer analyses provide broader insights into shared oncogenic mechanisms and tumor-specific pathways, thereby offering a systematic framework for biomarker discovery and hypothesis generation. Given its conserved role in ribosome biogenesis and the frequent activation of rRNA transcription in highly proliferative tumors, RRN3 represents a biologically relevant candidate for investigation across multiple cancer types.
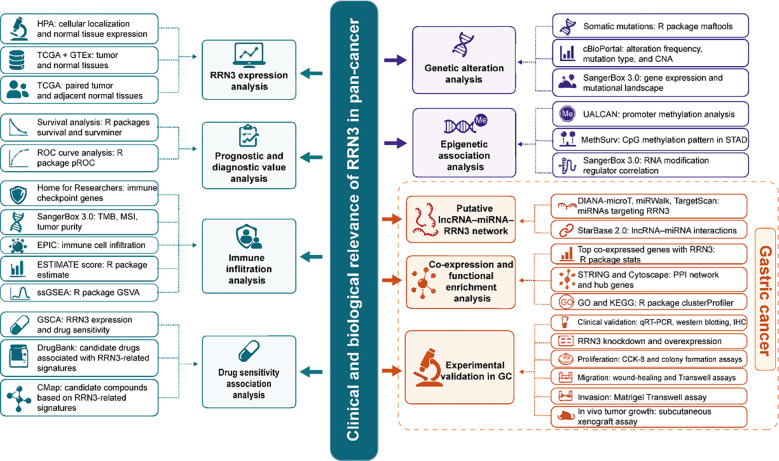
Although previous studies have suggested a potential role for RRN3 in cancer (ref. 20–ref. 22), its clinical relevance and biological function in GC remain poorly understood, particularly from a pan-cancer perspective. In this study, we systematically analyzed RRN3 expression across multiple tumor types and evaluated its clinicopathological relevance, survival, and ROC curve profiles. We further investigated genomic alterations, epigenetic features, immune-related characteristics, drug sensitivity associations, and co-expression patterns related to RRN3, and constructed a putative ceRNA regulatory network in GC. In addition, clinical tissue validation, functional enrichment analysis, in vitro rescue experiments, and in vivo xenograft experiments were performed to further assess the role of RRN3 in GC progression. This study aimed to evaluate the clinical and biological relevance of RRN3 in cancer, with a particular focus on GC. The overall study design is shown in f1.
Materials and methods
Subcellular localization and expression of RRN3
To investigate the subcellular localization of RRN3 protein, we retrieved immunofluorescence images from the HPA database for HEK293, MCF-7, and U2OS cell lines. We also used the GTEx data integrated in the HPA database to analyze RRN3 mRNA expression across normal human tissues. For differential expression analysis between normal and tumor tissues, we acquired uniformly processed RNA sequencing data in Transcripts Per Million (TPM) format from TCGA and GTEx cohorts via the UCSC XENA platform (https://xenabrowser.net/datapages/), with preprocessing conducted using the Toil pipeline. Expression values were transformed using the formula log2(TPM + 1). Comparisons between tumor and normal tissues were based on the combined TCGA-GTEx dataset, while matched tumor-adjacent normal tissue comparisons were restricted to paired samples from TCGA. All statistical analyses were conducted in R software utilizing the stats, car, and ggplot2 packages. Group differences were assessed using the Wilcoxon rank-sum test, and results were visualized accordingly. To further investigate the relationship between RRN3 expression and tumor stage, we utilized the “Stage Plot” module available on the GEPIA2 platform.
Survival and ROC curve analyses of RRN3
RNA-seq data in TPM format from the TCGA cohort were retrieved and log2-transformed as log2(TPM + 1). The Xiantao platform was used to perform survival and ROC curve analyses of RRN3 across multiple cancer types. For survival analysis, Cox regression models were applied to assess the association between RRN3 expression and patient survival, and hazard ratios (HRs), 95% confidence intervals (CIs), and P-values were visualized using forest plots. Kaplan–Meier survival curves were generated to compare survival outcomes between the high- and low-RRN3-expression groups, and statistical significance was determined using the log-rank test. ROC curves were used to evaluate the ability of RRN3 expression to distinguish tumor tissues from normal tissues, and the area under the curve (AUC) was calculated for each cancer type. An AUC > 0.75 was considered to indicate relatively good tumor-normal separation in the analyzed datasets.
Genetic alteration analysis of RRN3
The genetic alteration landscape of RRN3 was analyzed using cBioPortal based on data from TCGA and the Pan-Cancer Analysis of Whole Genomes (PCAWG) project of the International Cancer Genome Consortium (ICGC). A total of 2,683 samples from 2,565 patients were included in the analysis. Using the “Cancer Types Summary” module, we examined the mutation types, copy number alterations (CNAs), and alteration frequencies of RRN3 across the TCGA PanCancer Atlas studies. The “Plots” module was used to evaluate the association between RRN3 mRNA expression and CNAs. Somatic mutation data for stomach adenocarcinoma (STAD) were further obtained from the TCGA cohort. STAD samples were divided into high- and low-RRN3-expression groups according to RRN3 expression levels. The SangerBox 3.0 platform was then used to explore the associations between RRN3 expression and mutations in key cancer-related genes. Differences in mutation frequencies between the two groups were assessed using the chi-square test.
DNA methylation and mRNA modification analysis
The DNA methylation level of the RRN3 promoter in normal and tumor tissues across multiple cancer types was evaluated using UALCAN based on TCGA methylation data. Methylation levels were quantified using β-values, with values ranging from 0.25 to 0.30 considered indicative of hypomethylation and values ranging from 0.50 to 0.70 considered indicative of hypermethylation. Statistical significance was assessed using the Wilcoxon rank-sum test. For stomach adenocarcinoma (STAD), the “Gene Visualization” module in MethSurv was used to generate detailed plots and heatmaps of methylation levels at RRN3 CpG sites. This site-specific CpG methylation analysis was performed as an exploratory analysis of methylation patterns within the RRN3 promoter region.
The mRNA Modification Analysis module of the SangerBox 3.0 platform was used to investigate the associations between RRN3 and 45 RNA methylation regulators across multiple cancer types. This analysis was based on RNA-seq data from the combined TCGA–GTEx dataset after log2(x + 1) normalization. Pearson correlation coefficients were calculated to evaluate the expression correlations between RRN3 and RNA methylation regulators.
Immune-related correlation analysis of RRN3
To investigate the immune-related associations of RRN3, the “Pan-Cancer Immuno-Correlation” module on the Home-for-Researchers platform was used to analyze the correlations between RRN3 expression and eight immune checkpoint genes across TCGA cancer types. The “Pan-Cancer Heterogeneity Analysis” module in SangerBox 3.0 was used to evaluate the associations between RRN3 expression and tumor mutation burden (TMB), microsatellite instability (MSI), and tumor purity across multiple cancers. To further assess the association between RRN3 expression and immune cell infiltration, the “Immune Cell Analysis (EPIC)” tool in SangerBox 3.0 was applied using uniformly processed TCGA-TARGET-GTEx (PANCAN) data obtained from UCSC Xena. Gene expression matrices were transformed as log2(TPM + 1) and mapped to Gene Symbols. Immune and stromal cell infiltration scores were calculated using the deconvo_epic function in the IOBR R package. For stomach adenocarcinoma (STAD), the ESTIMATE R package was used to calculate ESTIMATE scores, which reflect tumor purity, stromal content, and immune infiltration based on gene expression data. STAD samples were subsequently divided into high- and low-RRN3-expression groups. Immune cell infiltration in STAD was further assessed using the single-sample Gene Set Enrichment Analysis (ssGSEA) algorithm implemented in the GSVA R package, based on gene signatures for 24 immune cell types. Enrichment scores were calculated for each immune cell type, and differences between the high- and low-RRN3-expression groups were compared to explore immune-related features associated with RRN3 expression.
Drug response association analysis
The association between RRN3 expression and drug sensitivity was systematically evaluated using the GSCALite platform, which integrates data from the GDSC and CTRP databases. FDA-approved drugs potentially associated with RRN3 were identified using DrugBank, and drug–gene interactions were visualized with Cytoscape (version 3.7.2). To identify small-molecule compounds potentially associated with RRN3-related transcriptional signatures, differential expression analysis between the high- and low-RRN3-expression groups was performed using DESeq2 in R based on TCGA RNA-seq data. The top 100 upregulated and top 100 downregulated genes were then submitted to the Connectivity Map (CMap) database to identify candidate compounds associated with RRN3-related transcriptional profiles.
Construction of the lncRNA–miRNA–RRN3 regulatory network
Potential miRNAs targeting RRN3 were predicted by integrating data from the DIANA-microT, miRWalk, and TargetScan databases. Only miRNAs identified by all three databases were retained for subsequent analysis. Interactions between these miRNAs and their potential upstream lncRNAs were further explored using the StarBase v2.0 database, and expression correlations were also evaluated. The analysis was restricted to Homo sapiens (genome version hg19), with a minimum of five supporting CLIP-seq datasets, and RNA degradation data were included when available. Sankey diagrams illustrating miRNA–lncRNA interactions were generated using the Xiantao bioinformatics platform. A putative lncRNA–miRNA–RRN3 regulatory network was then constructed and visualized using Cytoscape.
Co-expression and functional enrichment analysis of RRN3
RNA-seq data from the TCGA cohort were analyzed using the stats package in R to identify genes co-expressed with RRN3. Genes with a Pearson correlation coefficient > 0.3 and a P-value < 0.05 were considered significantly correlated and were visualized using heatmaps. The top 100 positively correlated genes were submitted to the STRING database to construct a protein–protein interaction (PPI) network, and core modules and hub genes were identified using MCODE and CytoHubba in Cytoscape. In addition, the top 300 positively correlated genes were subjected to Gene Ontology (GO) and Kyoto Encyclopedia of Genes and Genomes (KEGG) enrichment analyses to explore RRN3-related biological processes and pathways.
Patients and specimens
A total of 30 gastric cancer patients who underwent surgical resection at the First Affiliated Hospital of Fujian Medical University between March 2011 and March 2016 were included in this study. Paired GC tissues and matched adjacent normal tissues were collected from these patients. Among these paired samples, 30 pairs were used for qRT-PCR analysis, six pairs were used for western blotting, and formalin-fixed paraffin-embedded sections from 30 paired GC and adjacent normal tissues were used for immunohistochemical analysis. None of the enrolled patients received preoperative radiotherapy or chemotherapy.
Clinicopathological information, including age, sex, pathological stage, depth of tumor invasion, lymph node metastasis, tumor differentiation, vascular invasion, perineural invasion, Lauren classification, growth pattern, and H. pylori infection status, was collected from electronic medical records and postoperative pathological reports. Lauren classification, growth pattern, and H. pylori infection status were extracted from postoperative pathological reports. The histopathological features were reviewed by two experienced pathologists who were blinded to RRN3 staining results. The use of these archived clinical specimens and clinical data was approved by the Ethics Committee of the First Affiliated Hospital of Fujian Medical University [approval number: 2018(030)]. Written informed consent was obtained from all patients. This study was conducted in accordance with the Declaration of Helsinki.
Cell culture and lentiviral transduction
The human GC cell lines AGS and MKN45 were obtained from the Chinese Academy of Sciences (Shanghai, China). The normal gastric epithelial cell line GES-1 was used as a non-malignant control. AGS cells were cultured in F-12 medium, whereas GES-1 and MKN45 cells were maintained in RPMI-1640 medium. Both media were supplemented with 10% fetal bovine serum (FBS), penicillin, and streptomycin, and cells were cultured at 37 °C in a humidified incubator with 5% CO2.
Two independent shRNA lentiviral vectors targeting regions outside the coding sequence of RRN3 and the corresponding negative control vector (LV-Ctrl) were purchased from GeneChem (Shanghai, China).
The shRNA target sequences were:
sh-RRN3#1, 5′-GGAAGGATTTGCTTGTTTAAT-3′;
sh-RRN3#2, 5′-GGGACTTCAGAGACCAATAAA-3′.
Lentiviral particles were generated by co-transfecting HEK293T cells with the expression vector together with packaging and envelope plasmids. Forty-eight hours after transfection, viral supernatants were collected and used to infect target cells. Stably transduced cells were selected with puromycin to establish RRN3 knockdown cell lines.
For rescue experiments, RRN3 was re-expressed by transfection with the pCDH-RRN3 plasmid, which contains the RRN3 coding sequence. The pCDH-RRN3 plasmid was also purchased from GeneChem (Shanghai, China). Because the shRNA target sequences were located outside the coding sequence of RRN3, the exogenous RRN3 transcript was not targeted by these shRNAs. RRN3 knockdown and overexpression were verified by western blotting.
Quantitative real-time PCR
To evaluate RRN3 mRNA expression levels in clinical tissue samples and cell lines, total RNA was extracted using TRIzol reagent (Life Technologies, USA) according to the manufacturer’s instructions. Complementary DNA (cDNA) was synthesized using the Evo M-MLV RT Kit (AG11707, Accurate Biology, China). Quantitative real-time PCR was then performed using the SYBR Green Premix Pro Taq HS qPCR Kit (AG11701, Accurate Biology, China) on a real-time PCR system. GAPDH was used as the internal control, and relative expression levels were calculated using the 2^−ΔΔCt method. The primer sequences were as follows: RRN3 forward, 5′-ACTGGCTGCTAGAATTCCGTT-3′; reverse, 5′-AACTGTACATGGCAGGAGGC-3′. GAPDH forward, 5′-GTCTCCTGCGACTTCAACAGCA-3′; reverse, 5′-ACCACCCTGTTGCTGTAGCCGT-3′.
Western blotting
Total protein was extracted from clinical tissue samples and cultured cells and quantified using the BCA Protein Assay Kit (P0010, Beyotime, China). Equal amounts of protein (50 μg per lane) were separated by 10% SDS-PAGE. Electrophoresis was performed at 90 V for 30 min and then at 110 V until adequate protein separation was achieved. Proteins were subsequently transferred onto methanol-activated PVDF membranes at 110 V for 1 h at 4 °C. The membranes were blocked with 5% non-fat milk for 1 h and then incubated overnight at 4 °C with primary antibodies against RRN3 (rabbit, 25918-1-AP, 1:1000, Proteintech), Beta Actin (mouse, 66009-1-Ig, 1:20000, Proteintech) and Beta Tubulin (rabbit, 10094-1-AP, 1:2000, Proteintech). After washing three times with TBST (10 min each), the membranes were incubated with HRP-conjugated secondary antibodies (goat anti-rabbit IgG, RGAR001, 1:3000; goat anti-mouse IgG, SA00001-1, 1:2000) for 1 h at room temperature. Protein bands were visualized using an enhanced chemiluminescence (ECL) detection system. Band intensities were quantified using ImageJ software and normalized to Beta Actin or Beta Tubulin.
Cell proliferation and colony formation assays
Cell proliferation was assessed using the Cell Counting Kit-8 (CCK-8; Dojindo, Japan). Briefly, 1,000 cells per well were seeded into 96-well plates and cultured at 37 °C in a humidified incubator with 5% CO2. At the indicated time points (0, 24, 48, 72, and 96h), CCK-8 working solution was added to each well and incubated for 2 h, after which absorbance was measured at 450 nm. For the colony formation assay, 1000 cells were seeded into each well of 6-well plates and cultured under standard conditions for 2 weeks. The colonies were then fixed with methanol, stained with crystal violet, and colonies containing more than 50 cells were counted.
Wound healing assay
AGS and MKN45 cells from the control, RRN3-knockdown, and RRN3-rescue groups were seeded into 6-well plates at a density of 1.0 × 10⁶ cells per well and cultured at 37 °C in a humidified incubator with 5% CO2. When the cells reached approximately 90% confluence, a linear wound was created using a sterile 200 μL pipette tip. After washing with PBS to remove detached cells, the cultures were maintained in serum-free medium. Images of the wound area were captured at 0 and 24 h under a light microscope, and the wound closure rate was calculated accordingly.
Transwell migration and invasion assays
Transwell migration and invasion assays were performed using AGS and MKN45 cells from the control, RRN3-knockdown, and RRN3-rescue groups. For the migration assay, cells suspended in serum-free medium were seeded into the upper chamber of Transwell inserts, whereas the lower chamber was filled with F-12 or RPMI-1640 medium containing 20% FBS as a chemoattractant. After 48 h of incubation, the cells were fixed with methanol and stained with crystal violet. Non-migrated cells on the upper surface of the membrane were gently removed, and the migrated cells on the lower surface were counted under an inverted microscope. For the invasion assay, the upper chamber was precoated with Matrigel, while the remaining procedures were performed as described for the migration assay.
Immunohistochemistry
Immunohistochemistry was performed on formalin-fixed paraffin-embedded tissue sections. Briefly, tissue sections were deparaffinized, rehydrated, and subjected to antigen retrieval using citrate buffer. Endogenous peroxidase activity was blocked with hydrogen peroxide, and nonspecific binding was blocked with normal serum. The sections were then incubated overnight at 4 °C with an anti-RRN3 antibody (rabbit, 25918-1-AP, 1:1000, Proteintech), followed by incubation with a secondary antibody. The signal was developed using DAB, and the sections were counterstained with hematoxylin.
RRN3 immunostaining was evaluated according to staining intensity and the percentage of positive tumor cells. Staining intensity was scored as 0, negative; 1, weak; 2, moderate; and 3, strong. The percentage of positive cells was scored as 0, 0%; 1, 1–25%; 2, 26–50%; 3, 51–75%; and 4, 76–100%. The final IHC score was calculated by multiplying the intensity score by the percentage score. The staining results were independently evaluated by two investigators who were blinded to the clinicopathological data.
Tumor xenografts
All animal experiments were conducted in accordance with the Guidelines for the Care and Use of Laboratory Animals of the NIH. The experiments were performed at the Animal Experiment Center of Fujian Medical University and approved by the Institutional Animal Care and Use Committee of Fujian Medical University (IACUC FJMU 2023-Y0735).
For the subcutaneous xenograft assay, BALB/c nude mice were randomly divided into different groups, with five mice per group. In brief, 5 × 10⁶ stably transfected GC cells with RRN3 overexpression, RRN3 knockdown, or corresponding control treatment were suspended in PBS and subcutaneously injected into the right axillary region of nude mice. Tumor length (L) and width (W) were measured every 3 days using calipers, and tumor volume was calculated using the formula: volume = 0.5 × L × W². At 21 days after tumor implantation, the mice were euthanized, and the tumors were harvested, photographed, weighed, and subjected to further analysis.
Statistical analysis
Bioinformatic analyses were performed using the above-mentioned online platforms and R software (version 4.2.1). Statistical analyses of the experimental data were conducted using GraphPad Prism 10 (GraphPad Software, La Jolla, CA, USA). Data are presented as the mean ± standard deviation (SD). Differences between two groups were assessed using Student’s t-test. Associations between RRN3 expression and clinicopathological parameters were analyzed using the chi-square test or Fisher’s exact test, as appropriate. A two-sided P < 0.05 was considered statistically significant. Statistical significance is indicated as follows: *P < 0.05, **P < 0.01, ***P < 0.001, and ****P < 0.0001.
Results
Subcellular localization of RRN3 protein and expression of RRN3
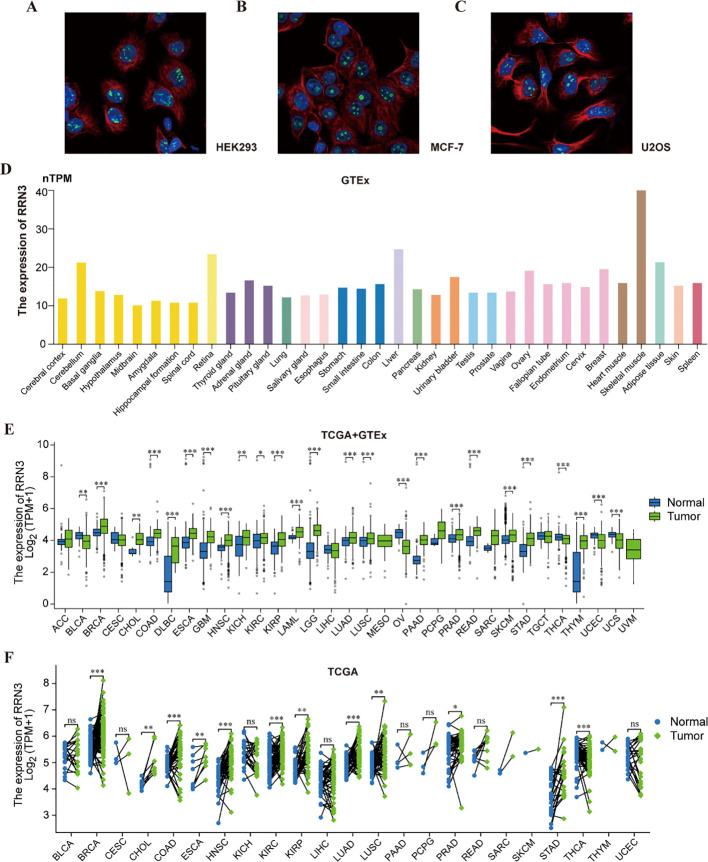
Subcellular localization analysis showed that RRN3 was predominantly localized to the perinucleolar region (f2). Data from the HPA database indicated that RRN3 was widely expressed across normal human tissues, with relatively high levels in the retina, liver, and skeletal muscle (f2; Supplementary Table 1). Integrated TCGA and GTEx analyses demonstrated that RRN3 expression was significantly upregulated (P < 0.05) in multiple cancer types, including BRCA, CHOL, COAD, DLBC, ESCA, GBM, KICH, KIRP, LAML, LGG, LUAD, LUSC, PRAD, READ, SKCM, STAD, THYM, PAAD, and HNSC, whereas decreased expression was observed in BLCA, OV, UCS, THCA, and UCEC (f2; Supplementary Table 2). Analysis of paired TCGA samples further confirmed significant differences in RRN3 expression between tumor tissues and adjacent normal tissues in BRCA, CHOL, COAD, ESCA, HNSC, KIRC, KIRP, LUAD, LUSC, PRAD, STAD, and THCA (f2; Supplementary Table 3). In addition, GEPIA2 analysis revealed a significant association between RRN3 expression and tumor stage in KIRP and OV (P < 0.05; Supplementary Figure 1). Collectively, these findings indicate that RRN3 is predominantly localized to the perinucleolar region, is broadly expressed in normal tissues, and is aberrantly expressed in multiple cancer types, including GC.
Association of RRN3 expression with survival outcomes and ROC curve profiles across cancers
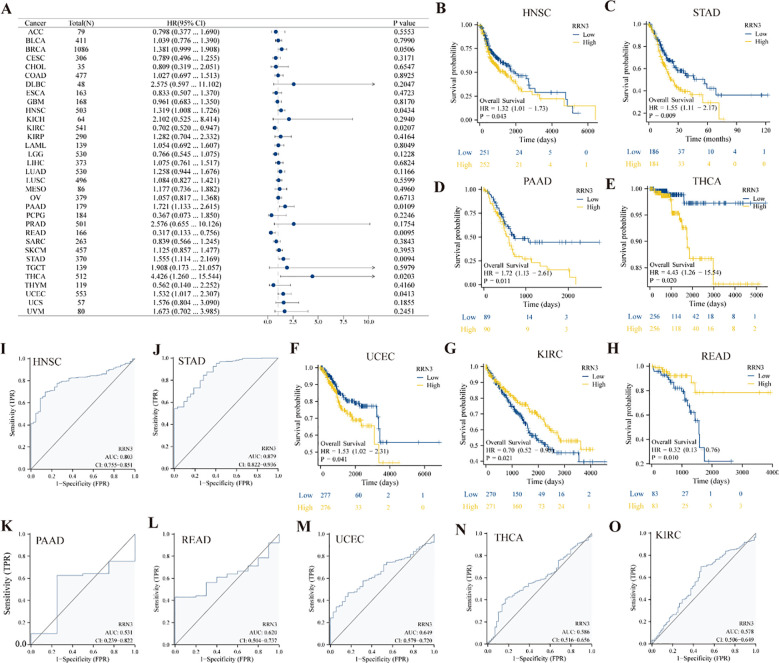
Cox proportional hazards regression analysis showed that high RRN3 expression was associated with unfavorable survival outcomes in multiple cancer types, with statistically significant associations observed in PAAD and STAD (P < 0.05, HR > 1) (f3). In contrast, elevated RRN3 expression was associated with favorable survival outcomes in KIRC and READ (P < 0.05, HR < 1). Kaplan–Meier survival analysis further showed that high RRN3 expression was associated with unfavorable overall survival in several malignancies, including HNSC (f3; P = 0.043), STAD (f3; P = 0.009), PAAD (f3; P = 0.011), THCA (f3; P = 0.020), and UCEC (f3; P = 0.041). In contrast, in KIRC (f3; P = 0.021) and READ (f3, P = 0.010), low RRN3 expression was associated with poorer overall survival, suggesting that the association between RRN3 expression and survival outcomes may vary across tumor types. To evaluate the ability of RRN3 expression to distinguish tumor tissues from normal tissues in public datasets, receiver operating characteristic (ROC) curves were constructed for each cancer type. The results showed that RRN3 had relatively high AUC values in HNSC (AUC = 0.803; f3) and STAD (AUC = 0.879; f3). In PAAD, READ, UCEC, THCA, and KIRC, the AUC values were lower than 0.75, suggesting weaker tumor-normal separation in these cancer types (f3). Collectively, these findings indicate that RRN3 expression is associated with survival outcomes across multiple cancer types and shows tumor-normal separation ability in GC public datasets.
Genetic alteration analysis of RRN3
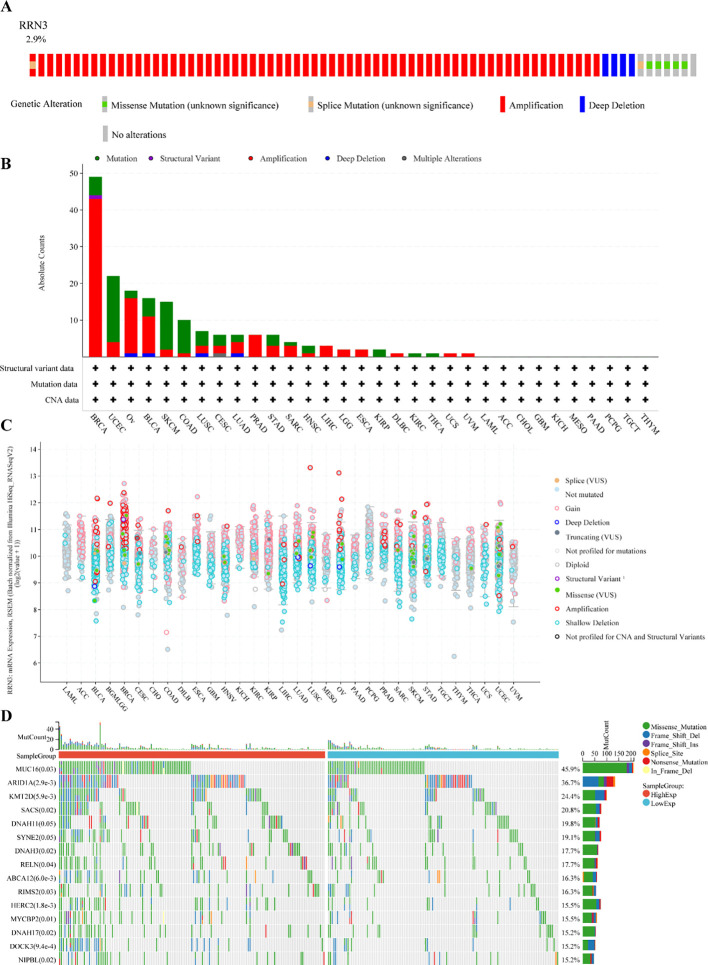
The genetic alteration landscape of RRN3 across pan-cancer was analyzed using the cBioPortal platform. As shown in f4, RRN3 alterations were identified in 79 of 2,565 patients, corresponding to an overall alteration frequency of approximately 3%. These alterations were distributed across 32 cancer types (f4), with the highest alteration frequency observed in BRCA (4.52%). In STAD, the alteration frequency of RRN3 was 1.36%, representing a moderate level among the analyzed cancer types. Overall, copy number amplification was the predominant form of alteration, followed by point mutations. We further evaluated the association between RRN3 copy number alterations and RRN3 mRNA expression (f4), which showed that RRN3 mRNA expression tended to increase with copy number amplification. To investigate the mutational landscape associated with RRN3 expression in STAD, samples were divided into high- and low-RRN3-expression groups (f4). A total of 15 genes showed significantly different mutation frequencies between the two groups. Among them, the five most significantly altered genes were MUC6, ARID1A, KMT2D, SACS, and DNAH11, suggesting that RRN3 expression may be associated with distinct mutational features in STAD.
Epigenetic association analysis of RRN3
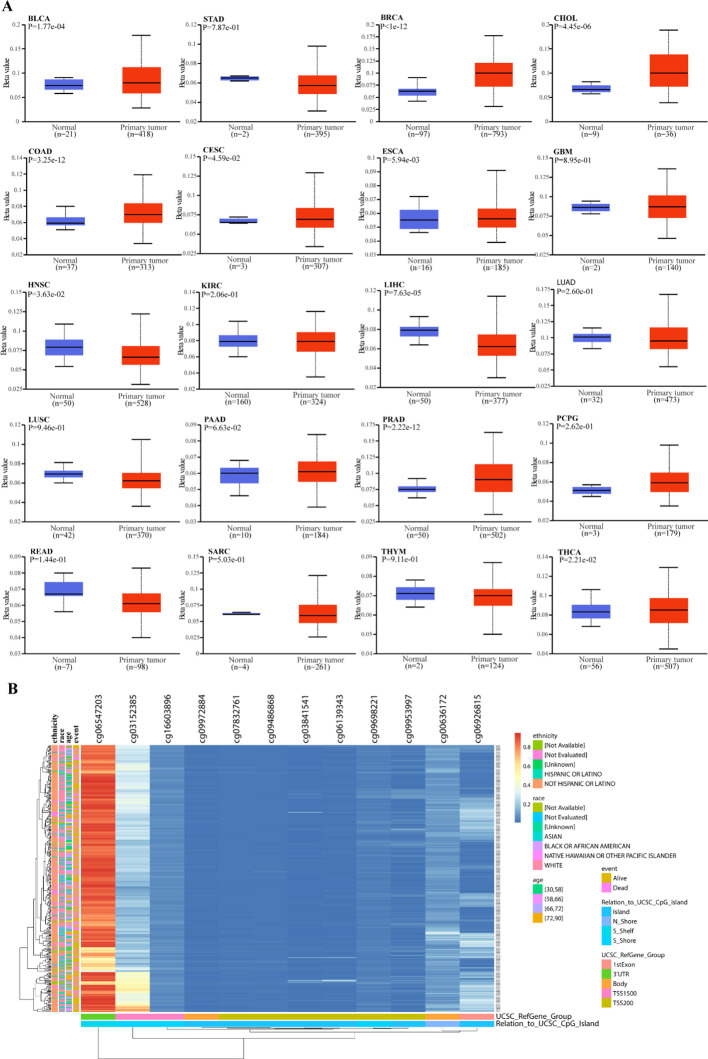
DNA methylation levels within the RRN3 promoter region were evaluated across normal tissues and 20 tumor types. As shown in f5, RRN3 promoter methylation levels varied across different cancer types. In STAD, the promoter methylation level of RRN3 was slightly lower in tumor tissues than in normal tissues, but this difference was not statistically significant (P = 7.87e-01). Further analysis using the MethSurv platform identified 12 CpG sites within RRN3 in STAD (f5). Among these, cg06547203 showed a markedly elevated methylation level, whereas the remaining CpG sites generally exhibited relatively low methylation levels.
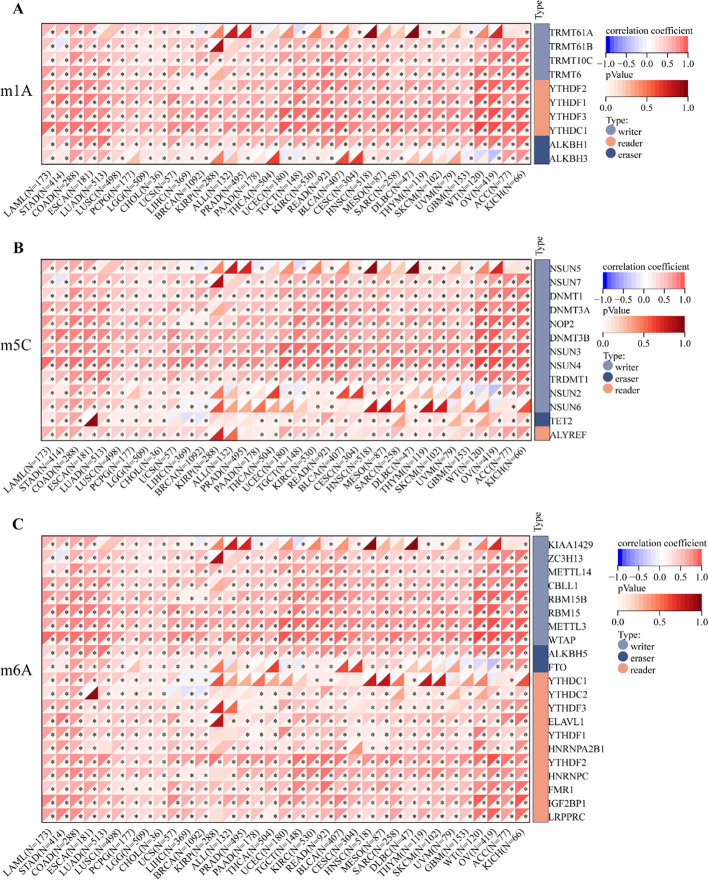
To investigate the potential association between RRN3 expression and RNA methylation regulators, we analyzed 45 genes related to RNA methylation (listed in Supplementary Table 4), including writers, erasers, and readers. As shown in f6, RRN3 expression was positively correlated with most m1A-, m5C-, and m6A-related regulators across multiple cancer types. In STAD, RRN3 expression was significantly and positively correlated with five representative regulators, including CBLL1 (r = 0.684, P < 0.001), YTHDF3 (r = 0.652, P < 0.001), RBM15 (r = 0.643, P < 0.001), YTHDC1 (r = 0.638, P < 0.001), and NSUN4 (r = 0.635, P < 0.001). Collectively, these results indicate that RRN3 exhibits distinct epigenetic and epitranscriptomic associations across multiple cancer types. In STAD, although the overall promoter methylation difference was not statistically significant, the site-specific CpG methylation pattern and the significant positive correlations between RRN3 expression and RNA methylation regulators suggest that RRN3 may have potential epigenetic relevance in GC.
Association between RRN3 expression and immune-related features
Immune checkpoint (ICP) genes play important roles in regulating immune cell infiltration and influencing the efficacy of immunotherapy. To investigate the association between RRN3 expression and immune-related features across multiple cancer types, we first evaluated its correlation with eight ICP genes, including CD274, CTLA4, HAVCR2, LAG3, PDCD1, PDCD1LG2, SIGLEC15, and TIGIT. As shown in f7 and Supplementary Table 5, RRN3 expression was positively correlated with these ICP genes in several tumor types, including UVM and STAD, whereas negative correlations were observed in THCA, SARC, and LUSC. In addition, higher RRN3 expression was significantly associated with higher tumor mutation burden (TMB) in STAD (P < 0.05; f7; Supplementary Table 6). RRN3 expression was also positively correlated with microsatellite instability (MSI) in multiple cancers, including STAD, CESC, LUAD, KIRC, and LUSC (P < 0.05; f7; Supplementary Table 7), whereas negative correlations were observed in COAD, BRCA, PRAD, HNSC, THCA, and DLBC. Regarding tumor purity, RRN3 expression showed a positive correlation with tumor purity in multiple cancer types, including GBM, LGG, BRCA, ESCA, SARC, STAD, LUSC, THCA, TGCT, PCPG, SKCM, BLCA, and ACC, whereas a significant negative association was observed in UVM (P < 0.05; f7; Supplementary Table 8).
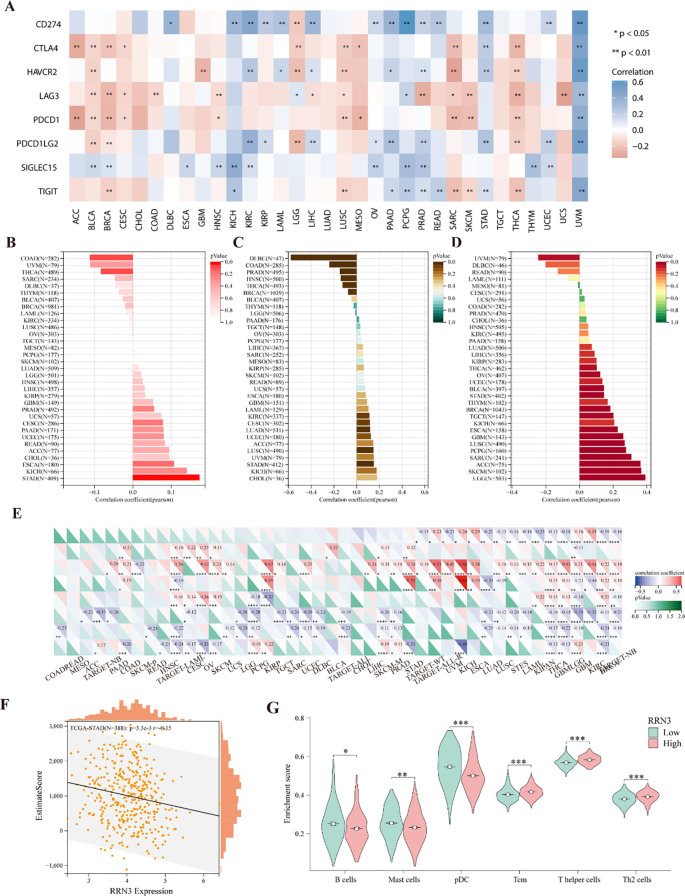
Further analyses showed that RRN3 expression was associated with the infiltration of multiple immune and stromal cell types in the tumor microenvironment, with relatively prominent correlations observed in GBM and THCA (f7). In STAD, ESTIMATE analysis revealed a negative correlation between RRN3 expression and ESTIMATE scores (f7), suggesting a potential association with tumor purity and immune-related features in STAD. Moreover, ssGSEA analysis showed significant differences between the high- and low-RRN3-expression groups in STAD for B cells, mast cells, plasmacytoid dendritic cells (pDCs), central memory T cells (Tcm), T helper cells, and Th2 cells (f7). No significant differences were observed for the remaining immune cell subsets.
Drug sensitivity association analysis
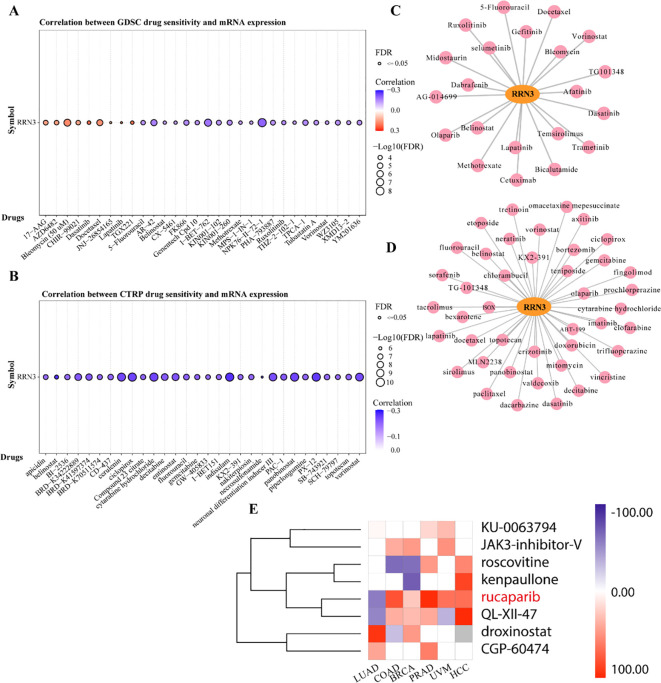
Drug sensitivity analysis based on the GDSC database showed that RRN3 expression was associated with cellular responses to multiple anticancer agents. Among these, dasatinib, TGX221, and lapatinib showed the strongest positive correlations with RRN3 expression (f8; Supplementary Table 9), whereas NPK76-II-72-1, I-BET-762, and AR-42 showed negative correlations. Similar results were observed in the CTRP database, in which RRN3 expression was positively associated with sensitivity to dasatinib, JW-55, and BRD-K99006945, but negatively associated with GSK-J4, belinostat, and indisulam (f8; Supplementary Table 10). By integrating results from the GDSC and CTRP databases and focusing on compounds with consistent associations, we identified 21 and 42 FDA-approved anticancer drugs potentially associated with RRN3 expression, respectively (f8; Supplementary Tables 11, 12). Among these, dasatinib showed a particularly strong positive correlation with RRN3 expression. To further explore candidate small-molecule compounds, we used the “Query” module of the Connectivity Map (CMap) database to analyze differentially expressed genes between the high- and low-RRN3-expression groups. This analysis identified 15 classes of small-molecule compounds targeting pathways such as ALK, BCR-ABL, BTK, CDK, and MET (Supplementary Table 13). The top eight candidate compounds ranked by connectivity score are shown in f8. These findings suggest that RRN3-associated transcriptional signatures may help identify candidate compounds with potential therapeutic relevance, although further experimental validation is required.
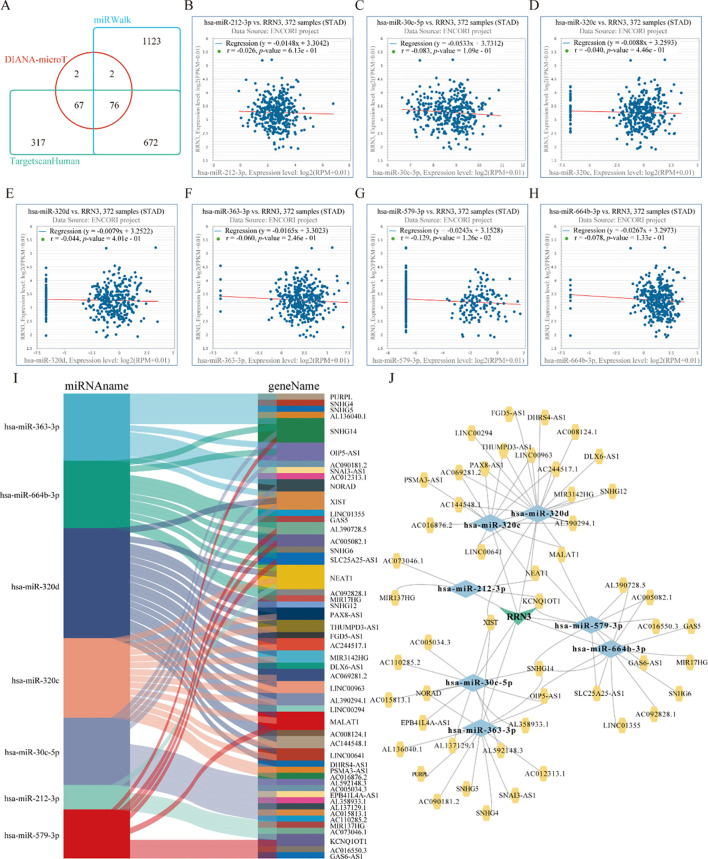
Prediction of a putative lncRNA–miRNA–RRN3 regulatory network in STAD
To identify potential upstream regulators of RRN3 in STAD, three online prediction databases, DIANA-microT, miRWalk, and TargetScan, were used to predict miRNAs that may target RRN3 (f9; Supplementary Table 14). A total of 147, 1873, and 1132 candidate miRNAs were obtained from DIANA-microT, miRWalk, and TargetScan, respectively, among which 76 miRNAs overlapped across all three datasets and were considered potential RRN3-targeting miRNAs. We next explored the upstream lncRNAs associated with these 76 candidate miRNAs using the StarBase v2.0 database. The results showed that 14 miRNAs, including hsa-miR-212-3p, hsa-miR-25-3p, hsa-miR-30c-5p, hsa-miR-3167, hsa-miR-320b, hsa-miR-320c, hsa-miR-320d, hsa-miR-323b-3p, hsa-miR-363-3p, hsa-miR-367-3p, hsa-miR-381-3p, hsa-miR-513b-5p, hsa-miR-579-3p, and hsa-miR-664b-3p, were predicted to interact with multiple lncRNAs, suggesting possible upstream regulatory relationships. Because mRNAs generally show inverse expression patterns with their targeting miRNAs, we further evaluated the correlations between RRN3 expression and these 14 candidate miRNAs. Among them, seven miRNAs, namely hsa-miR-212-3p (f9), hsa-miR-30c-5p (f9), hsa-miR-320c (f9), hsa-miR-320d (f9), hsa-miR-363-3p (f9), hsa-miR-579-3p (f9), and hsa-miR-664b-3p (f9), showed significant negative correlations with RRN3 expression, suggesting that they may act as candidate upstream regulators of RRN3. In addition, lncRNAs may function as competitive endogenous RNAs (ceRNAs) that indirectly regulate mRNA expression through miRNA sequestration. We therefore identified lncRNAs predicted to interact with these seven miRNAs and observed inverse associations between the lncRNAs and their corresponding miRNAs (f9). Based on these findings, a putative lncRNA–miRNA–RRN3 regulatory network was generated (f9), providing preliminary clues to the post-transcriptional regulation of RRN3 in STAD.
Functional analysis of RRN3 co-expressed genes in STAD
To investigate the potential biological functions of RRN3 in STAD, we analyzed genes co-expressed with RRN3 using TCGA data. Heatmaps were generated to display the top 35 positively and negatively correlated genes associated with RRN3 expression in STAD (f10; Supplementary Table 15). A protein–protein interaction (PPI) network was then constructed using the STRING database based on the top 100 positively correlated genes (f10). Using the MCODE plugin in Cytoscape, a core module containing 19 hub genes was identified, including SRSF1, DHX9, RSL1D1, WDR36, HNRNPU, DDX3X, TNPO1, BMS1, HEATR1, NOC3L, HNRNPR, FUBP1, NUP98, CEBPZ, UTP15, NUP153, NUP58, NUDT21, and NUP160 (f10). Further analysis using the CytoHubba plugin identified six top-ranking hub genes, namely DHX15, SRSF1, DHX9, WDR36, BMS1, and HEATR1 (f10). GO enrichment analysis of the top 300 positively co-expressed genes revealed significant enrichment in biological process (BP), cellular component (CC), and molecular function (MF) categories (f10; T1). KEGG pathway analysis showed that these genes were mainly enriched in nucleocytoplasmic transport, spliceosome, mRNA surveillance pathway, ubiquitin-mediated proteolysis, and ribosome biogenesis in eukaryotes (f10; T2). Collectively, these results suggest that RRN3 may be associated with multiple biological processes and pathways related to GC progression.
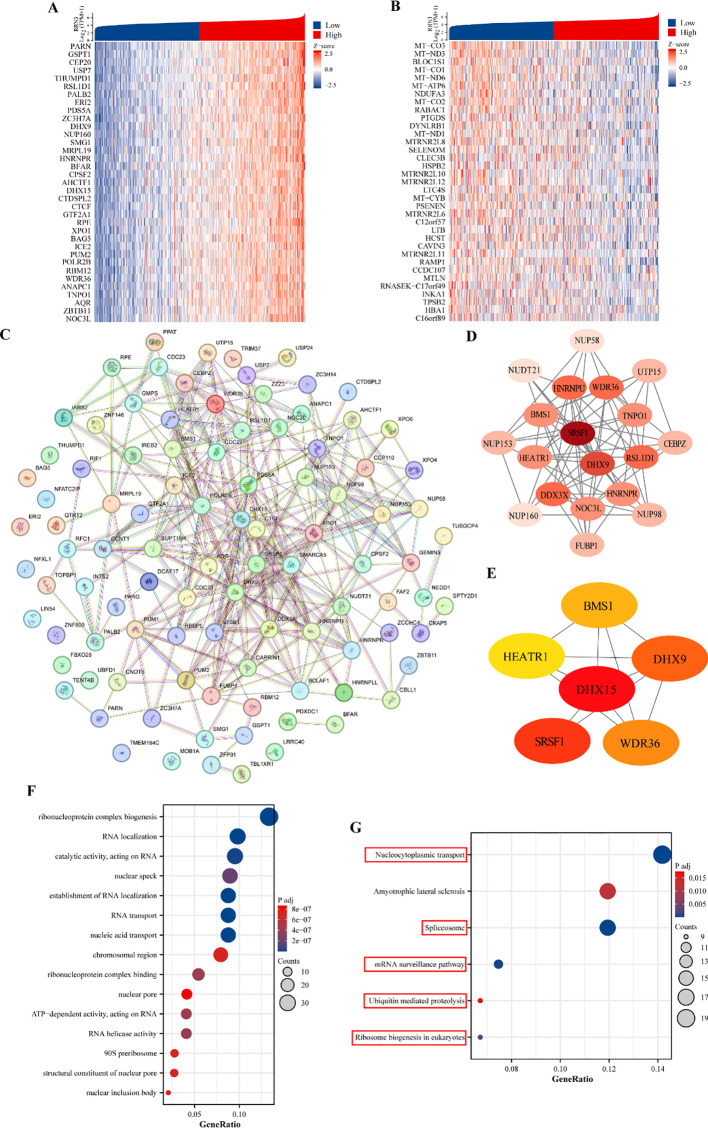
Table 1: Gene Ontology (GO) analyses of the top 300 co-expression genes positively associated with RRN3 expression.
| Ontology | ID | Description | Gene ratio | Bg ratio | P value | P adjust |
|---|---|---|---|---|---|---|
| BP | GO:0006403 | RNA localization | 28/285 | 196/18800 | 2.08E-19 | 4.87135E-16 |
| BP | GO:0050657 | nucleic acid transport | 25/285 | 159/18800 | 1.7814E-18 | 1.39068E-15 |
| BP | GO:0050658 | RNA transport | 25/285 | 159/18800 | 1.7814E-18 | 1.39068E-15 |
| BP | GO:0051236 | establishment of RNA localization | 25/285 | 162/18800 | 2.83852E-18 | 1.66196E-15 |
| BP | GO:0022613 | ribonucleoprotein complex biogenesis | 38/285 | 448/18800 | 5.89264E-18 | 2.76011E-15 |
| CC | GO:0016607 | nuclear speck | 26/290 | 411/19594 | 5.46517E-10 | 1.87455E-07 |
| CC | GO:0098687 | chromosomal region | 23/290 | 366/19594 | 6.39397E-09 | 7.34029E-07 |
| CC | GO:0030686 | 90S preribosome | 8/290 | 29/19594 | 6.85268E-09 | 7.34029E-07 |
| CC | GO:0042405 | nuclear inclusion body | 6/290 | 12/19594 | 8.5601E-09 | 7.34029E-07 |
| CC | GO:0005643 | nuclear pore | 12/290 | 93/19594 | 1.26157E-08 | 8.6544E-07 |
| MF | GO:0140098 | catalytic activity, acting on RNA | 28/294 | 388/18410 | 3.02676E-11 | 1.18649E-08 |
| MF | GO:0043021 | ribonucleoprotein complex binding | 16/294 | 150/18410 | 2.38913E-09 | 4.18741E-07 |
| MF | GO:0003724 | RNA helicase activity | 12/294 | 77/18410 | 3.20465E-09 | 4.18741E-07 |
| MF | GO:0008186 | ATP-dependent activity, acting on RNA | 12/294 | 79/18410 | 4.3405E-09 | 4.25369E-07 |
| MF | GO:0017056 | structural constituent of nuclear pore | 8/294 | 28/18410 | 9.05951E-09 | 7.10265E-07 |
Table 2: Kyoto Encyclopedia of Genes and Genome enrichment (KEGG) analyses of the top 300 co-expression genes positively associated with RRN3 expression.
| Ontology | ID | Description | Gene ratio | Bg ratio | P value | P adjust |
|---|---|---|---|---|---|---|
| KEGG | hsa03013 | Nucleocytoplasmic transport | 19/134 | 108/8164 | 6.48288E-15 | 1.30E-12 |
| KEGG | hsa03040 | Spliceosome | 16/134 | 147/8164 | 1.77604E-09 | 1.78492E-07 |
| KEGG | hsa03015 | mRNA surveillance pathway | 10/134 | 97/8164 | 3.79184E-06 | 0.000254053 |
| KEGG | hsa03008 | Ribosome biogenesis in eukaryotes | 9/134 | 109/8164 | 7.03483E-05 | 0.003535001 |
| KEGG | hsa05014 | Amyotrophic lateral sclerosis | 16/134 | 364/8164 | 0.000289497 | 0.011637791 |
| KEGG | hsa04120 | Ubiquitin mediated proteolysis | 9/134 | 142/8164 | 0.000522528 | 0.01750468 |
Clinical validation and functional role of RRN3 in GC
To further validate RRN3 expression in GC, we examined RRN3 levels in clinical tissue samples and GC cell lines. qRT-PCR analysis showed that RRN3 mRNA expression was significantly higher in GC tissues than in paired adjacent normal tissues (f11). Western blotting using six paired tissue samples also showed increased RRN3 protein expression in GC tissues compared with adjacent normal tissues (f11). Consistently, RRN3 expression was upregulated in AGS and MKN45 cells compared with the normal gastric epithelial cell line GES-1 at both the mRNA and protein levels (f11). Immunohistochemical staining further showed higher RRN3 expression in GC tissues than in adjacent normal tissues (f11). Clinicopathological analysis showed that higher RRN3 IHC scores were associated with advanced T stage, positive lymph node metastasis, Lauren classification, growth pattern, and H. pylori infection status (f11). These results suggest that RRN3 is upregulated in GC and may be associated with GC progression in this clinical cohort.
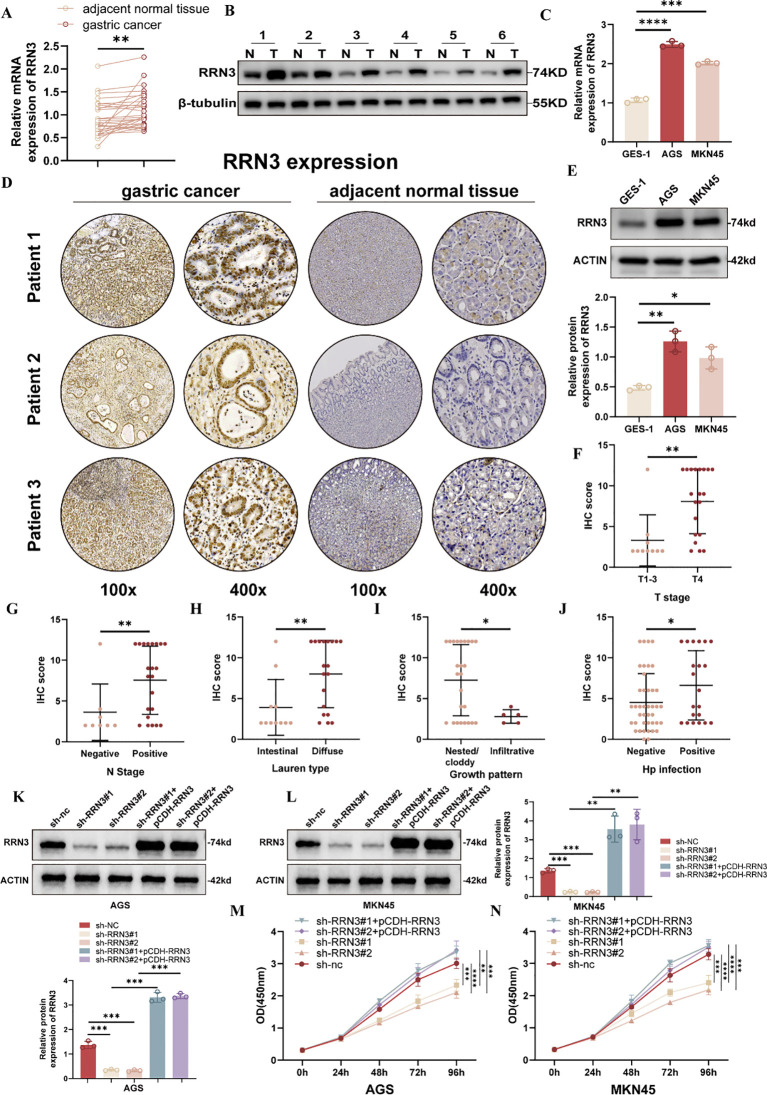
To investigate the functional role of RRN3 in GC cells, we established stable RRN3-knockdown AGS and MKN45 cells using two independent shRNAs. To further verify the specificity of the knockdown effects, rescue experiments were performed by re-expressing RRN3 using the pCDH-RRN3 plasmid. Western blotting confirmed efficient RRN3 knockdown in the sh-RRN3#1 and sh-RRN3#2 groups and restored RRN3 expression in the rescue groups in both AGS and MKN45 cells (f11). CCK-8 assays showed that RRN3 knockdown significantly inhibited the proliferation of AGS and MKN45 cells, whereas RRN3 re-expression reversed this inhibitory effect (f11). Colony formation assays further showed that RRN3 knockdown reduced the clonogenic ability of AGS and MKN45 cells, while RRN3 re-expression restored colony formation (f12). Wound healing assays showed that RRN3 knockdown suppressed cell migration, and this effect was reversed by RRN3 re-expression in both AGS and MKN45 cells (f12). Consistently, Transwell assays demonstrated that RRN3 knockdown reduced the migratory and invasive abilities of GC cells, whereas RRN3 re-expression rescued these phenotypes (f12). These findings indicate that RRN3 promotes the proliferation, migration, and invasion of GC cells.
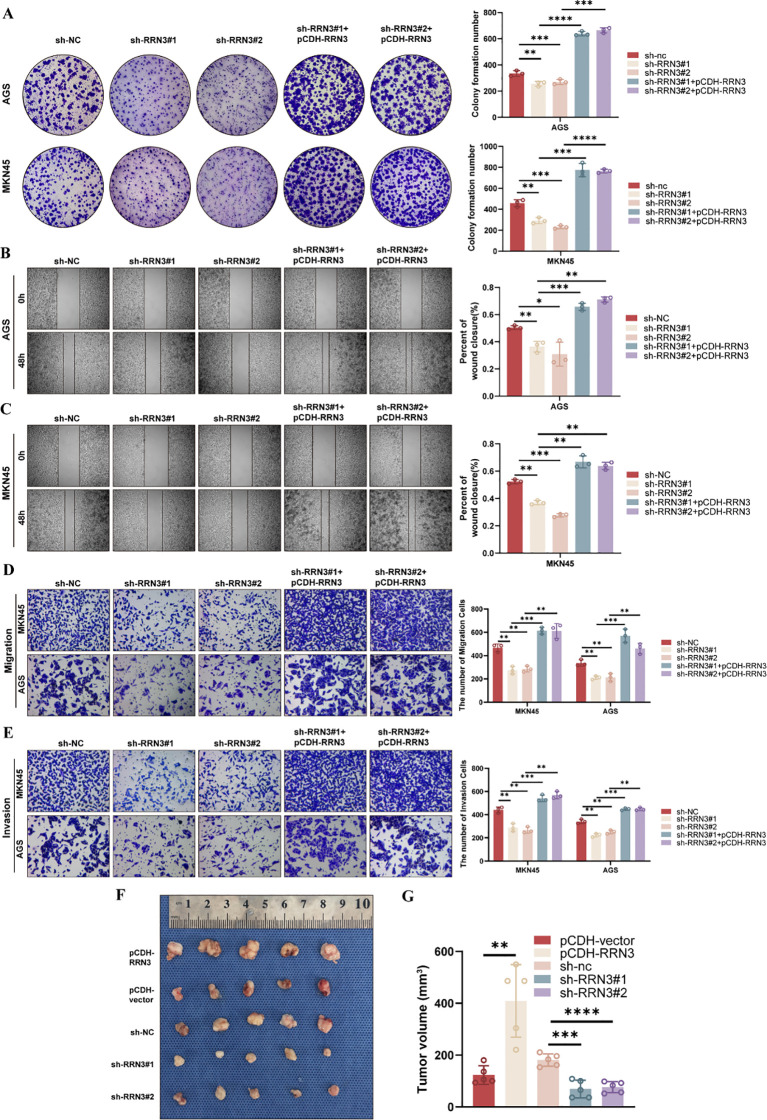
To further evaluate the role of RRN3 in tumor growth in vivo, a subcutaneous xenograft model was established using GC cells with RRN3 overexpression, RRN3 knockdown, or corresponding control treatment. Compared with the pCDH-vector group, the pCDH-RRN3 group formed larger tumors. In contrast, tumors in the sh-RRN3#1 and sh-RRN3#2 groups were smaller than those in the sh-NC group (f12). Quantitative analysis showed that RRN3 overexpression significantly increased tumor volume, whereas RRN3 knockdown significantly reduced tumor volume (f12). These results suggest that RRN3 contributes to GC tumor growth in vivo.
Discussion
In the present study, we systematically investigated the expression pattern, clinical relevance, and biological function of RRN3 in GC and across multiple cancer types. Pan-cancer analysis showed that RRN3 was aberrantly expressed in several tumor types and was significantly upregulated in GC. This finding was further supported by clinical tissue validation, including qRT-PCR, western blotting, and immunohistochemistry. Higher RRN3 expression was also associated with several clinicopathological features related to GC progression. In addition, RRN3 expression showed prognostic associations, epigenetic and epitranscriptomic associations, immune-related features, drug sensitivity-related signatures, and a putative ceRNA regulatory network. Functional experiments further demonstrated that RRN3 knockdown inhibited GC cell proliferation, migration, and invasion, whereas RRN3 re-expression partly rescued these effects. The in vivo xenograft assay also supported a role for RRN3 in promoting tumor growth. Collectively, these findings suggest that RRN3 is associated with GC progression and may represent a candidate molecule for further investigation in GC.
We found that RRN3 was upregulated in many cancer types, including GC, compared with normal tissues. This finding is consistent with recent studies showing that RRN3 overexpression is associated with malignant characteristics and poor prognosis in pancreatic cancer, and with the broader concept that enhanced ribosome biogenesis and Pol I transcriptional activity contribute to tumor progression. Interestingly, RRN3 expression was relatively low in several tumor types, including BLCA, OV, THCA, UCEC, and UCS, indicating that the contribution of RRN3 to tumorigenesis may be tissue-dependent. At present, direct evidence linking low RRN3 expression to the biological behavior of these cancers remains limited, and the underlying mechanisms warrant further investigation. Notably, ROC curve analysis showed relatively high AUC values for distinguishing GC tissues from normal tissues in public datasets. Its elevated expression was also associated with unfavorable overall survival in public datasets. In addition, our clinical tissue validation further showed that RRN3 was upregulated in GC tissues and was associated with several clinicopathological features related to tumor progression. These observations suggest that RRN3 may have clinical relevance in GC, mainly as a molecule associated with GC progression. However, given the limited size of the clinical cohort and the lack of complete follow-up data, the diagnostic and prognostic value of RRN3 should be interpreted cautiously and requires validation in larger independent cohorts.
Genetic alterations may influence gene expression and protein function during tumor development. In this study, RRN3 showed a relatively low alteration frequency across cancer types, with the highest frequency observed in BRCA (4.52%), suggesting that genomic alterations may not be the major cause of RRN3 dysregulation. This finding is consistent with previous reports (ref. 20). In STAD, stratified analysis based on RRN3 expression identified several genes with differential mutation frequencies between the high- and low-RRN3-expression groups. Among them, MUC6 and ARID1A were two representative altered genes. ARID1A, a key component of the SWI/SNF chromatin-remodeling complex, is frequently mutated in multiple cancers (ref. 23–ref. 26). MUC6 has also been implicated in tumorigenesis. Liu et al. reported that MUC6 acts as a tumor suppressor by promoting autophagy-dependent degradation of β-catenin, whereas disruption of this process facilitates tumor progression (ref. 27). The higher mutation frequencies of MUC6 and ARID1A in the high-RRN3-expression group suggest that elevated RRN3 expression may be associated with specific mutational backgrounds in STAD. However, whether these mutations directly influence RRN3 expression or function requires further investigation.
Epigenetic and epitranscriptomic modifications, including DNA methylation and RNA methylation, can regulate gene expression at transcriptional and post-transcriptional levels without altering the DNA sequence itself (ref. 28–ref. 30). In the present study, we evaluated the methylation status of the RRN3 promoter across 20 cancer types and corresponding normal tissues. In GC, no significant difference was observed in the overall promoter methylation level of RRN3 between tumor and normal tissues. This result indicates that global promoter methylation changes are unlikely to fully explain the upregulation of RRN3 in GC. However, site-specific CpG methylation analysis showed heterogeneous methylation patterns within the RRN3 promoter region, suggesting that individual CpG sites may still deserve further investigation. We also assessed the association between RRN3 expression and regulators of m1A, m5C, and m6A RNA methylation. RRN3 expression was positively correlated with the majority of these regulators in multiple cancers, including GC. These findings suggest that RRN3 expression may be associated with epigenetic and epitranscriptomic features during tumor progression. However, these analyses are based on database-derived correlations, and further experimental studies are needed to determine whether DNA methylation or RNA methylation regulators directly contribute to RRN3 dysregulation in GC.
Immunotherapy has become an important therapeutic strategy for advanced GC, but the response to immune checkpoint inhibitors varies considerably among patients because of tumor heterogeneity, molecular features, and differences in the immune microenvironment. At present, PD-L1 expression, MSI/MMR status, TMB, EBV status, and other molecular features have been investigated as biomarkers for immunotherapy response in GC. Among them, PD-L1 expression assessed by immunohistochemistry, especially using the combined positive score, is widely used in clinical practice, while MSI-H/dMMR tumors are generally associated with higher immunogenicity and better responses to immune checkpoint blockade. TMB has also been explored as a potential predictor of immunotherapy response, although its predictive value may vary across patient populations and treatment settings (ref. 31–ref. 33). In this study, RRN3 expression in STAD was positively correlated with several immune checkpoint molecules, including PDCD1 (PD-1) and CD274 (PD-L1). Upregulation of immune checkpoints is involved in tumor immune evasion (ref. 34–ref. 36), suggesting that high RRN3 expression may be associated with immune checkpoint-related features in STAD. We further found that RRN3 expression was positively associated with TMB and MSI. Elevated TMB and MSI are often linked to increased neoantigen load and enhanced tumor immunogenicity (ref. 37–ref. 40), raising the possibility that tumors with high RRN3 expression may have distinct immune-related molecular characteristics. However, enhanced immunogenicity does not necessarily translate into effective antitumor immune activation (ref. 41). Moreover, PD-L1, TMB, and MSI are not fully interchangeable biomarkers, and a single immune-related marker is often insufficient to accurately predict immunotherapy response in GC (ref. 31, ref. 33). Taken together, our data suggest that high RRN3 expression in STAD is associated with immune-related features involving immune checkpoint genes, TMB, MSI, and immune cell infiltration. Direct evidence showing that RRN3 regulates the tumor immune microenvironment is still lacking. Further studies using clinical immunotherapy cohorts, multiplex immunohistochemistry, single-cell sequencing, and mechanistic experiments are needed to clarify whether RRN3 directly contributes to immune regulation and whether it has value in predicting immunotherapy response.
We further explored the relationship between RRN3 expression and drug sensitivity. Analyses of the GDSC and CTRP databases identified multiple FDA-approved anticancer agents associated with RRN3 expression. Several of these compounds, including docetaxel, 5-fluorouracil, and mitomycin, have been used in GC treatment. These results suggest that RRN3 expression may be associated with chemotherapy-related drug-response profiles. Of note, in yeast, RRN3 interacts with the pseudouridine synthase Cbf5p and modulates sensitivity to 5-fluorouracil, suggesting a possible link between RRN3-related rRNA transcription and 5-fluorouracil response (ref. 42). Whether a similar mechanism operates in human cancers remains to be determined. Among the identified compounds, dasatinib showed the strongest positive association with RRN3 expression. Dasatinib is a multi-target tyrosine kinase inhibitor approved for chronic myeloid leukemia and Philadelphia chromosome-positive acute lymphoblastic leukemia, and it also shows anticancer potential in several solid tumors (ref. 43–ref. 45). Because dasatinib inhibits oncogenic signaling pathways involving SRC family kinases (ref. 46), BCR-ABL (ref. 47), and c-KIT (ref. 48), this observation raises the possibility that dasatinib-related pathways may be linked to RRN3-associated transcriptional features. Moreover, CMap analysis identified several candidate small molecules, among which rucaparib showed the highest enrichment score. As a PARP inhibitor approved for BRCA-mutant tumors (ref. 49), rucaparib may be considered a candidate compound for further experimental testing in the context of RRN3-high tumors. Nevertheless, these findings are based on database-derived associations and computational prediction. Further in vitro, in vivo, and clinical validation is required before RRN3 can be considered a predictive biomarker for drug response in GC.
ceRNA networks have attracted increasing attention in GC because of their role in post-transcriptional regulation. LncRNAs, together with other RNA species such as mRNAs and circular RNAs, may function as “miRNA sponges” by competitively binding miRNAs and thereby reducing their inhibitory effects on target mRNAs. In this study, we identified seven candidate miRNAs potentially interacting with RRN3 and further screened 50 candidate lncRNAs predicted to bind these miRNAs. Several of these lncRNAs, including SNHG4 (ref. 50), SNHG5 (ref. 51), and SNHG15 (ref. 52), have previously been reported as oncogenic regulators in GC. For example, SNHG4 promotes GC cell proliferation, migration, invasion, and epithelial–mesenchymal transition through miR-204-5p (ref. 53); the SNHG5/miR-32 axis modulates GC cell growth and migration through KLF4 regulation (ref. 54); and SNHG15 contributes to immune evasion in GC via the miR-141/PD-L1 pathway (ref. 55). These findings raise the possibility that RRN3 may be embedded in multiple lncRNA–miRNA regulatory axes related to GC progression. Although our ceRNA network is based on bioinformatic prediction and correlation analysis rather than direct experimental validation, it provides a useful framework for future mechanistic studies of RRN3 regulation in GC.
RRN3 is a key transcription initiation factor for RNA polymerase I that promotes the recruitment of polymerase I to rDNA promoters and initiates 45S rRNA synthesis, thereby functioning as a central regulator of ribosome biogenesis. Increased ribosome production and protein synthesis are hallmarks of cancer (ref. 56, ref. 57), indicating that RRN3 expression and activity may be closely linked to tumor progression. Previous studies have shown that RRN3 is regulated by multiple oncogenic signaling pathways and is closely associated with its phosphorylation status (ref. 21). When RRN3 function is disrupted or RNA polymerase I activity is inhibited, cells can undergo nucleolar stress, leading to reduced rRNA synthesis, release of ribosomal proteins, activation of p53 signaling, cell-cycle arrest, and apoptosis (ref. 58, ref. 59). This response is particularly pronounced in cancer cells with high biosynthetic demands, suggesting that the RRN3/Pol I axis may represent a biologically relevant vulnerability in cancer. Supporting this concept, a recent study identified NSH76 as a small molecule that directly binds RRN3 and selectively inhibits Pol I transcription by disrupting Pol I pre-initiation complex assembly at the rDNA promoter. NSH76 preferentially suppressed Pol I transcription and proliferation in cancer cells with high RRN3 expression, induced nucleolar stress, and showed limited effects on non-cancerous cells (ref. 60). A previous study reported that several natural product-derived small molecules, including sulforaphane, ursolic acid, and betulinic acid, induce nucleocytoplasmic translocation of RRN3, suppress rRNA synthesis, trigger nucleolar stress, and inhibit tumor cell proliferation (ref. 61). In the present study, we identified 300 genes co-expressed with RRN3 in TCGA-STAD samples. GO and KEGG enrichment analyses showed significant enrichment in pathways such as ribosome biogenesis, spliceosome, and mRNA surveillance, suggesting that RRN3 may occupy a central position in regulatory networks linking transcription, RNA processing, and protein synthesis in GC. Importantly, several hub genes co-expressed with RRN3, including HEATR1, SRSF1, and DHX9, have previously been implicated in GC progression (ref. 62–ref. 64). In line with these bioinformatic findings, our clinical tissue analysis showed that RRN3 was upregulated in GC tissues at both the mRNA and protein levels and that higher RRN3 expression was associated with several clinicopathological features related to tumor progression. Functional experiments further demonstrated that RRN3 knockdown inhibited GC cell proliferation, colony formation, migration, and invasion, whereas RRN3 re-expression partly reversed these inhibitory effects. Moreover, in vivo xenograft experiments showed that RRN3 overexpression promoted tumor growth, while RRN3 knockdown reduced tumor growth. These findings provide additional clinical, in vitro, and in vivo evidence supporting the involvement of RRN3 in GC progression. However, the precise molecular mechanisms by which RRN3 promotes GC progression, whether RRN3 has noncanonical RNA-processing functions in GC, and whether RRN3 can be therapeutically targeted in GC require further investigation.
Conclusions
In summary, our study shows that RRN3 is aberrantly expressed across multiple cancer types and is significantly upregulated in GC. RRN3 expression was associated with survival outcomes, epigenetic and epitranscriptomic features, immune-related characteristics, drug-response profiles, and a putative ceRNA regulatory network. Clinical tissue analysis showed that RRN3 was upregulated in GC tissues and was associated with several clinicopathological features related to tumor progression. Functional experiments showed that RRN3 knockdown inhibited GC cell proliferation, colony formation, migration, and invasion, whereas RRN3 re-expression partly reversed these effects. In vivo xenograft experiments further supported the role of RRN3 in promoting tumor growth. Collectively, these findings suggest that RRN3 is associated with GC progression and may represent a candidate molecule for further investigation in GC.
References
- MJ López, J Carbajal, AL Alfaro, LG Saravia, D Zanabria, JM Araujo. Characteristics of gastric cancer around the world.. Crit Rev Oncol Hematol. (, 2023. [DOI | PubMed]
- AP Thrift, HB El-Serag. Burden of Gastric Cancer.. Clin Gastroenterol Hepatol. (, 2020. [DOI | PubMed]
- WJ Yang, HP Zhao, Y Yu, JH Wang, L Guo, JY Liu. Updates on global epidemiology, risk and prognostic factors of gastric cancer.. World J Gastroenterol. (, 2023. [DOI | PubMed]
- AD Misiaszek, M Girbig, H Grötsch, F Baudin, B Murciano, A Lafita. Cryo-EM structures of human RNA polymerase I.. Nat Struct Mol Biol. (, 2021. [DOI | PubMed]
- Y Sadian, F Baudin, L Tafur, B Murciano, R Wetzel, F Weis. Molecular insight into RNA polymerase I promoter recognition and promoter melting.. Nat Commun. (, 2019. [DOI | PubMed]
- A Achiron, R Zilkha-Falb, A Feldman, M Bovim, O Rozen, I Sarova-Pinhas. Polymerase-1 pathway activation in acute multiple sclerosis relapse.. Autoimmun Rev. (, 2018. [DOI | PubMed]
- V Evsyukov, A Domanskyi, H Bierhoff, S Gispert, R Mustafa, F Schlaudraff. Genetic mutations linked to Parkinson’s disease differentially control nucleolar activity in pre-symptomatic mouse models.. Dis Model Mech. (, 2017. [DOI | PubMed]
- A Vashishta, LP Slomnicki, M Pietrzak, SC Smith, M Kolikonda, SP Naik. RNA Polymerase 1 Is Transiently Regulated by Seizures and Plays a Role in a Pharmacological Kindling Model of Epilepsy.. Mol Neurobiol. (, 2018. [DOI | PubMed]
- SP Hwang, C Denicourt. The impact of ribosome biogenesis in cancer: from proliferation to metastasis.. NAR Cancer. (, 2024. [DOI | PubMed]
- C Batbayar, N Ishii, N Harimoto, T Yokobori, H Saito, D Gantumur. High RRN3 expression is associated with malignant characteristics and poor prognosis in pancreatic cancer.. Int J Clin Oncol. (, 2023. [DOI | PubMed]
- JC Mars, MG Tremblay, M Valere, DS Sibai, M Sabourin-Felix, F Lessard. The chemotherapeutic agent CX-5461 irreversibly blocks RNA polymerase I initiation and promoter release to cause nucleolar disruption, DNA damage and cell inviability.. NAR Cancer. (, 2020. [DOI | PubMed]
- HC Thoms, LA Stark. The NF-κB Nucleolar Stress Response Pathway.. Biomedicines. (, 2021. [DOI | PubMed]
- A Lewinska, J Klukowska-Rötzler, A Deregowska, J Adamczyk-Grochala, M Wnuk. c-Myc activation promotes cofilin-mediated F-actin cytoskeleton remodeling and telomere homeostasis as a response to oxidant-based DNA damage in medulloblastoma cells.. Redox Biol. (, 2019. [DOI | PubMed]
- X Song, W Xia, J Zhang, Z Wu, H Zeng, Y Yang. Early growth response 1 promotes RNA polymerase I-directed transcription and cancer growth by activating RRN3 expression.. Commun Biol. (, 2026. [DOI | PubMed]
- J Lv, S Wang, T Liu, Y Liu, Y Bai, WA Qu. Nutrient stress diverts RRN3 from rRNA transcription to alternative polyadenylation of autophagy mRNAs in ovarian cancer.. Cell Death Dis. (, 2025. [DOI | PubMed]
- AT Ku, S Wilkinson, AG Sowalsky. Comparison of approaches to transcriptomic analysis in multi-sampled tumors.. Brief Bioinform. (, 2021. [DOI | PubMed]
- P Zeng, X Zhang, T Xiang, Z Ling, C Lin, H Diao. Secreted phosphoprotein 1 as a potential prognostic and immunotherapy biomarker in multiple human cancers.. Bioengineered. (, 2022. [DOI | PubMed]
- ML Kuijjer, JN Paulson, P Salzman, W Ding, J Quackenbush. Cancer subtype identification using somatic mutation data.. Br J Cancer. (, 2018. [DOI | PubMed]
- B Zhu, LA Tse, D Wang, H Koka, T Zhang, M Abubakar. Immune gene expression profiling reveals heterogeneity in luminal breast tumors.. Breast Cancer Res. (, 2019. [DOI | PubMed]
- S Rossetti, AJ Wierzbicki, N Sacchi. Evidence of involvement of basal components of the RNA Polymerase I transcription machinery.. Cell Cycle. (, 2016. [DOI | PubMed]
- R Jin, W Zhou. TIF-IA: An oncogenic target of pre-ribosomal RNA synthesis.. Biochim Biophys Acta Rev Cancer. (, 2016. [DOI | PubMed]
- DQ Nguyen, DH Hoang, TTV Nguyen, HD Ho, V Huynh, JH Shin. Ebp1 p48 promotes oncogenic activities in human colon cancer cells through regulation of TIF-90-mediated ribosomal RNA synthesis.. J Cell Physiol. (, 2019. [DOI | PubMed]
- J Mullen, S Kato, JK Sicklick, R Kurzrock. Targeting ARID1A mutations in cancer.. Cancer Treat Rev. (, 2021. [DOI | PubMed]
- M Conde, IJ Frew. Therapeutic significance of ARID1A mutation in bladder cancer.. Neoplasia. (, 2022. [DOI | PubMed]
- F Jin, Z Yang, J Shao, J Tao, C Reißfelder, S Loges. ARID1A mutations in lung cancer: biology, prognostic role, and therapeutic implications.. Trends Mol Med. (, 2023. [DOI | PubMed]
- YH Lo, KS Kolahi, Y Du, CY Chang, A Krokhotin, A Nair. A CRISPR/Cas9-Engineered ARID1A-Deficient Human Gastric Cancer Organoid Model Reveals Essential and Nonessential Modes of Oncogenic Transformation.. Cancer Discov. (, 2021. [DOI | PubMed]
- BH Liu, GB Liu, BB Zhang, J Shen, LL Xie, XQ Liu. Tumor Suppressive Role of MUC6 in Wilms Tumor via Autophagy-Dependent β-Catenin Degradation.. Front Oncol. (, 2022. [DOI | PubMed]
- V Ormazabal, S Nair, F Carrión, HD McIntyre, C Salomon. The link between gestational diabetes and cardiovascular diseases: potential role of extracellular vesicles.. Cardiovasc Diabetol. (, 2022. [DOI | PubMed]
- MB Pappalardi, K Keenan, M Cockerill, WA Kellner, A Stowell, C Sherk. Discovery of a first-in-class reversible DNMT1-selective inhibitor with improved tolerability and efficacy in acute myeloid leukemia.. Nat Cancer. (, 2021. [DOI | PubMed]
- C Wilson, PJ Chen, Z Miao, DR Liu. Programmable m(6)A modification of cellular RNAs with a Cas13-directed methyltransferase.. Nat Biotechnol. (, 2020. [DOI | PubMed]
- Y Cho, S Ahn, KM Kim. PD-L1 as a Biomarker in Gastric Cancer Immunotherapy.. J Gastric Cancer. (, 2025. [DOI | PubMed]
- V Bintintan, C Burz, I Pintea, A Muntean, D Deleanu, I Lupan. Predictive Factors of Immunotherapy in Gastric Cancer: A 2024 Update.. Diagnostics (Basel). (, 2024. [DOI | PubMed]
- W Hou, Y Zhao, H Zhu. Predictive Biomarkers for Immunotherapy in Gastric Cancer: Current Status and Emerging Prospects.. Int J Mol Sci. (, 2023. [DOI | PubMed]
- N Klümper, DJ Ralser, EG Bawden, J Landsberg, R Zarbl, G Kristiansen. LAG3 (LAG-3, CD223) DNA methylation correlates with LAG3 expression by tumor and immune cells, immune cell infiltration, and overall survival in clear cell renal cell carcinoma.. J Immunother Cancer. (, 2020. [DOI | PubMed]
- R Su, L Dong, Y Li, M Gao, L Han, M Wunderlich. Targeting FTO Suppresses Cancer Stem Cell Maintenance and Immune Evasion.. Cancer Cell. (, 2020. [DOI | PubMed]
- J Ge, N Yang, Y Yang, H Yu, X Yang, Y Wang. The combination of eddy thermal effect of biodegradable magnesium with immune checkpoint blockade shows enhanced efficacy against osteosarcoma.. Bioact Mater. (, 2023. [DOI | PubMed]
- D Sha, Z Jin, J Budczies, K Kluck, A Stenzinger, FA Sinicrope. Tumor Mutational Burden as a Predictive Biomarker in Solid Tumors.. Cancer Discov. (, 2020. [DOI | PubMed]
- J Long, D Wang, A Wang, P Chen, Y Lin, J Bian. A mutation-based gene set predicts survival benefit after immunotherapy across multiple cancers and reveals the immune response landscape.. Genome Med. (, 2022. [DOI | PubMed]
- S Li, X Wu, X Yan, L Zhou, Z Chi, L Si. Toripalimab plus axitinib in patients with metastatic mucosal melanoma: 3-year survival update and biomarker analysis.. J Immunother Cancer. (, 2022. [DOI | PubMed]
- B Kaufman, O Abramov, A Ievko, D Apple, M Shlapobersky, I Allon. Functional binding of PD1 ligands predicts response to anti-PD1 treatment in patients with cancer.. Sci Adv. (, 2023. [DOI | PubMed]
- F Cheng, H Wang, P Horna, Z Wang, B Shah, E Sahakian. Stat3 inhibition augments the immunogenicity of B-cell lymphoma cells, leading to effective antitumor immunity.. Cancer Res. (, 2012. [DOI | PubMed]
- J Hoskins, JS Butler. RNA-based 5-fluorouracil toxicity requires the pseudouridylation activity of Cbf5p.. Genetics. (, 2008. [DOI | PubMed]
- Y Zhang, J Zhou, Y Wang, Y Wu, Y Li, B Wang. Stimuli-responsive polymer-dasatinib prodrug to reprogram cancer-associated fibroblasts for boosted immunotherapy.. J Control Release. (, 2025. [DOI | PubMed]
- S Corbacioglu, H Lode, S Ellinger, F Zeman, M Suttorp, G Escherich. Irinotecan and temozolomide in combination with dasatinib and rapamycin versus irinotecan and temozolomide for patients with relapsed or refractory neuroblastoma (RIST-rNB-2011): a multicentre, open-label, randomised, controlled, phase 2 trial.. Lancet Oncol. (, 2024. [DOI | PubMed]
- P Tiwari, RP Shukla, K Yadav, M Sharma, AK Bakshi, D Panwar. YIGSR Functionalized Hybrid Exosomes Spatially Target Dasatinib to Laminin Receptors for Precision Therapy in Breast Cancer.. Adv Healthc Mater. (, 2025. [DOI | PubMed]
- IS Luk, CM Bridgwater, A Yu, LD Boila, M Yáñez-Bartolomé, AE Lampano. SRC inhibition enables formation of a growth suppressive MAGI1-PP2A complex in isocitrate dehydrogenase-mutant cholangiocarcinoma.. Sci Transl Med. (, 2024. [DOI | PubMed]
- E Jabbour, H Kantarjian. Chronic myeloid leukemia: 2022 update on diagnosis, therapy, and monitoring.. Am J Hematol. (, 2022. [DOI | PubMed]
- D Malani, B Yadav, A Kumar, S Potdar, M Kontro, M Kankainen. KIT pathway upregulation predicts dasatinib efficacy in acute myeloid leukemia.. Leukemia. (, 2020. [DOI | PubMed]
- K Fizazi, JM Piulats, MN Reaume, P Ostler, R McDermott, JR Gingerich. Rucaparib or Physician’s Choice in Metastatic Prostate Cancer.. N Engl J Med. (, 2023. [DOI | PubMed]
- Q Chu, X Gu, Q Zheng, Z Guo, D Shan, J Wang. Long noncoding RNA SNHG4: a novel target in human diseases.. Cancer Cell Int. (, 2021. [DOI | PubMed]
- SQ Du, YT Liu, F Yang, PX Wang, J Zhang. High expression of small nucleolar host gene RNA may predict poor prognosis of Hepatocellular carcinoma, based on systematic reviews and meta-analyses.. BMC Cancer. (, 2024. [DOI | PubMed]
- S Chen, X Shen. Long noncoding RNAs: functions and mechanisms in colon cancer.. Mol Cancer. (, 2020. [DOI | PubMed]
- S Wang, W Zhu, J Qiu, F Chen. lncRNA SNHG4 promotes cell proliferation, migration, invasion and the epithelial-mesenchymal transition process via sponging miR-204-5p in gastric cancer.. Mol Med Rep. (, 2021. [DOI | PubMed]
- L Zhao, T Han, Y Li, J Sun, S Zhang, Y Liu. The lncRNA SNHG5/miR-32 axis regulates gastric cancer cell proliferation and migration by targeting KLF4.. FASEB J. (, 2017. [DOI | PubMed]
- S Dang, A Malik, J Chen, J Qu, K Yin, L Cui. LncRNA SNHG15 Contributes to Immuno-Escape of Gastric Cancer Through Targeting miR141/PD-L1.. Onco Targets Ther. (, 2020. [DOI | PubMed]
- J Pelletier, G Thomas, S Volarević. Ribosome biogenesis in cancer: new players and therapeutic avenues.. Nat Rev Cancer. (, 2018. [DOI | PubMed]
- AR Elhamamsy, BJ Metge, HA Alsheikh, LA Shevde, RS Samant. Ribosome Biogenesis: A Central Player in Cancer Metastasis and Therapeutic Resistance.. Cancer Res. (, 2022. [DOI | PubMed]
- SJ Woods, KM Hannan, RB Pearson, RD Hannan. The nucleolus as a fundamental regulator of the p53 response and a new target for cancer therapy.. Biochim Biophys Acta Gene Regul Mech. (, 2015. [DOI | PubMed]
- A Russo, G Russo. Ribosomal Proteins Control or Bypass p53 during Nucleolar Stress.. Int J Mol Sci. (, 2017. [DOI | PubMed]
- SS Sarkar, M Sharma, A Karmakar, K Jahan, S Saproo, S Biswas. NSH76: a selective inhibitor of RRN3 and RNA polymerase I transcription with potential for cancer therapy.. J Transl Med. (, 2025. [DOI | PubMed]
- A Lewinska, D Bednarz, J Adamczyk-Grochala, M Wnuk. Phytochemical-induced nucleolar stress results in the inhibition of breast cancer cell proliferation.. Redox Biol. (, 2017. [DOI | PubMed]
- L Xiao, Y Zhang, Q Luo, C Guo, Z Chen, C Lai. DHRS4-AS1 regulate gastric cancer apoptosis and cell proliferation by destabilizing DHX9 and inhibited the association between DHX9 and ILF3.. Cancer Cell Int. (, 2023. [DOI | PubMed]
- J Zhao, Y Zhu, Q Fu, Y Zhu, G Zhao. HEATR1 promotes proliferation in gastric cancer in vitro and in vivo.. Acta Biochim Biophys Sin (Shanghai). (, 2020. [DOI | PubMed]
- Q Fu, X Tan, H Tang, J Liu. CCL21 activation of the MALAT1/SRSF1/mTOR axis underpins the development of gastric carcinoma.. J Transl Med. (, 2021. [DOI | PubMed]