
Dispersive micro-solid-phase extraction coupled to UHPLC-Q-TOF-MS and UHPLC-QqQ-MS for suspect and target screening of illicit drugs and pharmaceuticals in wastewater
Abstract
Graphical abstract:
Supplementary Information:
The online version contains supplementary material available at 10.1007/s00216-026-06520-3.
Article type: Research Article
Keywords: Illicit drugs, New psychoactive substances, Environmental pollution, D-µ-SPE, Mass spectrometry
Affiliations: Universidade SENAI CIMATEC, Av. Orlando Gomes, 1845 – Piatã, Salvador, BA 41650-010 Brazil; https://ror.org/03k3p7647grid.8399.b0000 0004 0372 8259Instituto Nacional de Ciência e Tecnologia em Energia e Ambiente – INCT, Universidade Federal da Bahia, Salvador, BA 40170-115 Brazil; Centro Tecnológico Agropecuário do Estado da Bahia – CETAB, Secretaria da Agricultura, Pecuária, Irrigação, Pesca e Aquicultura – SEAGRI, Av. Milton Santos, 967 – Ondina, Salvador, BA 40170-110 Brazil; Laboratório de Toxicologia Forense, Instituto de Análises e Pesquisas Forenses – IAPF, Polícia Científica, São Cristóvão, SE 49100-000 Brazil; https://ror.org/01zwq4y59grid.412324.20000 0001 2205 1915Universidade Estadual de Santa Cruz, Campus Soane Nazaré de Andrade, Rod. Jorge Amado, Km 16 – Salobrinho, Ilhéus, BA 45662-900 Brazil; https://ror.org/03k3p7647grid.8399.b0000 0004 0372 8259Universidade Federal da Bahia, Instituto de Química, Campus de Ondina, Salvador, BA 40170-115 Brazil
License: © The Author(s) 2026 CC BY 4.0 Open Access This article is licensed under a Creative Commons Attribution 4.0 International License, which permits use, sharing, adaptation, distribution and reproduction in any medium or format, as long as you give appropriate credit to the original author(s) and the source, provide a link to the Creative Commons licence, and indicate if changes were made. The images or other third party material in this article are included in the article’s Creative Commons licence, unless indicated otherwise in a credit line to the material. If material is not included in the article’s Creative Commons licence and your intended use is not permitted by statutory regulation or exceeds the permitted use, you will need to obtain permission directly from the copyright holder. To view a copy of this licence, visit http://creativecommons.org/licenses/by/4.0/.
Article links: DOI: 10.1007/s00216-026-06520-3 | PubMed: 42047791 | PMC: PMC13264539
Relevance: Relevant: mentioned in keywords or abstract
Full text: PDF (3.5 MB)
Introduction
Illicit drug use has been on the rise globally, particularly with a notable increase in consumption in developing countries. According to the 2023 World Drug Report, approximately 219 million people used cannabis in 2021, while 60 million used opioids, and 22 million engaged in cocaine consumption worldwide [ref. 1, ref. 2]. Fentanyl, a powerful synthetic opioid, has been massively used in the North American markets and has caused almost 90,000 deaths [ref. 2, ref. 3]. Owing to the elevated rates of illicit drug consumption, residues of these substances are frequently found in surface water and wastewater systems, mainly cocaine, methamphetamine, cannabis, opioids, and their metabolites [ref. 1, ref. 2]. The improper disposal and excretion by the human body are the primary sources of discharge in wastewater systems [ref. 4, ref. 5]. Although a significant portion of wastewater contaminants, including microbiological agents and certain chemicals, can be effectively removed by wastewater treatment plants (WWTPs) or urban submarine outfall systems (SOs), residual hazardous substances may persist in the treated wastewater [ref. 6–ref. 8]. Recent papers reported the presence of chemical substances at trace levels, such as pharmaceuticals and illicit drugs in water bodies near SOs, which are a cause for concern, since these substances are classified as emerging pollutants and may affect water quality and aquatic life [ref. 8, ref. 9].
One of the primary challenges in wastewater analysis lies in the low concentrations of illicit drugs, which may range from nanograms per liter to a few micrograms per liter [ref. 10], alongside the high levels of dissolved organic matter and interfering compounds. Addressing these challenges may necessitate additional steps in sample preparation, such as extraction and preconcentration, besides a cleanup step to eliminate or mitigate interferences and matrix effects. Recently, techniques, such as liquid-phase microextraction [ref. 11, ref. 12], thin-film microextraction [ref. 13], automated solid-phase extraction [ref. 14], passive sampling devices [ref. 15], modified QuERChERS [ref. 16], and direct injection [ref. 17], have been proposed to determine illicit drugs and pharmaceuticals in wastewater. However, most of the published papers [ref. 18–ref. 21] report the use of solid-phase extraction (SPE) using conventional cartridges or syringes to extract and preconcentrate these substances. Despite its simplicity, SPE has some disadvantages, such as low sample throughput, and sorbent batch-to-batch variation [ref. 22], and frequently requires an analyte concentration step after solvent elution.
Dispersive solid-phase extraction (D-SPE) has emerged as a simple and attractive alternative for extracting and preconcentrating organic compounds in complex aqueous samples. In this technique, the sorbent is dispersed into a sample solution, thereby increasing the surface area and enabling rapid sorption equilibrium [ref. 23]. Initially, it was developed exclusively for cleanup purposes, wherein an appropriate sorbent is added to aqueous samples to remove interfering compounds such as pigments, sugars, and lipids while the analytes remain in the liquid phase [ref. 23, ref. 24]. Subsequently, the technique was employed with a focus on extracting and preconcentrating the analytes onto the sorbent. More recently, the D-µ-SPE has emerged as a miniaturized version of D-SPE to extract analytes using a small amount of sorbent (in the µg to mg range) [ref. 25]. The main advantage of D-µ-SPE is the possibility of employing different sorbents, such as carbon-based, magnetic and molecularly imprinted polymer sorbents, as well as distinct sorbent mass amounts, which may vary from 10 to 100 mg.
Recent papers have demonstrated the efficacy of D-µ-SPE in extracting illicit drugs from wastewater, predominantly employing functionalized nanosorbents [ref. 26–ref. 28]. Nevertheless, the dispersion of these sorbents typically occurs in conventional glassware such as beakers, glass tubes, or even Erlenmeyer flasks, potentially reducing sample throughput or decreasing accuracy [ref. 29, ref. 30]. In addition, selective nanostructured sorbents obtained through synthesis may be less accessible to many laboratories [ref. 25]. Moreover, the use of D-µ-SPE coupled with HPLC systems equipped with spectrophotometric detectors or mass-spectrometric detectors equipped with single-quadrupole analyzers may not provide the necessary resolution and/or mass accuracy to adequately investigate the complex chemical dynamics of illicit drugs and their metabolites in wastewater [ref. 31, ref. 32].
Over the past year, the number of published studies reporting the application of liquid chromatography coupled to high-resolution mass spectrometry (LC-HRMS) for untargeted and suspect screening of illicit drugs and pharmaceuticals in wastewater has increased substantially. One of the main advantages of LC-HRMS in the environmental monitoring of emerging contaminants is its ability to perform both untargeted and suspect screening of a wide range of compounds without the need for authentic standards, including previously unknown substances, while also enabling retrospective data analysis [ref. 33, ref. 34]. This capability is particularly important in wastewater-based studies, where samples are no longer available for reanalysis. Recent studies have reported the combination of solid-phase extraction (SPE) with HRMS coupled to gas or liquid chromatography systems for targeted and suspect screening of illicit drugs and pharmaceuticals [ref. 34–ref. 39]. Although the use of dispersive micro–solid-phase extraction (D-µ-SPE) in combination with UHPLC–QqQ–MS has been reported [ref. 40], analytical procedures employing D-µ-SPE coupled with HRMS for the suspect screening of illicit drugs and pharmaceuticals remain scarce.
Accordingly, the central hypothesis of this study is that coupling D-µ-SPE with UHPLC-QTOF-MS and UHPLC-QqQ-MS enables both target and suspect screening of relevant illicit drugs, pharmaceuticals, and their metabolites, including compounds for which analytical standards are unavailable. In addition, the proposed approach also allows highly sensitive quantification of target analytes using authentic standards. Furthermore, the implementation of D-µ-SPE constitutes a greener alternative to conventional solid-phase extraction (SPE), as it substantially reduces sorbent and solvent consumption.
This study aimed to develop a novel dispersive micro-solid-phase extraction (D-µ-SPE) procedure combined with UHPLC–QTOF–MS and UHPLC–QqQ–MS for suspect screening and target analysis of illicit drugs and pharmaceutical substances, including their metabolites. Chromatographic and mass spectrometric conditions for both UHPLC–QqQ–MS and UHPLC–QTOF–MS were optimized to allow the determination of cocaine, amphetamine-type stimulants, synthetic cathinones, opioids, cannabinoids, and their metabolites within a single chromatographic run. Parameters affecting D-µ-SPE performance were optimized using a statistical experimental design approach. Following method validation, the proposed methodology was applied to perform a comprehensive investigation of illicit drugs and pharmaceuticals in real wastewater samples collected from Brazil’s largest coastal bay region.
Material and methods
Reagent and solutions
Isotopically labeled standards of cocaine-d3 (99.4%), methamphetamine-d11 (99.3%), norfentanyl-d5 (99.9%), MDMA-d5, and amphetamine-d6 (AMP-d6) at 1000 mg L−1, and the cannabinoids cannabinol (CBN, 99.1%), and cannabidiol (CBD, 99.6%), were acquired from Cerilliant (Round Rock, TX, USA). Fentanyl (FENT, 99.7%) was purchased from LGC Standards (Teddington, Middlesex, UK). A mix standard solution containing ecgonine methyl ester (EME), benzoylecgnonine (BEG), cocaine (COC), norcocaine (NOR), and cocaethylene (COET) in acetonitrile at 10 mg L−1 and a mix solution containing 3,4-methylenedioxyamphetamine (MDA), 3,4-methylenedioxymethamphetamine (MDMA), 3,4-methylenedioxy-methylbutanamine (MBDB), 3,4-methylenedioxy-ethylamphetamine (MDEA), fenproporex (FEN), methylone (MET), ethylone (ETH), and N-ethylpentylone (NEP), and clobenzorex (CBZ), amphetamine (AMP), methamphetamine (METH) in methanol at 10 mg L−1 were kindly donated by the Forensic Toxicology Laboratory of the Scientific Police of the State of Sergipe (Brazil).
An ultrapure water system Milli-Q Elix (Merck Millipore, Burlington, USA) equipped with a Q-POD water remote dispenser was used to obtain ultrapure water (18.2 MΩ cm and total organic carbon < 3 µg L−1). All organic solvents used in this study were LC-MS grade. Ultrapure methanol (MeOH) was purchased from Merck (Darmstadt, Germany). Acetonitrile (ACN) was purchased from Sigma-Aldrich (St. Louis, MO, USA). LC-MS-grade formic acid (98%) LiChropur was purchased from Merck (Darmstadt, Germany), and ammonium formate was acquired from Êxodo Científica (São Paulo, Brazil). The OASIS MCX Plus SPE cartridges (60 µm particle diameter, 200 mg) were purchased from Waters (Milford, MA, USA).
A mixed working solution was prepared by diluting the analytical standards in methanol to a concentration of 1.0 mg L−1. An analyte-free sample was prepared by passing 2 L of a given wastewater sample through a solid-phase extraction (SPE) system containing two connected OASIS MCX cartridges coupled to a Gilson MiniPlus 3 peristaltic pump (Madison, WI, USA) operating at a flow of 4 mL min−1. The resulting analyte-free solution was initially analyzed using the UHPLC-MS/MS system to verify the presence of any target analyte residues. No peaks corresponding to the target analytes were detected. Consequently, the solution was used to construct external matrix-matched calibration curves at ten concentration levels (0.5, 1.0, 5.0, 10, 25, 50, 75, 100, 200, and 400 ng L⁻1) using the proposed D-µ-SPE procedure. Additionally, a separate set of calibration curves was prepared with an extended linear range (10, 50, 100, 500, 1000, 5000, 10,000, and 15,000 ng L⁻1) to quantify analytes present at higher concentrations in wastewater samples.
Wastewater sampling
Fourteen wastewater samples were collected from wastewater treatment plants and primary wastewater outfalls in the coastal regions of Salvador and Porto Seguro, cities located in the State of Bahia, northeastern Brazil. These cities are major tourist destinations for visitors from different regions of Brazil and from other countries, particularly because they host one of the largest street carnivals in the world. Samples were collected in 500 mL polyethylene flasks and transported to the laboratory on the same day under refrigerated conditions. Upon arrival, the samples were immediately acidified with 12 mol L⁻1 HCl to pH 2 using a pH meter (Mettler Toledo, Columbus, OH, USA). Subsequently, the samples were filtered through a 0.7 µm glass fiber filter (Merck, Darmstadt, Germany) using a vacuum-operated Millipore filtration system. After filtration, the samples were stored at − 20 °C until analysis. Analyses were performed within two weeks. When analysis was not feasible within this period, the samples remained frozen at − 20 °C in accordance with preservation protocols commonly reported in the literature [ref. 41, ref. 42].
UHPLC-QqQ-MS and UHPLC-QTOF-MS analysis conditions
The separation, identification, and quantification of the target analytes were performed using an Agilent 1260 Infinity II UHPLC system coupled to a triple quadrupole mass spectrometer Agilent Ultivo System, equipped with a quaternary pump system, an electrospray (ESI) and Agilent Jetstream (AJS) high-sensitivity ion source (Agilent Technologies, Santa Clara, CA, USA). A reversed-phase InfinityLab Poroshell 120 EC-C18 column (100 mm × 3.0 mm × 2.7 µm, Agilent Technologies, Santa Clara, CA, USA) was employed in the analyte’s separation, according to the following mobile phase gradient condition: starting with 95% solvent A (ultrapure water/0.1% formic acid) and 5% solvent B (methanol/0.5 mmol L−1 ammonium formate) at 0 min, increase to 85% of B at 7 min, 100% B at 15 min, holding this condition for 1 min. The column temperature was kept at 40 °C. The flow rate of the mobile phase was fixed at 0.4 mL min−1, and a volume of 2 µL of the sample was injected. The autosampler temperature was kept at 6 °C to avoid analyte degradation. The AJS ion source was operated in positive mode. The ionization parameters were dry gas temperature (200 °C), sheath gas temperature (400 °C), dry gas flow (8 L min−1), sheath gas flow (10 L min−1), nebulizer pressure (35 psi), capillary voltage (3 kV), and nozzle voltage (1 kV). Nitrogen was used as collision gas in the collision cell. Target acquisition was performed using two dynamic multiple reaction monitoring (dMRM) transitions for each compound, as shown in Table S1.
LC–HRMS analysis was performed using an Agilent 1290 Infinity II Binary LC system connected to an Agilent 6545B Accurate-Mass Q-TOF mass spectrometer equipped with Agilent Jet Stream technology (AJS) for electrospray ionization (Agilent Technologies, Santa Clara, CA, USA). An amount of 2 µL from each sample was loaded onto a C18 column (InfinityLab Poroshell 120 EC-C18 (100 mm × 3.0 mm × 2.7 μm, Agilent Technologies, Santa Clara, CA, USA)) and maintained at 40 °C. To conduct suspect screening analysis using the LC-QTOF-MS system, it was necessary to perform a slight change in the elution gradient. The UHPLC was operated at a flow rate of 400 μL min−1, and with the mobile phase system (solvent A: ultrapure water containing 0.1% formic acid; solvent B: 100% methanol containing 0.5 mmol L−1 ammonium formate) and eluent gradient (5% B for 0 min; 5–85% B in 0–7 min; 85–95% B in 7–15 min; 95% B in 16 min).
For the HRMS analysis, data was acquired using two sequential methods: the first in positive mode and the second in negative mode. The full-scan data was obtained at 100 to 600 m/z scanning range (3.0 spectra s−1), while Auto MS/MS data acquisition was carried out at 70 to 600 m/z, MS/MS scan rate at 2 spectra s−1. The UHPLC-QTOF-MS parameters were: a drying gas temperature of 200 °C, a drying gas flow rate of 8.0 L min−1, a sheath gas temperature of 400 °C, a sheath gas flow rate of 10.0 L min−1, nebulizer gas pressure of 35 psi, skimmer voltage of 45 V, octupole RF of 750 V, fragmentor voltage of 100 V, capillary voltage of 4.0 kV, and nozzle voltage of 1.0 kV. Ultrapure nitrogen (99.999%) was used as the collision gas. Collision energies of 10, 20, and 40 eV were applied for selective fragmentation of the analytes in Auto MS/MS mode. Agilent MassHunter Workstation software (version 10.0) was used for data acquisition, spectral processing, and qualitative analysis.
Optimization of UHPLC-QTOF-MS and UHPLC-QqQ-MS conditions
The analytical strategy adopted for method optimization initially involved optimizing the UHPLC-QqQ-MS conditions using authentic analytical standards for the target analytes, followed by the transfer and adjustment of the optimized parameters to the UHPLC-QTOF-MS system. Notably, the same chromatographic column, mobile-phase composition, and ionization conditions were employed in both instruments to ensure methodological consistency and comparability of results.
The chromatographic separation and ionization of the target analytes by UHPLC–QqQ–MS were optimized by evaluating different mobile-phase compositions. Initially, the chromatographic conditions reported by Cunha et al.[ref. 43] were adopted and subsequently adjusted to achieve optimal analyte separation. Thereafter, the influence of mobile-phase composition on the analytical response (peak area) was investigated. The aqueous phase (A) was fixed as water containing 0.1% formic acid (v/v) throughout all experiments, whereas the organic phase (B) was evaluated under the following conditions: methanol containing 0.5 mmol L⁻1 ammonium formate; acetonitrile containing 0.5 mmol L⁻1 ammonium formate; methanol containing 0.1% formic acid; acetonitrile containing 0.1% formic acid; methanol containing 0.1% formic acid and 0.5 mmol L⁻1 ammonium formate; and acetonitrile containing 0.1% formic acid and 0.5 mmol L⁻1 ammonium formate. For all experiments, a mixed solution containing all target analytes at a concentration of 500 ng mL⁻1 was injected six times (n = 6) for each mobile-phase composition.
After establishing the optimal mobile-phase composition, the ionization-source parameters were further optimized. Two different electrospray ionization sources were compared: the Agilent conventional ESI source (PN# G1948B) and the Agilent Jet Stream technology source (AJS, PN# G1958-67638). The AJS source uses superheated nitrogen to enhance droplet desolvation and ion generation while simultaneously reducing spray expansion. This effect improves ion transfer into the desolvation line, thereby increasing the analytical response.
D-µ-SPE extraction optimization
The analytical procedure developed in this study involved the use of a custom-designed glass extraction device combined with an innovative glass desorption apparatus specifically designed to complement it. This desorption device enabled sequential sorbent filtration and desorption within the same system, thereby reducing sorbent losses while simultaneously improving sample throughput.
After confirming the suitability of the D-µ-SPE device for the extraction procedure, the next step focused on investigating the factors affecting dispersive solid-phase extraction efficiency. In the initial stage, a resolution III fractional factorial design was employed to screen the significant variables. These factors were divided into two groups: (i) extraction factors and (ii) desorption factors.
The extraction factors included extraction time (10–40 min), sorbent type (OASIS MCX or OASIS HLB), sorbent amount (50–150 mg), and NaCl percentage (salting-out effect). The desorption factors comprised desorption time (1–5 min), desorption solvent volume (methanol, 1–5 mL), and the percentage of ammonium hydroxide in methanol (5–10%, v/v). A total of eleven experiments were performed in random order, including three replicates at the central point. In all extraction trials, 100 mL of sample solution containing all analytes at 100 ng L⁻1 each was used.
The significant factors identified during the screening stage were selected for further optimization using response surface methodology (RSM). The Doehlert design was chosen because of its recognized efficiency [ref. 44].
QA/QC and method validation
Precautionary measures were taken prior to analysis to minimize the risk of cross-contamination. Blank analyses were performed, including instrumental, reagent, and method blanks. Instrumental blanks were assessed by injecting the LC-MS/MS mobile phase. Reagent blanks were evaluated by analyzing the organic solvents used throughout the procedure, whereas method blanks were assessed by extracting ultrapure water according to the prescribed procedure in the absence of analytes [ref. 45]. None of these blank tests showed detectable levels of the target analytes.
Isotopically labeled standards such as amphetamine-d6, MDMA-d5, norfentanyl-d5, methamphetamine-d11, and cocaine-d3 were used as surrogate standards. They were added to the samples and blanks before the extraction at a final concentration of 200 ng L−1. The recoveries of the surrogate standards added to the samples were evaluated in each batch. The recoveries ranged from 78.2 to 97.4% for all target analytes.
The analytical procedure was subjected to validation according to the analytical parameters recommended by IUPAC for “in-house” validation [ref. 46, ref. 47]. The matrix effect (ME), linear range and linearity, limit of detection (LOD), limit of quantification (LOQ), precision, and trueness (recovery assay) were evaluated. In addition, the enrichment factor (EF) and extraction recovery (ER) were investigated to assess the extraction efficiency. Details for method validation and calculations can be found in Supplementary Information.
Wastewater sample analysis
Samples were analyzed under the optimized and validated method conditions. For extraction, 100 mL of wastewater was spiked with 100 µL of a surrogate standard mixture to yield a final concentration of 100 ng L⁻1. The sample was then transferred to a glass extraction device containing 50 mg of OASIS MCX sorbent, previously weighed on an analytical balance (± 0.1 mg). The device was sealed with a glass lid and subjected to vortex-assisted extraction for 30 min at 1000 rpm.
Subsequently, the desorption device was connected to the extraction unit, and the assembled system was coupled to a vacuum filtration setup. The sample solution was filtered, allowing the sorbent to be retained at the bottom of the desorption device. For analyte desorption, 1.25 mL of 5% ammonium hydroxide in methanol was added to the device containing the sorbent, followed by vortex agitation for 3 min at 2500 rpm.
After desorption, approximately 600 µL of the extract was transferred to a Whatman MiniUniprep syringeless filter unit (Cytiva, USA). The solution was immediately filtered and placed in the autosampler of the LC–HRMS system for injection and suspect screening analysis. A subsequent injection into the LC–MS/MS system was performed for quantification of the target compounds. An illustrative scheme of the overall workflow is presented in Fig. 1.
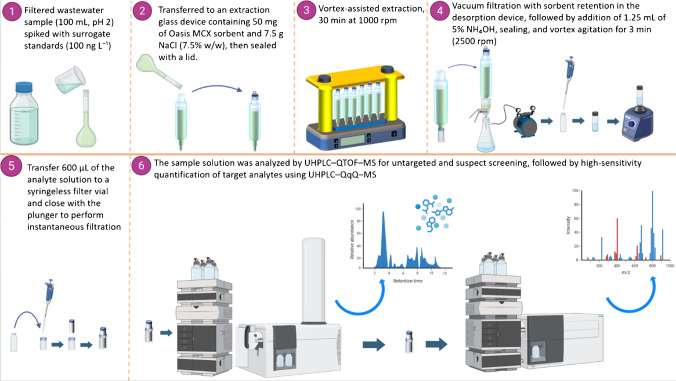
Suspect screening workflow
Suspect screening was performed using Agilent MassHunter Qualitative Analysis Software version 10.0. Data were processed without noise filtering or additional spectral pre-treatment. Both positive and negative ionization modes were evaluated; for the positive mode, adducts commonly formed with the mobile phase or sample matrix were considered, including [M+H]⁺, [M+Na]⁺, and [M+NH4]⁺. Molecular formula generation included elements typically present in illicit drugs and pharmaceuticals (C, H, O, N, S, and Cl). Quality assurance was based on the use of procedural blanks consisting of ultrapure water subjected to the same extraction protocol as the samples. Features detected in procedural blanks were considered background contaminants and removed from the suspect list prior to further evaluation.
Database searches were conducted using accurate-mass tolerances of 10 ppm for precursor ions and 15 ppm for fragment ions. A retention-time window of ± 0.25 min was applied when comparing experimental features with database entries. Acquired spectra were matched against the Agilent PCDL Spectral Library, and suspect identification was performed using the Compound Discovery and Compound Mining algorithms from Auto MS/MS data.
Data-dependent acquisition was employed, in which the five most intense precursor ions detected in the MS survey scan (m/z 70–600, 3 spectra s⁻1) were automatically selected for MS/MS fragmentation. Product-ion spectra were acquired over m/z 70–600 at 2 spectra s⁻1, using an isolation width of 4 amu. Variable collision energies of 10, 20, and 40 eV were applied for selective fragmentation of the analytes in Auto MS/MS mode. A TIC intensity threshold of 1000 counts was applied for MS/MS triggering in both ionization modes. Fragment ions were only considered when presenting a signal-to-noise ratio greater than 5. Confirmation of suspect compounds required a minimum match confidence of 70%. Identification confidence levels followed the Schymanski et al. [ref. 48] classification. Features with accurate mass within tolerance were assigned to level 5. Candidates additionally exhibiting agreement with the theoretical isotopic pattern were classified as level 4. Compounds supported by exact mass, isotopic pattern, and experimental MS/MS spectra were assigned to level 3. Matches based solely on compound mass lists were considered level 2b, whereas those supported by spectral library matching were classified as level 2a. Compounds confirmed using authentic analytical standards were reported as level 1.
Data analysis
Microsoft Excel (Office 365, Redmond, WA, USA) was used for mathematical calculations. Statistica 7.0 (Tulsa, OK, USA) was employed to evaluate the goodness-of-fit of the mathematical models obtained from the experimental design using analysis of variance (ANOVA, p < 0.05) and to construct response surface plots. Model significance and lack of fit were assessed by F-tests, calculated as the ratios MSR/MSr (mean square of regression over mean square of residuals) and MSlof/MSpe (mean square of lack of fit over mean square of pure error), respectively, and compared with the tabulated F value at a 5% significance level. OriginPro 2026 (OriginLab, Northampton, MA, USA) was used for graphical representation.
Results and discussion
Optimization of the chromatography and mass-spectrometry conditions
Details concerning the optimization of the mobile phase composition are provided in the Supplementary Information (Figs. S1–S4). In addition, the type of ionization source was considered a critical parameter for achieving high sensitivity for the target analytes. Therefore, the influence of the ionization source on the analytical response was systematically evaluated. The results demonstrated that the use of the AJS ionization source increased method sensitivity by up to one order of magnitude for all analytes (Fig. S5). Based on these findings, the AJS source was selected for subsequent analyses using both the UHPLC-QTOF-MS and UHPLC-QqQ-MS systems. The retention times and precursor ions of the target illicit drugs are presented in Table S2.
Optimization of the D-µ-SPE extraction conditions
The influencing factors on D-µ-SPE extraction were thoroughly investigated utilizing a resolution III fractional factorial design [ref. 49]. The ANOVA (p < 0.05) was applied to evaluate the fit of the linear model. The results indicate that most of the variance in the experimental response was explained by the mathematical model and not by the residues (R2 = 0.9809). There is no evidence of a lack of fit at a 95% confidence level, and the residuals were low and randomly distributed. The analysis of the Pareto graph of standardized estimated effects (Fig. 2) revealed that the factors “sorbent mass,” “NaCl concentration,” “sorbent type,” “NH4OH concentration,” and “the extraction time” were statistically significant at a 95% confidence level.
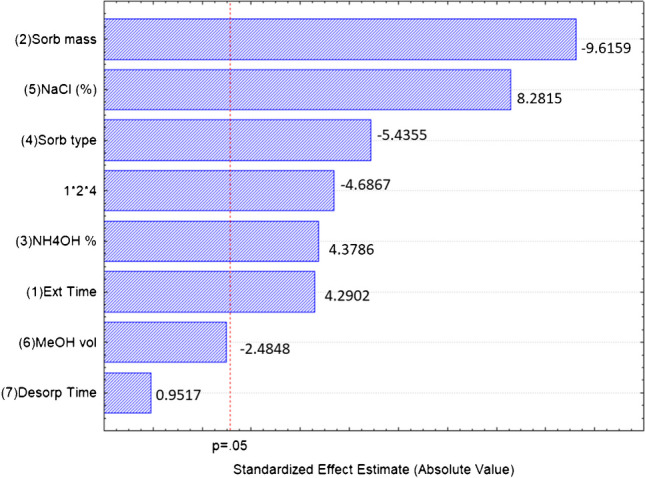
Notably, the factor “sorbent mass” demonstrated a pronounced negative effect, suggesting that using lower amounts of sorbent led to an increase in the peak areas of the analytes. Using a greater sorbent mass requires a substantial increase in the volume of desorption solvent or an increase in solution pH. On the other hand, the factor “percent of NaCl” exhibited a strong positive effect on the analytical response, indicating an increase in the analyte peak areas when the NaCl percentage was increased. This can be explained by considering the salting out effect, which occurs when employing elevated salt concentrations, such as NaCl. The solubility of polar organic substances in the aqueous medium can be decreased in the presence of sodium and chloride ions [ref. 50]. Consequently, the partitioning equilibrium is altered to favor the interaction between the analytes and the sorbent.
The qualitative factor “sorbent type” exhibited a negative effect, indicating that the sorbent studied in the lowest level of the experimental design was more effective in extracting the analytes. In other words, the mixed-mode polymeric sorbent OASIS MCX containing the alkylbenzenesulfonate group as a cation exchange agent provides better results than the OASIS HLB (hydrophilic-lipophilic balanced sorbent). This can be explained by considering the basic properties of most target analytes. The basic drugs are protonated in an acidic medium (pH 2), acquiring a positive charge. Thus, the interaction with the alkylbenzenesulfonate cation-exchange group is highly favored, increasing analyte sorption. On the other hand, the factor “extraction time” demonstrated a positive effect, indicating that a longer extraction time is required for the analytes to attain the sorption equilibrium.
Regarding the desorption factors, such as “desorption time,” “volume of MeOH,” and “percentage of NH4OH,” it was observed that only “percent of NH4OH” was significant, exhibiting a positive effect on the response. In other words, adding NH4OH to methanol above 5% improves the desorption step, leading to an increase in the analytes’ peak areas. However, the pH of the methanolic solution is also increased. This may be challenging when using C18 chromatographic columns with a restricted pH range (pH 2–8). For these reasons, we decided to fix the NH4OH concentration at 5%, as it is routinely used in most published papers. The non-significant factors “desorption time” and “volume of methanol” were fixed at the center-point values of the experimental design.
The factors "OASIS MCX mass," "percentage of NaCl," and "extraction time," which influenced the analytical response, were investigated using response surface methodology (RSM) to determine optimal conditions. A Doehlert matrix consisting of three variables was employed (Table S3A). ANOVA (p < 0.05) was conducted to evaluate the adequacy of the quadratic model fit (Table S3B). The ANOVA results revealed that the MSR/MSr ratio (calculated F = 1.39) was below the critical F-value (4.10), indicating that the quadratic model was not statistically significant at the 95% confidence level. This may be attributed to the low variability in the responses when different levels were tested. However, no evidence of lack of fit was observed, as the MSlof/MSpr ratio (1.11) was lower than the critical F value (9.28). The obtained quadratic model could not be used for optimum point prediction in this condition. Consequently, a visual inspection of the multiple responses was performed in the Doehlert design data matrix (Table S3A), where a maximum response was observed in the center point of the experimental design (50 mg OASIS MCX, 7.5% NaCl % wt., and 30 min of extraction time). Under these conditions, we performed extraction tests in triplicate, and extraction recoveries ranging from 60 to 109% were obtained for most of the target analytes. Thus, we decided to keep these conditions for further steps.
Validation of the analytical procedure
The analytical parameters of the procedure developed are presented in Table 1. Concerning selectivity, no interfering compounds were observed to elute at the same retention time as the target analytes in any dMRM transitions. The matrix effect study (ME) indicated both ion suppression and signal enhancement induced by the matrix (Fig. 3).
Table 1: Validation parameters of the developed analytical procedure
| Linearity | Precision | Extraction efficiency | ||||||||||||
|---|---|---|---|---|---|---|---|---|---|---|---|---|---|---|
| Compounds | Linear range(ng L−1) | R2 | F-calc(F-critical)a | T-cal(t-critical)a | LOD(ng L−1) | LOQ(ng L−1) | Rep. (%) (n = 10) | Inter (%)(n = 30) | EF (EFmax = 80) | ER (%) | ||||
| AMP | 5.38–400 | 0.9977 | 213,067 (2.92) | 104 (2.05) | 1.62 | 5.38 | 1.18 | 7.24 | 75.8 | ± | 0.2 | 94.7 | ± | 0.2 |
| BEG | 7.88–400 | 0.9913 | 147,060 (2.92) | 54 (2.05) | 2.37 | 7.88 | 4.57 | 5.91 | 73.1 | ± | 1.0 | 91.4 | ± | 1.0 |
| CBN | 16.7–400 | 0.9964 | 23,241 (3.89) | 60 (2.059) | 5.01 | 16.7 | 0.870 | 7.41 | 20.3 | ± | 1.9 | 25.0 | ± | 1.9 |
| CBD | 28.2–600 | 0.9903 | 34,516 (4.38) | 73 (2.086) | 8.46 | 28.2 | 0.830 | 7.43 | 32.9 | ± | 1.8 | 41.1 | ± | 1.8 |
| CBZ | 8.72–500 | 0.9981 | 990,416 (2.89) | 121 (2.045) | 2.62 | 8.72 | 0.920 | 5.32 | 82.3 | ± | 0.9 | 100 | ± | 1 |
| COC | 5.65–400 | 0.9964 | 139,313 (2.92) | 83 (2.05) | 1.70 | 5.65 | 1.16 | 2.98 | 75.8 | ± | 0.2 | 94.7 | ± | 0.2 |
| COET | 7.00–400 | 0.9968 | 199,924 (2.89) | 93 (2.045) | 2.10 | 7.00 | 1.44 | 3.53 | 81.1 | ± | 1.8 | 100 | ± | 2 |
| EME | 20.5–500 | 0.9975 | 8894 (3.10) | 74 (2.145) | 6.15 | 20.5 | 6.45 | 19.2 | 20.9 | ± | 2.8 | 26.2 | ± | 2.8 |
| ETH | 5.63–500 | 0.9983 | 477,813 (2.94) | 116 (2.064) | 1.69 | 5.63 | 1.40 | 5.73 | 79.8 | ± | 0.5 | 99.8 | ± | 0.5 |
| FEN | 4.67–400 | 0.9979 | 282,246 (2.92) | 108 (2.056) | 1.40 | 4.67 | 2.08 | 4.73 | 86.2 | ± | 1.4 | 100 | ± | 1 |
| FENT | 6.17–400 | 0.9971 | 81,189 (2.94) | 93 (2.056) | 1.85 | 6.17 | 1.18 | 4.80 | 82.7 | ± | 0.5 | 100 | ± | 0 |
| MDA | 7.87–600 | 0.9997 | 263,602 (5.59) | 277 (2.064) | 2.36 | 7.87 | 2.50 | 4.10 | 48.0 | ± | 2.6 | 60.0 | ± | 2.6 |
| MBDB | 2.00–500 | 0.9977 | 431,136 (2.92) | 33 (2.056) | 2.00 | 6.65 | 1.53 | 6.02 | 74.4 | ± | 1.2 | 93.0 | ± | 1.2 |
| MDEA | 1.51–400 | 0.9980 | 723,094 (2.92) | 112 (2.056) | 1.51 | 5.03 | 1.20 | 5.68 | 78.1 | ± | 0.7 | 97.6 | ± | 0.7 |
| MDMA | 2.73–400 | 0.9959 | 723,094 (2.92) | 68 (2.101) | 2.73 | 9.10 | 7.75 | 9.45 | 58.8 | ± | 2.7 | 73.5 | ± | 2.7 |
| MET | 1.78–400 | 0.9983 | 164,577 (2.92) | 121 (2.056) | 1.78 | 5.94 | 0.950 | 4.66 | 74.6 | ± | 0.1 | 93.3 | ± | 0.1 |
| METH | 1.55–500 | 0.9982 | 303,624 (2.94) | 116 (2.064) | 1.55 | 5.16 | 0.570 | 5.27 | 70.3 | ± | 0.2 | 87.9 | ± | 0.2 |
| NEP | 6.84–500 | 0.9985 | 192,170 (2.89) | 128 (2.045) | 2.05 | 6.84 | 0.730 | 5.55 | 78.6 | ± | 0.3 | 98.3 | ± | 0.3 |
| NOR | 5.36–400 | 0.9939 | 236,618 (2.95) | 113 (2.069) | 1.61 | 5.36 | 3.21 | 7.04 | 80.9 | ± | 1.2 | 100 | ± | 1 |
| THC | 8.74–600 | 0.9963 | 75,105 (3.63) | 69 (2.101) | 8.79 | 29.3 | 1.57 | 8.44 | 21.7 | ± | 0.5 | 27.0 | ± | 0.5 |
a5% of significance in t-Student’s distribution. Rep., repeatability; Inter, intermediate precision; EF, enrichment factor; ER, extraction recovery
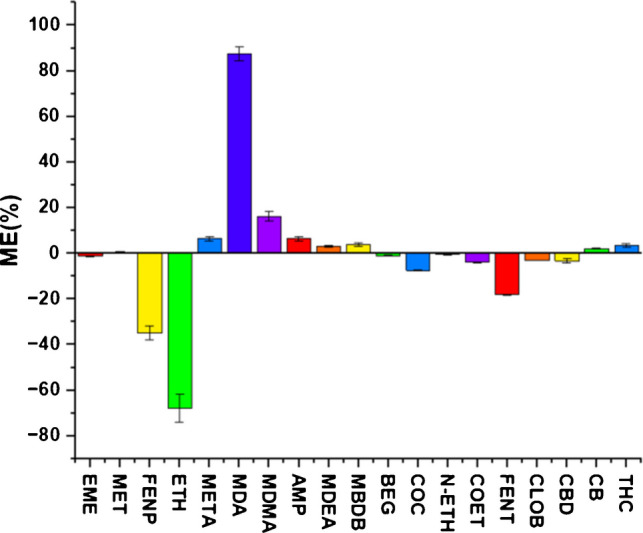
Overall, the ME values ranged from −34.8 to 87.5%. Signal suppression was observed for FENP, ETH, and FENT whereas significant signal enhancement was observed for MDA and MDMA. The remaining analytes showed moderate or insignificant ME. When employing LC-MS techniques, signal suppression represents a prevalent matrix effect. This phenomenon primarily arises due to the competition for ionization between the target analytes and either co-eluting or otherwise undetected components within the matrix at the electrospray ionization source [ref. 51, ref. 52]. An elevated concentration of matrix components in the sample extract can detrimentally impact the ionization efficiency of the target analytes, particularly when these matrix components are present in excess [ref. 52]. Due to the issues mentioned above, matrix-matched analytical curves were employed to correct the matrix effect.
With respect to linearity, an initial assessment revealed heteroscedasticity across all examined analytical curves. This condition was characterized by a proportional increase in the standard deviation of the analytical response (y) as the concentration (x) increased [ref. 42]. Consequently, it became imperative to employ weighted least squares regression utilizing the inverse of concentration (1/x) to address this issue[ref. 53]. After this adjustment, the coefficient of determination (R2) was observed to vary from 0.9903 (CBD) to 0.9985 (NEP). To certify the appropriateness of R2, a t-test was employed for all analytical curves [ref. 45]. The results indicated that the calculated t value was much higher than the critical t value at 95% confidence (Table 1). Additionally, the application of ANOVA (p < 0.05) to all analytical curves demonstrated that the linear model was significant with respect to the residuals, as evidenced by the calculated F-value (goodness of fit), which exceeded the critical F value by more than 100-fold at a 95% confidence level [ref. 45]. Thus, the analytical curves were considered suitable for analyte quantification.
LOD and LOQ values ranged from 1.40 ng L⁻1 (FEN) to 8.79 ng L⁻1 (THC) and from 4.67 ng L⁻1 to 29.3 ng L⁻1 for the same compounds, respectively. In comparison, the LOQs achieved in the present study were lower than those reported by Psichoudaki et al. (2023) for AMP (6.40 ng L⁻1), METH (5.5 ng L⁻1), and BEG (15.5 ng L⁻1), with the exception of MDMA (3.4 ng L⁻1) [ref. 54]. Notably, although the authors employed the same sample volume (100 mL), sorbent material (OASIS MCX), and instrumental configuration, their methodology differed in that conventional SPE was employed for analyte extraction from the samples.
Regarding precision, RSD values for repeatability ranged from 0.83% (CBD) to 6.45% (EME), demonstrating that all target compounds exhibited RSD values below 10%. Similarly, RSD values for intermediate precision varied between 2.98% (COC) and 19.2% (EME). Considering that RSD values of up to 20% are generally considered acceptable at the concentration levels evaluated in this study, the proposed D-µ-SPE procedure can be regarded as precise [ref. 55].
With respect to the extraction performance of the proposed D-µ-SPE procedure, enrichment factors (EF) ranged from 20.3 (CBN) to 86.2 (FENT), while extraction recoveries (ER) varied from 73.5% (MDMA) to 100% (FEN, FENT, NOR, CBZ, and COET) for most of the target analytes (Table 1). However, lower ER values (≤ 60%) were observed for MDA, EME, and cannabinoids (CBN, CBD, and THC). For MDA and EME, the reduced ER can be attributed to strong interactions between these polar compounds and the cation-exchange functional groups of the OASIS MCX sorbent, which may hinder complete elution of the analytes. In the case of cannabinoids, the presence of a long alkyl chain increases molecular hydrophobicity, thereby limiting interactions with the polar functionalities and ionic-exchange sites of the sorbent.
As no certified reference material is commercially available for illicit drugs in wastewater matrices, trueness was assessed through relative recovery experiments. As shown in Table S4, relative recoveries ranged from 79.3% (FEN) to 118% (NOR) in spiked wastewater samples and from 60.7% (BEG) to 105% (NOR) in river water samples.
Overall, satisfactory relative recoveries were obtained at all evaluated concentration levels, with the exception of BEG, which exhibited a relative recovery of 60.7% at the lowest spiking level in river water. Nevertheless, BEG showed satisfactory recovery at higher concentration levels in both wastewater and river water. Although recovery values within the range of 80–120% are commonly regarded as acceptable in the literature, this criterion may be broadened to 60–120%, depending on analyte concentration and matrix complexity [ref. 55]. Accordingly, the proposed procedure can be considered accurate for the analysis of wastewater and river water samples.
Analysis of real wastewater samples
Suspect screening
The initial step comprised suspect screening of potential illicit drugs and pharmaceuticals in wastewater samples using UHPLC–Q-TOF-MS. Data processing was performed with the Compound Discovery workflow, applying an MS/MS-based compound mining algorithm. The Water Screening and Veterinary Drugs libraries available in the MassHunter PCDL package were used to tentatively match experimental mass spectra with database entries.
On average, approximately 600 candidate features were detected per sample prior to data curation. Following systematic filtering and evaluation of the candidates, 35 compounds were retained and assigned identification confidence levels according to established criteria. Of these, 28.6% were confirmed at level 1 by comparison with authentic analytical standards. A further 34.3% were assigned to level 2 (2a or 2b), indicating high-confidence identification based on diagnostic MS/MS evidence and/or library matching. The remaining compounds were classified as level 3 (14.3%) or level 4 (22.9%), corresponding to tentative candidates and unequivocal molecular formula assignments, respectively. It should be emphasized that other common organic contaminants, including pesticides, personal care products, and plasticizers, were also detected. However, these substances were not included in the discussion, as the analytical focus was restricted to illicit drugs and pharmaceutical compounds. The list of compounds retained after suspect screening is summarized in Table 2.
Table 2: Illicit drugs and pharmaceuticals identified by UHPLC-QTOF-MS (ESI+) in real wastewater samples
| Compound | Rt (min) | Molecular Formula | PrecursorTheoretical [M+H]+ (m/z) | Measured[M+H]+ (m/z) | Mass error (ppm) | MS2Characteristic fragment (m/z) | ΔRt (min) | Confidence level | Classification |
|---|---|---|---|---|---|---|---|---|---|
| 2,6-Xylidine | 2.47 | C8H11N | 122.0964 | 122.0965 | 0.82 | 79.0542 | NA | 4 | Chemical/lidocaine metabolite |
| Alprenolol | 3.69 | C15H23NO2 | 250.1802 | 250.1810 | 3.20 | 91.0542 | NA | 2b | Non-selective beta-blocker |
| Ampyrone* | 4.68 | C11H13N3O | 226.0951 | 226.0957 | 2.65 | – | NA | 4 | Aminopyrine metabolite, analgesic |
| Amphetamine | 2.78 | C9H13N | 136.1121 | 136.1120 | −0.73 | 91.0541 | 0.20 | 1 | CNS stimulant |
| Benzoyilecgonine | 4.57 | C16H19NO4 | 290.1387 | 290.1395 | 2.76 | 168.1019 | 0.03 | 1 | Cocaine Metabolite |
| 17-β-Estradiol (E2) | 9.24 | C18H24O2 | 273.1849 | 273.1851 | 0.73 | 255.1747 | NA | 3 | Natural steroidal estrogen hormone |
| Bisoprolol | 8.54 | C18H31NO4 | 326.2326 | 326.2322 | −1.23 | 162.0986 | NA | 2b | β1-selective blocker |
| Caffeine | 4.24 | C8H10N4O2 | 195.0877 | 195.0873 | −2.05 | 138.0656 | NA | 2a | CNS stimulant, wastewater marker |
| Carbamazepine | 6.81 | C15H12N2O | 237.1022 | 237.1031 | 3.80 | 194.0967 | NA | 2b | Dibenzazepine anticonvulsant |
| Ciprofloxacin | 4.27 | C17H18FN3O3 | 332.1405 | 332.1421 | 4.82 | 288.1517 | NA | 2b | Broad-spectrum antibiotic |
| Cocaethylene | 5.20 | C18H23NO4 | 318.1700 | 318.1699 | −0.31 | 196.1326 | 0.25 | 1 | Cocaine Metabolite |
| Cocaine | 4.81 | C17H21NO4 | 304.1543 | 304.1543 | 0.00 | 182.1176 | 0.12 | 1 | Stimulant |
| Coumarin | 5.63 | C9H6O2 | 147.0441 | 147.0442 | 0.68 | 91.0542 | NA | 2a | Fragrance/flavor compound |
| Ecgonine Methyl Ester | 5.97 | C10H17NO3 | 200.1281 | 200.1284 | 1.50 | 91.0540 | 0.07 | 1 | Cocaine Metabolite |
| Embutramide | 8.48 | C17H27NO3 | 294.2064 | 294.2073 | 3.06 | 221.1168 | NA | 3 | Sedative for veterinary euthanasia |
| Etilefrine | 1.67 | C10H15NO2 | 182.1176 | 182.1173 | −1.65 | 81.0691 | NA | 3 | Adrenergic agonist for hypotension |
| Fentanyl | 5.63 | C22H28N2O | 337.2275 | 337.2270 | −1.48 | 105.0321 | 0.14 | 1 | Synthetic opioid analgesic |
| Ibesartan | 7.54 | C25H28N6O | 429.2397 | 429.2412 | 3.49 | 207.0917 | NA | 2a | ARB antihypertensive |
| Lindocaine | 7.67 | C14H22N2O | 235.1805 | 235.1804 | −0.43 | – | NA | 4 | Local anesthetic, antiarrhythmic |
| Losartan | 7.24 | C22H23ClN6O | 423.1695 | 423.1691 | −0.95 | 157.0978 | NA | 2a | ARB antihypertensive |
| MBDB | 4.97 | C12H17NO2 | 208.1332 | 208.1333 | 0.48 | 135.0782 | 0.2 | 1 | Psychoactive/Recreational Drugs |
| MDMA | 4.01 | C11H15NO2 | 194.1176 | 194.1177 | 0.52 | 135.0439 | 0.14 | 1 | Psychoactive stimulant |
| Mephenesin | 6.00 | C10H14O3 | 183.1016 | 183.1010 | −3.28 | – | NA | 4 | Muscle Relaxant |
| Methylphenidate (Ritalin) | 4.49 | C14H19NO2 | 234.1489 | 234.1484 | −2.14 | – | NA | 4 | CNS stimulant for ADHD |
| Minoxidil | 4.26 | C9H15N5O | 210.1349 | 210.1342 | −3.33 | 150.0545 | NA | 2b | Vasodilator, treatment of hair loss |
| Nicotine | 1.79 | C10H14N2 | 163.1230 | 163.1234 | 2.45 | 117.0570 | NA | 2a | CNS stimulant |
| Norcocaine | 5.02 | C16H19NO4 | 290.1387 | 290.1376 | −3.79 | 168.1014 | 0.03 | 1 | active metabolite of cocaine |
| Phenazone | 4.77 | C11H12N2O | 189.1022 | 189.1019 | −1.59 | 104.0496 | NA | 2a | Anti-inflammatory/Analgesic |
| Atenolol | 8.85 | C14H22N2O3 | 267.1703 | 267.1715 | 4.49 | 190.0862 | NA | 3 | β-blocker |
| Propiram | 7.70 | C16H25N3O | 276.2070 | 276.2076 | 2.17 | – | NA | 4 | Opioid analgesic |
| Tapentadol | 6.50 | C14H23NO | 222.1852 | 222.1858 | 2.70 | 93.0691 | NA | 2b | Opioid analgesic |
| THC | 11.49 | C21H30O2 | 315.2319 | 315.2325 | 1.90 | 81.0696 | 0.05 | 1 | Psychoactive/Recreational Drugs |
| 11-Hydroxy-delta9-THC | 10.58 | C21H30O3 | 331.2268 | 331.2265 | 10.57 | 123.1180 | NA | 3 | THC metabolite |
| Tramadol | 7.28 | C16H25NO2 | 264.1958 | 264.1965 | 2.65 | – | NA | 4 | Atypical opioid analgesic |
| Zopiclone | 9.18 | C17H17ClN6O3 | 389.1123 | 389.1121 | −0.51 | – | NA | 4 | Sedative-hypnotic |
ΔRt (min), retention time variation regarding the analytical standard. *Precursor detected as [M+Na]+
Figure 4A presents the distribution of the detected compounds according to their pharmacological classification and Fig. 4B shows the frequency of detection of the detected compounds in the analyzed wastewater samples. The majority of the tentatively identified substances were assigned to the categories of central nervous system (CNS) stimulants and cardiovascular drugs. The CNS stimulant group comprised illicit drugs, including amphetamine, MDMA, MBDB, and cocaine, as well as licit stimulants such as caffeine and nicotine, which are widely consumed and commonly introduced into the sewage system through domestic wastewater. In addition, prescription stimulants were detected, including methylphenidate (commercially available as Ritalin) and phendimetrazine. Methylphenidate is extensively prescribed for the treatment of attention deficit hyperactivity disorder (ADHD), whereas phendimetrazine is classified as an anorectic agent with central stimulant activity. Together, these findings highlight the coexistence of illicit drugs, lifestyle-related stimulants, and therapeutic agents within the investigated wastewater samples.
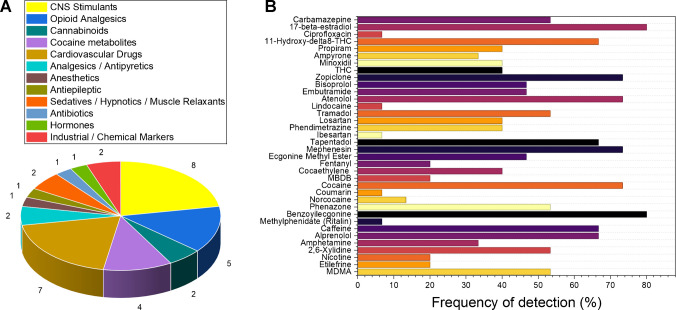
Cardiovascular agents comprised β-blockers (alprenolol, atenolol, and bisoprolol), angiotensin II receptor blockers used as antihypertensives (losartan and irbesartan), and the vasodilator etilefrine. The detection of these pharmaceuticals in wastewater likely reflects their widespread therapeutic use, consistent with the high prevalence of cardiovascular diseases, which remain the leading cause of premature mortality in Brazil [ref. 56]. Particular attention should be given to the occurrence of opioid analgesics, including fentanyl, tapentadol, and tramadol. These compounds are potent centrally acting opioids, generally reserved for the management of moderate to severe pain, often in hospital settings or specialized care. Their presence in wastewater is therefore of concern, as it may indicate substantial consumption and potential misuse. Notably, a recent study describing elevated tramadol concentrations in urban wastewater suggested possible non-medical use, supporting its classification as an emerging substance of abuse in certain contexts [ref. 18]. Other common detected contaminants include cocaine metabolites, sedatives, chemical markers, antiepileptics, hormones, and antibiotics. These finds are consistent with other recent studies which employed SPME combined with HRMS for investigation of emerging contaminants in aquatic environments [ref. 18, ref. 35].
With respect to the detection frequency (Fig. 5B), 17β-estradiol and benzoylecgonine (BEG) were identified in 80% of the wastewater samples. 17β-Estradiol is the primary biologically active estrogen in women of reproductive age, whereas BEG represents the main urinary metabolite of cocaine [ref. 41, ref. 57]. Given that human excretion via domestic wastewater constitutes the principal input pathway for these compounds into sewer systems, their high detection frequency in the investigated samples was expected. On the other hand, COC, mephenesin, EME, atenolol, and zopiclone were detected in 70% of the samples. In addition, alprenolol, caffeine, tapentadol, tramadol, 11-hydroxy-Δ9-tetrahydrocannabinol, and carbamazepine were present in more than 60% of the samples analyzed. The concurrent detection of 11-hydroxy-Δ9-tetrahydrocannabinol and THC (Δ9-tetrahydrocannabinol) may indicate cannabis consumption within the contributing population, as both compounds are associated with its metabolic excretion profile [ref. 58].
Quantification of illicit drugs in real wastewater samples
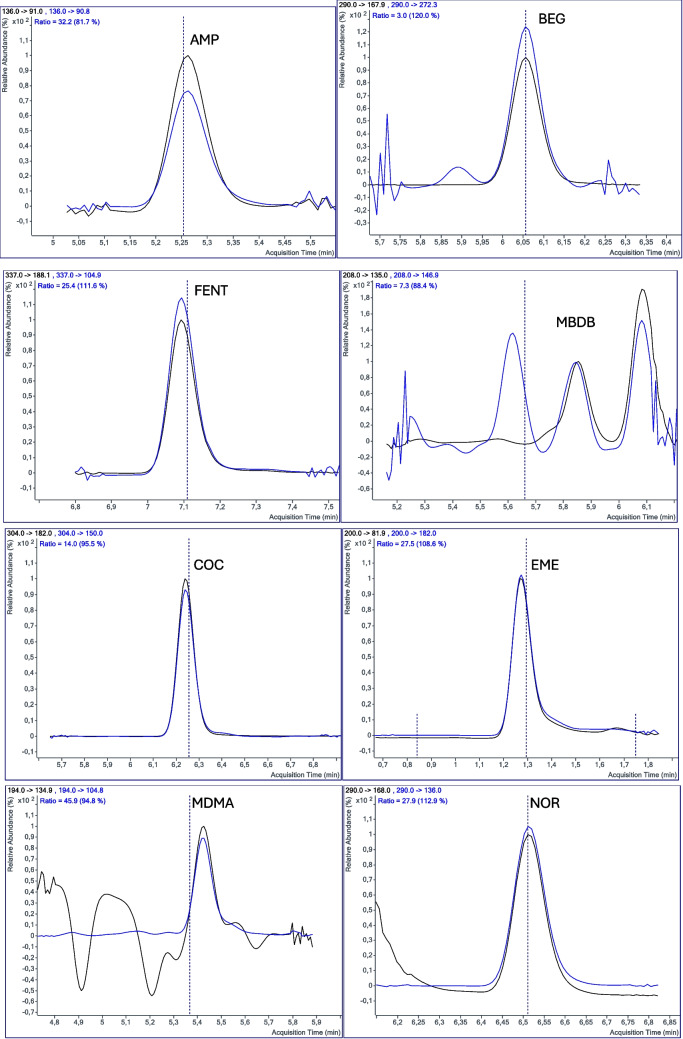
In the second step, the illicit drugs and pharmaceuticals confirmed at level 1 by HRMS for which authentic analytical standards were available, were quantified in the wastewater samples using the validated UHPLC-QqQ-MS method. Out of the twenty target analytes, eleven (COC, BEG, NOR, EME, FEN, MBDB, MDMA, AMP, CBN, CBD, and THC) were quantified in the wastewater samples. Cocaine and its metabolites were found to be the primary compounds detected in the samples, as previously indicated by the UHPLC-QTOF-MS suspect screening analysis. The concentration of COC ranged from 9.56 ng L−1 to 2392 ng L−1, whereas its metabolites BEG, NOR, COET, and EME exhibited concentrations ranging from 13.7 ng L−1 to 11,140 ng L−1, from 6.30 ng L−1 to 6825 ng L−1, from 12.7 ng L−1 to 81.6 ng L−1, and from 12.2 ng L−1 to 327 ng L−1, respectively. A multiple reaction monitoring (MRM) chromatogram of the quantified illicit drugs and pharmaceuticals is presented in Fig. 5.
COC is the second most consumed drug in Brazil and one of the most consumed worldwide; thus, high levels of this drug in wastewater were expected [ref. 2, ref. 59]. For comparison, the concentrations of COC and BEG found in this work were higher than those determined by Roveri et al. [ref. 8], who investigated the occurrence of COC in wastewater samples from Guarujá City, São Paulo, Brazil. They found COC and BEG concentrations ranging from 0.3 ng L−1 to 0.6 ng L−1 and from 0.3 ng L−1 to 1.7 ng L−1. The metabolites BEG and EME are the main products of COC metabolism and their presence in the wastewater samples indicates the excretion of COC [ref. 41, ref. 60]. The presence of the metabolite COET indicates the ingestion of cocaine (COC) in conjunction with alcoholic beverages, as the metabolic pathway of cocaine is altered in the presence of ethanol. Rather than undergoing hydrolysis with water, cocaine undergoes interesterification with ethanol to produce COET [ref. 60, ref. 61].
The assessment of COC/BEG ratios has been used to determine the primary source of COC input in sewage systems. BEG is a byproduct of COC hydrolysis, and its high concentration (resulting in a low COC/BEG ratio) in wastewater can indicate excreted COC rather than unmetabolized COC [ref. 41]. Conversely, it is accepted that a COC/BEG ratio exceeding 0.75 signifies the minimal metabolic conversion of COC to BEG, suggesting the presence of unmetabolized COC (as direct discharge into wastewater systems) [ref. 41]. In the present study, COC/BEG ratios spanning from 0.07 to 0.21 were observed in most of the analyzed samples, implying that the principal origin of cocaine (COC) likely stemmed from excretory pathways (urine, feces, or saliva). However, samples WW-04, WW-06, and WW-07 demonstrated substantially elevated COC/BEG ratios exceeding 0.75, suggestive of unconsumed cocaine (Fig. S6). This occurrence may plausibly be attributed to losses incurred during transportation and/or manipulation processes.
Regarding cannabinoids, CBN, CBD, and THC were detected at concentrations ranging from 37 ng L−1 to 176 ng L−1, from 9.2 ng L−1 to 36.5 ng L−1, and from 9.6 ng L−1 to 29.9 ng L−1, respectively. In addition, suspect screening revealed that the THC metabolite 11-hydroxy-Δ9-tetrahydrocannabinol was detected in 60% of the investigated samples, suggesting excretion following cannabis consumption. Cannabis is the most widely consumed illicit drug globally; thus, the presence of traces of these compounds in wastewater systems is justified [ref. 2, ref. 58, ref. 62]. The concentrations observed in this study for cannabinoids such as THC were lower than those reported by Campos-Mañas et al. [ref. 58], who investigated different types of sample preparation methods for extracting analytes from wastewater containing suspended solids and found THC concentrations ranging from 40 to 160 ng L−1. However, it is important to note that the primary objective of this study was to investigate the dissolved fraction, which may contain a reduced amount of these compounds compared to the suspended particulate matter (SPM).
The potent opioid FEN was found in lower concentrations (6.17–14.4 ng L−1) than COC, BEG, EME, NOR, and MBDB. This synthetic opioid has been a cause for concern due to its indiscriminate use as an additive in common illegal drugs such as cocaine, heroin, methamphetamine, and MDMA [ref. 63, ref. 64]. However, FEN is also used as a pharmaceutical in hospitals for patients receiving intensive care or pain treatment. The detection of additional opioid analgesics by suspect screening, such as tapentadol and tramadol, reinforces the hypothesis of pharmaceutical use.
Amphetamine-type stimulants such as AMP, MDMA, and MBDB were found in only one wastewater sample at concentrations ranging from 12.2 ng L−1 to 32.9 ng L−1. These drugs are commonly found in clubs and pubs, mainly in large urban centers [ref. 4, ref. 65].
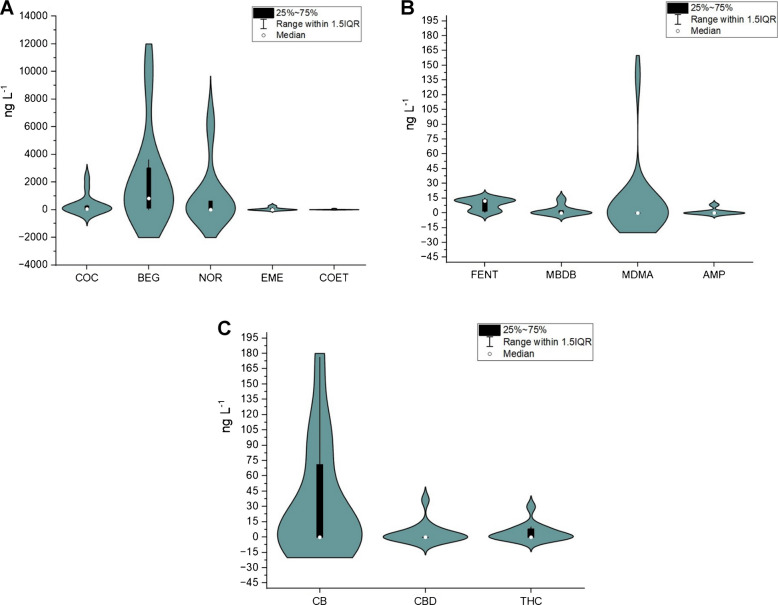
As shown in the violin and box–whisker plots in Fig. 6, COC, BEG, NOR, and EME exhibit marked variability across the sampling sites. The kernel density distribution indicates that, for COC, BEG, and NOR, the highest probability densities are centered near their respective median values, approximately 21 ng L⁻1, 142 ng L⁻1, and 211 ng L⁻1. In contrast, EME, COET, MBDB, and AMP showed comparatively low variability among the analyzed wastewater samples. Regarding cannabinoids, CBN showed greater variability in concentration than CBD and THC, indicating a more heterogeneous distribution across the investigated sites.
Evaluation of method greenness and comparison of the analytical performance of the developed procedure
The proposed procedure was assessed in accordance with Green Sample Preparation principles, which include: (1) favoring in situ sample preparation; (2) utilizing safer solvents and reagents; (3) employing sustainable, reusable, and renewable materials; (4) minimizing or avoiding waste generation; (5) minimizing sample, chemical and material amounts; (6) maximizing sample throughput; (7) integrating steps and promoting automation; (8) minimizing energy consumption; (9) ensuring green post-sample preparation practices; and (10) guaranteeing operator safety [ref. 54]. Each principle was quantitatively evaluated using the AgreePrep metric, which assigns a score ranging from 0 (non-compliant) to 1 (fully compliant) [ref. 66]. Based on this assessment, a colored pictogram is generated, displaying each criterion (1 to 10) in the outer circle and the overall score in the center. A score closer to 1 indicates a greener procedure, represented by a green pictogram, whereas a score approaching 0 signifies a less green procedure, depicted by a red pictogram [ref. 66]. As shown in Fig. 7A, the proposed procedure reached an overall score of 0.35, considered to exhibit moderate greenness, and therefore requires improvements to be considered of high greenness (> 0.75).
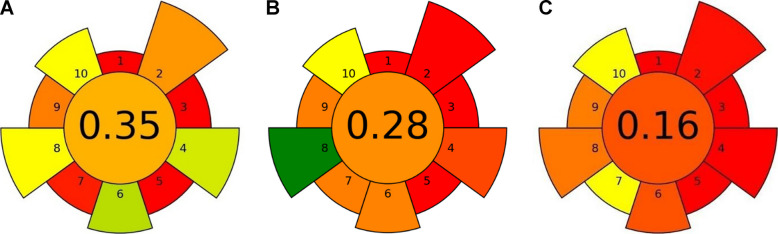
A detailed analysis of the pictogram in Fig. 7 shows that higher scores were obtained for criteria 4 and 6, corresponding to waste minimization and maximization of sample throughput, respectively. In the developed D-µ-SPE method, only 50 mg of sorbent and 1.25 mL of desorption solvent (methanol/5% NH4OH) are required, significantly reducing waste. In addition, a sample volume of 100 mL was sufficient to provide an adequate enrichment factor (EF), enabling both suspect screening by HRMS and subsequent quantification of target analytes at ultra-trace levels.
Compared to some conventional solid-phase extraction (SPE) procedures adopted for illicit drug analysis [ref. 4, ref. 8] (Fig. 7B and C), the proposed method generates less waste, as it eliminates the need for cartridge conditioning and elution steps and requires a similar sample volume.
Regarding analytical performance, the developed procedure was compared with recently published methods for the extraction of illicit drugs from wastewater, including conventional and automated SPE, and microextraction techniques such as dispersive liquid–liquid microextraction (DLLME) and liquid-phase microextraction (LPME). As shown in Table 3, the proposed procedure achieved RSD and recovery values comparable to those reported for microextraction approaches, including coated blade spray coupled to direct mass spectrometry (CBS-MS), DLLME, and LPME. Notably, the proposed method provided lower LOQ values, which is a key factor for the reliable quantification of illicit drugs in wastewater samples. On the other hand, these microextraction techniques typically require smaller sample volumes, which may be advantageous in situations where the collection of larger sample volumes is not feasible.
Table 3: Comparison of the analytical performance of the proposed method with commonly employed extraction techniques for the determination of illicit drugs and pharmaceutical compounds in wastewater, including key validation parameters such as LOD, LOQ, precision (RSD%), and recovery
| Extraction technique | Timea (min) | Sample volume (mL) | LOD(ng L−1) | LOQ(ng L−1) | RSD(%) | Recovery (%) | Ref |
|---|---|---|---|---|---|---|---|
| D-µ-SPE | 30 | 100 | 1.40–8.79 | 4.70–29.3 | 0.857–6.45 | 79.3–118 | This work |
| SPE | 167 | 500 | 0.060–533 | 0.210–1777 | 8.00–11.0 | NI | [ref. 35] |
| CBS-MS | 20 | 1.5 | 1.50–9.00 | 5.00–30.0 | 0.59–9.60 | 70.7–115 | [ref. 67] |
| DLLME | 10 | 10 | 0.570–14.3 | 7.00–670 | 0.300–11.1 | NI | [ref. 39] |
| SPE | NI | 1000 | 4.00 × 10⁻⁵–5.00 × 10⁻³ | 3.00 × 10⁻⁴–2.81 × 10⁻² | NI | NI | [ref. 8] |
| SPE | NI | 100 | 0.100–26.5 | 0.600–52.9 | 2.70–10.9 | 39.0–166 | [ref. 68] |
| SPE* | NI | 200 | NI | NI | NI | NI | [ref. 4] |
| SPE | 16 | 50 | 0.330 | 1.00 | 0.900–7.40 | 95.0–120 | [ref. 69] |
| LPME | 30 | 12 | 12.0–20.0 | 39.9–73.3 | 6.00–11.3 | 80.4–114 | [ref. 12] |
aExtraction duration. NI, not informed. *This work employed the same method reported by Baker et al. [ref. 62]
Overall, SPE methods employing sample volumes greater than 100 mL exhibit lower LOD and LOQ values than the proposed D-µ-SPE approach, while providing comparable RSD values (Table 3). This trend can be attributed to the increase in enrichment factor associated with larger sample volumes, which contributes to improved sensitivity. Importantly, the proposed method in this work employed a fixed sample volume of 100 mL, which was compatible with the customized glass device developed for D-µ-SPE extractions and did not compromise the LOQ values.
Additionally, the proposed procedure enabled sensitive detection in both target and suspect screening of illicit drugs and a broad range of pharmaceutical substances, with high-confidence confirmation achieved by high-resolution mass spectrometry and comparison with analytical standards. These characteristics indicate that the method is suitable for routine and environmental surveillance of these compounds in wastewater. Nevertheless, the relatively low extraction recoveries observed for certain cannabinoids, together with the extraction time of 30 min, constitute the main limitations of the methodology.
Conclusion
An efficient D-µ-SPE analytical method was successfully developed in combination with the UHPLC-QTOF-MS and UHPLC-QqQ-MS systems for both suspect screening and highly sensitive quantification of illicit drugs and pharmaceutical substances in complex wastewater samples.
The method provided adequate enrichment factors and extraction recoveries using only 100 mL of sample, eliminated solvent evaporation steps, and enabled sequential suspect screening and multi-analyte determination within a single sample preparation workflow. In comparison with other extraction methodologies, the proposed approach exhibited comparable LOD, LOQ, RSD, and recovery values. However, the use of a fixed sample volume of 100 mL may limit sensitivity when compared with traditional SPE methodologies that typically employ larger sample volumes.
The Analytical Greenness Metric for Sample Preparation (AGREEprep) was applied to assess the greenness of the developed method. Although the D-µ-SPE method showed some limitations (overall score < 0.5), it achieved favorable scores for minimizing or avoiding waste generation and maximizing sample throughput.
The application of the proposed method to real wastewater samples enabled suspect screening using data-dependent acquisition, allowing the identification of potential illicit drugs, metabolites, and pharmaceutical substances. Central nervous system stimulants, opioid analgesics, cardiovascular drugs, and cannabis-related biomarkers were detected. Quantification of target analytes by UHPLC-QqQ-MS confirmed the presence of illicit drugs such as cocaine and its metabolites, as well as synthetic amphetamine derivatives, including MDMA and MBDB. Cannabinoids were also detected, and some were quantified. The presence of the metabolite 11-hydroxy-THC suggested excretion as the primary pathway by which these substances enter wastewater.
Although lower recoveries were observed for selected cannabinoids and the extraction time remains moderate, the overall robustness, analytical scope, and compatibility with retrospective HRMS data analysis make this workflow a promising tool for routine environmental and epidemiological monitoring.
Supplementary Materials
References
- 1. UNODC. Global Overview: Drug Demand Drug Supply. In: World Drug Report. 2021. https://www.unodc.org/unodc/en/data-and-analysis/wdr-2021_booklet-2.html. Accessed 7 May 2022
- 2. UNODC. 2023 World Drug Report: Key Messages. In: World Drug Report. 2023;(2023):1–15. https://www.unodc.org/res/WDR-2023/Special_Points_WDR2023_web_DP.pdf. Accessed 16 Jan 2024
- 3.Nandakumar R, Gollakota S, Sunshine JE. Opioid overdose detection using smartphones. Sci Transl Med. 2019; 11(474):eaau8914. 10.1126/scitranslmed.aau8914.
- 4. Chappell A, Armstrong B, Jay E, Phung K, McCormick S, Grigg S, Waite B. Illicit drug consumption estimated using wastewater analysis and compared by settlement size in New Zealand. Sci Total Environ. 2022;843. 10.1016/j.scitotenv.2022.156956
- 5. Sandre F, Huynh N, Caupos E, El-Mrabet L, Partibane C, Lachaise I, Pommier C, Rivard M, Morin C, Moilleron R, Le Roux J, Garrigue-Antar L. Occurrence and fate of an emerging drug pollutant and its by-products during conventional and advanced wastewater treatment: Case study of furosemide. Chemosphere. 2023;322. 10.1016/j.chemosphere.2023.138212
- 6. Cuello GV, Saracho Bottero MA, Llanos EN, Garaffo GV, Hines E, Elías R, Jaubet ML. Submarine outfall effect on subtidal macrobenthic communities in a southwestern Atlantic coastal city. Heliyon. 2023;9. 10.1016/j.heliyon.2023.e18258
- 7. Castiglia Feitosa R, Rosman PCC, Wasserman JC, Bleninger T. Microbiological water quality assessment of sewage discharge through Barra da Tijuca (Rio de Janeiro, Brazil) submarine outfall. Environ Monit Assess. 2023;95. 10.1007/s10661-023-11767-9
- V Roveri, L Lopes Guimarães, W Toma, AT Correia. Occurrence and risk assessment of pharmaceuticals and cocaine around the coastal submarine sewage outfall in Guarujá, São Paulo State, Brazil. Environ Sci Pollut Res, 2021. [DOI]
- CDS Pereira, LA Maranho, FS Cortez, FH Pusceddu, AR Santos, DA Ribeiro, A Cesar, LL Guimarães. Occurrence of pharmaceuticals and cocaine in a Brazilian coastal zone. Sci Total Environ, 2016. [DOI | PubMed]
- 10. Zhao J, Lu J, Zhao H, Yan Y, Dong H, Li W. Illicit drugs and their metabolites in urban wastewater: Analysis, occurrence and consumption in Xinjiang, China. Sci Total Environ. 2022;852. 10.1016/j.scitotenv.2022.158457
- S Wu, Y Dong, B Lin, X Shen, P Xiang, C Huang. Sensitive determination of illicit drugs in wastewater using enrichment bag-based liquid-phase microextraction and liquid-chromatography tandem mass spectrometry. J Chromatogr A, 2022. [DOI | PubMed]
- 12. Nascimento MM, Nascimento ML, Pereira dos Anjos J, Cunha RC, da Rocha GO, Ferreira dos Santos I, Pereira PAP, de Andrade JB. A green method for the determination of illicit drugs in wastewater and surface waters-based on a semi-automated liquid-liquid microextraction device. J Chromatogr A. 2023;1710. 10.1016/j.chroma.2023.464230
- 13. Chen X, Liu S, Jiang R, Luan T, Ouyang G. Rapid detection and speciation of illicit drugs via a thin-film microextraction approach for wastewater-based epidemiology study. Sci Total Environ. 2022;842. 10.1016/j.scitotenv.2022.156888
- C Augusto, M Júnior, B Ferreira Da Silva, RS Lamarca, P Clairmont, F De, L Gomes. Automated method to determine pharmaceutical compounds in wastewater using on-line solid-phase extraction coupled to LC-MS/MS. Anal Bioanal Chem, 2021. [DOI | PubMed]
- 15. Hahn RZ, Bastiani MF, de Lima Feltraco Lizot L, da Silva Moreira IC, Meireles YF, Schneider A, do Nascimento CA, Linden R. Determination of a comprehensive set of drugs of abuse, metabolites and human biomarkers in wastewater using passive sampling followed by UHPLC-MS/MS analysis. Microchem J. 2022;172:106960. 10.1016/j.microc.2021.106960
- 16. Cavaillé L, Kim C, Bounouba M, Zind H, Claparols C, Riboul D, Pinelli E, Albasi C, Bessiere Y. Development and validation of QuEChERS-based extraction for quantification of nine micropollutants in wastewater treatment plant. Anal Bioanal Chem. 2021;413:5201–5213. 10.1007/s00216-021-03489-z/Published
- 17. Restrepo-Vieira LH, Busetti F, Linge KL, Joll CA. Development and validation of a direct injection liquid chromatography-tandem mass spectrometry method for the analysis of illicit drugs and psychopharmaceuticals in wastewater. J Chromatogr A. 2022;1685. 10.1016/j.chroma.2022.463562
- M Massano, A Salomone, E Gerace, E Alladio, M Vincenti, M Minella. Wastewater surveillance of 105 pharmaceutical drugs and metabolites by means of ultra-high-performance liquid-chromatography-tandem high resolution mass spectrometry. J Chromatogr A, 2023. [DOI | PubMed]
- 19. Adhikari S, Kumar R, Driver EM, Bowes DA, Ng KT, Sosa-Hernandez JE, Oyervides-Muñoz MA, Melchor-Martínez EM, Martínez-Ruiz M, Coronado-Apodaca KG, Smith T, Bhatnagar A, Piper BJ, McCall KL, Parra-Saldivar R, Barron LP, Halden RU. Occurrence of Z-drugs, benzodiazepines, and ketamine in wastewater in the United States and Mexico during the Covid-19 pandemic. Sci Total Environ. 2023;857. 10.1016/j.scitotenv.2022.159351
- AB Montgomery, CE O’Rourke, B Subedi. Basketball and drugs: Wastewater-based epidemiological estimation of discharged drugs during basketball games in Kentucky. Sci Total Environ, 2021. [DOI | PubMed]
- KY Kim, JE Oh. Evaluation of pharmaceutical abuse and illicit drug use in South Korea by wastewater-based epidemiology. J Hazard Mater, 2020. [DOI | PubMed]
- H Piri-Moghadam, F Ahmadi, J Pawliszyn. A critical review of solid phase microextraction for analysis of water samples. TrAC – Trends in Analytical Chemistry, 2016. [DOI]
- A Chisvert, S Cárdenas, R Lucena. Dispersive micro-solid phase extraction. TrAC-Trends Anal Chem, 2019. [DOI]
- M Ghorbani, M Aghamohammadhassan, H Ghorbani, A Zabihi. Trends in sorbent development for dispersive micro-solid phase extraction. Microchem J, 2020. [DOI]
- T Khezeli, A Daneshfar. Development of dispersive micro-solid phase extraction based on micro and nano sorbents. TrAC – Trends in Analytical Chemistry, 2017. [DOI]
- 26. Wang L, Chen G, Shu H, Cui X, Luo Z, Chang C, Zeng A, Zhang J, Fu Q. Facile covalent preparation of carbon nanotubes / amine-functionalized Fe3O4 nanocomposites for selective extraction of estradiol in pharmaceutical industry wastewater. J Chromatogr A. 2021;1638. 10.1016/j.chroma.2021.461889
- 27. Zhang S, Cui HR, Zhao YG, Zhan PP. Preparation and application of nano petal-shaped covalent organic frameworks modified polystyrene-divinylbenzene- glycidylmethacrylate microspheres for the extraction of illicit drugs from wastewater. J Chromatogr A. 2022;1682. 10.1016/j.chroma.2022.463505
- 28.Zheng M, Chen J, Zhang L, Cheng Y, Lu C, Liu Y, Singh A, Trivedi M, Kumar A, Liu J. Metal organic frameworks as efficient adsorbents for drugs from wastewater. Mater Today Commun. 2022;31:103514. 10.1016/j.mtcomm.2022.103514.
- M Ghorbani, M Chamsaz, M Aghamohammadhasan, A Shams. Ultrasonic assisted magnetic dispersive solid phase microextraction for pre concentration of serotonin–norepinephrine reuptake inhibitor drugs. Anal Biochem, 2018. [DOI | PubMed]
- MA Farajzadeh, A Yadeghari, L Khoshmaram. Magnetic solid phase extraction using Fe 3O4@SiO2@C8 nanoparticles performed in a narrow-bore tube followed by dispersive liquid–liquid microextraction for extraction and preconcentration of nine pesticides. New J Chem, 2018. [DOI]
- 31. Abad MOK, Masrournia M, Javid A. Synthesis of novel MOF-on-MOF composite as a magnetic sorbent to dispersive micro solid phase extraction of benzodiazepine drugs prior to determination with HPLC-UV. Microchem J. 2024;197. 10.1016/j.microc.2023.109797
- MPM Vivas, ST Martinez, JB de Andrade, GO da Rocha. Method development using chemometric tools for determination of endocrine-disrupting chemicals in bottled mineral waters. Food Chem, 2022. [DOI | PubMed]
- A López, V Yusà, M Millet, C Coscollà. Retrospective screening of pesticide metabolites in ambient air using liquid chromatography coupled to high-resolution mass spectrometry. Talanta, 2016. [DOI | PubMed]
- 34. Montone CM, Giannelli Moneta B, Aita SE, Aulenta F, Cavaliere C, Cerrato A, Fazi S, Laganà A, Paolini V, Petracchini F, Piovesana S, Capriotti AL. Untargeted analysis of contaminants in river water samples: Comparison between two different sorbents for solid-phase extraction followed by liquid chromatography-high-resolution mass spectrometry determination. Microchem J. 2022;172. 10.1016/j.microc.2021.106979
- 35. Selwe KP, Head CR, Phokedi GN, Andersen JET, Sallach JB, Dessent CEH. Suspect and non-targeted screening of chemical pollutants in Botswana’s aquatic environments. Emerg Contam. 2024;10. 10.1016/j.emcon.2024.100377
- N Martin, G Duporté, E Lemaire, A Sauvêtre, M Bertrand, D Rosain, E Gomez, E Farcy. Pollution by polar pesticides and pharmaceuticals and risk assessment in surface water bodies along the French Mediterranean coast: Complementarity of target and non-target screenings. Environmental Chemistry and Ecotoxicology, 2025. [DOI]
- MI Cadena-Aizaga, E García-Gómez, P Gago-Ferrero, S Sabater, M Petrovic. Comprehensive characterization of microcontaminants in urban runoff: Unveiling chemical signatures using wide-scope target screening by LC-HRMS. Environmental Chemistry and Ecotoxicology, 2025. [DOI]
- 38. da Silva AC, Alves de Oliveira LV, Amaral Alexandre L, Rocha Ribas M, Lemos Dal Pizzol J, Rocha G, Kasuko Palmeiro J, Perin M, Hoff R, Verruck S. Suspect screening and quantitative analysis of 165 contaminants of emerging concern in water, sediments, and biota using LC-MS/MS: Ecotoxicological and human health risk assessment. Scie Total Environ. 2025;963. 10.1016/j.scitotenv.2025.178434
- 39. Becker RW, Cardoso RM, Dallegrave A, Ruiz-Padillo A, Sirtori C. Quantification of pharmaceuticals in hospital effluent: Weighted ranking of environmental risk using a fuzzy hybrid multicriteria method. Chemosphere. 2023;338. 10.1016/j.chemosphere.2023.139368
- G Gao, S Li, S Li, Y Wang, P Zhao, X Zhang, X Hou. A combination of computational−experimental study on metal-organic frameworks MIL-53(Al) as sorbent for simultaneous determination of estrogens and glucocorticoids in water and urine samples by dispersive micro-solid-phase extraction coupled to UPLC-MS/MS. Talanta, 2018. [DOI | PubMed]
- 41. Sodré FF, Feitosa RS, Jardim WF, Maldaner AO. Wastewater-based epidemiology of cocaine in the brazilian federal district: Spatial distribution, weekly variation and sample preservation strategies. J Braz Chem Soc. 2018;29:2287–2298. 10.21577/0103-5053.20180105
- KJ Bisceglia, KA Lippa. Stability of cocaine and its metabolites in municipal wastewater – the case for using metabolite consolidation to monitor cocaine utilization. Environ Sci Pollut Res, 2014. [DOI]
- 43. Leal R, Lima S, Lima A, Oliveira D, Ot A, Afonso P, Pereira P. Fast determination of amphetamine-type stimulants and synthetic cathinones in whole blood samples using protein precipitation and LC-MS/MS. Microchem J. 2021;163. 10.1016/j.microc.2020.105895
- S Ferreira. Doehlert matrix: a chemometric tool for analytical chemistry -review. Talanta, 2004. [DOI | PubMed]
- MC Da Silva, MLG Oliveira, R Augusti, AF Faria. Simultaneous Extraction of Pesticides and Polycyclic Aromatic Hydrocarbons in Brazilian Cachaça Using a Modified QuEChERS Method Followed by Gas Chromatography Coupled to Tandem Mass Spectrometry Quantification. J Agric Food Chem, 2019. [DOI | PubMed]
- M Ribani, CH Collins, CBG Bottoli. Validation of chromatographic methods: Evaluation of detection and quantification limits in the determination of impurities in omeprazole. J Chromatogr A, 2007. [DOI | PubMed]
- M Thompson, SLR Ellison, R Wood. Harmonized guidelines for single-laboratory validation of methods of analysis (IUPAC Technical Report). Pure Appl Chem, 2002. [DOI]
- EL Schymanski, J Jeon, R Gulde, K Fenner, M Ruff, HP Singer, J Hollender. Identifying small molecules via high resolution mass spectrometry: Communicating confidence. Environ Sci Technol, 2014. [DOI | PubMed]
- CRT Tarley, G Silveira, WNL dos Santos, GD Matos, EGP da Silva, MA Bezerra, M Miró, SLC Ferreira. Chemometric tools in electroanalytical chemistry: Methods for optimization based on factorial design and response surface methodology. Microchem J, 2009. [DOI]
- S Endo, A Pfennigsdorff, KU Goss. Salting-Out Effect in Aqueous NaCl Solutions Increases with Size and Decreases with Polarities of Solute Molecule. Environ Sci Technol, 2012. [DOI | PubMed]
- 51.Williams ML, Olomukoro AA, Emmons RV, Godage NH, Gionfriddo E. Matrix effects demystified: strategies for resolving challenges in analytical separations of complex samples. J Sep Sci. 2023;46:e2300571. 10.1002/jssc.202300571.
- BK Matuszewski, ML Constanzer, CM Chavez-Eng. Strategies for the assessment of matrix effect in quantitative bioanalytical methods based on HPLC-MS/MS. Anal Chem, 2003. [DOI | PubMed]
- 53.Miller JN, Miller J. Statistics and chemometrics for analytical chemistry, 6th Edn. Prentice Hall, Harlow, pp. 278.
- 54. Psichoudaki M, Mina T, Savvidou M, Mina C, Michael C, Fatta-Kassinos D. Wastewater-based monitoring of illicit drugs in Cyprus by UPLC-MS/MS: The impact of the COVID-19 pandemic. Sci Total Environ. 2023;854. 10.1016/j.scitotenv.2022.158747
- M Yuwono, G Indrayanto. Validation of Chromatographic Methods of Analysis. Profiles Drug Subst Excip Relat Methodol, 2005. [DOI]
- 56. de Oliveira GMM, Brant LCC, Polanczyk CA, Malta DC, Biolo A, Nascimento BR, de Fatima Marinho de Souza M, De Lorenzo AR, de Paiva Fagundes Júnior AA, Schaan BD, de Castilho FM, Cesena FHY, Soares GP, Junior GFX, Barreto-Filho JAS, Passaglia LG, Pinto-Filho MM, Machline-Carrion MJ, Bittencourt MS, Pontes-Neto OM, Villela PB, Teixeira RA, Sampaio RO, Gaziano TA, Perel P, Roth GA, Ribeiro ALP. Cardiovascular Statistics – Brazil 2021. Arq Bras Cardiol. 2022;118:115. 10.36660/ABC.20211012
- 57. Zhao BH, Sun Q, Chen J, Zhang J, Zhang XY, Liu BJ, Li J. 17 beta-estradiol biodegradation by anaerobic granular sludge: Effect of iron sources. Sci Rep. 2020;10. 10.1038/s41598-020-64557-5
- 58. Campos-Mañas MC, Van Wichelen N, Covaci A, van Nuijs ALN, Ort C, Béen F, Castiglioni S, Hernández F, Bijlsma L. Analytical investigation of cannabis biomarkers in raw urban wastewater to refine consumption estimates. Water Res. 2022;223. 10.1016/j.watres.2022.119020
- ALS da Silva Junior, GM Santana, MM Nascimento, RL Cunha, PRR Mesquita, RM de Jesus. Illicit drugs in Brazil: environmental consequences and consumption patterns. Environ Sci Pollut Res, 2024. [DOI]
- MJ Landry. An overview of cocaethylene, an alcohol-derived, psychoactive, cocaine metabolite. J Psychoactive Drugs, 1992. [DOI | PubMed]
- AW Jones. Forensic Drug Profile: Cocaethylene. J Anal Toxicol, 2019. [DOI | PubMed]
- 62. Vaiano F, Scuffi L, Lachi A, Trignano C, Argo A, Mari F, Bertol E. THC and THC-COOH hair concentrations: Influence of age, gender, consumption habits, cosmetics treatment, and hair features. J Pharm Biomed Anal. 2023;225. 10.1016/j.jpba.2023.115237
- 63. National Institute on Drug Abuse. What is fentanyl? In: NIH. 2021. https://nida.nih.gov/publications/drugfacts/fentanyl. Accessed 8 Mar 2024
- N Salgueiro-Gonzalez, F Béen, L Bijlsma, T Boogaerts, A Covaci, JA Baz-Lomba, B Kasprzyk-Hordern, J Matias, C Ort, I Bodík, E Heath, K Styszko, E Emke, F Hernández, ALN van Nuijs, S Castiglioni. Influent wastewater analysis to investigate emerging trends of new psychoactive substances use in Europe. Water Res, 2024. [DOI | PubMed]
- 65. Lee HJ, Oh JE. Target and suspect screening of (new) psychoactive substances in South Korean wastewater by LC-HRMS. Sci Total Environ. 2023;875. 10.1016/j.scitotenv.2023.162613
- ÁI López-Lorente, F Pena-Pereira, S Pedersen-Bjergaard, VG Zuin, SA Ozkan, E Psillakis. The ten principles of green sample preparation. TrAC – Trends in Analytical Chemistry, 2022. [DOI]
- 67. Hu K, Zhou W, Yang C, Wang Y, Jiang RW, Zhang Z, Pawliszyn J. Rapid screening of drugs in environmental water using metal organic framework/Ti3C2Tx composite coated blade spray-mass spectrometry. J Hazard Mater. 2024;472. 10.1016/j.jhazmat.2024.134609
- DR Baker, B Kasprzyk-Hordern. Multi-residue analysis of drugs of abuse in wastewater and surface water by solid-phase extraction and liquid chromatography-positive electrospray ionisation tandem mass spectrometry. J Chromatogr A, 2011. [DOI | PubMed]
- 69. Wang H, Xu B, Yang L, Huo T, Bai D, An Q, Li X. Consumption of common illicit drugs in twenty-one cities in southwest China through wastewater analysis. Sci Total Environ. 2022;851. 10.1016/j.scitotenv.2022.158105