GLIS1, Correlated with Immune Infiltrates, Is a Potential Prognostic Biomarker in Prostate Cancer
Abstract
Prostate cancer (PCa) is a prevalent malignant disease and the primary reason for cancer-related mortality among men globally. GLIS1 (GLIS family zinc finger 1) is a key regulator in various pathologies. However, the expression pattern, clinical relevance, and immunomodulatory function of GLIS1 in PCa remain unclear. In this study, GLIS1 was discovered to serve as a key gene in PCa by integrating mRNA and miRNA expression profiles from GEO database. We systematically explored the expression and prognostic values of GLIS1 in cancers using multiple databases. Additionally, we examined the functions of GLIS1 and the relationship between GLIS1 expression levels and immune infiltration in PCa. Results showed that GLIS1 was differentially expressed between normal and tumor tissues in various cancer types and was significantly low-expressed in PCa. Low GLIS1 expression was associated with poor PCa prognosis. GLIS1 was also involved in the activation, proliferation, differentiation, and migration of immune cells, and its expression showed a positive correlation with the infiltration of various immune cells. Moreover, GLIS1 expression was positively associated with various chemokines/chemokine receptors, indicating the involvement in regulating immune cell migration. In summary, GLIS1 is a potential prognostic biomarker and a therapeutic target to modulate anti-tumor immune response in PCa.
Article type: Research Article
Keywords: GLIS1, prostate cancer, prostate adenocarcinoma, infiltrating immune cell, prognosis, lymphocytes, biomarker
License: © 2023 by the authors. CC BY 4.0 Licensee MDPI, Basel, Switzerland. This article is an open access article distributed under the terms and conditions of the Creative Commons Attribution (CC BY) license (https://creativecommons.org/licenses/by/4.0/).
Article links: DOI: 10.3390/ijms25010489 | PubMed: 38203661 | PMC: PMC10779070
Relevance: Moderate: mentioned 3+ times in text
Full text: PDF (3.3 MB)
1. Introduction
Prostate cancer (PCa) is the second most common cancer in men and ranks fifth among cancer-related mortality in men worldwide [ref. 1,ref. 2]. The incidence of PCa varies geographically and is more prevalent in developed countries, especially in North America, Europe, and Oceania. In China and other Asian countries, the incidence of this disease is rising, and cancers are first diagnosed in the middle/late stages [ref. 1,ref. 3]. Because the clinical manifestations of early-stage PCa are difficult to identify, an approximate majority of patients are diagnosed belatedly, leading to increased patient mortality [ref. 4]. PCa is highly heterogeneous, complex in composition and pathogenesis, so it is difficult to find suitable and effective therapeutic targets. Current clinical treatment options for PCa include prostatectomy surgery, radiation therapy, and androgen deprivation therapy. These therapies can only temporarily limit the progression of PCa. Cancer can advance to the metastatic stage within 18–24 months, and these patients often have poor prognosis with an average survival of 12 months [ref. 5,ref. 6]. Immunotherapy is a hopeful approach that has demonstrated anti-tumor benefits in PCa [ref. 7]. Tumor cells escape the immune system by binding to CTLA-4 or PD-1, promoting the differentiation and activity of Treg cells and suppressing the growth and activity of effector T cells [ref. 8,ref. 9]. But in PCa, many patients do not respond to monoclonal antibody therapy targeting PD1 or CTLA-4, possibly because tumor cells achieve immune escape through other pathways [ref. 10,ref. 11,ref. 12]. Therefore, exploring new molecules with immunomodulatory functions to treat PCa is urgent and crucial. Recent studies have shown that tumor-infiltrating immune cells can affect the prognosis of PCa patients and the efficacy of anti-tumor immunotherapy [ref. 13,ref. 14,ref. 15]. However, the molecular immune-related mechanisms of PCa remain ambiguous. Therefore, new molecular biomarkers and therapeutic approaches related to the immune infiltration in PCa are urgently needed to meet the challenging clinical needs.
GLIS1 is a GLI-related Krüppel-like zinc finger protein that acts as a transcription activator and repressor. GLIS1 is known to play a key role in regulating many physiological processes and has also been widely reported to be linked to various pathologies, including oncogenesis [ref. 16]. GLIS1, in conjunction with several other reprogramming factors, markedly increased the efficiency of generating induced pluripotent stem cells (iPSC) from somatic cells, suggesting their roles in cellular differentiation, proliferation, and stem cell renewal [ref. 17,ref. 18,ref. 19]. Regarding tumors, GLIS1 in cancer cells is involved in cell migration, invasion, and tumorigenesis [ref. 20,ref. 21]. A study by Charles et al. demonstrated that GLIS1 is associated with the WNT gene expression and epithelial-to-mesenchymal transition (EMT) features in breast cancer cells. Their study showed that co-transfection of GLIS1 and CUX1 synergistically stimulated TCF/β-catenin transcriptional activity, thereby increasing cell migration and invasion [ref. 22]. A work conducted by Rong et al. demonstrated that GLIS1 accelerates the process of CD8+ T cell exhaustion in hepatocellular carcinoma by modulating the SGK1–STAT3–PD1 pathway, and exerts a synergistic effect with anti-PD1, providing a prospective method for cancer immunotherapy [ref. 23].
Many studies in recent years have revealed the presence of differentially expressed genes (DEGs) and differentially expressed microRNA (DEMs) in PCa [ref. 24,ref. 25,ref. 26]. However, the analysis results obtained by different researchers vary. There are still unsolved concerns about the interaction of DEGs and DEMs during Pca development, and further analysis combining different studies is urgently needed to reveal the real targets.
In this work, we obtained DEGs and DEMs between normal and PCa tissue samples by applying four mRNA profiling datasets (GSE183019, GSE134073 [ref. 27], GSE69223 [ref. 28], and GSE88808 [ref. 29]) and two miRNA profiling datasets (GSE89193 [ref. 29] and GSE60117 [ref. 30]) from the Gene Expression Omnibus (GEO) database. Subsequently, target genes of total DEMs (tDEM–TGs) were predicted, followed by overlapping analysis between tDEM–TGs and total DEGs (tDEGs) to filter potential key genes and miRNAs. We then comprehensively evaluated the differential expression of key gene GLIS1 and its prognostic value in PCa through The Cancer Genome Atlas (TCGA) database. Additionally, we performed Gene Ontology (GO) analysis, Gene Set Enrichment Analysis (GSEA), and other methods to investigate the potential roles of GLIS1 in tumor development and tumor immune microenvironment. This study is the first to comprehensively explore the relationship between GLIS1 expression and its clinical, molecular, and immunotherapeutic aspects in PCa, shedding us new insights into the crucial role of GLIS1 in PCa.
2. Results
2.1. Identification of tDEGs, tDEMs and tDEM-TGs in Prostate Cancer
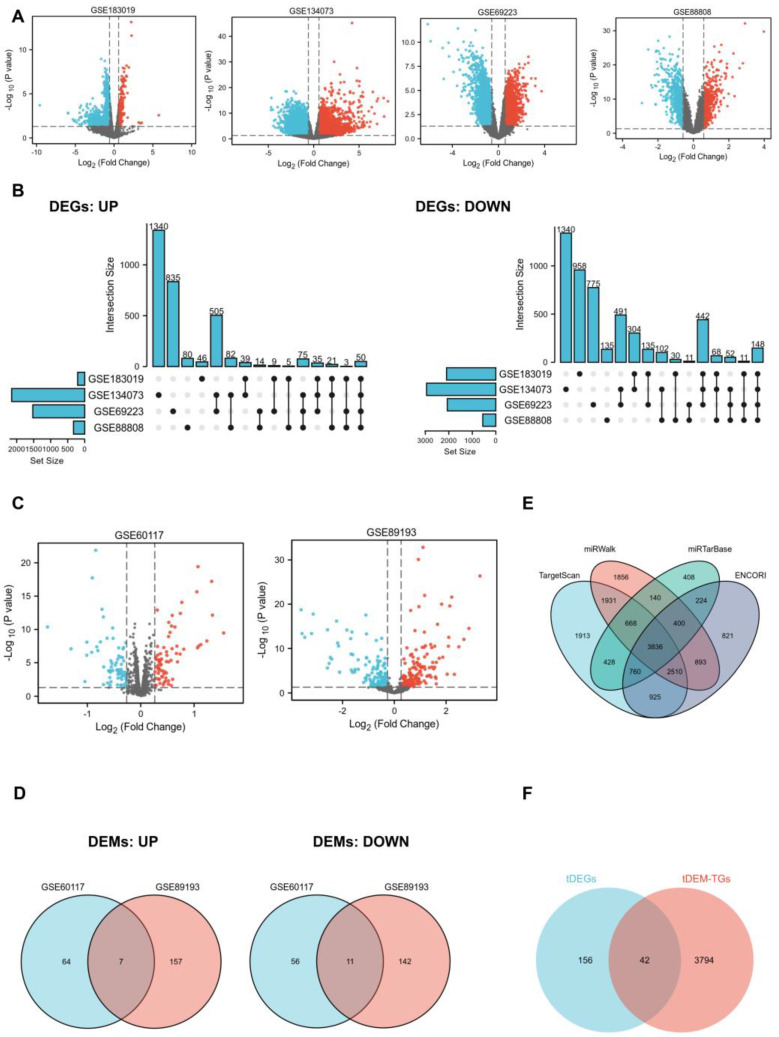
In order to identify key genes that exhibit differential expression between PCa patients and normal controls, we employed mRNA and miRNA-targeted strategy to help filter them. We selected four mRNA expression profiling datasets (GSE183019, GSE134073, GSE69223, and GSE88808) and two non-coding RNA expression profiling datasets (GSE60117 and GSE89193) from the GEO database. Regarding mRNA, 2304, 5094, 3591, and 887 DEGs were obtained from GSE183019, GSE134073, GSE69223, and GSE88808. UpSet plot provided an efficient way to visualize intersections of those up or down-regulated DEGs in the four datasets, and a total of 198 DEGs (tDEGs) were obtained. Of these, 50 genes were up-regulated and 148 genes were down-regulated (Figure 1A,B). The same operations were carried out on miRNA. The two miRNA datasets shared a total of 18 DEMs (tDEMs), including seven upregulated and 11 downregulated miRNAs (Figure 1C,D). Next, target genes for tDEMs were predicted using TargetScan, miRWalk, miRTarBase, and ENCORI databases. Then, 3836 consistent target genes, termed tDEM–TGs, were found by their intersection using Venn’s analysis (Figure 1E).
2.2. GO and Pathway Enrichment Analysis
To obtain further insight into the function of the tDEGs and tDEM–TGs in PRAD, we performed GO and Kyoto Encyclopedia of Genes and Genomes (KEGG) pathway enrichment analysis for the identified tDEGs and tDEM–TGs by using the R package “cluster Profiler”. The top 10 most significantly enriched GO terms are depicted in Figure S1. Results showed that the GO enrichment analysis varied between tDEGs and tDEM–TGs (Figure S1A,B). Biological process (BP) in GO analysis revealed that tDEGs were significantly enriched in muscle tissue-associated part. As for tDEM–TGs, they are mainly responsible for regulating the catabolic and autophagy-related processes. The cell component (CC) analysis of tDEGs revealed a significant enrichment in muscle tissue-related components, and the results of tDEM–TGs focused on focal adhesion, cell-substrate adherens junction, and endocytic membrane transport. Similar disparities were also evident in the molecular function (MF) analysis; tDEGs were mainly enriched in transmembrane transporters and channel activity, but tDEM–TGs were enriched in ubiquitin associated function, such as ubiquitin protein ligase binding and transferase activity. Additionally, the KEGG pathway analysis further uncovered the differences between tDEGs and tDEM–TGs (Figure S1C,D).
2.3. Identification of Key Genes and miRNAs
To identify potential key genes, we aligned tDEM–TGs with tDEGs to form an intersection, which were referred to as key genes for further exploration (Figure 1F). Moreover, survival analysis based on the TCGA database was used to confirm the initial identified key genes, and only one of these 42 shared key genes, GLIS1, was discovered to be associated with overall survival (OS) of PCa patients. The differential expression of GLIS1 in different GEO datasets were listed in Table 1. Next, we examined candidate miRNAs implicated in the regulation of GLIS1 from 18 tDEMs and identified two up-regulated key miRNAs and one down-regulated key miRNA (Table 2).
Table 1: The differential expression of GLIS1 in different GEO datasets.
| Gene | Datasets | LogFC | p Value | adj. p Value | Expression |
|---|---|---|---|---|---|
| GLIS1 | GSE183019 | −0.63 | 0.000 | 0.012 | DOWN |
| GSE134073 | −2.09 | 0.000 | 0.000 | DOWN | |
| GSE69223 | −0.94 | 0.002 | 0.017 | DOWN | |
| GSE88808 | −0.77 | 0.000 | 0.000 | DOWN |
Table 2: The differential expression of candidate miRNAs in different GEO datasets.
| Target Gene | miRNA | Datasets | LogFC | p Value | adj. p Value | Expression |
|---|---|---|---|---|---|---|
| GLIS1 | hsa-miR-663b | GSE60117 | 0.28 | 0.000 | 0.000 | UP |
| GSE89193 | 1.36 | 0.000 | 0.000 | UP | ||
| GLIS1 | hsa-miR-153 | GSE60117 | 0.35 | 0.003 | 0.015 | UP |
| GSE89193 | 2.22 | 0.000 | 0.000 | UP | ||
| GLIS1 | hsa-miR-483-5p | GSE60117 | −0.62 | -0.010 | 0.039 | DOWN |
| GSE89193 | −1.10 | 0.001 | 0.006 | DOWN |
To test the clinical applicability of key miRNAs, we examined their diagnostic significance through receiver operating characteristic (ROC) curve analysis (Figure S2). The AUC values of hsa-miR-663b in GSE60117 and hsa-miR-153 in GSE89193 were 0.943 and 0.875, respectively, which demonstrate a good diagnostic value for discrimination between normal controls and PCa patients.
2.4. Diagnostic and Prognostic Values of GLIS1 in Pan-Cancer
To further compare the transcriptional levels of GLIS1 in different human cancers with those of normal samples, we analyzed the expression levels of GLIS1 mRNA in various cancer types using the RNA-seq data from TCGA and presented the results in Figure 2A. This analysis revealed that GLIS1 expression level was significantly downregulated in nearly all tumor types compared to the normal, including prostate adenocarcinoma (PRAD), bladder urothelial carcinoma (BLCA), breast invasive carcinoma (BRCA), cervical squamous cell carcinoma and endocervical adenocarcinoma (CESC), colon adenocarcinoma (COAD), glioblastoma multiforme (GBM), kidney chromophobe (KICH), brain lower grade glioma (LGG), liver hepatocellular carcinoma (LIHC), lung adenocarcinoma (LUAD), ovarian serous cystadenocarcinoma (OV), rectum adenocarcinoma (READ), skin cutaneous melanoma (SKCM), stomach adenocarcinoma (STAD), testicular germ cell tumors (TGCT), thyroid carcinoma (THCA), and uterine corpus endometrial carcinoma (UCEC). In addition, GLIS1 also showed good discriminating ability in our four datasets, among which the AUC values of GLIS1 were all greater than 0.80 except for GSE183019, indicating it might be a promising biomarker for PCa diagnosis (Figure 2B).
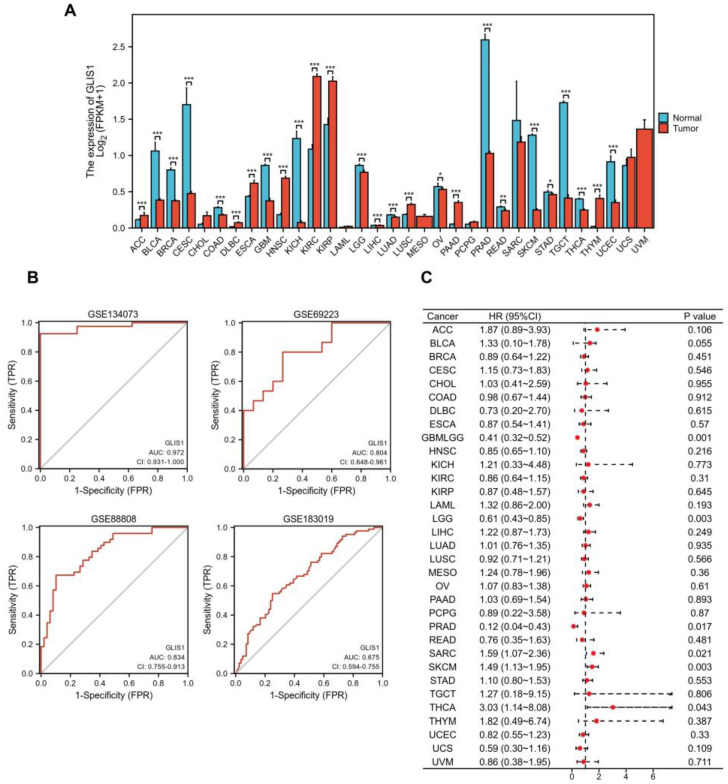
Survival analysis was then performed to ensure the application prospect of GLIS1. The association between GLIS1 expression and OS was first calculated for 33 tumors in the TCGA database using log-rank tests. As depicted in Figure 1C, the forest plot displayed that GLIS1 could significantly affect the OS of GBMLGG (lower grade glioma and glioblastoma, p = 0.001), LGG (p = 0.003), SKCM (p = 0.003), SARC (sarcoma, p = 0.021), THCA (p = 0.043), and PRAD (p = 0.017) patients (Figure 2C). These tumors all showed that GLIS1 was associated with patient outcome, suggesting that GLIS1 has great potential to serve as a prognostic indicator molecule in pan-cancer.
2.5. GLIS1 Was Associated with the Prognosis of Prostate Cancer Patients
The mRNA expression levels of GLIS1 in PRAD were divided as either low or high expression based on the median value (0.94 for FPKM). Clinicopathological features were detailed in Table 3. The downregulation of GLIS1 in PCa tissues was validated using the TCGA-PRAD dataset (Figure 3A). The expression of GLIS1 mRNA in the PCa group was markedly lower than that detected in the adjacent normal group, as evidenced by paired specimens (Figure 3B, p < 0.001). ROC and survival analysis were conducted to evaluate the application prospect of GLIS1 (Figure 3C–E). The ROC curve analysis showed that the expression levels of GLIS1 mRNA could distinguish PCa tissues from normal tissues, with an AUC value of 0.839 (Figure 3C). The Kaplan–Meier survival curve and log-rank tests for OS were conducted on a cohort of 499 patients who had complete follow-up data. Figure 3D demonstrated that the OS is shorter in PCa patients with low GLIS1 expression compared to those with high GLIS1 levels (p = 0.016). Furthermore, we conducted a univariate Cox proportional hazards regression analysis and found a significant correlation between low GLIS1 expression and poorer OS (HR = 0.122, p = 0.046) in PCa, indicating that GLIS1 expression can affect the prognosis of PCa patients. Multivariate analysis showed a trend for GLIS1 expression as an independent indicator for OS (HR = 0.157, p = 0.092) (Table 4). The progression-free survival (PFS) analysis revealed that patients with low GLIS1 expression (bottom 25%) have significantly shorter PFS than patients with elevated GLIS1 levels (top 25%) (p = 0.012) (Figure 3E). To further explore the contribution of GLIS1 to the clinical characteristics of PCa, we investigated the association between GLIS1 expression and clinicopathological characteristics using the Wilcoxon rank sum test and logistic regression analysis. As shown in Figure 3F–J and Table 5, with the increase in tumor T stage, N stage, Gleason score, PSA value, and positive residual tumor, the expression levels of GLIS1 in PCa were significantly reduced.
Table 3: Demographic and clinical characteristics of PRAD patients with low and high GLIS1 expression in TCGA (n = 499).
| Clinicopathologic Variables | No. of Cases | GLIS1 Expression Level | χ | p | |
|---|---|---|---|---|---|
| Low | High | ||||
| All cases | 499 | 249(44.3%) | 250(55.7%) | ||
| Age | 0.019 | 0.889 | |||
| ≤60 | 224 (44.9%) | 111 (22.2%) | 113 (22.6%) | ||
| >60 | 275 (55.1%) | 138 (27.7%) | 137 (27.5%) | ||
| Clinical T stage | 0.623 | 0.430 | |||
| T1 + T2 | 351 (86.5%) | 165 (40.6%) | 186 (45.8%) | ||
| T3 + T4 | 55 (13.5%) | 29 (7.1%) | 26 (6.4%) | ||
| Pathologic T stage | 8.256 | 0.004 | |||
| T2 | 189 (38.4%) | 79 (16.1%) | 110 (22.4%) | ||
| T3 + T4 | 303 (61.6%) | 167 (33.9%) | 136 (27.6%) | ||
| Lymph nodes status | 6.477 | 0.011 | |||
| Negative | 347 (81.5%) | 169 (39.7%) | 178 (41.8%) | ||
| Positive | 79 (18.5%) | 51 (12.0%) | 28 (6.6%) | ||
| PSA (ng/mL) | 7.179 | 0.007 | |||
| <4 | 415 (93.9%) | 197 (44.6%) | 218 (49.3%) | ||
| ≥4 | 27 (6.1%) | 20 (4.5%) | 7 (1.6%) | ||
| Gleason score | 6.674 | 0.010 | |||
| 6–7 | 293 (58.7%) | 132 (26.5%) | 161 (32.3%) | ||
| 8–10 | 206 (41.3%) | 117 (23.4%) | 89 (17.8%) | ||
| Survival Status | 6.564 | 0.010 | |||
| Live | 489 (98.0%) | 240 (48.1%) | 249 (49.9%) | ||
| Dead | 10 (2.0%) | 9 (1.8%) | 1 (0.2%) | ||
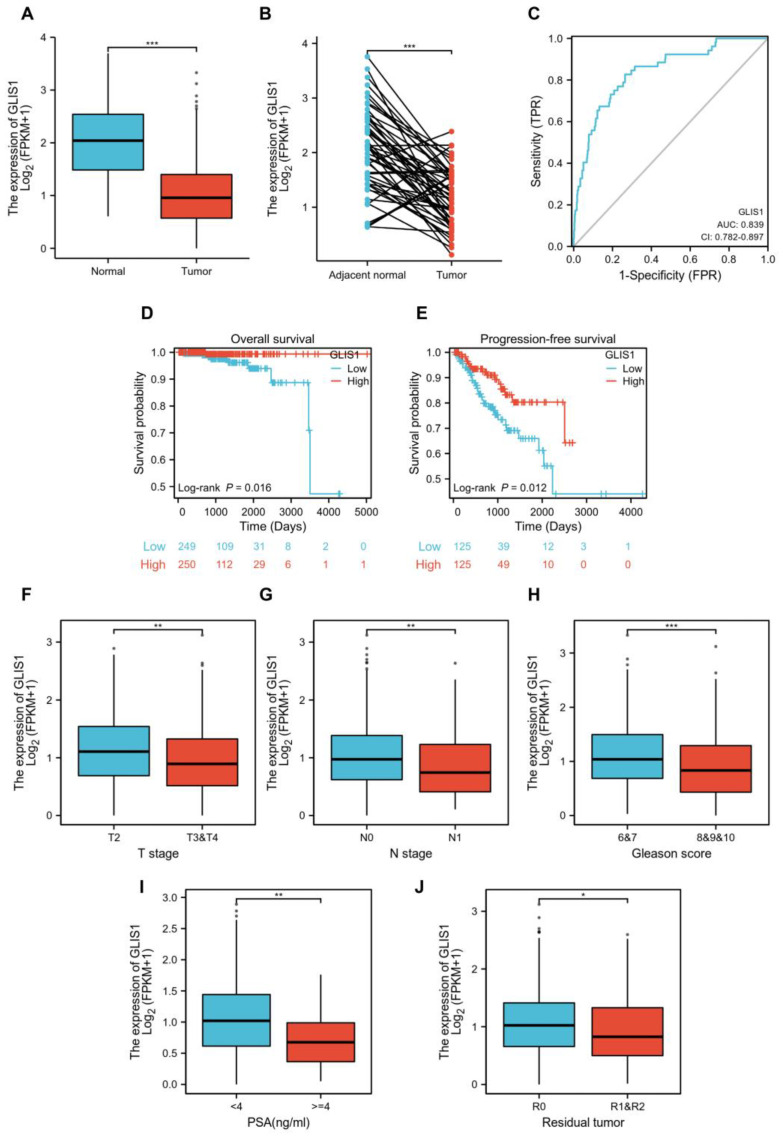
Table 4: Univariate and multivariate analysis of the correlation of GLIS1 expression with OS among prostate cancer patients.
| Characteristics | Total (N) | Univariate Analysis | Multivariate Analysis | ||
|---|---|---|---|---|---|
| Hazard Ratio (95% CI) | p Value | Hazard Ratio (95% CI) | p Value | ||
| Age | 499 | ||||
| ≤60 | 224 | Reference | |||
| >60 | 275 | 1.577 (0.440–5.648) | 0.484 | ||
| T stage | 492 | ||||
| T2 | 189 | Reference | |||
| T3 & T4 | 303 | 3.294 (0.612–17.727) | 0.165 | ||
| N stage | 426 | ||||
| N0 | 347 | Reference | |||
| N1 | 79 | 3.516 (0.778–15.896) | 0.102 | ||
| PSA (ng/mL) | 442 | ||||
| <4 | 415 | Reference | |||
| ≥4 | 27 | 10.479 (2.471–44.437) | 0.001 | 3.411 (0.735–15.826) | 0.117 |
| Gleason score | 499 | ||||
| 6 & 7 | 293 | Reference | |||
| 8 & 9 & 10 | 206 | 6.664 (1.373–32.340) | 0.019 | 5.372 (0.843–34.209) | 0.075 |
| Residual tumor | 468 | ||||
| R0 | 315 | Reference | |||
| R1 & R2 | 153 | 2.598 (0.696–9.694) | 0.155 | ||
| GLIS1 | 499 | ||||
| Low | 249 | Reference | |||
| High | 250 | 0.122 (0.015–0.965) | 0.046 | 0.157 (0.018–1.355) | 0.092 |
Table 5: Association between GLIS1 and prostate cancer clinicopathological features.
| Characteristics | Total (N) | Odds Ratio (OR) | p Value |
|---|---|---|---|
| Age (>60 vs. ≤60) | 499 | 1.007 (0.708–1.434) | 0.968 |
| T stage (T3 & T4 vs. T2) | 492 | 0.585 (0.404–0.843) | 0.004 |
| N stage (N1 vs. N0) | 426 | 0.521 (0.311–0.859) | 0.012 |
| PSA (ng/mL) (≥4 vs. <4) | 442 | 0.316 (0.122–0.731) | 0.011 |
| Gleason score (8 & 9 & 10 vs. 6 & 7) | 499 | 0.645 (0.450–0.922) | 0.017 |
| Race (Black or African American & White vs. Asian) | 484 | 3.130 (0.921–14.237) | 0.090 |
| Residual tumor (R1 & R2 vs. R0) | 468 | 0.671 (0.454–0.990) | 0.045 |
2.6. Functional Enrichment and Pathway Analysis of High and Low-GLIS1 Expression Samples
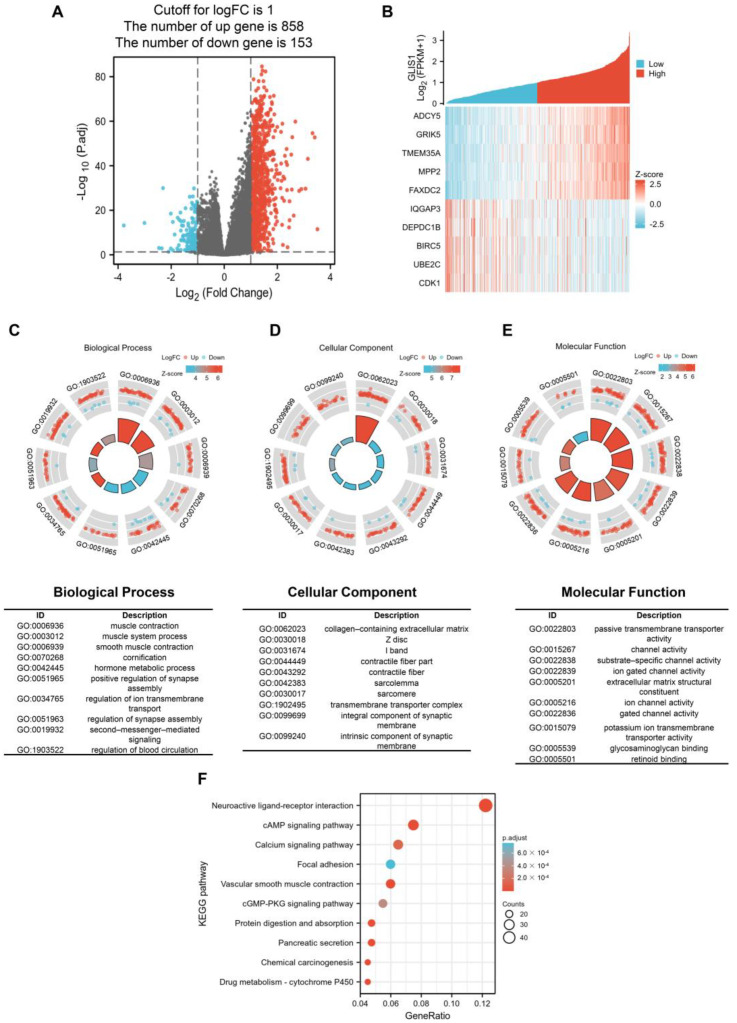
The survival impact of GLIS1 on PCa patients suggests its potential clinical application value. Subsequently, we examined the RNA sequencing data obtained from the TCGA database and divided PCa samples into a high GLIS1 expression group or low GLIS1 expression group. Between the samples with high and low GLIS1 expression, 1011 DEGs were discovered, of which 858 genes were upregulated and 153 were downregulated. The DEGs’s expression is shown in a volcano plot and heatmap (Figure 4A,B). Following this, co-expression functions in PCa patients were predicted using GO enrichment and KEGG pathway analysis. In the BP, the DEGs were significantly clustered into items that associated with muscle tissue system, including “muscle contraction”, “muscle system process”, and “smooth muscle contraction”. The remaining BP terms, including “hormone metabolic process”, “regulation of synapse assembly”, and “second-messenger-mediated signaling”, etc. (Figure 4C). Meanwhile, the DEGs–associated CC were “collagen-containing extracellular matrix” and other muscle tissue related terms, including Z disc, I band, contractile fiber, sarcolemma and sarcomere. “Transmembrane transporter complex” and “intrinsic component of synaptic membrane” are also significant CC terms (Figure 4D). The top 10 significant MF terms were mainly associated with channel activity, including “passive transmembrane transporter activity”, “substrate-specific channel activity”, “ion gated channel activity”, and so on (Figure 4E). For the KEGG analysis, these GLIS1–assocaited DEGs were mainly enriched in neuroactive ligand-receptor interaction, cAMP signaling pathway, calcium signaling pathway, focal adhesion, vascular smooth muscle contraction, cGMP-PKG signaling pathway, protein digestion and absorption, pancreatic secretion, chemical carcinogenesis, and drug metabolism. The 10 most significant KEGG pathways were shown in Figure 4F.
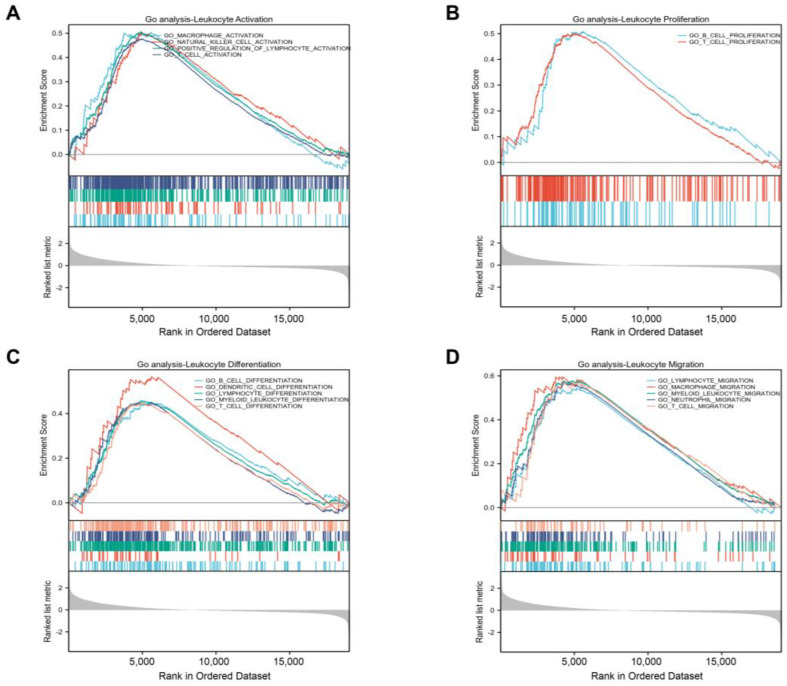
Additional investigation using a GSEA function analysis showed that GLIS1 also took part in several immune-related pathways and influenced many processes of immune cells. These findings showed that GLIS1 was linked to the following processes: activation of natural killer (NK) cell, T cell, and macrophage (Figure 5A); proliferation of B cell and T cell (Figure 5B); differentiation of T cell, B cell, dendritic cells (DC), and myeloid leukocyte (Figure 5C); and migration of T cell, neutrophil, myeloid leukocyte, and macrophage (Figure 5D).
2.7. The Correlation between GLIS1 Expression and Immune Infiltration Levels
Considering the GSEA results found that GLIS1 was involved in tumor immune regulation, we next performed single-sample Gene Set Enrichment Analysis (ssGSEA) to detect the correlation between GLIS1 mRNA expression and immune cell infiltration levels in PCa. The association between GLIS1 mRNA expression and the infiltration of immune cells was shown in Figure 6A. The results indicated that GLIS1 expression was positively correlated with the infiltration of NK cells, and the Spearman correlation was as high as 0.712 (p < 0.01). GLIS1 expression was also positively associated with the infiltration of mast cells, neutrophils, effector memory T cells (Tem), gamma delta T cells (Tgd), immature dendritic cells (iDC), Th1 cells, DC, B cells, cytotoxic T cells, plasmacytoid dendritic cells (pDC), T cells, macrophages, eosinophils, CD8+ T cells, NK CD56dim cells, T follicular helper cells (TFH), NK CD56bright cells, Th17 cells (all p < 0.01), but was negatively correlated with the infiltration of Th2 cells (p < 0.05, Figure 6A). Additionally, we assessed the abundance of key immune cells in the groups with low and high GLIS1 expression. The results showed that in PCa, 18 major types of immune cells (including NK cells, macrophages, DC, T cells, CD8+ T cells, neutrophils, and B cells, etc.) showed more abundant infiltration in the high GLIS1 group compared to the low GLIS1 group (p < 0.001). In contrast, the abundance of Th2 cells was lower in the high GLIS1 group (Figure 6B).
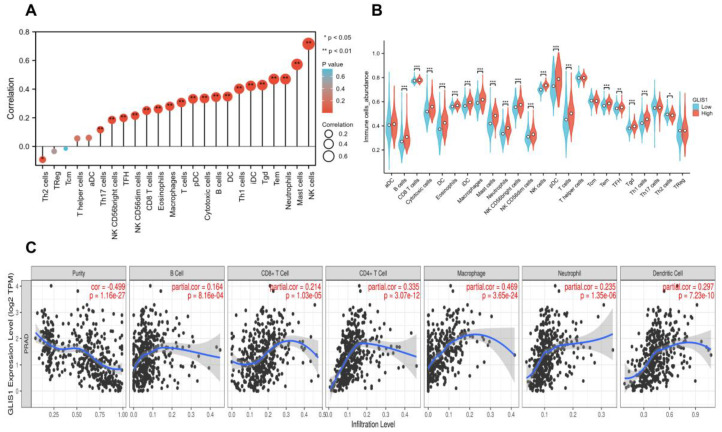
In addition, the analyses by Tumor Immune Estimation Resource (TIMER) software showed that the GLIS1 mRNA expression exhibited positive correlations with the infiltration of B cells (R = 0.164, p < 0.001), CD8+ T cells (R = 0.214, p < 0.001), CD4+ T cells (R = 0.335, p < 0.001), macrophages (R = 0.469, p < 0.001), neutrophils (R = 0.235, p < 0.01), and DC (R = 0.297, p < 0.001), but had a negative correlation with the purity of tumor (R = −0.499, p < 0.001) (Figure 6C). Hence, GLIS1 may play a critical role in regulating antitumor immunity. Furthermore, we utilized TIMER to investigate the relationship between GLIS1 expression and various markers associated with immune infiltration in PCa. After the correlation adjustment by purity, the results revealed a significant correlation between GLIS1 expression levels and most of the marker sets of CD8+ T cell, T cell (general), B cell, monocyte, TAM (tumor-associated macrophage), M1 macrophage, NK cell, DC, Th1 cell, Th2 cell, Treg cell, and T cell exhaustion (Table 6). A somatic copy number alterations (SCNAs) module showed that the deep depletion and arm-level deletion of GLIS1 were mainly significantly associated with immune cell infiltration levels in PRAD (Figure S3). Collectively, our findings indicate that GLIS1 may have a significant impact on the infiltration of immune cells in PCa.
Table 6: Correlation analysis between GLIS1 and markers of immune cells in PRAD by TIMER.
| Gene Markers | PRAD | ||||
|---|---|---|---|---|---|
| None | Purity | ||||
| Correlation | p | Correlation | p | ||
| CD8+ T cell | CD8A | 0.423 | 4.54 × 10⁻²³ | 0.238 | 9.38 × 10⁻⁷ |
| CD8B | 0.275 | 4.27 × 10⁻¹⁰ | 0.158 | 1.24 × 10⁻³ | |
| T cell (general) | CD3D | 0.329 | 4.71 × 10⁻¹⁴ | 0.115 | 1.91 × 10⁻² |
| CD3E | 0.405 | 4.8 × 10⁻²¹ | 0.203 | 2.98 × 10⁻⁵ | |
| CD2 | 0.366 | 2.94 × 10⁻¹⁷ | 0.181 | 2.15 × 10⁻⁴ | |
| B cell | CD19 | 0.247 | 2.42 × 10⁻⁸ | 0.11 | 2.45 × 10⁻² |
| CD79A | 0.221 | 6.67 × 10⁻⁷ | 0.077 | 1.18 × 10⁻¹ | |
| Monocyte | CD86 | 0.284 | 1.00 × 10⁻¹⁰ | 0.131 | 7.67 × 10⁻³ |
| CD115 (CSF1R) | 0.481 | 3.08 × 10⁻³⁰ | 0.344 | 5.46 × 10⁻¹³ | |
| TAM | CCL2 | 0.302 | 5.37 × 10⁻¹² | 0.149 | 2.38 × 10⁻³ |
| CD68 | −0.311 | 7.92 × 10⁻¹¹ | 0.08 | 1.04 × 10⁻¹ | |
| IL10 | 0.29 | 4.42 × 10⁻¹¹ | 0.188 | 1.17 × 10⁻⁴ | |
| M1 macrophage | INOS (NOS2) | 0.29 | 4.42 × 10⁻¹¹ | 0.188 | 1.17 × 10⁻⁴ |
| IRF5 | 0.133 | 2.95 × 10⁻³ | 0.064 | 1.91 × 10⁻¹ | |
| COX2 (PTGS2) | 0.353 | 4.81 × 10⁻¹⁶ | 0.254 | 1.46 × 10⁻⁷ | |
| M2 macrophage | CD163 | 0.185 | 3.15 × 10⁻⁵ | 0.061 | 2.15 × 10⁻¹ |
| VSIG4 | 0.29 | 4.12 × 10⁻¹¹ | 0.159 | 1.18 × 10⁻³ | |
| MS4A4A | 0.224 | 4.57 × 10⁻⁷ | 0.082 | 9.54 × 10⁻² | |
| Neutrophils | CD66b (CEACAM8) | 0.038 | 3.99 × 10⁻¹ | 0.007 | 8.79 × 10⁻¹ |
| CD11B (ITGAM) | 0.387 | 3.08 × 10⁻¹⁹ | 0.241 | 6.59 × 10⁻⁷ | |
| CCR7 | 0.306 | 2.97 × 10⁻¹² | 0.089 | 7.11 × 10⁻² | |
| Natural killer cell | KIR2DL1 | 0.046 | 3.02 × 10⁻¹ | −0.048 | 3.25 × 10⁻¹ |
| KIR2DL3 | 0.118 | 8.44 × 10⁻³ | 0.115 | 1.89 × 10⁻² | |
| KIR2DL4 | 0.116 | 9.66 × 10⁻³ | 0.007 | 8.82 × 10⁻¹ | |
| KIR3DL1 | 0.101 | 2.44 × 10⁻² | −0.006 | 8.96 × 10⁻¹ | |
| KIR3DL2 | 0.094 | 3.54 × 10⁻² | 0.055 | 2.65 × 10⁻¹ | |
| KIR3DL3 | 0.004 | 9.35 × 10⁻¹ | 0.063 | 1.99 × 10⁻¹ | |
| KIR2DS4 | 0.148 | 9.07 × 10⁻⁴ | 0.092 | 5.98 × 10⁻² | |
| Dendritic cell | HLA-DPB1 | 0.49 | 1.75 × 10⁻³¹ | 0.326 | 9.84 × 10⁻¹² |
| HLA-DQB1 | 0.264 | 2.08 × 10⁻⁹ | 0.132 | 6.87 × 10⁻³ | |
| HLA-DRA | 0.351 | 7.66 × 10⁻¹⁶ | 0.161 | 1.00 × 10⁻³ | |
| HLA-DPA1 | 0.423 | 4.35 × 10⁻²³ | 0.271 | 1.93 × 10⁻⁸ | |
| BDCA-1 (CD1C) | 0.442 | 3.4 × 10⁻²⁵ | 0.268 | 2.70 × 10⁻⁸ | |
| BDCA-4 (NRP1) | −0.004 | 9.27 × 10⁻¹ | −0.023 | 6.44 × 10⁻¹ | |
| CD11c (ITGAX) | 0.244 | 3.67 × 10⁻⁸ | 0.087 | 7.61 × 10⁻² | |
| Th1 | T-bet (TBX21) | 0.332 | 2.9 × 10⁻¹⁴ | 0.154 | 1.63 × 10⁻³ |
| STAT4 | 0.354 | 3.94 × 10⁻¹⁶ | 0.178 | 2.56 × 10⁻⁴ | |
| STAT1 | 0.087 | 5.35 × 10⁻² | −0.01 | 8.43 × 10⁻¹ | |
| IFN-γ (IFNG) | 0.091 | 4.19 × 10⁻² | −0.002 | 9.75 × 10⁻¹ | |
| TNF-α (TNF) | 0.214 | 1.52 × 10⁻⁶ | 0.096 | 4.92 × 10⁻² | |
| Th2 | GATA3 | 0.643 | 1.62 × 10−59 | 0.545 | 1.33 × 10⁻³³ |
| STAT6 | 0.437 | 1.13 × 10⁻²⁴ | 0.356 | 7.61 × 10⁻¹⁴ | |
| STAT5A | 0.622 | 1.33 × 10−54 | 0.499 | 1.30 × 10⁻²⁷ | |
| IL13 | 0.058 | 1.95 × 10⁻¹ | 0.014 | 7.79 × 10⁻¹ | |
| Tfh | BCL6 | 0.288 | 6.22 × 10⁻¹¹ | 0.146 | 2.90 × 10⁻³ |
| IL21 | 0.053 | 2.39 × 10⁻¹ | 0.008 | 8.73 × 10⁻¹ | |
| Th17 | STAT3 | 0.255 | 7.41 × 10⁻⁹ | 0.148 | 2.53 × 10⁻³ |
| IL17A | 0.159 | 3.56 × 10⁻⁴ | 0.023 | 6.47 × 10⁻¹ | |
| Treg | FOXP3 | 0.188 | 2.41 × 10⁻⁵ | 0.075 | 1.27 × 10⁻¹ |
| CCR8 | 0.125 | 5.06 × 10⁻³ | 0.025 | 6.11 × 10⁻¹ | |
| STAT5B | 0.5 | 6.45 × 10⁻³³ | 0.432 | 2.33 × 10⁻²⁰ | |
| TGF-β (TGFB1) | 0.532 | 1.08 × 10−37 | 0.412 | 1.94 × 10⁻¹⁸ | |
| T cell exhaustion | PD-1 (PDCD1) | 0.317 | 4.27 × 10⁻¹³ | 0.128 | 8.92 × 10⁻³ |
| CTLA4 | 0.146 | 1.08 × 10⁻³ | −0.025 | 6.17 × 10⁻¹ | |
| TIM-3 (HAVCR2) | 0.275 | 4.25 × 10⁻¹⁰ | 0.122 | 1.30 × 10⁻² | |
| GZMB | 0.222 | 5.57 × 10⁻⁷ | 0.023 | 6.37 × 10⁻¹ | |
| LAG3 | 0.466 | 3.62 × 10⁻²⁸ | 0.346 | 3.67 × 10⁻¹³ | |
| PDL1 (CD274) | 0.286 | 7.63 × 10⁻¹¹ | 0.158 | 1.23× 10⁻³ |
TAM, tumor-associated macrophage; Th, T helper cell; Tfh, Follicular helper T cell; Treg, regulatory T cell; Cor, R value of Spearman’s correlation; None, correlation without adjustment; Purity, correlation adjusted by purity.
2.8. The Association between GLIS1, Chemokines and Chemokine Receptors
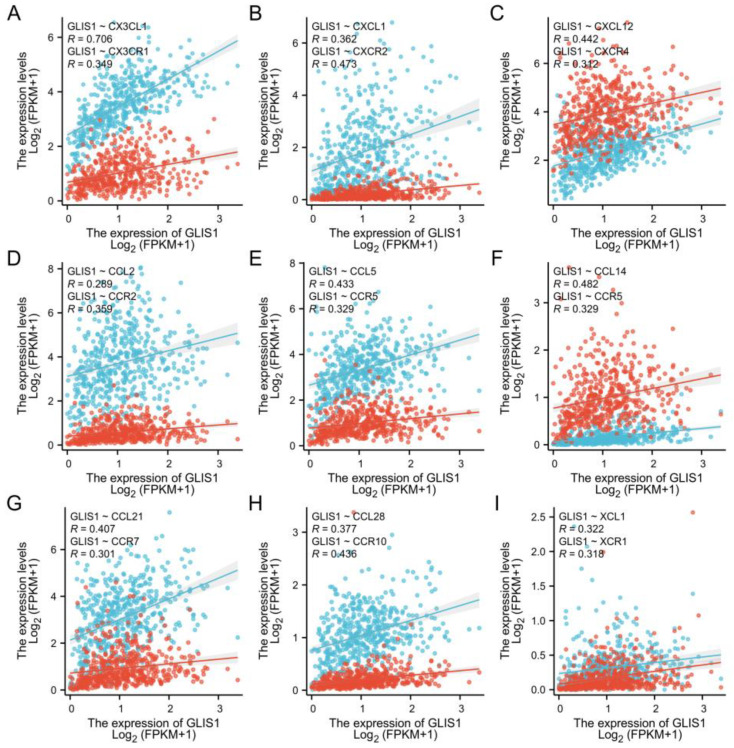
To further clarify the connection between GLIS1 and the migration of immune cells, we integrated chemokines and chemokine receptors in Figure 7A–I. The results demonstrated positive correlations between GLIS1 expression and lymphocyte-associated chemokines and chemokine receptors, including CX3CL1, CX3CR1, CXCL1, CXCR2, CXCL12, CXCR4, CCL2, CCR2, CCL5, CCR5, CCL14, CCR5, CCL21, CCR7, CCL28, CCR10, XCL1, and XCR1. These chemokines and chemokine receptors were upregulated with GLIS1 expression levels increased. Hence, high GLIS1 expression may contribute to the migration of immune cells to the tumor tissues.
3. Discussion
It is well recognized that miRNA is a crucial molecular tool for non-invasive diagnosis and prognosis of cancer. MiRNAs can bind to the 3′ untranslated region (3′ UTR) of target mRNAs, leading to the degradation and translational repression of mRNAs, exerting regulatory roles in cancer progression or suppression [ref. 31,ref. 32]. Therefore, it is important to identify the most suitable DEGs that can be used as diagnostic markers or therapeutic targets by analyzing gene expression changes in combination with miRNAs. In this study, we first identified 198 tDEGs and 18 tDEMs between PCa tissues and normal tissues from GEO datasets. Through the utilization of GO and KEGG enrichment analysis, we acquired an in-depth understanding of these genes associated with the initiation and development of PCa. To learn the general patterns of molecular changes in PCa, we then uncovered GLIS1 by aligning tDEM–TGs with tDEGs. GLIS1 exhibited reduced expression levels in PCa and demonstrated a significant association with patient survival. The expression of GLIS1 was found to be downregulated in a cohort of malignancies comparing tumor and normal tissues from independent datasets in the Genotype-Tissue Expression (GTEx) database and TCGA database. Additionally, GLIS1 participated in the biological process of immune cells entering tumor tissues and improved the tumor microenvironment (TME) of patients, and thus may affect the development of PCa and patients’ prognosis. Therefore, GLIS1 has great potential to serve as an immune-related biomarker in PCa. Our research provides a more comprehensive understanding of the mechanisms by which GLIS1 involved in the development of PCa.
The study of tumor microenvironment, including various cell clusters such as immune cells, tumor cells, and fibroblasts, has gained significant attention in recent years and has a profound impact on the progression of cancers [ref. 33,ref. 34]. Rong et al. demonstrated that GLIS1 contributes to CD8+ T cell exhaustion by transcriptionally regulating the SGK1–STAT3–PD1 signaling pathway in HCC. Suppression of GLIS1 in CD8+ T cells enhances the effectiveness of anti-PD1 treatment, presenting a promising strategy for HCC immunotherapy [ref. 23]. These suggested that GLIS1 might be involved in immune response. Therefore, how GLIS1 participates in the TME and influences tumor-infiltrating immune cells in PCa deserves exploration. Using the TIMER database, we identified that GLIS1 exerted an influence on tumor-infiltrating immune cells in PCa. The expression of GLIS1 exhibited a notable inverse association with tumor purity and was positively correlated with the infiltration of various immune cells in PCa, including B cells, DC, CD4+ T cells, CD8+ T cells, macrophages, and neutrophils. The ssGSEA methods further demonstrated a positive correlation between GLIS1 expression and the infiltration of NK cells, NK CD56bright cells, NK CD56dim cells, DC, plasmacytoid DC, immature DC, several types of T cells (Tem, Tgd, Th1 cells, cytotoxic T cells, Th17 cells, CD8+ T cells, and TFH), B cells, mast cells, neutrophils, eosinophils, macrophages, and negatively correlated with Th2 cells. Increased NK cells and CD8+ T cells can strengthen the anti-tumor immune response through the secretion of diverse cytokines and the release of perforin and granzyme [ref. 35]. NK cells, which are cytotoxic lymphocytes, consist of two primary subpopulations in humans: CD56bright and CD56dim cells [ref. 36]. Both subsets of NK cells enhance their cytolytic ability by generating a diverse range of pro-inflammatory cytokines, including as IFN-γ and TNF-α, demonstrating increased cytotoxicity against malignancies [ref. 37]. DC are the most powerful antigen-presenting cells, and their infiltration can facilitate the presentation of tumor-associated or tumor-specific antigens to T cells, thereby initiating primary immune responses [ref. 38]. The functions of tumor-associated macrophages act as a “double-edged sword” in tumor development. M1 macrophages play an anti-tumor role by secreting pro-inflammatory factors and chemokines, participating in antigen presentation and immune surveillance, while M2 macrophages promote tumor growth and angiogenesis [ref. 39,ref. 40]. The increase in B cell infiltration facilitates tumor elimination through its involvement in antibody-dependent cytotoxicity. Th1 cells were reported to inhibit PCa growth by activating CD8+ T cells and NK cell-mediated cytolytic function via the manufacturing of Th1-type cytokines such as IFN-γ and IL-2 [ref. 41]. However, Th2 cells are considered to promote tumor progression due to the immunosuppressive substances they release, including TGF-β, IL-4, IL-5, and IL-13 [ref. 42]. Research has demonstrated that the infiltrating of Th2 cells is linked to weakened immune response and lower survival time across various cancer types [ref. 43,ref. 44]. In our study, GLIS1 negatively regulated the infiltration of Th2 cells, which suggested that the decreased GLIS1 expression in PCa may help mediate the tumor immune escape. As a result, GLIS1 is involved in the regulation of TME in PCa by engaging in both cellular and humoral immunity and promoting anti-tumor activities. These findings are exciting, especially considering that there are still many PCa patients who do not respond to anti-PD1 or anti-CTLA-4 therapy, in part because PCa itself has low immune infiltration and in part because tumor cells may achieve immune escape through other pathways. Our study provides a new molecule with immunomodulatory functions to treat PCa. We may first use cells, tissues, and PCa patient-derived xenograft mice models to verify the immune regulatory function of GLIS1 in PCa and further clarify its molecular mechanism involved in immune regulation. In vitro and in vivo experiments will help us detect the efficacy of GLIS1 in enhancing PCa immunotherapy, such as the potential synergistic effect in combination with immune checkpoint inhibitors in PCa immunotherapy. The confirmation of in vitro and in vivo experiments will help us conduct human trials to explore the combined effect of GLIS1 monoclonal antibodies with anti-PD1 or anti-CTLA-4 for future PCa treatment.
Concerning GO enrichment analysis, GLIS1 was found to be involved in several signaling pathways in tumor cells, which is similar to the GO analysis results of tDEGs in PRAD (Figure 4C–E and Figure S1A), revealing a high degree of correlation regulation. For example, muscle contraction, and muscle system process for BP, collagen-containing extracellular matrix and contractile fiber for CC, and passive transmembrane transporter activity and channel activity for MF. Furthermore, the GSEA on GLIS-related immune function showed that GLIS1 affected the activation, proliferation, differentiation, and migration of immune cells. It suggests that GLIS1 enhances the immunological response of PCa through multiple pathways. Chemokines regulate the positioning and motility patterns of immune cells and are essential for immune cell migration and TME homeostasis. Subsequently, we combined chemokines and chemokine receptors and examined the correlation between GLIS1 and the migration of immune cells to investigate the potential immunological-related mechanism of GLIS1 in PCa. The interaction between CX3CL1 and CX3CR1 is involved in the recruitment of NK cells, T cells, and monocytes, and is associated with the activation of cytotoxic T lymphocytes and NK cells [ref. 45]. CCL5/CCR5 plays a role in the migration of macrophage and NK cells, as well as in the interactions between T cells and DC cells [ref. 46]. CXCL1/CXCR2 and CXCL12/CXCR4 are related to neutrophil recruitment and NK cell migration, respectively [ref. 47,ref. 48]. CCL21/CCR7 plays important roles in T cell recruitment to lymph nodes and in T cell migration [ref. 49]. XCL1/XCR1 interaction is associated with NK cell recruitment [ref. 50]. In this study, GLIS1 was positively associated with these chemokines/chemokine receptors, indicating that GLIS1 may enhance tumor immune infiltration levels via modulating the migration of immune cells in PCa.
Though this study enhances our comprehension of the association between GLIS1 and PCa, it does have several limitations. Firstly, it is necessary to conduct molecular investigations to validate the mechanisms of GLIS1 and its influence on the clinical outcome of PCa. Furthermore, critical signaling pathways related to GLIS1 need to be validated. In addition, the mechanism by which GLIS1 regulates immune cell infiltration remains to be studied. It is also crucial to incorporate and clarify the connection between GLIS1 and chemokines/chemokine receptors, which can enhance our comprehension about TME, specifically the immune microenvironment in PCa.
In conclusion, this is the first comprehensive study to elaborate the association between the expression of GLIS1 and its clinical, molecular, and immunotherapeutic characteristics in PCa, providing us new insights into the important role of GLIS1 in PCa. Our work has found that the expression of GLIS1 varies between normal tissue and tumor tissues in various cancer types and is significantly downregulated in PCa, and decreased GLIS1 expression is associated with unfavorable prognosis in PCa. GLIS1 also plays a crucial role in the microenvironment of PCa by controlling the infiltration of immune cells into tumors, indicating GLIS1 as a potential therapeutic target to regulate immune responses against tumors. Consequently, GLIS1 shows considerable promise as a helpful biomarker and therapeutic target for PCa prognosis prediction and treatment.
4. Materials and Methods
4.1. GEO Data Extraction and DEGs/DEMs/tDEGs/tDEMs Analysis
The gene expression profiles were obtained from the GEO database and the selection criteria were as stated: (1) prostate adenocarcinoma, (2) time period from 1 January 2015 to 31 December 2022, (3) tissue specimen, (4) homo sapiens, (5) sample count surpasses 30, (6) mRNA or miRNA expression data accessible. Consequently, a total of six datasets were selected, namely GSE183019, GSE134073, GSE69223, GSE88808, GSE60117, and GSE89193.
The DEGs and DEMs between normal and PCa tissue samples in each dataset were examined using “limma” package in R. Subsequently, the cut-off criteria for significant DEGs were defined as a p value < 0.05 and a |fold change| > 1.5. Similarly, for significant DEMs, the criteria were set as a p value < 0.05 and a |fold change| > 1.2. Volcano plots were subsequently utilized to promptly detect differences in DEGs and DEMs. Additionally, UpSet/Venn plots were employed to obtain the overlapping upregulated or downregulated DEGs/DEMs across all mRNA/miRNA datasets, respectively. The obtained datasets were referred to as tDEGs/tDEMs by combining the commonly shared up-regulated and down-regulated DEGs/DEMs in this investigation.
4.2. Enrichment Analysis and Key Genes Acquisition
tDEM–TGs were predicted using the online databases miRTarBase (http://miRTarBase.cuhk.edu.cn/, accessed on 22 May 2023), miRWalk (http://mirwalk.umm.uni-heidelberg.de/, accessed on 22 May 2023), TargetScan (https://www.targetscan.org/, accessed on 25 May 2023), and ENCORI (https://starbase.sysu.edu.cn/, accessed on 25 May 2023) [ref. 51,ref. 52,ref. 53]. The R package “clusterProfiler” (version 4.10.0) was used to analyze GO and KEGG for functional annotation and pathway enrichment analysis of tDEM–TGs and tDEGs. A p-value < 0.05 is deemed to be statistically significant. Then, the tDEM–TGs were matched with tDEGs to identify the intersection genes referred to as “key genes” for further investigation.
4.3. Expression and Prognosis of GLIS1 in Pan-Cancer
The TCGA database (https://portal.gdc.cancer.gov/) and the GTEx database (https://gtexportal.org/, accessed on 20 June 2023) provided the gene expression matrix and clinical data for each tumor and normal sample. Utilizing the Wilcoxon rank-sum test, differences in GLIS1 expression levels between tumor and normal tissues were examined. Histogram was drawn busing the R package “ggplot2” (version 3.4.2). The Kaplan–Meier method was employed to evaluate survival with varying levels of GLIS1 expression. Based on the median value of gene expressions, GLIS1 in tumor tissues were classified into high and low GLIS1 expression groups, and the log-rank test analysis was done using “survival” package (version 3.3.1) in R. Visualization was demonstrated by a forest plot.
4.4. Analysis of DEGs between the High and Low GLIS1 Expression Groups in PRAD Patients
The RNA sequencing data and clinical information of 499 patients diagnosed with PRAD were obtained through the TCGA database. Wilcoxon rank-sum test was employed to investigate the changes in GLIS1 expression among PRAD patients with different T stage, N stage, Gleason score, and other clinicopathological features. PRAD Patients were categorized into two groups, low-expression and high-expression, based on their median GLIS1 expression levels. DEGs were identified by comparing the expression profiles (HTSeq-FPKM) between the high GLIS1 group and low GLIS1 group using the “DESeq2” (version 1.34.0) package in R [ref. 54]. A |log2 fold change| ≥ 1 and adj. p-value < 0.05 are set as the cutoff values for the DEGs. To understand the underlying biological roles and pathways of GLIS1-related DEGs, KEGG pathway, and GO analysis focusing on BP, MF, and CC, were analyzed using the “clusterProfiler” R package (version 4.10.0) to determine the functions of the DEGs. In addition, we integrated the GO enrichment data with expression data (log2 fold change) and utilized the R package “GOplot” to compute the corresponding Z-score. Pathways and GO terms with an adj. p-value < 0.05 are considered significant. R package “ggplot2” (version 3.3.5) was used for GO and pathway visualization.
4.5. Gene Set Enrichment Analysis (GSEA)
GSEA is an analytical tool determining whether a previously identified gene set shows statistically significant, concordant differences between two phenotypes [ref. 55]. This study employed the R package “clusterProfiler” (version 4.10.0) [ref. 56] to perform GSEA to identify significant function and pathway differences between the high-GLIS1 group and low-GLIS1 group. The study chose C5: ontology gene sets in the MSigDB Collections as the reference gene collection. An adj. p-value < 0.05, false discovery rate (FDR) < 0.25, and an absolute value of normalized enrichment score (|NES|) > 1 are regarded as significant enrichment.
4.6. Immune Infiltration in Tumor Tissues
We utilized the ssGSEA method from the “GSVA” package (version: 1.50.0) in R [ref. 57] to measure the abundance of tumor-infiltrating immune cells based on PRAD mRNA FPKM data. The ssGSEA marker genes were obtained from the study conducted by Bindea et al. [ref. 58], which encompassed 24 different types of immune cells. The Wilcoxon rank-sum test and Pearson correlation were used to assess the relationship between immune cell infiltration and different GLIS1 expression groups.
TIMER [ref. 59] is a comprehensive online platform used to assess tumor-infiltrating immune cells in various cancer types. The web server can be accessed at https://cistrome.shinyapps.io/timer/, accessed on 1 August 2023. The TIMER encompasses over 10,000 samples across multiple cancer types in the TCGA database. It utilizes a partial deconvolution linear least square regression approach to determine the abundance of immune infiltrates. We assessed the association between GLIS1 expression and immune infiltrates in PRAD samples, including CD8+ T cells, CD4+ T cells, DC, neutrophils, B cells, and macrophages.
4.7. Statistical Analyses
The gene expression HTSeq RNA-seq FPKM value were transformed into log2 (FPKM + 1). The Shapiro–Wilk test was used to test data normality. Non-normally distributed two independent groups were analyzed using the Wilcoxon signed-rank test (when paired) or Mann–Whitney U test (when unpaired). The Mann–Whitney U test was employed to evaluate the expression of GLIS1 in non-paired samples, whereas the Wilcoxon signed-rank test was utilized for paired samples. The ROC curve was constructed to assess the diagnostic efficacy of GLIS1 and key miRNAs in the GEO datasets using the “pROC” package in R. The Wilcoxon signed-rank test and Chi-square test were used to analyze the relationship between GLIS1 expression and clinicopathological characteristics in PCa. The Kaplan–Meier method was utilized to create survival curves, and the log-rank test was employed to evaluate the survival disparities between groups. Univariate and multivariate analyses using Cox proportional hazard modelling were utilized to evaluate the impact of clinical factors on survival. A hazard ratio (HR) > 1 indicates an elevated risk, whereas a HR < 1 indicates a reduced risk. A p < 0.05 (two-sided) is considered statistically significant. Statistical analyses were conducted using R (version 3.6.1), SPSS (version 24.0, IBM, New York, NY, USA), or GraphPad Prism (version 8.0, GraphPad Software, La Jolla, CA, USA).
References
- H. Sung, J. Ferlay, R.L. Siegel, M. Laversanne, I. Soerjomataram, A. Jemal, F. Bray. Global Cancer Statistics 2020: GLOBOCAN Estimates of Incidence and Mortality Worldwide for 36 Cancers in 185 Countries. CA Cancer J. Clin., 2021. [DOI | PubMed]
- C. De Nunzio, R. Lombardo. Best of 2022 in prostate cancer and prostatic diseases. Prostate Cancer Prostatic. Dis., 2023. [DOI | PubMed]
- H.E. Taitt. Global Trends and Prostate Cancer: A Review of Incidence, Detection, and Mortality as Influenced by Race, Ethnicity, and Geographic Location. Am. J. Men’s Health, 2018. [DOI | PubMed]
- F. Pishgar, H. Ebrahimi, S. Saeedi Moghaddam, C. Fitzmaurice, E. Amini. Global, Regional and National Burden of Prostate Cancer, 1990 to 2015: Results from the Global Burden of Disease Study 2015. J. Urol., 2018. [DOI | PubMed]
- S. Sandhu, C.M. Moore, E. Chiong, H. Beltran, R.G. Bristow, S.G. Williams. Prostate cancer. Lancet, 2021. [DOI | PubMed]
- G. Attard, C. Parker, R.A. Eeles, F. Schroder, S.A. Tomlins, I. Tannock, C.G. Drake, J.S. de Bono. Prostate cancer. Lancet, 2016. [DOI | PubMed]
- G. Schepisi, M.C. Cursano, C. Casadei, C. Menna, A. Altavilla, C. Lolli, C. Cerchione, G. Paganelli, D. Santini, G. Tonini. CAR-T cell therapy: A potential new strategy against prostate cancer. J. Immunother. Cancer, 2019. [DOI | PubMed]
- A. Riva, S. Chokshi. Immune checkpoint receptors: Homeostatic regulators of immunity. Hepatol. Int., 2018. [DOI | PubMed]
- P. Isaacsson Velho, E.S. Antonarakis. PD-1/PD-L1 pathway inhibitors in advanced prostate cancer. Expert. Rev. Clin. Pharmacol., 2018. [DOI | PubMed]
- E.D. Kwon, C.G. Drake, H.I. Scher, K. Fizazi, A. Bossi, A.J. van den Eertwegh, M. Krainer, N. Houede, R. Santos, H. Mahammedi. Ipilimumab versus placebo after radiotherapy in patients with metastatic castration-resistant prostate cancer that had progressed after docetaxel chemotherapy (CA184-043): A multicentre, randomised, double-blind, phase 3 trial. Lancet Oncol., 2014. [DOI | PubMed]
- T.M. Beer, E.D. Kwon, C.G. Drake, K. Fizazi, C. Logothetis, G. Gravis, V. Ganju, J. Polikoff, F. Saad, P. Humanski. Randomized, Double-Blind, Phase III Trial of Ipilimumab versus Placebo in Asymptomatic or Minimally Symptomatic Patients With Metastatic Chemotherapy-Naive Castration-Resistant Prostate Cancer. J. Clin. Oncol., 2017. [DOI | PubMed]
- J. Gao, J.F. Ward, C.A. Pettaway, L.Z. Shi, S.K. Subudhi, L.M. Vence, H. Zhao, J. Chen, H. Chen, E. Efstathiou. VISTA is an inhibitory immune checkpoint that is increased after ipilimumab therapy in patients with prostate cancer. Nat. Med., 2017. [DOI | PubMed]
- G. Taverna, G. Giusti, M. Seveso, R. Hurle, P. Colombo, S. Stifter, F. Grizzi. Mast cells as a potential prognostic marker in prostate cancer. Dis. Markers, 2013. [DOI | PubMed]
- Q. Zhang, B.T. Helfand, B.A. Carneiro, W. Qin, X.J. Yang, C. Lee, W. Zhang, F.J. Giles, M. Cristofanilli, T.M. Kuzel. Efficacy Against Human Prostate Cancer by Prostate-specific Membrane Antigen-specific, Transforming Growth Factor-beta Insensitive Genetically Targeted CD8(+) T-cells Derived from Patients with Metastatic Castrate-resistant Disease. Eur. Urol., 2018. [DOI | PubMed]
- Z. Wu, H. Chen, W. Luo, H. Zhang, G. Li, F. Zeng, F. Deng. The Landscape of Immune Cells Infiltrating in Prostate Cancer. Front. Oncol., 2020. [DOI | PubMed]
- A.M. Jetten. GLIS1-3 transcription factors: Critical roles in the regulation of multiple physiological processes and diseases. Cell Mol. Life Sci., 2018. [DOI | PubMed]
- D.W. Scoville, H.S. Kang, A.M. Jetten. GLIS1-3: Emerging roles in reprogramming, stem and progenitor cell differentiation and maintenance. Stem Cell Investig., 2017. [DOI]
- M. Maekawa, K. Yamaguchi, T. Nakamura, R. Shibukawa, I. Kodanaka, T. Ichisaka, Y. Kawamura, H. Mochizuki, N. Goshima, S. Yamanaka. Direct reprogramming of somatic cells is promoted by maternal transcription factor Glis1. Nature, 2011. [DOI | PubMed]
- M. Maekawa, S. Yamanaka. Glis1, a unique pro-reprogramming factor, may facilitate clinical applications of iPSC technology. Cell Cycle, 2011. [DOI | PubMed]
- M.J. Kim, D. Jung, J.Y. Park, S.M. Lee, H.J. An. GLIS1 in Cancer-Associated Fibroblasts Regulates the Migration and Invasion of Ovarian Cancer Cells. Int. J. Mol. Sci., 2022. [DOI | PubMed]
- K. Shimamoto, K. Tanimoto, T. Fukazawa, H. Nakamura, A. Kanai, H. Bono, H. Ono, H. Eguchi, N. Hirohashi. GLIS1, a novel hypoxia-inducible transcription factor, promotes breast cancer cell motility via activation of WNT5A. Carcinogenesis, 2020. [DOI | PubMed]
- C. Vadnais, P. Shooshtarizadeh, C.V. Rajadurai, R. Lesurf, L. Hulea, S. Davoudi, C. Cadieux, M. Hallett, M. Park, A. Nepveu. Autocrine Activation of the Wnt/beta-Catenin Pathway by CUX1 and GLIS1 in Breast Cancers. Biol. Open, 2014. [DOI | PubMed]
- D. Rong, Y. Wang, L. Liu, H. Cao, T. Huang, H. Liu, X. Hao, G. Sun, G. Sun, Z. Zheng. GLIS1 intervention enhances anti-PD1 therapy for hepatocellular carcinoma by targeting SGK1-STAT3-PD1 pathway. J. Immunother. Cancer, 2023. [DOI | PubMed]
- M.M. Khan, M.T. Mohsen, M.Z. Malik, S.A. Bagabir, M.F. Alkhanani, S. Haque, M. Serajuddin, M. Bharadwaj. Identification of Potential Key Genes in Prostate Cancer with Gene Expression, Pivotal Pathways and Regulatory Networks Analysis Using Integrated Bioinformatics Methods. Genes, 2022. [DOI | PubMed]
- P. Fu, C. Bu, B. Cui, N. Li, J. Wu. Screening of differentially expressed genes and identification of AMACR as a prognostic marker in prostate cancer. Andrologia, 2021. [DOI | PubMed]
- M. Damodaran, M. Chinambedu Dandapani, SimonDuraiRaj, SandhyaSundaram, S. VenkatRamanan, I. Ramachandran, V. Venkatesan. Differentially expressed miR-20, miR-21, miR-100, miR-125a and miR-146a as a potential biomarker for prostate cancer. Mol. Biol. Rep., 2021. [DOI | PubMed]
- C. Schimmelpfennig, M. Rade, S. Fussel, D. Loffler, C. Blumert, C. Bertram, A. Borkowetz, D.J. Otto, S.H. Puppel, P. Honscheid. Characterization and evaluation of gene fusions as a measure of genetic instability and disease prognosis in prostate cancer. BMC Cancer, 2023. [DOI | PubMed]
- S. Meller, H.A. Meyer, B. Bethan, D. Dietrich, S.G. Maldonado, M. Lein, M. Montani, R. Reszka, P. Schatz, E. Peter. Integration of tissue metabolomics, transcriptomics and immunohistochemistry reveals ERG- and gleason score-specific metabolomic alterations in prostate cancer. Oncotarget, 2016. [DOI | PubMed]
- Y. Ding, H. Wu, C. Warden, L. Steele, X. Liu, M.V. Iterson, X. Wu, R. Nelson, Z. Liu, Y.C. Yuan. Gene Expression Differences in Prostate Cancers between Young and Old Men. PLoS Genet., 2016. [DOI | PubMed]
- K. Lefort, P. Ostano, M. Mello-Grand, V. Calpini, M. Scatolini, A. Farsetti, G.P. Dotto, G. Chiorino. Dual tumor suppressing and promoting function of Notch1 signaling in human prostate cancer. Oncotarget, 2016. [DOI | PubMed]
- M. Ha, V.N. Kim. Regulation of microRNA biogenesis. Nat. Rev. Mol. Cell Biol., 2014. [DOI | PubMed]
- R. Rupaimoole, F.J. Slack. MicroRNA therapeutics: Towards a new era for the management of cancer and other diseases. Nat. Rev. Drug Discov., 2017. [DOI | PubMed]
- X. Lei, Y. Lei, J.K. Li, W.X. Du, R.G. Li, J. Yang, J. Li, F. Li, H.B. Tan. Immune cells within the tumor microenvironment: Biological functions and roles in cancer immunotherapy. Cancer Lett., 2020. [DOI | PubMed]
- D.C. Hinshaw, L.A. Shevde. The Tumor Microenvironment Innately Modulates Cancer Progression. Cancer Res., 2019. [DOI | PubMed]
- P. Andre, C. Denis, C. Soulas, C. Bourbon-Caillet, J. Lopez, T. Arnoux, M. Blery, C. Bonnafous, L. Gauthier, A. Morel. Anti-NKG2A mAb Is a Checkpoint Inhibitor that Promotes Anti-tumor Immunity by Unleashing Both T and NK Cells. Cell, 2018. [DOI | PubMed]
- A.M. Abel, C. Yang, M.S. Thakar, S. Malarkannan. Natural Killer Cells: Development, Maturation, and Clinical Utilization. Front. Immunol., 2018. [DOI | PubMed]
- M.G. Morvan, L.L. Lanier. NK cells and cancer: You can teach innate cells new tricks. Nat. Rev. Cancer, 2016. [DOI | PubMed]
- A. Gardner, B. Ruffell. Dendritic Cells and Cancer Immunity. Trends Immunol., 2016. [DOI | PubMed]
- P. Liang, S.M. Henning, J. Guan, T. Grogan, D. Elashoff, P. Cohen, W.J. Aronson. Effect of dietary omega-3 fatty acids on castrate-resistant prostate cancer and tumor-associated macrophages. Prostate Cancer Prostatic Dis., 2020. [DOI | PubMed]
- T. Keeley, D.L. Costanzo-Garvey, L.M. Cook. Unmasking the Many Faces of Tumor-Associated Neutrophils and Macrophages: Considerations for Targeting Innate Immune Cells in Cancer. Trends Cancer, 2019. [DOI | PubMed]
- K. Morikawa, J. Zhang, M. Nonaka, S. Morikawa. Modulatory effect of macrolide antibiotics on the Th1- and Th2-type cytokine production. Int. J. Antimicrob. Agents, 2002. [DOI | PubMed]
- A. Basu, G. Ramamoorthi, G. Albert, C. Gallen, A. Beyer, C. Snyder, G. Koski, M.L. Disis, B.J. Czerniecki, K. Kodumudi. Differentiation and Regulation of T(H) Cells: A Balancing Act for Cancer Immunotherapy. Front. Immunol., 2021. [DOI | PubMed]
- L. De Monte, M. Reni, E. Tassi, D. Clavenna, I. Papa, H. Recalde, M. Braga, V. Di Carlo, C. Doglioni, M.P. Protti. Intratumor T helper type 2 cell infiltrate correlates with cancer-associated fibroblast thymic stromal lymphopoietin production and reduced survival in pancreatic cancer. J. Exp. Med., 2011. [DOI | PubMed]
- A. Ziegler, R. Heidenreich, H. Braumuller, H. Wolburg, S. Weidemann, R. Mocikat, M. Rocken. EpCAM, a human tumor-associated antigen promotes Th2 development and tumor immune evasion. Blood, 2009. [DOI | PubMed]
- A.M. Fong, L.A. Robinson, D.A. Steeber, T.F. Tedder, O. Yoshie, T. Imai, D.D. Patel. Fractalkine and CX3CR1 mediate a novel mechanism of leukocyte capture, firm adhesion, and activation under physiologic flow. J. Exp. Med., 1998. [DOI | PubMed]
- D. Aldinucci, C. Borghese, N. Casagrande. The CCL5/CCR5 Axis in Cancer Progression. Cancers, 2020. [DOI | PubMed]
- K.V. Sawant, K.M. Poluri, A.K. Dutta, K.M. Sepuru, A. Troshkina, R.P. Garofalo, K. Rajarathnam. Chemokine CXCL1 mediated neutrophil recruitment: Role of glycosaminoglycan interactions. Sci. Rep., 2016. [DOI | PubMed]
- G. Bernardini, G. Sciume, D. Bosisio, S. Morrone, S. Sozzani, A. Santoni. CCL3 and CXCL12 regulate trafficking of mouse bone marrow NK cell subsets. Blood, 2008. [DOI | PubMed]
- E. Ziegler, M. Oberbarnscheidt, S. Bulfone-Paus, R. Forster, U. Kunzendorf, S. Krautwald. CCR7 signaling inhibits T cell proliferation. J. Immunol., 2007. [DOI | PubMed]
- J.P. Bottcher, E. Bonavita, P. Chakravarty, H. Blees, M. Cabeza-Cabrerizo, S. Sammicheli, N.C. Rogers, E. Sahai, S. Zelenay, C. Reis e Sousa. NK Cells Stimulate Recruitment of cDC1 into the Tumor Microenvironment Promoting Cancer Immune Control. Cell, 2018. [DOI | PubMed]
- H.Y. Huang, Y.C. Lin, S. Cui, Y. Huang, Y. Tang, J. Xu, J. Bao, Y. Li, J. Wen, H. Zuo. miRTarBase update 2022: An informative resource for experimentally validated miRNA-target interactions. Nucleic Acids Res., 2022. [DOI | PubMed]
- C. Sticht, C. De La Torre, A. Parveen, N. Gretz. miRWalk: An online resource for prediction of microRNA binding sites. PLoS ONE, 2018. [DOI | PubMed]
- S.E. McGeary, K.S. Lin, C.Y. Shi, T.M. Pham, N. Bisaria, G.M. Kelley, D.P. Bartel. The biochemical basis of microRNA targeting efficacy. Science, 2019. [DOI | PubMed]
- M.I. Love, W. Huber, S. Anders. Moderated estimation of fold change and dispersion for RNA-seq data with DESeq2. Genome Biol., 2014. [DOI | PubMed]
- A. Subramanian, P. Tamayo, V.K. Mootha, S. Mukherjee, B.L. Ebert, M.A. Gillette, A. Paulovich, S.L. Pomeroy, T.R. Golub, E.S. Lander. Gene set enrichment analysis: A knowledge-based approach for interpreting genome-wide expression profiles. Proc. Natl. Acad. Sci. USA, 2005. [DOI | PubMed]
- G. Yu, L.G. Wang, Y. Han, Q.Y. He. clusterProfiler: An R package for comparing biological themes among gene clusters. Omics, 2012. [DOI | PubMed]
- S. Hanzelmann, R. Castelo, J. Guinney. GSVA: Gene set variation analysis for microarray and RNA-seq data. BMC Bioinform., 2013. [DOI]
- G. Bindea, B. Mlecnik, M. Tosolini, A. Kirilovsky, M. Waldner, A.C. Obenauf, H. Angell, T. Fredriksen, L. Lafontaine, A. Berger. Spatiotemporal dynamics of intratumoral immune cells reveal the immune landscape in human cancer. Immunity, 2013. [DOI | PubMed]
- T. Li, J. Fu, Z. Zeng, D. Cohen, J. Li, Q. Chen, B. Li, X.S. Liu. TIMER2.0 for analysis of tumor-infiltrating immune cells. Nucleic Acids Res., 2020. [DOI | PubMed]