A novel prognostic model for papillary thyroid cancer based on epithelial–mesenchymal transition‐related genes
Abstract
Background:
The frequent incidence of postsurgical recurrence issues in papillary thyroid cancer (PTC) patients is a primary concern considering the low cancer‐related mortality. Previous studies have demonstrated that epithelial–mesenchymal transition (EMT) activation is closely related to PTC progression and invasion. In this study, we aimed to develop a novel EMT signature and ancillary nomogram to improve personalized prediction of progression‐free interval (PFI).
Methods:
First, we carried out a differential analysis of PTC samples and pairwise normal thyroid samples to explore the differentially expressed genes (DEGs). The intersection of the DEGs with EMT‐related genes (ERGs) were identified as differentially expressed EMT‐related genes (DE‐ERGs). We determined PFI‐related DE‐ERGs by Cox regression analysis and then established a novel gene classifier by LASSO regression analysis. We validated the signature in external datasets and in multiple cell lines. Further, we used uni‐ and multivariate analyses to identify independent prognostic characters.
Results:
We identified 244 prognosis‐related DE‐ERGs. The 244 DE‐ERGs were associated with several pivotal oncogenic processes. We also constructed a novel 10‐gene signature and relevant prognostic model for recurrence prediction of PTC. The 10‐gene signature had a C‐index of 0.723 and the relevant nomogram had a C‐index of 0.776. The efficacy of the signature and nomogram was satisfying and closely correlated with relevant clinical parameters. Furthermore, the signature also had a unique potential in differentiating anaplastic thyroid cancer (ATC) samples.
Conclusions:
The novel EMT signature and nomogram are useful and convenient for personalized management for thyroid cancer.
Article type: Research Article
Keywords: bioinformatics, epithelial–mesenchymal transition, nomogram, papillary thyroid cancer, predictive model, recurrence, The Cancer Genome Atlas
Affiliations: Department of General Surgery, Peking Union Medical College Hospital Chinese Academy of Medical Sciences and Peking Union Medical College Beijing People’s Republic of China; State Key Laboratory of Medical Molecular Biology & Department of Immunology Institute of Basic Medical Sciences Chinese Academy of Medical Sciences, School of Basic Medicine Peking Union Medical College Beijing People’s Republic of China
License: © 2022 The Authors. Cancer Medicine published by John Wiley & Sons Ltd. CC BY 4.0 This is an open access article under the terms of the http://creativecommons.org/licenses/by/4.0/ License, which permits use, distribution and reproduction in any medium, provided the original work is properly cited.
Article links: DOI: 10.1002/cam4.4836 | PubMed: 35608185 | PMC: PMC9741981
Relevance: Moderate: mentioned 3+ times in text
Full text: PDF (8.6 MB)
INTRODUCTION
With a 3% annual increase of the incidence of the past recent decades in the United States, thyroid cancer (TC) has become the most common endocrine malignant tumor and a leading public health issue.ref. cam44836-bib-0001 Although most cases (>90%) are papillary thyroid cancer (PTC) with a good prognosis, one of the main obstacles to the treatment is the continuing high rate of recurrence, distant metastasis, and even persistent disease.ref. cam44836-bib-0002, ref. cam44836-bib-0003 Compared with cancer‐related morbidity of 13.5/100,000 in 2015, approximately 30% of PTC patients would suffer from postoperative recurrence, with the consequent requirement for reoperation.ref. cam44836-bib-0004 Postoperative recurrence not only results in a higher rate of surgical complications such as vocal cord paralysis or hypocalcemia but also with dedifferentiation events that coexist in metastatic lesions.ref. cam44836-bib-0005 In other words, anaplastic thyroid cancer (ATC), which accounts for 90% of TC‐related deaths, may occur in recurrent or metastatic sites.ref. cam44836-bib-0006 Hence, individualized therapy and surveillance based on precise prediction of the risk of recurrence remains a key focus of clinical research on PTC.ref. cam44836-bib-0007
Epithelial–mesenchymal transition (EMT) is a morphological alteration in which cells develop a fibroblast‐like phenotype following the initiation of mesenchymal cell‐related transcriptive events.ref. cam44836-bib-0008 In the process of EMT, epithelial cells dedifferentiate with a reduction in the expression of adhesion molecules (e.g., E‐cadherin), resulting in loss of the contact inhibition mediated by the tissue structure. Cells also undergo a change in morphology from a pebble to spindle shape caused by rearrangement of the cytoskeleton, loss of connection to the basement membrane, and acquisition of mesenchymal phenotypes.ref. cam44836-bib-0009 An increasing number of studies have demonstrated that EMT activation is closely related to multiple milestones in the development of cancer, including distant metastasis, extrathyroidal extension, and increased cancer cell stemness, and can be observed at the tumor‐stromal boundary of TC.ref. cam44836-bib-0010, ref. cam44836-bib-0011 Due to the complicated process of EMT, which involves various transcriptional and translational factors associated with TC, ancillary diagnostic tools based on standardized genomic characteristics would offer better predictive value than risk stratification based on clinical parameters alone.ref. cam44836-bib-0012, ref. cam44836-bib-0013 Based on the pivotal role of EMT in PTC invasion and anaplastic transformation, we established a novel 10‐gene signature derived from prognosis‐related differentially expressed EMT‐related genes (DE‐ERGs) using Cox proportional hazard analysis. Clinical validation on external datasets and experimental validation on PTC cell lines were also conducted. Thereafter, we used uni‐ and multivariate analyses to identify independent prognostic characters. We then constructed a stepwise regression model and a nomogram based on the risk score and other crucial clinical parameters to predict the prognosis of PTC patients. Subsequently, we verified the prognostic value of the novel ancillary model.
MATERIALS AND METHODS
Acquisition of TCGA‐THCA transcriptional data
We downloaded level‐3 RNA sequencing data in the form of fragments per kilobase of exon model per million reads mapped (FPKM) and counts from The Cancer Genome Atlas (TCGA) updated in July 2019.ref. cam44836-bib-0014 The TCGA, a landmark cancer genomics program, molecularly characterized over 20,000 primary cancer and matched normal samples spanning 33 cancer types. We applied a transcript per million (TPM) transformation and normalized the sequencing data with a base‐2 logarithm. Cases with a follow‐up period of less than a month were excluded. We obtained clinical data from the University of California,Santa Cruz (UCSC) Xena database, which provides interactive online visualization of seminal cancer genomics datasets, including data from TCGA and gene mutation status from the cBioPortal database.ref. cam44836-bib-0015
Differential classification of DE‐ERGs
We performed differential gene expression analysis of all the 502 PTC cases with 58 normal thyroid tissues from TCGA‐THCA dataset using the R package “EdgeR.” We identified DEGs according to the criteria of false discovery rate (FDR) <0.05 and |Log2FC| >1.ref. cam44836-bib-0016 A list of EMT‐related genes (ERGs) was obtained from the Epithelial‐Mesenchymal Transition Gene Database (dbEMT2, http://dbemt.bioinfo‐minzhao.org/).ref. cam44836-bib-0017 The DE‐ERGs were defined as the DEGs that intersected with the ERGs.
Functional annotation
The “clusterProfiler” package was used to annotate the enriched biological functions of the previously defined DE‐ERGs.ref. cam44836-bib-0018 Gene ontology (GO) and Kyoto Genes and Genomes (KEGG) pathway analyses were applied, and the terms biological process (BP), cellular component (CC), and molecular function (MF) were explored. The Benjamini–Hochberg method was used for false FDR correction.
Screening and assessment of the novel EMT signature
After differential gene expression analysis, all the 488 PTC cases from TCGA thyroid cancer (THCA) dataset were allocated randomly into the training and the testing datasets on a ratio of 0.8.ref. cam44836-bib-0019 The baseline characteristics of the 488 PTC patients in TCGA‐THCA dataset are presented in Table 1. We then used a univariate Cox regression model to screen the genes that were significantly related to progression‐free interval (PFI) (P < 0.05) in the training dataset from the DE‐ERGs. Further, crucial genes and relevant coefficients were selected from the PFI‐related DE‐ERGs by Least absolute shrinkage and selection operator (LASSO) regression analysis with the “glmnet” R package.ref. cam44836-bib-0020 To assess the efficacy of stratification of different risks of recurrence, we defined the PTC cases as “low risk” or “high risk” of recurrence according to the optimum cutoff defined by X‐Tile.ref. cam44836-bib-0021 Finally, we evaluated of the predictive power of the novel EMT signature by calculation of the area under the curve (AUC) of the receiver operating characteristic (ROC) curve in training, validation, and total set,ref. cam44836-bib-0022 and Kaplan–Meier (K–M) analysis and determination of Harrell’s C‐index using the “survcomp” and “survival” packages of R.ref. cam44836-bib-0023 Next, we analyzed the correlation between the EMT signature and clinical characters including age, gender, BRAF mutation status, TNM stage, extrathyroidal extension, residual tumor and primary focality in TCGA‐THCA cohort. Since the prognosis of PTC/ poorly differentiated thyroid cancer (PDTC)/ATC varies from relatively well to very poor, we were interested in the role of EMT signature in TC samples with different degree of differentiation. To partially address this issue, we implemented three datasets which contains PTC, PDTC, and ATC samples from GSE29265, GSE33630,ref. cam44836-bib-0024 and GSE76039ref. cam44836-bib-0025 to calculate risk score with EMT signature and immune signature previously reported by Lin et al.ref. cam44836-bib-0026 In order to prove the predictive power of the signature, we compared with the predictive power of other clinical information including American Thyroid Association (ATA) stratification, American Joint Committee on Cancer (AJCC) stage, and (Metastasis, Age, Completeness of resection, Invasion, and Size) (MACIS) score. To validate the clinical value of the EMT signature, we also implemented GSE138042,ref. cam44836-bib-0027 GSE82208, GSE58545,ref. cam44836-bib-0028 and GSE60542ref. cam44836-bib-0029 including TC samples of different stage and tissue types. All the GSE datasets were obtained from Gene Expression Omnibus (GEO); the information is listed in Table 3.
TABLE 1: Baseline of enrolled 488 PTC patients in the TCGA‐THCA dataset
| Characteristic | Training | Testing | p |
|---|---|---|---|
| n | 380 | 108 | |
| Progression, n (%) | 0.901 | ||
| Free | 341 (69.9%) | 98 (20.1%) | |
| Progression | 39 (8%) | 10 (2%) | |
| RAS_status, n (%) | 0.602 | ||
| Mutated | 48 (9.8%) | 11 (2.3%) | |
| Wild type | 332 (68%) | 97 (19.9%) | |
| BRAF_status, n (%) | 0.482 | ||
| Mutated | 212 (43.4%) | 65 (13.3%) | |
| Wild type | 168 (34.4%) | 43 (8.8%) | |
| Extrathyroid_extension, n (%) | 0.756 | ||
| Minimal (T3) | 102 (21.7%) | 28 (5.9%) | |
| Moderate/Advanced (T4) | 13 (2.8%) | 5 (1.1%) | |
| None | 255 (54.1%) | 68 (14.4%) | |
| Histological_type, n (%) | 0.348 | ||
| Classical/usual | 268 (54.9%) | 83 (17%) | |
| Follicular | 84 (17.2%) | 17 (3.5%) | |
| Tall Cell | 28 (5.7%) | 8 (1.6%) | |
| Neoplasm_focus_type, n (%) | 0.101 | ||
| Multifocal | 178 (37.2%) | 40 (8.4%) | |
| Unifocal | 195 (40.8%) | 65 (13.6%) | |
| Anatomic_site, n (%) | 0.113 | ||
| Bilateral | 69 (14.3%) | 12 (2.5%) | |
| Isthmus | 19 (3.9%) | 3 (0.6%) | |
| Unilateral | 286 (59.3%) | 93 (19.3%) | |
| Residual_tumor, n (%) | 0.677 | ||
| R0 | 291 (68.3%) | 80 (18.8%) | |
| R1 | 38 (8.9%) | 13 (3.1%) | |
| R2 | 3 (0.7%) | 1 (0.2%) | |
| Ajcc_stage, n (%) | 0.716 | ||
| Stage I | 215 (44.2%) | 58 (11.9%) | |
| Stage II | 37 (7.6%) | 14 (2.9%) | |
| Stage III | 84 (17.3%) | 26 (5.3%) | |
| Stage IV | 42 (8.6%) | 10 (2.1%) | |
| M_stage, n (%) | 0.691 | ||
| M0 | 372 (76.4%) | 107 (22%) | |
| M1 | 7 (1.4%) | 1 (0.2%) | |
| N_stage, n (%) | 0.378 | ||
| N0 | 180 (41.1%) | 45 (10.3%) | |
| N1 | 162 (37%) | 51 (11.6%) | |
| T_stage, n (%) | 0.960 | ||
| T1 | 111 (22.8%) | 30 (6.2%) | |
| T2 | 126 (25.9%) | 35 (7.2%) | |
| T3 | 125 (25.7%) | 38 (7.8%) | |
| T4 | 16 (3.3%) | 5 (1%) | |
| Gender, n (%) | 0.097 | ||
| Female | 286 (58.6%) | 72 (14.8%) | |
| Male | 94 (19.3%) | 36 (7.4%) | |
| Age, n (%) | 1.000 | ||
| <55 | 253 (51.8%) | 72 (14.8%) | |
| ≥55 | 127 (26%) | 36 (7.4%) | |
| Progression_free_interval, median (IQR) | 888.5 (496.5, 1463.75) | 927 (460, 1340.75) | 0.671 |
TABLE 3: External GEO datasets for validation of EMT signature
| Datasets | References | Platform | Samples | Usage |
|---|---|---|---|---|
| GSE82208 | Contributed by Wojtas B, et, al. | Affymetrix Human Genome U133 Plus 2.0 Array | 25 Adenomas, 27 FTCs | External Validation |
| GSE29265 | Contributed by Tomas G, et, al. | Affymetrix Human Genome U133 Plus 2.0 Array | 20 PTCs, 20 Normals, 9 ATCs | External Validation |
| GSE33630 | ref. cam44836-bib-0024 | Affymetrix Human Genome U133 Plus 2.0 Array | 49 PTCs, 45 Normals, 11 ATCs | External Validation |
| GSE60542 | ref. cam44836-bib-0029 | Affymetrix Human Genome U133 Plus 2.0 Array | 33 PTCs, 30 Normals | External Validation |
| GSE76039 | ref. cam44836-bib-0025 | Affymetrix Human Genome U133 Plus 2.0 Array | 20 ATCs, 17 PDTCs | External Validation |
| GSE58545 | ref. cam44836-bib-0028 | Affymetrix Human Genome U133A Array | 27 PTCs, 18 Normals | External Validation |
| GSE138042 | ref. cam44836-bib-0027 | Illumina HiSeq 3000 (Homo sapiens) | 50 PTCs (T1/T2), 24 PTCs (T3/T4) | External Validation |
Gene set enrichment analysis (GSEA) of the ERG‐based classifier
We explored the potential turbulence in the ERG‐based signature at the transcriptional level by GSEA.ref. cam44836-bib-0030 All the 488 PTC cases from the THCA set were defined as low‐ or high‐risk according to the optimum cutoff defined by X‐Tile. We then explored the upregulated pathways in high‐risk group using GSEA V4.1 software. C5: GO and C6: oncogenic signatures were used as background.
Cell culture and lysis
Normal human thyroid follicular cell line Nthy‐ori 3.1,ref. cam44836-bib-0031 and PTC cell lines B‐CPAP (primary and well differentiated)ref. cam44836-bib-0032 and KTC‐1 (metastatic and refractory to radio iodine)ref. cam44836-bib-0033 were kindly provided by the National Collection of Authenticated Cell Cultures of the Chinese Academy of Sciences. B‐CPAP and KTC‐1 were cultured under the circumstance of 5% CO2, 37°C, in RPMI Medium 1640 (Invitrogen) with 10% FBS (Gibco), non‐essential amino acids (Invitrogen), Glutamax (Invitrogen), and Sodium Pyruvate (Invitrogen, 11,360,070) added. TRIzol (Lablead) was used to lysate and isolate RNA from cells according to the manufacturer’s protocol.
Quantitative real‐time Polymerase Chain Reaction (RT‐qPCR)
RT‐qPCR was conducted after isolation of RNA and performed essentially as described previously with housekeeper (GAPDH) mRNA for normalization via the 2−ΔΔCt method.ref. cam44836-bib-0034 The sequences of primers are listed in Table 4.
TABLE 4: Sequences of primers for RT‐qPCR analyses
| Target gene | Primer | Sequence (5′‐3′) |
|---|---|---|
| GAPDH | Forward | AGTCCCTGCCACACTCAG |
| Reverse | TACTTTATTGATGGTACATGACAAGG | |
| FHL1 | Forward | GACTGCTTCACCTGTAGTAACT |
| Reverse | AGGTAACACACACAAAGCAATC | |
| CTGF | Forward | ATTCTGTGGAGTATGTACCGAC |
| Reverse | GTCTCCGTACATCTTCCTGTAG | |
| FOXP2 | Forward | AGCTCTGAAGTAAGCACAGTAG |
| Reverse | TGCTGCTGTAAAAGAAGTTGTC | |
| FBLN5 | Forward | CTGTGACCCAGGATATGAACTT |
| Reverse | TTGTAAATTGTAGCACGTCTGC | |
| WT1 | Forward | CCAATACAGAATACACACGCAC |
| Reverse | CATCTGTAAGTGGGACAGCTTA | |
| IL11 | Forward | GTGGCCAGATACAGCTGTC |
| Reverse | GAATTTGTCCCTCAGCTGTG | |
| WNT11 | Forward | TCTGCATGAAGAATGAGAAGGT |
| Reverse | CACCAGTGGTACTTACAGTGG | |
| AQP9 | Forward | ATACCCAGCTCCGTATCTATCT |
| Reverse | GTCAAAGATGGCAAAGACGATT | |
| UHRF1 | Forward | AATGTCAAGGGTGGCAAGAATA |
| Reverse | GCCAGTATTTCACAACCTTGTA | |
| TGFBR3 | Forward | TCCTCTGAATGGCTGCGGTACTC |
| Reverse | GGCTGGAACCTGTATCACAATGGAG |
Identification of prognosis‐associated factors
Univariate and multivariate Cox analyses were implemented to extract the correlating prognostic parameters. EMT risk score and clinical information included age, gender, BRAF mutation status, RAS mutation status, Neoplasm_size, TNM stage, extrathyroidal extension, residual tumor, primary focality, and anatomic site. Categorical variables including gender, age (over 55 or not), BRAFV600E, RAS, TNM, extrathyroidal extension, residual tumor, primary focality, anatomic site, and histological type were transformed into rank variables. We firstly conducted univariate analysis and excluded factors with p > 0.1 for further multivariate analysis.
Implementation and validation of the novel predictive model
We constructed a stepwise Cox model after collinearity tests for predicting the PTC’s PFI. Clinical factors in multivariate analysis and other previously reported significantly correlated ones were included. Thereafter, the model was visualized as a nomogram. The cutoff value to define high‐ or low‐risk groups was generated by X‐Tile based on the nomogram points for each case. We then assessed the predictive ability of the model based on the AUC of the ROC curve, the C‐index, and the calibration curve, which was generated with 1000 times bootstrap resampling.
Statistical analysis
Statistical analyses were conducted using R version 4.0.3 (Bunny‐Wunnies Freak Out) and GraphPad Prism 8.4.3 (GraphPad Software, CA, USA). Codes used for analyses are listed in supplementary document S1. Continuous data were analyzed using unpaired t‐tests. Categorical variables were analyzed using chi‐squared tests. K–M survival curves were analyzed with the Gehan–Breslow–Wilcoxon test. Multiple testing correction were applied with Benjamini and Hochberg method for difference and enrichment analyses. p‐values <0.05 were considered to indicate statistical significance.
RESULTS
Determination of DE‐ERGs
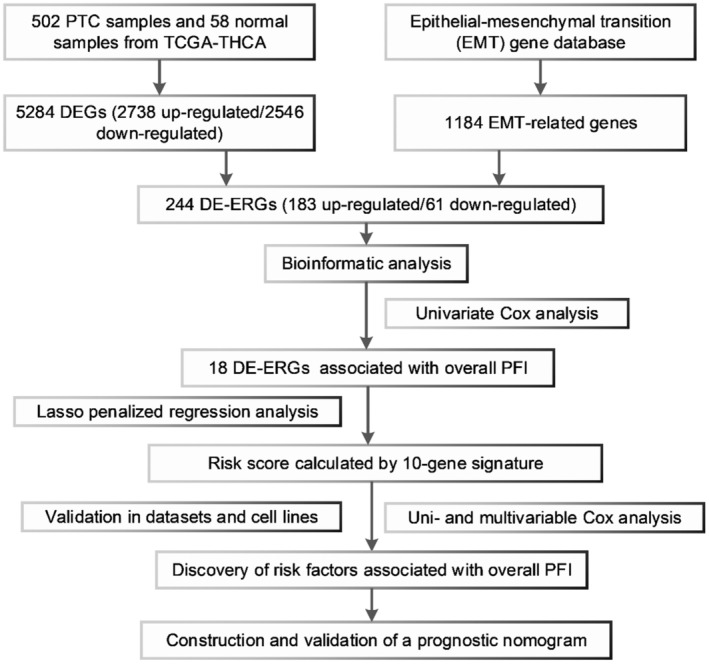
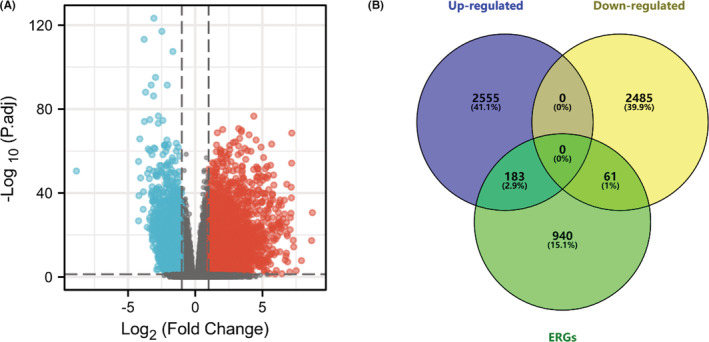
The workflow of our study is shown in Figure 1. In total, we enrolled 488 PTC cases with complete follow‐up information for our analysis. Through differential gene expression analysis of 502 PTC samples and 58 normal thyroid tissues from TCGA‐THCA, we retrieved a total of 5284 DEGs (2738 up‐ and 2546 downregulated) (Figure 2A). Furthermore, we downloaded the list of 1184 ERGs from dbEMT2. The intersection contained 244 DE‐ERGs (183 up‐ and 61 downregulated) (Figure 2B). The full list of DEGs, ERGs, and 244 DE‐ERGs is shown in Tables S1–S3.
Functional annotation of the 244 DE‐ERGs
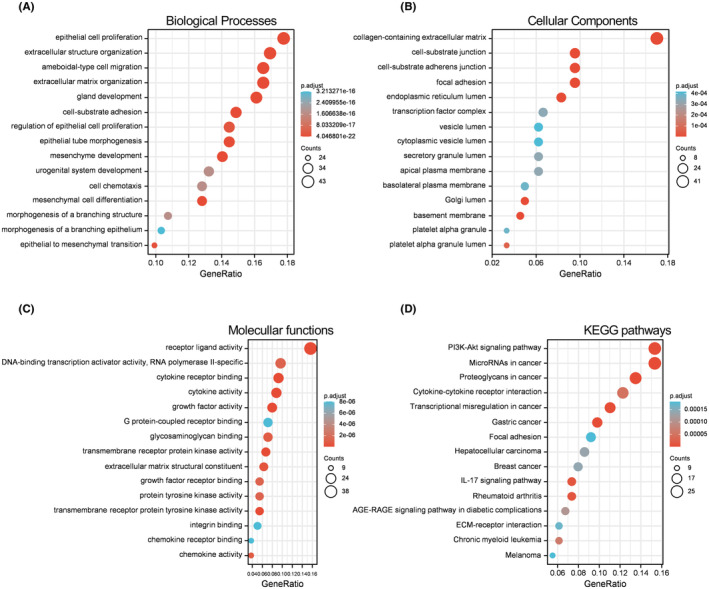
Annotation of the 244 DE‐ERGs by GO and KEGG pathway analyses is shown in Figure 3. For the biological process (BP) category, the DE‐ERGs were mainly enriched in epithelial cell proliferation, extracellular structure organization, and regulation of epithelial cell proliferation (Figure 3A). In the terms of the cellular component (CC) category, the DE‐ERGs were mainly enriched in collagen‐containing extracellular matrix, cell‐substrate junction, and focal adhesion (Figure 3B). In the terms of the molecular function (MF) category, the DE‐ERGs were mainly enriched in receptor ligand activity, DNA‐binding transcription activator activity, and polymerase II‐specific (Figure 3C). In terms of KEGG pathways, the DE‐ERGs were mainly enriched in PI3K‐Akt signaling pathway, microRNAs in cancer, and proteoglycans in cancer (Figure 3D).
Screening of significant DE‐ERGs and construction of the 10‐gene signature
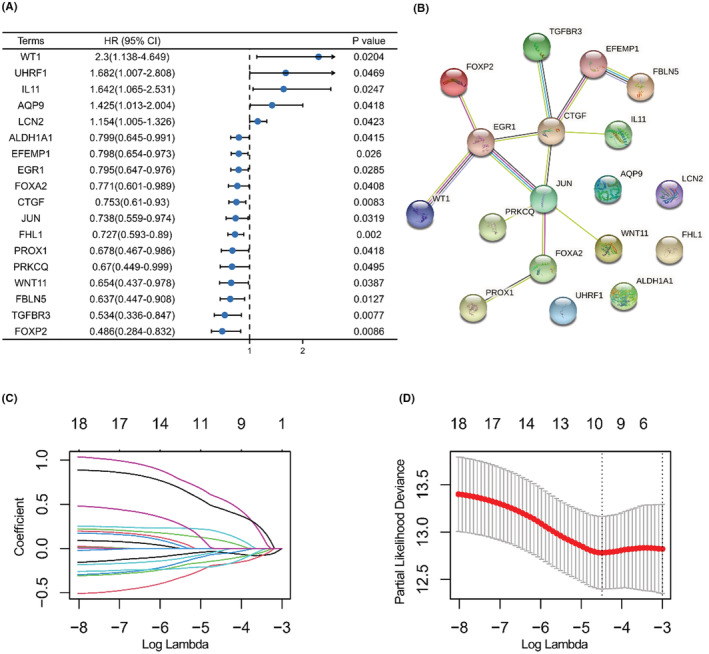
The baseline information of the training and testing sets allocated from the 488 PTC cases is shown in Table 1. A total of 18 PFI‐related DE‐ERGs were identified; full results are shown in Table S4. Forest plots of the logfc, p‐value, and hazard ratio of each item are shown in Figure 4A. The potential protein–protein interaction network of the 18 items was explored using the STRING database.ref. cam44836-bib-0035 In the complex network, five proteins (EFEMP1, CTGF, EGR1, JUN, and FOXA2) were identified as key nodes (Figure 4B). LASSO penalty regression analysis reduced and constructed a novel 10‐gene signature (Figure 4C,D). The risk score was calculated as follows: risk score = exp/FHL1 × (−0.04395) + exp/CTGF × (−0.13087) + exp/FOXP2 × (−0.05892) + exp/FBLN5 × (−0.19037) + exp/WT1 × 0.560368 + exp/IL11 × 0.448262 + exp/AQP9 × 0.088904 + exp/TGFBR3 × (−0.18178) + exp/WNT11 × (−0.02575) + exp/UHRF1 × 0.178616. The coefficient of variation (CV) in training and testing sets was 26.57% and 26.95%.
Verification of the discriminatory power of the 10‐gene signature
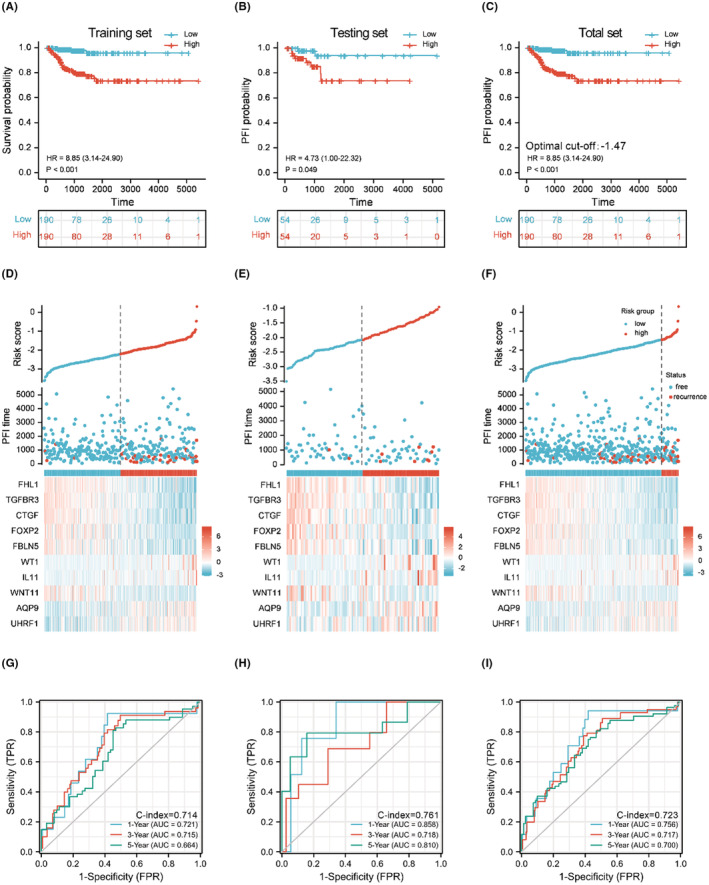
According to K–M analysis, the 10‐gene signature provided good discriminatory power for patients with high or low risk of recurrence (Figure 5A–C). PTC cases with higher risk score due to the optimum cutoff value of higher risk had a significantly poorer prognosis (p < 0.0001, Figure 5C).The relationships between risk score and recurrence events are shown in scatterplots (Figure 5D–F). In the training set, the AUCs for 1‐year, 3‐year, and 5‐year PFI prediction based on the 10‐gene signature were 0.721, 0.715, and 0.664, respectively, with a C‐index of 0.714 (Figure 5G). In the testing set, the AUCs were 0.858, 0.718, and 0.810, respectively, with a C‐index of 0.761 (Figure 5H). In the THCA total dataset, the AUCs were 0.756, 0.717, and 0.700, respectively, with a C‐index of 0.723 (Figure 5I). The optimal cutoff value for discriminating high risk patients of PTC on Illumina Hiseq 2500 platform was −1.47. Surprisingly, we observed statistically significant differences of undifferentiated TC to differentiated TC in all the three datasets (Figure S1A–C). However, for the risk score using the classifier reported by Lin et al, the difference was statistically significant only in GSE33630. We supposed that the optimal cutoff value for discriminating ATC from PTC on Affymetrix Human Genome U133 Plus 2.0 Array platform was 1.78. (Figure S1D–F). Furthermore, in GSE138042, we verified the classifier in samples with different disease stage (T1/T2 versus T3/T4) and found a statistically significant difference (p < 0.05). In GSE82208, the difference of risk score between follicular adenoma and follicular thyroid cancer (FTC) was statistically significant (p < 0.0001). Also, in GSE60542, GSE58545, GSE29265, and GSE33630, the difference of risk score between normal and PTC samples was statistically significant (p < 0.0001). And for discriminating adenoma from FTC, the optimal cutoff value would be −0.95. (Figure S2A–F). Full results are also listed in Tables S5 and S6.
GSEA
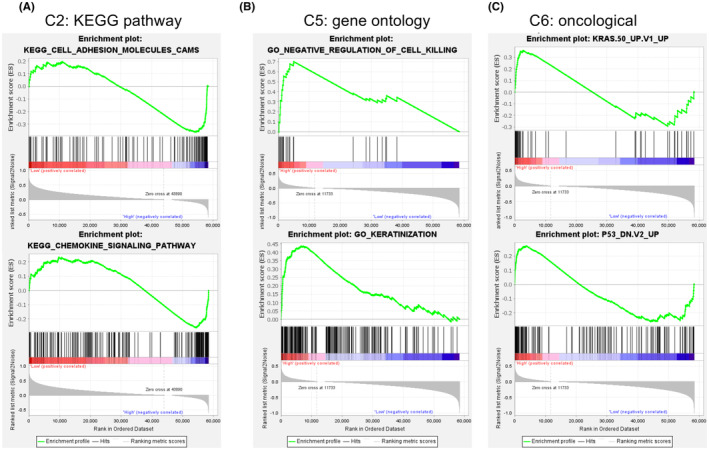
GSEA in the 488 PTC cases from THCA dataset showed the representative altered biological functions of the high‐risk group (Figure 6A–C). In the terms of KEGG pathway, the transcriptional alterations were annotated to the processes such as cell adhesion molecules and chemokine signaling pathway. In the terms of gene ontology, the transcriptional alterations were annotated to the processes such as negative regulation of cell killing and keratinization. For the oncological signatures, multiple classical oncological pathways, including the p53, the KRAS pathways were altered in the high‐risk group. Full results are shown in Table S7.
RT‐qPCR quantification and EMT signatures in PTC cell lines
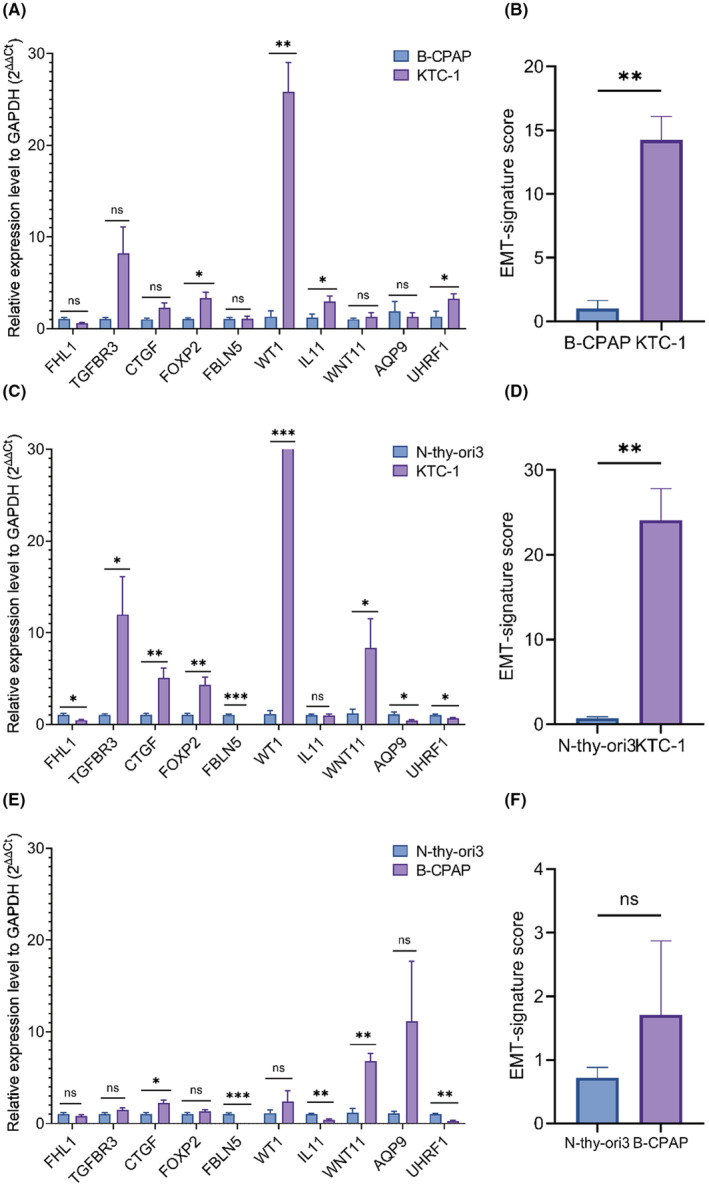
The relative 10‐gene expression level of EMT signature in B‐CPAP and KTC‐1 cell were generated through RT‐qPCR quantification. In 10 genes of EMT signature, the expression level of FOXP2, WT1, IL11, and UHRF1 were higher in KTC‐1 than B‐CPAP, the differences were statistically significant (p < 0.05). The differences of FHL1, TGFBR3, CTGF, FBLN5, WNT11, and AQP9 were not statistically significant (p > 0.05), as shown in Figure 7A. The EMT risk score of KTC‐1 was higher than B‐CPAP, as shown in Figure 7B. The expression level of TGFBR3, CTGF, FOXP2, WT1, and WNT11 was higher in KTC‐1 than normal thyroid cell line Nthy‐ori 3.1, and the differences were statistically significant (p < 0.05), as shown in Figure 7C. The risk score of KTC‐1 was also higher than Nthy‐ori 3.1, and the difference was statistically significant, as shown in Figure 7D. The expression level of CTGF and WNT11 was higher in B‐CPAP than Nthy‐ori 3.1, and the differences were statistically significant (p < 0.05), as shown in Figure 7E. The risk score of B‐CPAP was higher than Nthy‐ori 3.1, but the difference was not statistically significant, as shown in Figure 7D.
Clinical correlation of the EMT signature
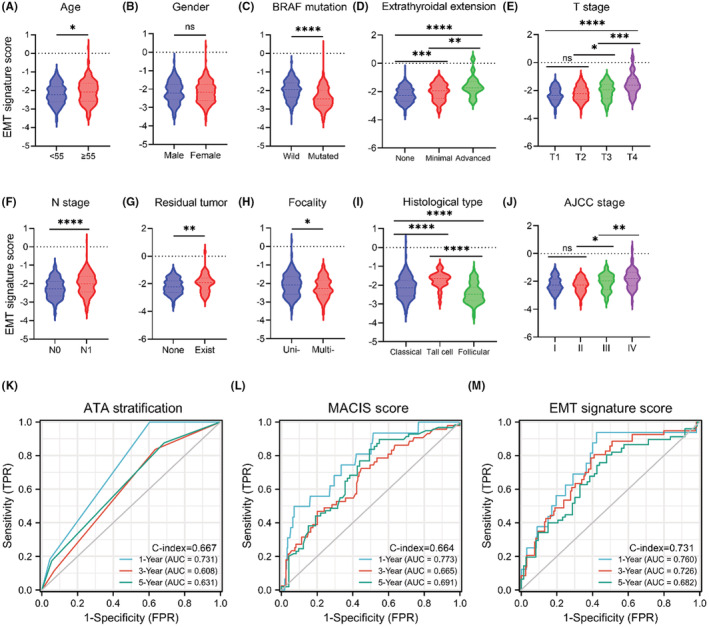
Next, we analyzed the correlation between the EMT signature and clinical characters. In groups divided by age, patients who were over 55 had higher risk score than patients who were younger than 55 (Figure 8A). In groups divided by BRAF status, wild‐type samples had higher risk score than who were mutated (Figure 8C). In terms of extrathyroidal invasion, patients with no extra‐invasion had lower risk score than those with extra‐invasion existence (Figure 8D). Patients in T1/T2 had lower risk score than those in an advanced disease stage (T3/T4) (Figure 8E). Patients in N1 had higher risk score than those without lymph node metastases (N0) (Figure 8F). In groups divided by residual tumor, patients without residual tumor had lower risk score than patients with residual tumor (Figure 8G). In groups divided by focality type, unifocal samples had higher risk score than multifocal samples (Figure 8H). Patients with aggressive histological (tall cell) type have higher risk score than those with nonaggressive histological type (Figure 8I). Patients in stage 1/2 had lower risk score than those in stage 3/4 (Figure 8J). The differences were statistically significant (p < 0.05). For the terms divided by gender, the difference was not statistically significant (p > 0.05), as shown in Figure 8B; full clinical characters are as shown in Table S8. We also compared AUCs of ATA stratification, MACIS score,ref. cam44836-bib-0036 and risk score in 435 patients from TCGA‐THCA with complete information. For ATA stratification, the AUCs for 1‐year, 3‐year, and 5‐year PFI prediction were 0.731, 0.608, and 0.631, respectively, with a C‐index of 0.667 (Figure 8K). For MACIS score, the AUCs for 1‐year, 3‐year, and 5‐year PFI prediction were 0.773, 0.665, and 0.691, respectively, with a C‐index of 0.664 (Figure 8L). For EMT signature risk score, the AUCs for 1‐year, 3‐year, and 5‐year PFI prediction were 0.760, 0.726, and 0.682, respectively, with a C‐index of 0.731 (Figure 8M), as shown in Table S9.
Identification of independent prognosis‐related parameters
The univariate Cox analysis revealed that parameters including age (≥55), neoplasm_size (≥2 cm), histological_type (tall cell), T stage (T3/T4), M stage (M1), extrathyroidal extension, and risk score were significantly associated with prognosis (p < 0.05, Table 2). After exclusion of samples with incomplete information and p < 0.1 in univariate analysis, a total of 422 patients were enrolled in multivariate analysis. In multivariate analysis, neoplasm_size (≥2 cm) and risk score were significantly associated with prognosis (p < 0.05, Table 2). Neoplasm_size (≥2 cm) and risk score were identified as independent prognosis‐related factors in both the uni‐ and multivariate analysis.
TABLE 2: Univariate and multivariate analyses of prognosis‐related characters
| Characteristics | Total (N) | Univariate analysis | Multivariate analysis | ||
|---|---|---|---|---|---|
| Hazard ratio (95% CI) | P‐value | Hazard ratio (95% CI) | p‐value | ||
| Gender | 488 | ||||
| Male | 130 | Reference | |||
| Female | 358 | 0.572 (0.320–1.024) | 0.060 | 0.749 (0.391–1.435) | 0.384 |
| Age | 488 | ||||
| <55 | 325 | Reference | |||
| ≥55 | 163 | 2.259 (1.289–3.961) | 0.004 | 1.468 (0.659–3.268) | 0.347 |
| Risk score | 488 | 4.335 (2.641–7.116) | <0.001 | 2.685 (1.462–4.933) | 0.001 |
| BRAF_status | 488 | ||||
| Wild type | 211 | Reference | |||
| Mutated | 277 | 1.455 (0.801–2.645) | 0.218 | ||
| RAS_status | 488 | ||||
| Wild type | 429 | Reference | |||
| Mutated | 59 | 1.640 (0.768–3.504) | 0.201 | ||
| Extrathyroid_extension | 471 | ||||
| None/Minimal | 453 | Reference | |||
| Moderate/Advanced | 18 | 2.100 (0.754–5.847) | 0.156 | ||
| Neoplasm_size | 474 | ||||
| <2 cm | 153 | Reference | |||
| ≥2 cm | 321 | 3.914 (1.547–9.901) | 0.004 | 2.675 (1.022–7.001) | 0.045 |
| Histological_type | 488 | ||||
| Classical/Follicular | 452 | Reference | |||
| Tall Cell | 36 | 2.417 (1.084–5.389) | 0.031 | 1.293 (0.500–3.345) | 0.596 |
| Anatomic_site | 482 | ||||
| Unilateral | 379 | Reference | |||
| Bilateral | 81 | 1.101 (0.513–2.365) | 0.805 | ||
| Isthmus | 22 | 0.413 (0.057–3.004) | 0.382 | ||
| M_stage | 487 | ||||
| M0 | 479 | Reference | |||
| M1 | 8 | 5.630 (2.021–15.687) | <0.001 | 1.618 (0.434–6.031) | 0.473 |
| Ajcc_stage | 486 | ||||
| Stage I/II | 324 | Reference | |||
| Stage III/IV | 162 | 2.753 (1.567–4.839) | <0.001 | 1.386 (0.543–3.532) | 0.495 |
| N_stage | 438 | ||||
| N0 | 225 | Reference | |||
| N1 | 213 | 1.736 (0.950–3.172) | 0.073 | 1.055 (0.526–2.114) | 0.881 |
| T_stage | 486 | ||||
| T1/T2 | 302 | Reference | |||
| T3/T4 | 184 | 2.806 (1.569–5.018) | <0.001 | 1.221 (0.577–2.581) | 0.602 |
Bold values in Table 2 indicated the statistically significant (p < 0.05).
Establishment and validation of the novel signature‐based nomogram
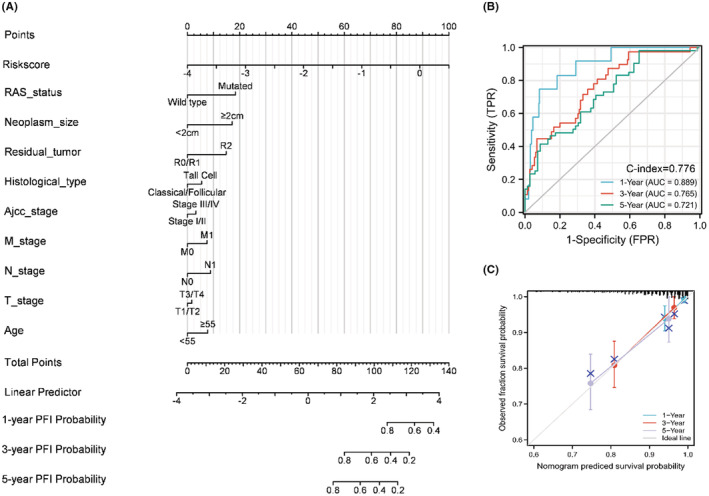
We constructed a stepwise Cox regression model including the parameters of risk score, age, TNM stage, neoplasm size, residual tumor, histological type, and RAS status. The model was visualized in a predictive nomogram as shown in Figure 9A. The AUCs for 1‐year, 3‐year, and 5‐year PFI prediction were 0.889, 0.765, and 0.721, respectively, with a C‐index of 0.776 (Figure 9B). The evaluation of the predictive nomogram using a calibration curve revealed the efficacy and robustness of the model for prediction of the prognosis of PTC patients (Figure 9C). For the purposes of better understanding and use of this predictive nomogram, we uploaded a program that facilitates visualization of the prediction results using the “DynNom” package of R (https://liuruisurgeon.shinyapps.io/EMTbased_nomogram_PTC/).ref. cam44836-bib-0037 The progression‐free predictions are obtained by clicking the “predict” button after determination of the parameters (Figure S3).
DISCUSSION
As previously described, the progression of PTC, lymph node metastasis, stemness, and anaplastic transformation are closely related to EMTref. cam44836-bib-0038; therefore, we hypothesized that EMT‐based signature would perform well in risk prediction and stratification of PTC patients. In our study, we extracted the EMT‐related genes from the dbEMT2, which curated over 1000 genes reported in more than 2000 published studies.ref. cam44836-bib-0017 Using integrated bioinformatics analysis, we established a novel EMT‐based signature for PFI prediction and recurrent risk stratification. Nomograms, which allow visualization of regression models, are widely used to provide an intuitive understanding of specific events based on enrolling meaningful characteristics.ref. cam44836-bib-0039 Traditional approach to staging, including the ATA recurrence stratification system, are widely used and practicable, but cannot be used for individualized and prospective risk evaluation prior to radical resection. The novel EMT‐related classifier and the relevant nomogram established in this study is economically feasible and simple to apply. Based on droplet digital PCR (ddPCR) technique with fine‐needle aspiration biopsy samples, the risk score could be obtained before surgery, making this a convenient approach to for decision‐making in relation to future therapy.ref. cam44836-bib-0040 For example, a more extensive neck dissection and close follow‐up after surgery would be taken if the PTC patient scored as high risk but with a relatively low risk in imaging or pathology examination. Another scenario is that indetermined FNA cases for PTC but with a high risk on the classifier, decision of active surveillance would be deliberated over. Since one of the optimum options for newly diagnosed low‐risk PTC is active surveillance, the risk score would provide accessible information that helps the patient to understand the decision to adopt this approach.ref. cam44836-bib-0041, ref. cam44836-bib-0042 Moreover, we analyzed the correlations between EMT signature with relevant clinical characters, and found significant differences in terms divided by age, gender, BRAF mutation, residual tumor, focality, extrathyroidal invasion, histological type, and TNM stage. To the best of our knowledge, PTC patients with elder age, female gender, residual tumor, tall cell type, and advanced disease stage had significantly higher rates of all‐cause mortality and recurrence,ref. cam44836-bib-0043, ref. cam44836-bib-0044, ref. cam44836-bib-0045, ref. cam44836-bib-0046 the results enhanced the potential clinical significance of EMT signature. Another interesting finding is the value of EMT signature in discovering possible dedifferentiation of thyroid cancer, which would partially address the mechanism of the ability of EMT signature in progression prediction, since anaplastic transformation are closely related to EMT.ref. cam44836-bib-0038 Further, the differences of risk score were statistically significant between follicular adenoma samples from follicular cancer, revealing a significant clinical value in FNA diagnosis, which remains challenging in differentiating FTC with benign follicular thyroid lesions.ref. cam44836-bib-0047 To validate the signature in clinical practice, we implemented multiple GEO datasets and confirmed the robustness of the signature in discriminating normal thyroid sample from PTCs. Also, we applied qPCR experiment of 10 genes on two PTC cell lines. According to background literatures, the B‐CPAP was originated from primary low‐risk PTC and with a relatively low invasiveness.ref. cam44836-bib-0048 The KTC‐1, which originated from advanced metastatic PTC and refractory to radio iodine therapy, was with lower degree of differentiation and invasiveness.ref. cam44836-bib-0033 Several significantly highly expressed genes and the higher risk score in KTC‐1 than in B‐CPAP also confirmed the connection between EMT signature with PTC invasion and dedifferentiation. The results also confirmed the intrinsic connection between EMT signature with dedifferentiation and invasiveness. Furthermore, the risk score was also lower in immortalized thyroid follicular cell line than in B‐CPAP. However, the difference was not statistically significant, indicating the mild invasiveness and progression for well differentiated cell line and circumstances for most original PTC cases.
Among our novel panel, half of them were previously identified in association with TC invasion and progression. For example, downregulated expression of FHL1 was associated with invasion of PTC.ref. cam44836-bib-0049 CTGF plays an essential role in PTC cell spheroids formation.ref. cam44836-bib-0050 LncRNA WT1 downregulates survivin by upregulating miR‐203 to inhibit PTC cell proliferation.ref. cam44836-bib-0051 Moreover, UHRF1 was highly expressed in human ATC cells, knockdown of UHRF1 inhibited proliferation and downregulated the expression of dedifferentiation marker CD97.ref. cam44836-bib-0052 All this evidence confirmed the intrinsic relationship between the novel 10‐gene signature and EMT‐induced aggressiveness of TC, although the roles of TGFBR3, FOXP2, FBLN5, IL11, WNT11, and AQP9in TC have not been reported previously. Thus, fundamental research focused on these genes may lead to a progress in the development of novel therapeutic targets. GO analysis indicated that DE‐ERGs were enriched in basement membrane, focal adhesion epithelial cell proliferation, extracellular matrix organization, and mesenchymal cell differentiation, which is consistent with the definition of ERGs. We assessed the potential turbulence caused by the novel ERG‐based signature by GSEA, which can help reflect the disturbance of the whole genome at the translational level better than general overrepresentation analysis (ORA).ref. cam44836-bib-0053 Multiple biological functions involved in several oncogenic and EMT‐related processes were found to be upregulated in the high‐risk group. These functions included process such as the cell adhesion molecules, chemokine signaling pathway, and keratinization, as well as the p53 and KRAS pathways. These findings partially explain the mechanism underlying the shorter PFI of cases with the higher risk score, although further studies are required for confirmation. During the establishment of stepwise regression model, we incorporated the risk score, clinical characters enrolled in multivariate analysis, and relevant characters previously reported significantly correlated with prognosis of PTC such RAS mutation status.ref. cam44836-bib-0054
Compared with the relatively low risk of cancer‐related death, recurrence or persistent disease remains the main issue that influence the prognosis of PTC patients.ref. cam44836-bib-0055 Reoperation results in a higher morbidity related to injury to the laryngeal nerve followed by vocal paralysis as the most serious complication.ref. cam44836-bib-0056 Personalized follow‐up based on precise prediction of recurrence risk after surgery would achieve a balance between excessive and insufficient management. The American Thyroid Association (ATA) published a risk stratification system (RSS) and response to therapy re‐classification (RTR), which has been widely employed for recurrence risk prediction.ref. cam44836-bib-0057 However, current prediction of recurrence risk is only possible after surgery or pathological examination.ref. cam44836-bib-0058 Furthermore, the complexity and diversity of the biological behavior of PTC are not taken into consideration, thus impeding early prognosis. Massive amounts of information obtained from high‐throughput methods, such as the multi‐omics technologies and next‐generating sequencing, have contributed tremendously to elucidation of the mechanism of TC.ref. cam44836-bib-0059, ref. cam44836-bib-0060 Additionally, multiple novel classifiers have been identified for prognosis prediction from different gene sets focused on specified biological functions, which innovated us for the development of the novel classifier based on EMT database.ref. cam44836-bib-0026, ref. cam44836-bib-0061
Some limitations of our study should be noted. First, due to the lack of array‐based independent gene expression profiling or sequence datasets with complete follow‐up information, we had to apply internal verification of our results. Thus, our findings require further validation using an external independent dataset. In addition, as compared to the 26.57% to 26.95% of CV in TCGA‐THCA cohort, a 10–20% CV for regular qRT‐PCR is considered more acceptable. At last, the primary source of our study was from TCGA program, in which the samples were collected from North American people. Possible biases would occur when applying the classifier in different countries or regions, which should be addressed in further clinical study.
CONCLUSION
In this study, we successfully identified a novel 10‐gene classifier and established a classifier‐based regression model combining relevant clinical characteristics for prediction of prognosis in PTC patients. The novel gene classifier and nomogram may be useful and convenient for personalized management for thyroid cancer.
AUTHOR CONTRIBUTIONS
ZC and RL designed the study, carried out experiments, and obtained the data; RL, ZC, MP, and WM analyzed the data and conducted statistical analyses; RL, ZC, MP, and XL wrote the manuscript; HY and ZL revised and approved the manuscript.
FUNDING INFORMATION
This research was supported by the National Natural Science Foundation of China (grant number: 82172727), the Nature Science Foundation of Beijing [grant number: 7202164], CAMS Innovation Fund for Medical Sciences (CIFMS) [grant number: 2016‐12 M‐3‐005], and CAMS Innovation Fund for graduate students [grant number: 2019–1002‐44].
CONFLICT OF INTEREST
The authors declare that they have no competing interests.
ETHICS STATEMENT
Not applicable
Supplementary Materials
References
- Trends in thyroid cancer incidence and mortality in the United States, 1974–2013.. JAMA., 2017. [PubMed]
- The impact of locoregional recurrences and distant metastases on the survival of patients with papillary thyroid carcinoma.. Clin Endocrinol., 2015
- Prognostic analysis of recurrence in children and adolescents with differentiated thyroid cancer.. Chin Med J (Engl)., 2020. [PubMed]
- Analysis of age and disease status as predictors of thyroid cancer‐specific mortality using the surveillance, epidemiology, and end results database.. Thyroid., 2015. [PubMed]
- Anaplastic transformation of follicular thyroid carcinoma in a metastatic skeletal lesion presenting with paraneoplastic leukocytosis.. Thyroid., 2012. [PubMed]
- Update on anaplastic thyroid carcinoma: morphological, molecular, and genetic features of the most aggressive thyroid cancer.. Int J Endocrinol, 2014. [PubMed]
- Evaluation of clinicopathological and molecular parameters on disease recurrence of papillary thyroid cancer patient: a retrospective observational study.. Cancers (Basel)., 2020. [PubMed]
- Mast cells induce epithelial‐to‐mesenchymal transition and stem cell features in human thyroid cancer cells through an IL‐8‐Akt‐slug pathway.. Oncogene., 2015. [PubMed]
- Knockdown of BAG3 induces epithelial–mesenchymal transition in thyroid cancer cells through ZEB1 activation.. Cell Death Dis., 2014. [PubMed]
- CRSP8 promotes thyroid cancer progression by antagonizing IKKα‐induced cell differentiation.. Cell Death Differ., 2020
- SOSTDC1 inhibits follicular thyroid cancer cell proliferation, migration, and EMT via suppressing PI3K/Akt and MAPK/Erk signaling pathways.. Mol Cell Biochem., 2017. [PubMed]
- A novel gene panel for prediction of lymph‐node metastasis and recurrence in patients with thyroid cancer.. Surgery., 2020. [PubMed]
- A methylomics‐associated nomogram predicts recurrence‐free survival of thyroid papillary carcinoma.. Cancer Med., 2020. [PubMed]
- Integrated genomic characterization of papillary thyroid carcinoma.. Cell., 2014. [PubMed]
- Integrative analysis of complex cancer genomics and clinical profiles using the cBioPortal.. Sci Signal., 2013. [PubMed]
- edgeR: a Bioconductor package for differential expression analysis of digital gene expression data.. Bioinformatics., 2010. [PubMed]
- dbEMT 2.0: an updated database for epithelial‐mesenchymal transition genes with experimentally verified information and precalculated regulation information for cancer metastasis.. J Genet Genomics., 2019. [PubMed]
- clusterProfiler: an R package for comparing biological themes among gene clusters.. OMICS Mei., 2012
- Identification of a five‐gene signature and establishment of a prognostic nomogram to predict progression‐free interval of papillary thyroid carcinoma.. Front Endocrinol., 2019
- Regularization paths for generalized linear models via coordinate descent.. J Stat Softw., 2010. [PubMed]
- X‐tile: a new bio‐informatics tool for biomarker assessment and outcome‐based cut‐point optimization.. Clin Cancer Res., 2004. [PubMed]
- Identification of a nine‐gene signature and establishment of a prognostic nomogram predicting overall survival of pancreatic cancer.. Front Oncol., 2019. [PubMed]
- Survcomp: an R/Bioconductor package for performance assessment and comparison of survival models.. Bioinformatics., 2011. [PubMed]
- A gene expression signature distinguishes normal tissues of sporadic and radiation‐induced papillary thyroid carcinomas.. Br J Cancer., 2012. [PubMed]
- Genomic and transcriptomic hallmarks of poorly differentiated and anaplastic thyroid cancers.. J Clin Invest., 2016. [PubMed]
- Development of a prognostic index based on an immunogenomic landscape analysis of papillary thyroid cancer.. Aging (Albany NY)., 2019. [PubMed]
- DNA repair pathway activation features in follicular and papillary thyroid tumors, interrogated using 95 experimental RNA sequencing profiles.. Heliyon Maart., 2021
- BRAFV600E‐associated gene expression profile: early changes in the transcriptome, based on a transgenic mouse model of papillary thyroid carcinoma.. PLoS ONE., 2015. [PubMed]
- Revisiting the transcriptional analysis of primary tumours and associated nodal metastases with enhanced biological and statistical controls: application to thyroid cancer.. Br J Cancer., 2015. [PubMed]
- Gene set enrichment analysis: a knowledge‐based approach for interpreting genome‐wide expression profiles.. Proc Natl Acad Sci U S A., 2005. [PubMed]
- BRAFV600E transduction of an SV40‐immortalized Normal human thyroid cell line induces dedifferentiated thyroid carcinogenesis in a mouse xenograft model.. Thyroid April, 2020. [PubMed]
- Description of a human papillary thyroid carcinoma cell line. Morphologic Study and Expression of Tumoral Markers.. Cancer., 1994. [PubMed]
- All‐trans‐retinoic acid modulates expression levels of thyroglobulin and cytokines in a new human poorly differentiated papillary thyroid carcinoma cell line, KTC‐1.. J Clin Endocrinol Metab., 2000. [PubMed]
- The tumor suppressor ING1b is a novel corepressor for the androgen receptor and induces cellular senescence in prostate cancer cells.. J Mol Cell Biol., 2016. [PubMed]
- STRING v11: protein‐protein association networks with increased coverage, supporting functional discovery in genome‐wide experimental datasets.. Nucleic Acids Res., 2019. [PubMed]
- Identification of a cut‐off for the MACIS score to predict the prognosis of differentiated thyroid carcinoma in children and young adults.. Head Neck Mei., 2012
- Visualising statistical models using dynamic nomograms.. PLoS One., 2019. [PubMed]
- Epithelial‐to‐mesenchymal transition in thyroid cancer: a comprehensive review.. Endocrine., 2019. [PubMed]
- Nomograms in oncology – more than meets the eye.. Lancet Oncol., 2015. [PubMed]
- Diagnostic value of digital droplet polymerase chain reaction and digital multiplexed detection of single‐nucleotide variants in pancreatic cytology specimens collected by EUS‐guided FNA.. Gastrointest Endosc., 2021. [PubMed]
- Low‐risk papillary microcarcinoma of the thyroid: a review of active surveillance trials.. Eur J Surg Oncol., 2018. [PubMed]
- Active surveillance of low‐risk papillary thyroid cancer: a meta‐analysis.. Surgery., 2020. [PubMed]
- Implications of extra nodal extension in differentiated thyroid cancer.. J Surg Oncol., 2017. [PubMed]
- Prognostic impact of extra‐nodal extension in thyroid cancer: a meta‐analysis.. J Surg Oncol., 2015. [PubMed]
- The impact of age on thyroid cancer staging.. Curr Opin Endocrinol Diabetes Obes., 2018. [PubMed]
- Contemporary evaluation and management of tall cell variant of papillary thyroid carcinoma.. Curr Opin Endocrinol Diabetes Obes., 2020. [PubMed]
- Follicular thyroid carcinoma: how have histologic diagnoses changed in the last half‐century and what are the prognostic implications?. Thyroid., 2015. [PubMed]
- Expression pattern of the pendrin and sodium/iodide symporter genes in human thyroid carcinoma cell lines and human thyroid tumors.. Eur J Endocrinol., 2001. [PubMed]
- TMT‐labeling proteomics of papillary thyroid carcinoma reveal invasive biomarkers.. J Cancer., 2020. [PubMed]
- Spheroid formation of human thyroid cancer cells under simulated microgravity: a possible role of CTGF and CAV1.. Cell Commun Signal., 2014. [PubMed]
- LncRNA WT1‐AS downregulates Survivin by upregulating miR‐203 in papillary thyroid carcinoma.. Cancer Manag Res., 2020. [PubMed]
- UHRF1 suppression promotes cell differentiation and reduces inflammatory reaction in anaplastic thyroid cancer.. Oncotarget., 2018. [PubMed]
- Application of a priori established gene sets to discover biologically important differential expression in microarray data.. Proc Natl Acad Sci U S A., 2005. [PubMed]
- Acquired secondary RAS mutation in BRAFV600E‐mutated thyroid cancer patients treated with BRAF inhibitors.. Thyroid September, 2020. [PubMed]
- Role of prophylactic central neck dissection in clinically node‐negative differentiated thyroid cancer: assessment of the risk of regional recurrence.. Updates Surg., 2017. [PubMed]
- Is there a role for unstimulated thyroglobulin velocity in predicting recurrence in papillary thyroid carcinoma patients with detectable thyroglobulin after radioiodine ablation?. Ann Surg Oncol., 2012. [PubMed]
- Limitations of the 2015 ATA guidelines for prediction of thyroid cancer: a review of 1947 consecutive aspirations.. J Clin Endocrinol Metab., 2018. [PubMed]
- 2015 American Thyroid Association management guidelines for adult patients with thyroid nodules and differentiated thyroid cancer: the American Thyroid Association guidelines task force on thyroid nodules and differentiated thyroid cancer.. Thyroid., 2016. [PubMed]
- Proteomics study of serum exosomes from papillary thyroid cancer patients.. Endocr Relat Cancer., 2018. [PubMed]
- RNA‐sequencing investigation identifies an effective risk score generated by three novel lncRNAs for the survival of papillary thyroid cancer patients.. Oncotarget., 2017. [PubMed]
- Identification of an autophagy‐related signature predicting overall survival for papillary thyroid carcinoma.. Dose Response Maart., 2020