Distinct Roles of Adenosine Deaminase Isoenzymes ADA1 and ADA2: A Pan-Cancer Analysis
Abstract
Objective:
Adenosine deaminase (ADA) plays an important role in immune response, which includes two isoenzymes: ADA1 and ADA2. This study aims to explore the roles of ADA1 and ADA2 in cancers.
Methods:
Human Protein Atlas (HPA) and Gene Expression Profiling Interactive Analysis (GEPIA2) databases were used to analyze the mRNA expression of ADA1 and ADA2 in human normal cells and tumor tissues. The enzyme assay was used to detect the ADA1 and ADA2 activities in serum from cancer patients. The Kaplan–Meier (KM) plotter was used to analyze the prognostic value of ADA1 and ADA2. TIMER2.0 was used to explore how ADA1 and ADA2 correlate with immune infiltration and immune checkpoints. cBioPortal database was used to investigate the mutations of ADA1 and ADA2. LinkedOmics was used to screen the ADA1 and ADA2 expression-related genes.
Results:
ADA1 was significantly increased in several tumor tissues, including cholangiocarcinoma (CHOL), lymphoid neoplasm diffuse large B-cell lymphoma (DLBC), head and neck squamous cell carcinoma (HNSC), kidney renal clear cell carcinoma (KIRC), ovarian serous cystadenocarcinoma (OV), pancreatic adenocarcinoma (PAAD), thymoma (THYM), and uterine carcinosarcoma (UCS). ADA2 expression was significantly increased in esophageal carcinoma (ESCA), glioblastoma multiforme (GBM), acute myeloid leukemia (LAML), OV, PAAD, skin cutaneous melanoma (SKCM), and stomach adenocarcinoma (STAD). There were no significant changes in serum ADA1 activities in most cancers, while serum ADA2 activities were increased in most cancers. For prognosis, high ADA1 expression was associated with the poor survival in several cancers, including esophageal squamous cell carcinoma (ESCC), HNSC, KIRC, kidney renal papillary cell carcinoma (KIRP), liver hepatocellular carcinoma (LIHC), lung adenocarcinoma (LUAD), and uterine corpus endometrial carcinoma (UCEC). However, high ADA2 expression showed a favorable prognosis in breast invasive carcinoma (BRCA), cervical squamous cell carcinoma and endocervical adenocarcinoma (CESC), HNSC, KIRC, KIRP, LUAD, OV, PAAD, sarcoma, and THYM. ADA1 showed a moderate positive correlation with multiple infiltrating immune cells in most cancers. ADA2 was positively correlated with B cells, CD8 T cells, monocytes/macrophages, and dendritic cells (DCs) and was strongly negatively correlated with myeloid-derived suppressor cells. Function analysis showed that ADA1 expression-related genes were mainly enriched in cell division biological progression. However, ADA2-related genes were mainly associated with immune response.
Conclusion:
As isoenzymes, ADA1 and ADA2 showed opposite prognostic values and different correlative patterns with immune infiltrating. These data demonstrated the distinct roles of ADA1 and ADA2 in cancer. ADA2 might act as a protective factor in cancer.
Article type: Research Article
Keywords: ADA1, ADA2, cancer, prognosis, immune infiltration
License: Copyright © 2022 Gao, Yang, Liu, Wang, Guo, Zhang and Dong CC BY 4.0 This is an open-access article distributed under the terms of the Creative Commons Attribution License (CC BY). The use, distribution or reproduction in other forums is permitted, provided the original author(s) and the copyright owner(s) are credited and that the original publication in this journal is cited, in accordance with accepted academic practice. No use, distribution or reproduction is permitted which does not comply with these terms.
Article links: DOI: 10.3389/fimmu.2022.903461 | PubMed: 35663977 | PMC: PMC9157497
Relevance: Moderate: mentioned 3+ times in text
Full text: PDF (15.5 MB)
Introduction
Adenosine deaminase (ADA) contains two isoenzymes: ADA1 and ADA2. ADA1 is encoded by ADA gene (ID: 100; location: 20q13.12). ADA2 is encoded by ADA2 (also known as CECR1) gene (ID: 51816; location: 22q11.1). ADA1 and ADA2 catalyze the deamination of adenosine, which is a key immunosuppressive signal. Notably, the affinity of ADA1 for adenosine is greater than that of ADA2 (ref. 1). ADA1 is a ubiquitously expressed intracellular protein. Deficiency of ADA1 in humans results in severe combined immunodeficiency (SCID), which is characterized by profound lymphopenia, impaired differentiation, and function of T, B, and natural killer (NK) cells (ref. 2). ADA1 deficiency-induced SCID can be treated by enzyme replacement therapy (ERT) with polyethylene-glycol-modified ADA (PEG-ADA) or gene therapy (ref. 3). Moreover, elevated ADA1 activity in erythrocytes has been considered the biomarker of Diamond-Blackfan anemia (ref. 4).
In contrast with ADA1, ADA2 is a plasma protein secreted primarily by monocytes and macrophages (ref. 5). ADA2 deficiency can lead to a range of clinical symptoms in patients, including childhood-onset stroke, systemic vasculitis, variable immunodeficiency, and hematologic defects (ref. 6–ref. 9). Moreover, studies showed that ADA2 activities were increased in tubercular pleural effusion, tubercular cerebrospinal fluid, and several autoimmune diseases, such as systemic lupus erythematosus (SLE), autoimmune liver disease (AILD), and macrophage activation syndrome of systemic juvenile idiopathic arthritis (sJIA) (ref. 10–ref. 13).
A multitude of immunosuppressive mechanisms occurring in the tumor microenvironment (TME) has been identified, including the accumulation of extracellular adenosine (ref. 14). Thus, as the enzymes that catalyze adenosine degradation, ADA1 and ADA2 may play important roles during tumor development. Several studies have shown the change of ADA activities in serum and tumor tissues of breast cancer patients (ref. 15, ref. 16). A recent study showed that PEGylated ADA2 injection inhibited the growth of several solid tumors (including colon and breast tumors) and lung metastasis in tumor-bearing mice models, which indicated the potential value of ADA in cancer therapy (ref. 17). However, the studies about ADA in cancers are still few, and the roles of ADA1 and ADA2 in pan-cancer are still unclear. As isoenzymes, there is a variety of differences between ADA1 and ADA2. Here, we conducted a pan-cancer analysis to illustrate the potential function of ADA1 and ADA2 in cancers. Moreover, by using clinical samples, we investigated the change of serum ADA1 and ADA2 activities in various cancers.
Material and Methods
Expression Profile Analysis of ADA1 and ADA2
Human Protein Atlas (HPA; https://www.proteinatlas.org/) database was used to illustrate ADA1 and ADA2 mRNA distribution among different cells. Gene Expression Profiling Interactive Analysis (GEPIA2, http://gepia2.cancer-pku.cn/#index) was used to analyze the difference in ADA1 and ADA2 mRNA expression between tumor and non-tumor control tissues based on The Cancer Genome Atlas (TCGA) and Genotype-Tissue Expression (GTEx) databases. |Log2FC| > 1, p < 0.05 was seen as statistical significance.
Prognostic Value Analysis of ADA1 and ADA2
The Kaplan–Meier (KM) plotter was used to analyze the prognostic value of ADA1 and ADA2 in pan-cancer. The “auto select best cutoff” model was chosen, which means that all possible cutoff values were computed, and the best-performing threshold was used as the cutoff. R forestplot and survival curves were used to display the results.
Immune Infiltration Analysis
Tumor Immune Estimation Resource 2.0 (TIMER2.0; http://timer.cistrome.org/) was used to investigate the molecular characterization of tumor-immune interactions. “Immune-Gene” module was used to evaluate the relationship between ADA1 and ADA2 levels and the immune cells (including B cells, T cells, monocytes/macrophages, neutrophils, dendritic cells, NK cells, etc.) and infiltrating levels in pan-cancer. The “Exploration-Gene_Corr” module was used to analyze the correlation between ADA1, ADA2, and immune checkpoints.
Mutation Profiles of ADA1 and ADA2
The cBioPortal for cancer genomics (http://www.cbioportal.org) is an open-access repository of cancer genomics datasets. The cBioPortal was used to investigate the alteration landscapes of ADA1 and ADA2 in pan-cancer.
Gene Enrichment Analysis
ADA1 and ADA2 expression-related genes (correlation coefficient |r| > 0.4, p < 0.001) were screened by using LinkedOmics based on TCGA data. Then, function analysis was performed by using DAVID Bioinformatics Resources (https://david.ncifcrf.gov/tools.jsp) (ref. 18). R Bubble diagrams were used for visualization of the enriched Gene Ontology (GO) term and Kyoto Encyclopedia of Genes and Genomes (KEGG) pathway.
Clinical Sample Collection
The detailed information of the clinical sample is listed in Supplementary Table 2. All diagnoses were confirmed by pathology. Healthy subjects were recruited as the control group. Peripheral blood from cancer patients was collected and subjected to a 4,000-rpm centrifuge for 5 min at 4°C to obtain serum. Serum was stored at −20°C. Ethical approval was obtained from the ethics committee of Tangdu Hospital, The Fourth Military Medical University. Waiver of informed consent would not affect the rights and interests of the subjects. Thus, informed consent was not required in this study.
Serum Adenosine Deaminase Activity Detection
In the previous description (ref. 13), serum total ADA activities were measured by using the enzymatic kit (Shanghai Kehua Bio-engineering, Shanghai, China), adapted to the automated biochemistry analyzer (Hitachi 7600, Tokyo, Japan). The serum ADA2 activities were measured in the presence of 0.1 mM of erythro-9-(2-hydroxy-3-nonyl) adenine (EHNA), which is a selective inhibitor of ADA1. The serum ADA1 activity was calculated by subtracting the ADA2 activity from the total ADA activity. The results were expressed as units per liter (U/L).
Statistical Analysis
Serum ADA1 and ADA2 levels were expressed as the mean (SD). Student’s t-test test was used to analyze the difference in serum ADA activities between patients and healthy controls. Pearson’s correlation analyses were used to gauge the degree of correlation between genes expression. p < 0.05 was considered to be statistically significant.
Results
ADA1 and ADA2 Expression Profiles in Tumors
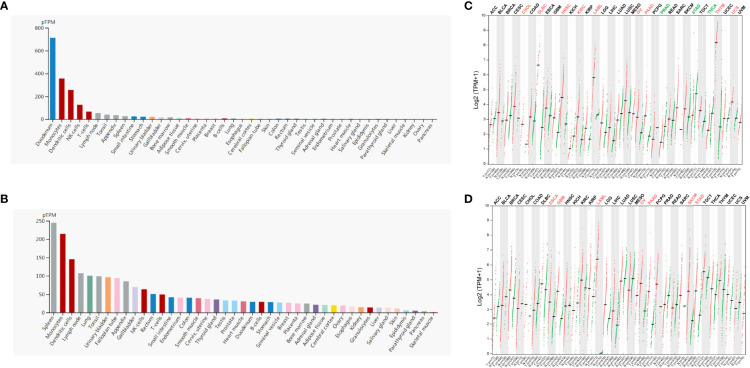
Firstly, we evaluated the expression profile of ADA and ADA2 in human tissues and cells based on the HPA database. The results showed that ADA1 expression was enriched in the duodenum, monocytes, dendritic cells (DCs), NK cells, and T cells, and ADA2 was enriched in the spleen, monocytes, DCs, lymph nodes, and lung (f1). Furthermore, we investigated the differential expression of ADA1 and ADA2 between tumor and normal tissues. ADA1 was significantly increased in cholangiocarcinoma (CHOL), lymphoid neoplasm diffuse large B-cell lymphoma (DLBC), head and neck squamous cell carcinoma (HNSC), kidney renal clear cell carcinoma (KIRC), acute myeloid leukemia (LAML), ovarian serous cystadenocarcinoma (OV), pancreatic adenocarcinoma (PAAD), thymoma (THYM), and uterine carcinosarcoma (UCS) while decreased in prostate adenocarcinoma (PRAD), stomach adenocarcinoma (STAD), and thyroid carcinoma (THCA) (f1). ADA2 was significantly increased in esophageal carcinoma (ESCA), glioblastoma multiforme (GBM), LAML, OV, PAAD, skin cutaneous melanoma (SKCM), and STAD (f1). Notably, in LAML, OV, and PAAD tumor tissues, both ADA1 and ADA2 were increased, while in STAD tumor tissues, the expression changes of ADA1 and ADA2 were opposite.
The Potential Prognostic Value of ADA1 in Cancers
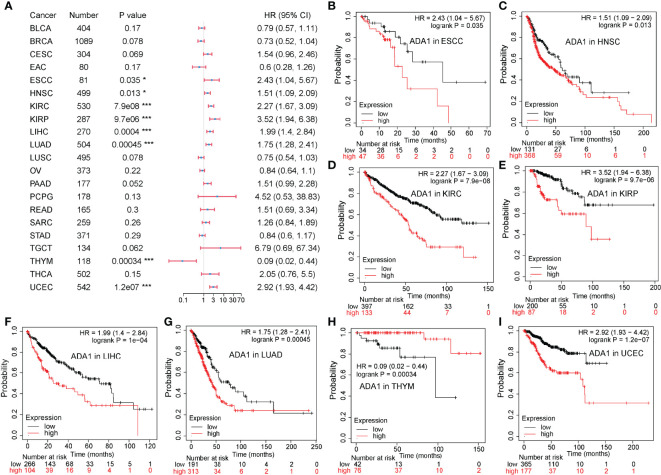
To evaluate the potential prognostic value of ADA1 and ADA2, KM plotter was used to analyze the correlation between patients’ overall survival (OS) and expression of ADA1 and ADA2. As shown in f2, high ADA1 expression was associated with the poor OS in several cancers, including esophageal squamous cell carcinoma [ESCC; HR (95% CI) = 2.43 (1.04–5.67), p = 0.035], HNSC [HR (95% CI) = 1.51 (1.09–2.09), p = 0.013], KIRC [HR (95% CI) = 2.27 (1.67–3.09), p = 7.9e−08], kidney renal papillary cell carcinoma [KIRP; HR (95% CI) = 3.52 (1.94–6.38), p = 9.7e−06], liver hepatocellular carcinoma [LIHC; HR (95% CI) = 1.99 (1.4–2.84), p = 4e−04], lung adenocarcinoma [LUAD; HR (95% CI) = 1.75 (1.28–2.41), p = 4.5e−04], and uterine corpus endometrial carcinoma [UCEC; HR (95% CI) = 2.92 (1.93–4.42), p = 1.2e−07]. However, high ADA1 expression significantly related to a better prognosis in THYM [HR (95% CI) = 0.09 (0.02–0.44), p = 3.4e−04]. These results indicated that ADA1 plays different roles in THYM and other cancers.
The Potential Prognostic Value of ADA2 in Cancers
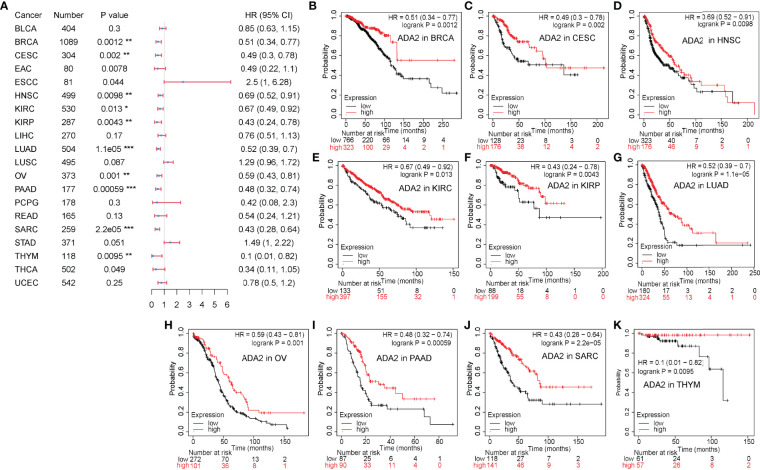
On the contrary, as shown in f3, in a variety of cancers, patients with high ADA2 expression showed a favorable prognosis, including breast invasive carcinoma [BRCA; HR (95% CI) = 0.51 (0.34–0.77), p = 0.0012], cervical squamous cell carcinoma and endocervical adenocarcinoma [CESC; HR (95% CI) = 0.49 (0.3–0.78), p = 0.002], HNSC [HR (95% CI) = 0.69 (0.52–0.91), p = 0.0098], KIRC [HR (95% CI) = 0.67 (0.49–0.92), p = 0.013], KIRP [HR (95% CI) = 0.43 (0.24–0.78), p = 0.0043], LUAD [HR (95% CI) = 0.52 (0.39–0.7), p = 1.1e−05], OV [HR (95% CI) = 0.59 (0.43–0.81), p = 0.001], PAAD [HR (95% CI) = 0.38 (0.32–0.74), p = 5.9e−04], sarcoma [SARC; HR (95% CI) = 0.43 (0.28–0.64), p = 2.2e−05], and THYM [HR (95% CI) = 0.1 (0.01–0.82), p = 0.0095]. Taken together, these results demonstrated the different prognostic value between ADA1 and ADA2 in several types of cancers.
The Correlation Between Immune Infiltration and ADA1 and ADA2
To explore whether ADA was involved in the process of tumor-immune infiltration, we employed TIMER2.0 to analyze the correlation between tumor-infiltrating immune cells and the expression of ADA1 and ADA2. In most tumors, we observed a moderate positive correlation between ADA1 and multiple infiltrating immune cells (f4), including B cells, T cells, monocytes/macrophages, DCs, NK cells, and cancer-associated fibroblasts (CAFs). However, in THYM, ADA1 was negatively correlated with monocytes/macrophages, NK cells, and CAFs and was positively correlated with CD4+ T, CD8+ T cells, and DCs. These results indicated the potential mechanism of the different prognostic values of ADA1 in THYM and other tumors.
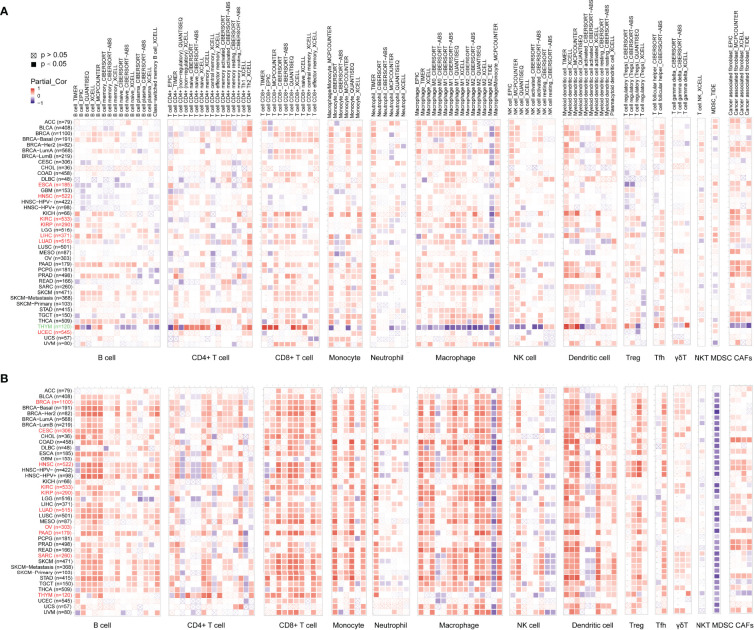
As shown in f4, the relationship between ADA2 and infiltrating immune cells was consistent across pan-cancer. Moreover, compared to ADA1, the correlation coefficient between ADA2 and infiltrating cells was higher. ADA2 was strongly positively correlated with B cells, CD8 T cells, monocytes/macrophages, and DCs. However, a strong negative correlation between ADA2 and myeloid-derived suppressor cells (MDSCs) was observed. These results suggested that decreased MDSC infiltration might be associated with the favorable prognosis of patients with higher ADA2 expression.
The Relationship Between Immune Checkpoints and ADA1 and ADA2
The correlations between ADA1 and immune checkpoints are shown in f5. First of all, in THYM, ADA1 is positively related to TMIGD2, LAIR1, ADORA2A, ICOS, and PDCD1 while negatively related to ICOSLG, TNFRSF25, TNFSF18, CD40, LAG3, TNFSF9, CD80, CD276, TNFRSF18, etc. Secondly, in KIRC and PRAD, there was a strong positive correlation between ADA1 and most immune checkpoints. Moreover, in most cancers except GBM, LGG, CHOL, UCEC, HNSC, lung squamous cell carcinoma (LUSC), and OV, there was a moderate positive correlation between ADA1 and immune checkpoints. Notably, compared to that in other cancers, the correlation profile between ADA1 and immune checkpoints was significantly different in THYM.
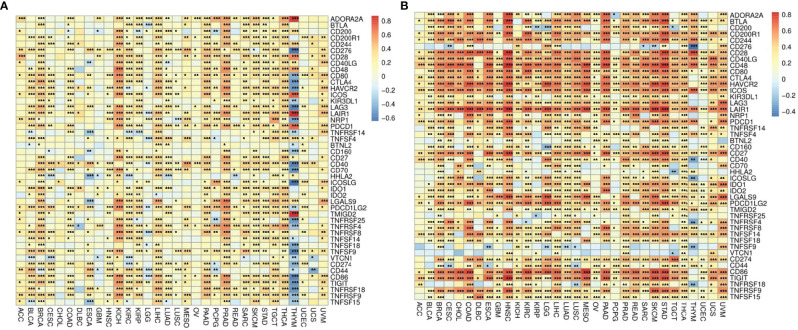
ADA2 (f5), in most cancers, positively correlated with LGALS9, CD80, CTLA4, LAG3, TNFRSF9, PDCD1LG2, CD274, IDO1, TNFSF14, CD244, CD200R1, CD28, BTLA, PDCD1, CD40LG, ICOS, LAIR1, HAVCR2, CD86, CD48, CD27, and TIGIT. Moreover, ADA2 negatively correlated with CD276, TNFSF9, and VTCN1 in most cancers. Compared with ADA1, ADA2 showed a higher correlation with immune checkpoints.
The Mutation Profile of ADA1 and ADA2 in Cancers
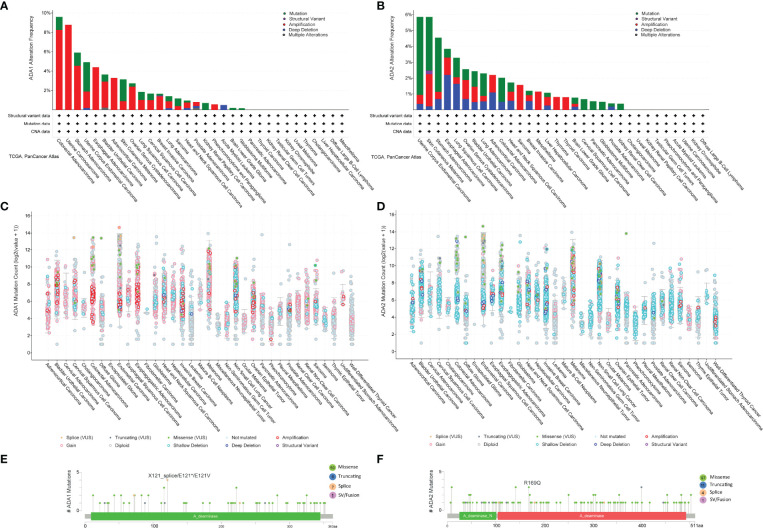
We employed the cBioPortal to investigate the mutation profile of ADA1 and ADA2. In summary, the alteration frequency of ADA1 and ADA2 was lower than 5% in most cancers. As shown in f6, the top 5 cancer types that contained ADA1 alteration were colorectal adenocarcinoma (COADREAD), UCS, STAD, UCEC, and ESCA. The major alteration type of ADA1 gene was amplification. Furthermore, for ADA2 alteration, the top 5 cancers were UCEC, SKCM, STAD, ESCA, and LUSC (f6). The major alteration type of ADA2 gene was a mutation. Deep deletion of ADA1 was rare in most cancers, while deep deletion of ADA2 was found in most cancers (f6). As shown in f6, a total of 73 mutations were found in ADA1 (including 59 missense, 6 truncating, 7 splice, and 1 fusion). For ADA2 (f6), a total of 113 mutations were found (including 97 missense, 11 truncating, 4 splice, and 1 fusion).
Enrichment Analysis of ADA1 and ADA2 Expression-Related Genes in Lung Adenocarcinoma, Kidney Renal Clear Cell Carcinoma, and Kidney Renal Papillary Cell Carcinoma
According to the survival analysis, we observed contradictory prognostic values of ADA1 and ADA2 in LUAD, KIRC, and KIRP. Thus, we further screened the ADA1 and ADA2 expression-associated genes in these cancers and performed a functional analysis of these genes. By using LinkedOmics, the positively correlated genes with ADA1 and ADA2 in LUAD, KIRC, and KIRP were screened (correlation coefficient r > 0.4, p < 0.001). Among ADA1 positively related genes in three cancers, there were 20 shared genes (f7). For ADA2 positively related genes, there were 403 shared genes (f7). These shared genes are listed in Supplementary Table 2. NKG7 is the only gene that positively related to both ADA1 and ADA2 in three cancers.
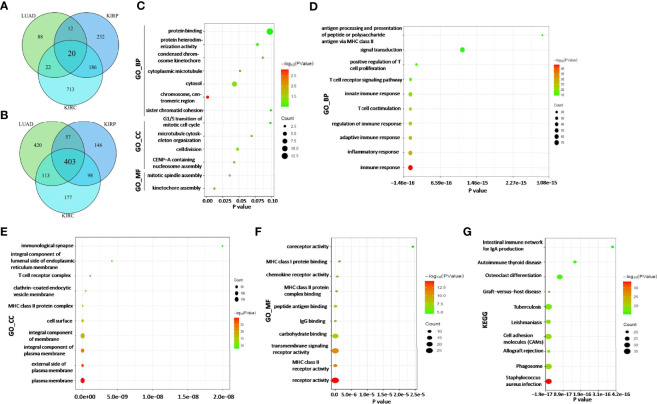
Next, function enrichment analysis was performed to investigate the biological characteristics associated with ADA1-related genes (Supplementary Table 2). As shown in f7, for biological process (GO_BP), the ADA1 expression correlated genes were mainly related to cell division, including kinetochore assembly, mitotic spindle assembly, and CENP-A containing nucleosome assembly. However, as shown in f7, ADA2 correlated genes were mainly associated with immune response, including inflammatory response, innate and adaptive immune response, T-cell costimulation, positive regulation of T-cell proliferation, etc. GO_MF (molecular function) analysis for ADA2 correlated genes showed enrichment in MHC class II receptor activity, IgG binding, peptide antigen binding, MHC class II protein complex binding, etc. Moreover, KEGG pathway analysis showed that ADA2 correlated genes were related to Staphylococcus aureus infection, phagosome, cell adhesion molecules, osteoclast differentiation, etc. Taken together, the different functions of ADA1 correlated genes and ADA2 correlated genes might contribute to the different prognostic values of ADA1 and ADA2.
The Serum ADA1 and ADA2 Activities in Cancers
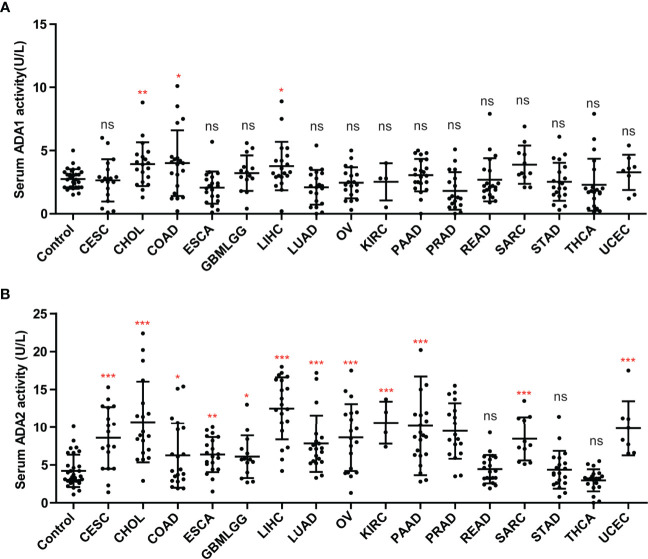
We investigated the ADA1 and ADA2 activities in serum from cancer patients, including CESC, CHOL, colon adenocarcinoma (COAD), ESCA, GBM, LIHC, LUAD, OV, KIRC, KIRP, PAAD, PRAD, rectal adenocarcinoma (READ), SARC, STAD, THCA, and UCEC. Compared to controls, there were no significant changes in serum ADA1 activities in most cancers, except in CHIL, COAD, and LIHC (f8). However, serum ADA2 activities were significantly increased in most cancers, except in READ, STAD, and THCA (f8).
Discussion
Adenosine concentration in vivo is regulated by enzyme cascade, as follows: ATP/ADP is degraded into AMP, which is catalyzed by CD39 (also known as E-NTPDase1); AMP is degraded into adenosine, which is catalyzed by CD73 (ecto-5′-nucleotidase, NT5E); adenosine is degraded into inosine, which is catalyzed by ADA. Adenosine acts as an immunosuppressive signal in humans (ref. 19). Thus, targeting the adenosine pathway has been considered a promising therapeutic strategy for cancer. Several clinical studies targeting CD39, CD73, and adenosine receptors are ongoing. Some beneficial outcomes for both mono-target therapy and combinations have been reported (ref. 20, ref. 21). However, the function and clinical value of ADA in cancers have not been well analyzed, including ADA1 and ADA2.
As the isoenzymes, ADA1 and ADA2 have ADA activities. However, increasing evidence has shown that there were several different features and functions between ADA1 and ADA2. Firstly, in the different locations of ADA1 and ADA2, ADA1 is mostly expressed intracellularly, while ADA2 is mostly secreted extracellularly. Thus in plasma or serum, total ADA activity is mainly constituted by ADA2 activity and is highly positively correlated with ADA2 activity (ref. 22, ref. 23). Secondly, ADA1 shows a higher affinity toward adenosine and higher catalytic activity than ADA2. Thirdly, Human ADA1 and ADA2 could bind to different subsets of immune cells (ref. 24). ADA1 could bind to the surface of immune cell subtypes via dipeptidyl peptidase IV (CD26). ADA2 belonged to the ADA deaminase growth factor family and could bind to immune cell subtypes that do not express CD26, via proteoglycans or other unknown receptors. A study by Zavialov et al. showed that ADA2 induces the differentiation of monocytes into macrophages and stimulates the proliferation of T helper cells and macrophages (ref. 25). Fourthly, the diseases induced by the deficiency of ADA1 and ADA2 were different; ADA-SCID is a well-known ADA1 deficiency that causes diseases that could be cured by ADA1 replacement therapy (ref. 26). However, ADA2 deficiency was associated with a spectrum of vascular and inflammatory phenotypes, including early-onset recurrent stroke and systemic vasculopathy (ref. 27, ref. 28). Taken together, because of these differences between ADA1 and ADA2, we presume that ADA1 and ADA2 may play different roles in cancers.
In this study, we investigated the distinct roles of ADA1 and ADA2 in pan-cancer. In general, the mutation frequency of ADA1 and ADA2 in cancers was low. It may be understandable because the ADA1/ADA2 mutations usually cause severe disease in children. The highlighted results of this study are as follows: firstly, the ADA1 and ADA2 showed opposite prognostic values in several types of cancers. In cancers with a significant association with ADA1 or ADA2 levels, higher ADA1 showed a poor prognosis (except for THYM), while higher ADA2 was associated with better survival. Recently, a study by Wang et al. found that PEGylated ADA2 injection could inhibit tumor growth in colon and breast cancer murine models (ref. 17). These data indicated that ADA2 might be a protected factor in several tumor types (BRCA, CESC, HNSC, KIRC, KIRP, LUAD, OV, PAAD, and THYM). A study by Lee et al. showed that ADA2 levels could be stimulated by cytokines, such as IFNγ, IL-12, IL-18, and TNF-α (ref. 13). IFNγ, IL-12, IL-18, and TNF-α have shown antitumor effects (ref. 29–ref. 31). Thus, the correlation between ADA2 and these cytokines might be a potential mechanism for ADA2’s favorable prognostic value. A study by Wang et al. has shown the antitumor effects of ADA2 protein injection for several tumors (ref. 17). Based on the analysis of this study, the potential antitumor effects of ADA2 proteins or ADA2 agonists in more cancers needed to be investigated. Moreover, to better understand the different roles of ADA1 and ADA2, the effect of ADA1 protein and ADA1 inhibitor EHNA on tumors growth and metastasis should be further studied. Nakajima’s study has shown that EHNA exhibits a potent anticancer effect against malignant pleural mesothelioma (ref. 32).
Secondly, in the different correlation profiles between infiltrating immune cells and ADA1 or ADA2, ADA1 showed a moderate positive correlation with multiple infiltrating immune cells in most cancers except THYM. ADA2 was strongly positively correlated with B cells, CD8 T cells, monocytes/macrophages, and DCs and was strongly negatively correlated with MDSCs. The correlations between ADA1/ADA2 and immune checkpoints also supported this conclusion. Accumulated evidence has shown that MDSCs contributed to cancer progression via various mechanisms, including hampering antitumor-immune responses (ref. 33, ref. 34). Thus, the favorable prognostic value of ADA2 could be explained, at least in part, by the negative correlation between ADA2 and MDSC infiltration.
Thirdly, we screened the genes positively correlated with ADA1 or ADA2 in LUAD, KIRP, and KIRC. Among 20 ADA1 correlated genes and 403 ADA2 correlated genes, there was only one shared gene, NKG7. Furthermore, function analysis showed that these 20 ADA1-related genes were mainly enriched in cell division biological progression, including kinetochore assembly and mitotic spindle assembly. However, these 403 ADA2-related genes were mainly associated with immune response, including inflammatory response, innate and adaptive immune response, T-cell costimulation, and positive regulation of T-cell proliferation. These data indicated the potential mechanism of distinct roles for ADA1 and ADA2 in cancers.
Interestingly, high ADA1 expression was associated with better survival in THYM patients, which was in contrast to ADA1’s prognostic value in other cancers. Moreover, between THYM and other cancers, the correlation profile between ADA1 and infiltrating immune cells or immune checkpoints also showed significant differences. Studies have shown that ADA1 was critical for thymus development, and ADA1 deficiency promoted thymic T-cell apoptosis (ref. 35–ref. 37). ADA1 deficiency caused SCID characterized by a deficiency of T cells caused by arrested development in the thymus. The unique need for ADA1 in the thymus might be a reason for the different roles of ADA1 between THYM and other cancers.
Notably, the ADA1 and ADA2 levels in tumor tissues and serum from cancer patients do not have a corresponding relationship. This difference might be due to the different locations of ADA1 (intracellular) and ADA2 (extracellular). As a secretory protein, ADA2 was increased in serum in most cancers. However, the prognostic value of serum ADA2 has not been revealed. Serum ADA2 is easy to test; thus, there is a potential application value for the study on the clinical significance of serum ADA2.
Conclusion
In conclusion, we applied integrated bioinformatics analysis to demonstrate the roles of ADA1 and ADA2 in cancers. We concluded that ADA1 was a poor prognostic marker in several cancers, while ADA2 was a favorable prognostic marker. The opposite prognostic value for ADA1 and ADA2 may be explained by their different correlation with immune infiltration and immune checkpoints. Thus, although the ADA isoenzymes ADA1 and ADA2 play different roles in cancer development, the functions and mechanisms for ADA1 and ADA2 need to be validated by further studies.
Data Availability Statement
The original contributions presented in the study are included in the article/Supplementary Material. Further inquiries can be directed to the corresponding author.
Ethics Statement
Ethical approval was obtained from the ethics committee of Tangdu Hospital, The Fourth Military Medical University. Written informed consent for participation was not required for this study in accordance with the national legislation and the institutional requirements.
Author Contributions
Z-wG and KD conceived and designed this study. Z-wG and LY performed the bioinformatics analyses and visualization. CL, W-tG, and XW collected the data and performed the statistical analysis. Z-wG and CL wrote the original draft. H-zZ and KD revised the manuscripts. All authors revised and approved the final manuscript.
Funding
This study was supported by the National Natural Science Foundation of China (81702732) and Scientist Fund of Tangdu Hospital (2021SHRC004).
Conflict of Interest
The authors declare that the research was conducted in the absence of any commercial or financial relationships that could be construed as a potential conflict of interest.
Publisher’s Note
All claims expressed in this article are solely those of the authors and do not necessarily represent those of their affiliated organizations, or those of the publisher, the editors and the reviewers. Any product that may be evaluated in this article, or claim that may be made by its manufacturer, is not guaranteed or endorsed by the publisher.
References
- AV Zavialov, A Engstrom. Human ADA2 Belongs to a New Family of Growth Factors With Adenosine Deaminase Activity.. Biochem J (, 2005. [DOI]
- SY Pai. Built to Last: Gene Therapy for ADA SCID.. Blood (, 2021. [DOI]
- MP Cicalese, F Ferrua, L Castagnaro, R Pajno, F Barzaghi, S Giannelli. Update on the Safety and Efficacy of Retroviral Gene Therapy for Immunodeficiency Due to Adenosine Deaminase Deficiency.. Blood (, 2016. [DOI | PubMed]
- T Utsugisawa, T Uchiyama, T Toki, K Shimojima-Yamamoto, S Ohga, E Ito. Enzymatic Changes in Red Blood Cells of Diamond-Blackfan Anemia.. Tohoku J Exp Med (, 2021. [DOI | PubMed]
- Z Wu, S Gao, N Watanabe, S Batchu, S Kajigaya, C Diamond. Single-Cell Profiling of T Lymphocytes in Deficiency of Adenosine Deaminase 2.. J Leukoc Biol (, 2022. [DOI]
- WP Schrader, B Pollara, HJ Meuwissen. Characterization of the Residual Adenosine Deaminating Activity in the Spleen of A Patient With Combined Immunodeficiency Disease and Adenosine Deaminase Deficiency.. Proc Natl Acad Sci USA (, 1978. [DOI]
- JY Yap, L Moens, MW Lin, A Kane, A Kelleher, C Toong. Intrinsic Defects in B Cell Development and Differentiation, T Cell Exhaustion and Altered Unconventional T Cell Generation Characterize Human Adenosine Deaminase Type 2 Deficiency.. J Clin Immunol (, 2021. [DOI]
- G Dell’Orso, A Grossi, F Penco, R Caorsi, E Palmisani, P Terranova. Case Report: Deficiency of Adenosine Deaminase 2 Presenting With Overlapping Features of Autoimmune Lymphoproliferative Syndrome and Bone Marrow Failure.. Front Immunol (, 2021. [DOI | PubMed]
- B Pinto, P Deo, S Sharma, A Syal, A Sharma. Expanding Spectrum of DADA2: A Review of Phenotypes, Genetics, Pathogenesis and Treatment.. Clin Rheumatol (, 2021. [DOI]
- EM Delemarre, L van Hoorn, A Bossink, J Drylewicz, SA Joosten, T Ottenhoff. Serum Biomarker Profile Including CCL1, CXCL10, VEGF, and Adenosine Deaminase Activity Distinguishes Active From Remotely Acquired Latent Tuberculosis.. Front Immunol (, 2021. [DOI | PubMed]
- R Saghiri, N Ghashghai, S Movaseghi, P Poursharifi, S Jalilfar, MA Bidhendi. Serum Adenosine Deaminase Activity in Patients With Systemic Lupus Erythematosus: A Study Based on ADA1 and ADA2 Isoenzymes Pattern.. Rheumatol Int (, 2012. [DOI]
- ZW Gao, RC Li, HP Wang, HH Ma, HZ Zhang, F Lin. Diagnostic Value of Serum Adenosine Deaminase and its Isoenzymes for Autoimmune Liver Disease.. Hepat Mon (, 2020. [DOI]
- PY Lee, GS Schulert, SW Canna, Y Huang, J Sundel, Y Li. Adenosine Deaminase 2 as a Biomarker of Macrophage Activation Syndrome in Systemic Juvenile Idiopathic Arthritis.. Ann Rheum Dis (, 2020. [DOI]
- D Vijayan, A Young, M Teng, MJ Smyth. Targeting Immunosuppressive Adenosine in Cancer.. Nat Rev Cancer (, 2017. [DOI]
- M Aghaei, F Karami-Tehrani, S Salami, M Atri. Diagnostic Value of Adenosine Deaminase Activity in Benign and Malignant Breast Tumors.. Arch Med Res (, 2010. [DOI]
- M Aghaei, F Karami-Tehrani, S Salami, M Atri. Adenosine Deaminase Activity in the Serum and Malignant Tumors of Breast Cancer: The Assessment of Isoenzyme ADA1 and ADA2 Activities.. Clin Biochem (, 2005. [DOI]
- L Wang, LM Londono, J Cowell, O Saatci, M Aras, PG Ersan. Targeting Adenosine With Adenosine Deaminase 2 to Inhibit Growth of Solid Tumors.. Cancer Res (, 2021. [DOI]
- DW Huang, BT Sherman, RA Lempicki. Systematic and Integrative Analysis of Large Gene Lists Using DAVID Bioinformatics Resources.. Nat Protoc (, 2009. [DOI | PubMed]
- C Sun, B Wang, S Hao. Adenosine-A2A Receptor Pathway in Cancer Immunotherapy.. Front Immunol (, 2022. [DOI | PubMed]
- AA Chiappori, B Creelan, T Tanvetyanon, JE Gray, EB Haura, R Thapa. Phase I Study of Taminadenant (PBF509/NIR178), an Adenosine 2A Receptor Antagonist, With or Without Spartalizumab, in Patients With Advanced Non-Small Cell Lung Cancer.. Clin Cancer Res (, 2022. [DOI]
- RC Augustin, RD Leone, A Naing, L Fong, R Bao, JJ Luke. Next Steps for Clinical Translation of Adenosine Pathway Inhibition in Cancer Immunotherapy.. J Immunother Cancer (, 2022. [DOI | PubMed]
- ZW Gao, X Wang, F Lin, K Dong. Total Adenosine Deaminase Highly Correlated With Adenosine Deaminase 2 Activity in Serum.. Ann Rheum Dis (, 2022. [DOI | PubMed]
- PY Lee, Z Huang, MS Hershfield, PA Nigrovic. Response to: ‘Total Adenosine Deaminase Highly Correlated With Adenosine Deaminase 2 Activity in Serum’ by Gao Et al.. Ann Rheum Dis (, 2022. [DOI | PubMed]
- Y Kaljas, C Liu, M Skaldin, C Wu, Q Zhou, Y Lu. Human Adenosine Deaminases ADA1 and ADA2 Bind to Different Subsets of Immune Cells.. Cell Mol Life Sci (, 2017. [DOI]
- AV Zavialov, E Gracia, N Glaichenhaus, R Franco, AV Zavialov, G Lauvau. Human Adenosine Deaminase 2 Induces Differentiation of Monocytes Into Macrophages and Stimulates Proliferation of T Helper Cells and Macrophages.. J Leukoc Biol (, 2010. [DOI]
- DB Kohn, C Booth, KL Shaw, J Xu-Bayford, E Garabedian, V Trevisan. Autologous Ex Vivo Lentiviral Gene Therapy for Adenosine Deaminase Deficiency.. N Engl J Med (, 2021. [DOI]
- Q Zhou, D Yang, AK Ombrello, AV Zavialov, C Toro, AV Zavialov. Early-Onset Stroke and Vasculopathy Associated With Mutations in ADA2.. N Engl J Med (, 2014. [DOI]
- KM Gibson, KA Morishita, P Dancey, P Moorehead, B Drogemoller, X Han. Identification of Novel Adenosine Deaminase 2 Gene Variants and Varied Clinical Phenotype in Pediatric Vasculitis.. Arthritis Rheumatol (, 2019. [DOI]
- T Zhou, W Damsky, OE Weizman, MK McGeary, KP Hartmann, CE Rosen. IL-18BP is a Secreted Immune Checkpoint and Barrier to IL-18 Immunotherapy.. Nature (, 2020. [DOI]
- D Xue, B Moon, J Liao, J Guo, Z Zou, Y Han. A Tumor-Specific Pro-IL-12 Activates Preexisting Cytotoxic T Cells to Control Established Tumors.. Sci Immunol (, 2022. [DOI]
- A Johansson, J Hamzah, CJ Payne, R Ganss. Tumor-Targeted TNFalpha Stabilizes Tumor Vessels and Enhances Active Immunotherapy.. Proc Natl Acad Sci USA (, 2012. [DOI]
- Y Nakajima, T Kanno, T Nagaya, K Kuribayashi, T Nakano, A Gotoh. Adenosine Deaminase Inhibitor EHNA Exhibits a Potent Anticancer Effect Against Malignant Pleural Mesothelioma.. Cell Physiol Biochem (, 2015. [DOI | PubMed]
- S Ortiz-Espinosa, X Morales, Y Senent, D Alignani, B Tavira, I Macaya. Complement C5a Induces the Formation of Neutrophil Extracellular Traps by Myeloid-Derived Suppressor Cells to Promote Metastasis.. Cancer Lett (, 2022. [DOI | PubMed]
- R Li, MB Mukherjee, J Lin. Coordinated Regulation of Myeloid-Derived Suppressor Cells by Cytokines and Chemokines.. Cancers (Basel) (, 2022. [DOI | PubMed]
- SG Apasov, MR Blackburn, RE Kellems, PT Smith, MV Sitkovsky. Adenosine Deaminase Deficiency Increases Thymic Apoptosis and Causes Defective T Cell Receptor Signaling.. J Clin Invest (, 2001. [DOI]
- FA Moretti, G Giardino, T Attenborough, AS Gkazi, BK Margetts, G la Marca. Metabolite and Thymocyte Development Defects in ADA-SCID Mice Receiving Enzyme Replacement Therapy.. Sci Rep (, 2021. [DOI | PubMed]
- N Lee, N Russell, K Ganeshaguru, BF Jackson, A Piga, HG Prentice. Mechanisms of Deoxyadenosine Toxicity in Human Lymphoid Cells In Vitro: Relevance to the Therapeutic Use of Inhibitors of Adenosine Deaminase.. Br J Haematol (, 1984. [DOI]