Downregulation and Hypermethylation of GABPB1 Is Associated with Aggressive Thyroid Cancer Features
Abstract
Simple Summary:
Promoter mutations of the telomerase reverse transcriptase (TERT) gene have been suggested as an oncogenic event in various cancers, including thyroid cancer (TC). GABPB1 is reported to activate TERT gene expression and has been proposed as a cancer therapeutic target. The aim of this study is to explore the fate of TC cells after disruption of GABPB1 and its role in TC. We found that besides the reported oncogenic role of GABPB1 in activating TERT, it also has tumor-suppressive functions in TC. Therefore, targeting GABPB1 for cancer therapy should be cautious since it may counteract its tumor-suppressive functions.
Abstract:
Promoter mutations of the telomerase reverse transcriptase (TERT) gene occur frequently in thyroid carcinoma (TC), including papillary (PTC) and anaplastic subtypes (ATC). Given that the ETS family transcription factors GABPA and GABPB1 activate the mutant TERT promoter and induce TERT expression for telomerase activation, GABPB1 has been proposed as a cancer therapeutic target to inhibit telomerase. Here, we sought to determine the role of GABPB1 in TC pathogenesis. In TC-derived cells carrying the mutated TERT promoter, GABPB1 knockdown led to diminished TERT expression but significantly increased invasive potentials in vitro and metastatic potential in a xenograft zebrafish model and altered expression of markers for epithelial-to-mesenchymal transition. GABPB1 expression was downregulated in aggressive TCs. Low GABPB1 expression correlated with its promoter hypermethylation, which in turn was also associated with shorter disease-free survival. Consistently, DNA methylation inhibitors enhanced GABPB1 expression, as observed upon reduced promoter methylation. Our results suggest that GABPB1 is required for TERT expression and telomerase activation, but itself serves as a tumor suppressor to inhibit TC progression. Furthermore, aberrant DNA methylation leads to GABPB1 silencing, thereby promoting TC aggressiveness. Thus, caution is needed if targeting GABPB1 for cancer therapy is considered.
Article type: Research Article
Keywords: GABPA, GABPB1, DNA methylation, telomerase, TERT, thyroid carcinoma
Affiliations: Department of Medicine, Division of Hematology, Bioclinicum J6:20 and Center for Molecular Medicine, Karolinska University Hospital Solna and Karolinska Institutet, SE-171 64 Solna, Sweden; xiaotian.yan@ki.se (X.Y.); klas.straat@gmail.com (K.S.); dawei.xu@ki.se (D.X.); Department of Oncology-Pathology, BioClinicum J6:20, Karolinska Institutet, SE-171 64 Solna, Sweden; ninni.mu@ki.se (N.M.); christofer.juhlin@ki.se (C.C.J.); shiyong.neo@ki.se (S.Y.N.); Laboratory Animal Center, Shandong Provincial Hospital Affiliated to Shandong First Medical University, Jinan 250021, China; Department of Medicine-Huddinge, Karolinska Institutet, SE-171 77 Stockholm, Sweden; na.wang@ki.se; Department of Pathology and Cancer Diagnostics, Karolinska University Hospital-Solna, SE-171 76 Stockholm, Sweden; Singapore Immunology Network, Agency for Science, Technology and Research, 8A Biomedical Grove, Singapore 138648, Singapore
License: © 2022 by the authors. CC BY 4.0 Licensee MDPI, Basel, Switzerland. This article is an open access article distributed under the terms and conditions of the Creative Commons Attribution (CC BY) license (https://creativecommons.org/licenses/by/4.0/).
Article links: DOI: 10.3390/cancers14061385 | PubMed: 35326537 | PMC: PMC8946831
Relevance: Moderate: mentioned 3+ times in text
Full text: PDF (17.8 MB)
1. Introduction
Telomerase is a ribonucleoprotein lengthening telomeric DNA sequences at the termini of human linear chromosomes, and telomerase reverse transcriptase (TERT) is a rate-limiting component of the telomerase enzyme [ref. 1,ref. 2,ref. 3,ref. 4]. In most differentiated cells, telomerase activity is absent due to the default repression of the TERT gene; however, TERT induction and telomerase activation occur widely in tumor development. The key function of TERT and telomerase is to stabilize telomere length through which transformed cells acquire an immortal phenotype [ref. 2,ref. 5]. In addition, accumulating evidence supports that TERT/telomerase exhibits oncogenic activities far beyond its telomere-lengthening action, thereby contributing to multiple hallmarks of cancer [ref. 2,ref. 3,ref. 6]. Targeting of TERT/telomerase is currently attempted for cancer therapy [ref. 7].
Multiple mechanisms have been identified to activate TERT transcription and telomerase in oncogenesis, among which the TERT promoter mutation is the most studied [ref. 2]. The mutations occur at two hotspots (−124 and −146 upstream of ATG), and both are C > T transitions, denoted C228T and C250T, respectively [ref. 8,ref. 9]. These mutations create de novo ETS binding motifs that are mainly recognized and bound by the ETS family transcription factors GABP sub-group members [ref. 10,ref. 11]. The GABP factors, including the DNA binding domain-containing GABPα (GABPA) and the trans-activation domain-bearing GABPβ (GABPB), can act as a heterodimer or heterotetramer to activate the transcription of their target genes [ref. 11,ref. 12]. While GABPA has a single isoform encoded by the GABPA gene, GABPB has several isoforms encoded by two distinct genes, either GABPB1 or GABPB2 [ref. 10,ref. 13]. GABPB1 encodes GABPB1 with four isoforms, including two long GABPB1L and two short GABPB1S members. GABPB2 encodes GABPB2, which has a single isoform [ref. 11,ref. 12]. The GABPB1 and GABPB2 isoforms are highly homologous, sharing a common N-terminus containing the ankyrin repeat (AR) domain that mediates the interaction with GABPA. Whereas GABPB1S is only functional to dimerize with GABPA, both GABPB1L and GABPB2 contain highly homologous C-terminal leucine-zipper domains that mediate formation of homodimerization or heterodimerization [ref. 12,ref. 14]. However, the GABPA-GABPB1 complex was shown to be more relevant with regulation of mutant TERT promoter or TERT expression [ref. 13,ref. 15]. More importantly, GABPB1 knockout inhibits TERT expression and telomerase activity in TERT promoter-mutated glioblastoma cells, disrupting telomere length maintenance through which apoptosis is induced [ref. 13]. Therefore, telomerase/TERT repression by inhibiting GABPB1 expression was proposed as a therapeutic strategy against cancer carrying a mutated TERT promoter [ref. 13].
TERT promoter mutations occur preferably in certain malignancies, including thyroid carcinomas (TCs) [ref. 16]. TCs are in general classified into papillary (PTC), follicular (FTC), medullary (MTC), poorly differentiated (PDTC), and anaplastic (ATC) subtypes, with PTC as the predominant subtype (>80%). We and others have previously observed that approximately 10–25% of PTCs carry TERT promoter mutations and that their presence predicts poor patient outcomes [ref. 16,ref. 17,ref. 18,ref. 19,ref. 20,ref. 21]. In addition, the activating BRAFV600E mutation occurs frequently in PTC tumors, and the coexistence of TERT promoter mutations with BRAFV600E has been shown to be over-represented in the most aggressive PTCs and also in cases with dedifferentiation to ATCs [ref. 17,ref. 18,ref. 22,ref. 23]. Mechanistically, Liu et al. demonstrated that the hyperactive BRAF-MAP kinase cascade leads to the phosphorylation and activation of the transcription factor FOS, which in turn increases the expression of GABPB1, thereby driving formation of the GABPA-GABPB1 complex to activate mutant TERT promoter for TERT expression in a panel of human cancers including TC [ref. 24]. Moreover, FOS inhibitors were recently observed to induce robust apoptosis in cancer cells harboring a mutant TERT promoter by suppressing GABPB1 and TERT expression [ref. 25].
The observations above indicate that GABPB1 may act as a key mediator linking two PTC-related oncogenic signals. However, the fate of TCs upon GABPB1 dysregulation, as well as its role in TC pathogenesis, is still unclear. Unexpectedly, the findings presented herein reveal that GABPB1 knockdown leads to more aggressive behaviors of TC cells, despite impaired TERT expression. Consistently, the downregulation of GABPB1 expression was associated with aggressive TC tumors, and low GABPB1 mRNA correlated with GABPB1 promoter hypermethylation, which was associated with shorter disease-free survival. To our knowledge, the present study is the first to identify the epigenetic control of GABPB1, highlighting how cancer-associated DNA methylation downregulates GABPB1 to decrease its tumor-suppressing functions during TC development.
2. Materials and Methods
2.1. Cell Lines and Cell Culturing
The study included three TC-derived cell lines U-hth-74, U-hth-104, and MDA-T41. Cells were cultured in RPMI-1640 medium (Thermo Fisher Scientific, Waltham, MA, USA) supplemented with 10% fetal bovine serum (FBS) (Thermo Fisher Scientific), 100 U/mL penicillin, 100 μg/mL streptomycin, and 4 mM L-glutamine. The ATC-derived U-hth-74 and U-hth-104 cell lines carry a C228T TERT promoter mutation as verified by Sanger sequencing [ref. 19], while the PTC-derived MDA-T41 carries a wild-type (WT) TERT promoter [ref. 26]. For DNA methylation inhibition, U-hth-74 and U-hth-104 cells seeded in 6-well plates were treated with 10 μM of 5-Azacytidine (5-Aza, Sigma-Aldrich, Darmstadt, Germany) for 72 h. During the 72 h of culturing, medium was changed every 24 h. Control cells were incubated with the same volume of DMSO. ATC-derived cell lines U-hth-74 and U-hth-104 were obtained from Dr. N-E Heldin and short tandem repeats (STR) genotyping was previously performed and matched to previously published genotypes [ref. 19,ref. 27]. MDA-T41 was purchased from the American Type Culture Collection (ATCC, Manassas, VA, USA). All cell experiments were repeated three times unless stated otherwise.
2.2. Patients and Tumor Specimens
Fresh frozen primary tumor specimens were obtained from the Karolinska University Hospital Biobank, including 93 cases of papillary thyroid carcinomas (PTCK) operated between 1987 and 2005 and 18 cases of anaplastic thyroid carcinomas (ATCK) operated between 1989 and 2007. Patient inclusion and exclusion criteria and sample preparation have been previously described in detail [ref. 27]. In short, tumor samples were collected after surgery according to an established procedure and kept frozen at −70 °C until use. Patients were classified according to the 2004 World Health Organization (WHO) classification of endocrine tumors, and cases diagnosed as a follicular variant of PTC (FV-PTC) were excluded from the study to avoid inclusion of non-invasive follicular thyroid neoplasms with papillary-like nuclear features (NIFTP) according to the 2017 WHO classification [ref. 28]. Cases were reviewed by an experienced pathologist (C.C.J.) to determine tumor cell representation. Clinical information was retrospectively collected for the PTCK cohort, including age at diagnosis, sex, tumor size, lymph node metastases, and distant metastasis. In addition, follow-up data on overall survival (endpoints: dead or alive) and disease-free survival (endpoints: relapsed/progression or disease-free) were registered for PTCK patients. Ethical permission was obtained from the Swedish Ethical Review Authority, and informed consent was given prior to sample collection.
2.3. The Cancer Genome Atlas (TCGA) Cohort of PTC
The clinico-pathological information, genetic, RNA expression, and methylation data for the TCGA cohort of 393 PTC (PTCTCGA) were downloaded via cBioPortal (http://www.cbioportal.org, accessed on 5 January 2021) or GDC Data Portal (https://portal.gdc.cancer.gov, accessed on 5 January 2021). In addition, expression and methylation data were downloaded for non-tumorous adjacent thyroid tissue samples from 56 cases used as normal thyroid controls (NCTCGA). mRNA abundances were expressed as RSEM (RNA-Seq by expectation maximization). DNA methylation was expressed as β values (the ratio of signal intensity between methylated and unmethylated CpGs). The thresholds of 0.2 and 0.8 (β values) were applied to define hypomethylation and hypermethylation, respectively, with the in-between values indicating intermediate levels of methylation [ref. 29,ref. 30]. For TCGA pan-cancer analysis, batch-effects normalized gene expression (log2 expression) and methylation 450 K (β value) of various CpG sites within the GABPB1 gene locus were downloaded via UCSC Xena browser (xena.ucsc.edu). Similarly, FV-PTC tumor subtypes were excluded from the thyroid cancer cohort (THCA). Methylation densities across 33 cancer types were presented in an unclustered heatmap using the “pheatmap” R package (version 1.0.12). Tukey boxplots were created with customized codes from the “ggplot” R package (version 3.3.5).
2.4. Sanger Sequencing
The BRAFV600E and hotspot TERT promoter (C228T and C250T) mutation status were analyzed by Sanger sequencing with primers listed in Table S1 in our patient cohorts and cell lines as presented in our previous study [ref. 19].
2.5. RNA Interference (RNAi) Transfection
GABPB1 or GABPA RNAis (IDT) were transfected into cells with Lipofectamine2000 (Thermo Fisher Scientific) according to the protocol provided by the manufacturer. Sequences for these RNAis are listed in Table S1.
2.6. Gene Expression by Quantitative Real-Time PCR (qPCR)
Gene expression levels of TERT, DICER1, GABPA, and GABPB1 were quantified in cell lines and tumor samples by qPCR with Taqman Gene expression assays or SYBR Green (Table S1) using QuantStudio 7 Flex Real-Time PCR System (Thermo Fisher Scientific). Gene expressions were normalized to a house-keeping gene (B2M or ACTB), and relative expressions were calculated based on ΔCT values.
2.7. Cellular Invasion Assays
A total of 50 μL of matrigel (Corning Life Sciences, Flintshire, U.K.) was first loaded to the bottom of the upper chamber, and cells (2.5 × 10⁴) were then seeded into the upper chamber. The lower chamber contained RPMI-1640 medium with 20% FBS. Cells passing through the matrigel were stained with crystal violet, photographed, and counted 48 h later.
2.8. Cell Proliferation Analyses
Proliferation of the GABPB1-depleted U-hth-74 and U-hth-104 cells was monitored and analyzed every 8 h for a total of 72 h using an IncuCyte S3 Live-Cell Analysis System (Essen Bioscience, Ann Arbor, MI, USA). The changes of phase area confluence represent cell proliferation.
2.9. Flow Cytometry
For apoptosis assays, FITC Annexin V (Biolegend, San Diego, CA, USA, 640905) was used to stain cells, and fluorescence signals were determined. To detect markers of epithelial-to-mesenchymal transition (EMT), anti-Vimentin antibody (BD Biosciences, San Diego, CA, USA, 562338) and anti-E-Cadherin antibody (Biolegend, 324114) were used. LIVE/DEAD™ Fixable Aqua Dead Cell Stain Kit (Thermo Fisher Scientific, L34965) was used to stain viable cells in both apoptosis and EMT phenotyping. All data were acquired on Novocyte Quanteon 4020 (Agilent Technologies, Santa Clara, CA, USA) and analyzed with FlowJo v10 software (BD Biosciences).
2.10. Zebrafish Husbandry and Injection Experiments
Zebrafish were housed in self-cleaning 3.5 L tanks with a density of 5 fish per liter in a centralized recirculatory aquatic system (Tecniplast, West Chester, PA, USA). Basic water parameters were continuously surveilled and automatically adjusted to a temperature of 28 °C; conductivity 1200 µS/cm, pH 7.5. Other chemical water parameters were checked minimum monthly. The lightning scheme was 14 h light/10 h dark with a 20 min dusk and dawn period. Health monitoring using sentinel fish was performed quarterly (IDEXX Bioanalytics). Zebrafish embryos were raised in E3 medium in a light-cycle incubator and staged according to Kimmel et al. [ref. 31]. All husbandry procedures followed standardized operation procedures, which are available on request.
Zebrafish AB embryos were anesthetized with 160 µg/mL tricaine (Sigma, adjusted to pH 7.2 with Na2HPO4) and placed on a flat agarose surface. U-hth-104 cells were stained with CellTracker™ CM-DiI Dye (Thermo Fisher Scientific, C7000) and suspended before loading into microcapillaries without filament (World Precision Instruments, Sarasota, FL, USA), and about 150 cancer cells were injected into the perivitelline space of 48 h postfertilization (hpf) embryos using a Femtojet 4X micropump. Successfully injected embryos were selected and placed into a 96-well imaging plate (IBIDI, 89621) in which an agarose bed had been casted using a 3D-printed orientation tool [ref. 32]. The plate was imaged using an ImageXpress Nano (Molecular Devices, Silicon Valley, CA, USA).
2.11. Pyrosequencing for DNA Methylation Analyses
Genomic DNA was extracted using QIAamp DNA Blood Mini Kit (Qiagen, Hilden, Germany) and then converted by Sodium Bisulfite using EpiTect Bisulfite Kit (Qiagen). PCR amplification was performed with GABPB1 promoter-specific primers. The PCR product was purified by binding to streptavidin-coated sepharose beads (GE Healthcare, Chicago, IL, USA), denatured, and washed. The sequencing primer was then annealed to the purified PCR fragment followed by pyrosequencing in a PyroMark Q96 (Qiagen). The primer sequences used are listed in Table S1.
2.12. Western Blot Analysis
Proteins were extracted using Pierce RIPA Buffer (Thermo Scientific) with 1% phenylmethanesulfonyl fluoride (Sigma-Aldrich) and quantified with BCA Protein Assay (Bio-Rad, Hercules, CA, USA). A total of 30 µg of proteins were separated in Mini-PROTEAN TGX Gels (Bio-Rad) and transferred to PVDF membranes using Trans-Blot Turbo Transfer Pack (Bio-Rad). Membranes were blocked with 5% non-fat milk diluted in TBST and then incubated with primary antibodies and secondary antibodies before being imaged with Clarity Max Western ECL Substrate (Bio-Rad, 1705062) and ChemiDoc MP Imaging System (Bio-Rad). Anti-GABPB1 (1:1000 dilution, Santa Cruz, sc-271571) and anti-β-Actin (1:50,000 dilution, Santa Cruz, sc-47778) were used as primary antibodies. Goat Anti-Mouse IgG (H+L)-HRP Conjugate (Bio-Rad, 170-6516) served as secondary antibody.
2.13. Statistical Analyses
All statistical analyses were performed using IBM SPSS Statistics version 24 (IBM, Armonk, NY, USA) or GraphPad Prism 8 (GraphPad Software, San Diego, CA, USA). Based on the distribution of data, Student’s t-test, Mann–Whitney U-test, Kruskal–Wallis test, and chi2-test or Fisher’s exact test were used for comparison between groups. Spearman’s rank-order correlation coefficient was applied to determine correlation coefficient r. Survival analyses were performed with log-rank test. Overall and disease-free survivals were visualized with Kaplan–Meier plots. p-values < 0.05 were considered as statistically significant.
3. Results
3.1. Reduced TERT Expression Coupled with Enhanced Invasion in GABPB1-Depleted TC Cells
Our recent study showed that GABPA knockdown leads to diminished TERT expression, whereas it facilitates the invasive phenotype in TC cells [ref. 27]. To determine if this is also the case for GABPB1, the partner of GABPA, we inhibited GABPB1 expression in U-hth-74 and U-hth-104 cells using RNA interference (RNAi) technique and, at the same time, included GABPA RNAi as an additional control to further verify the specificity of these siRNAs (Figure 1A). By downregulating GABPB1, these TC cells displayed significantly reduced TERT expression in both U-hth-74 (1.00 ± 0.01 vs. 0.28 ± 0.23 for control and GABPB1 RNAis, respectively, p = 0.006) and U-hth-104 cells (1.01 ± 0.01 vs. 0.17 ± 0.04 for control and GABPB1 RNAis, respectively, p < 0.001) (Figure 1B). However, knocking down GABPB1 did not influence the proliferation of U-hth-74 and U-hth-104 (Figure 1C,D) or apoptosis of U-hth-104 cells (Figure S1A). On the other hand, these same sets of cells exhibited a robust increase in invasive capacity, as determined using matrigel assays (Figure 1E,F). We further investigated if the metastatic potential was affected after downregulating GABPB1 in U-hth-104 cells using a zebrafish xenograft model in which engrafted tumor cells need to invade through the perivitelline space and enter the blood circulation of the organism for formation of distant metastasis. We observed that there were indeed more distant metastases with cells bearing siRNA for GABPB1 (Figure 1G,H).
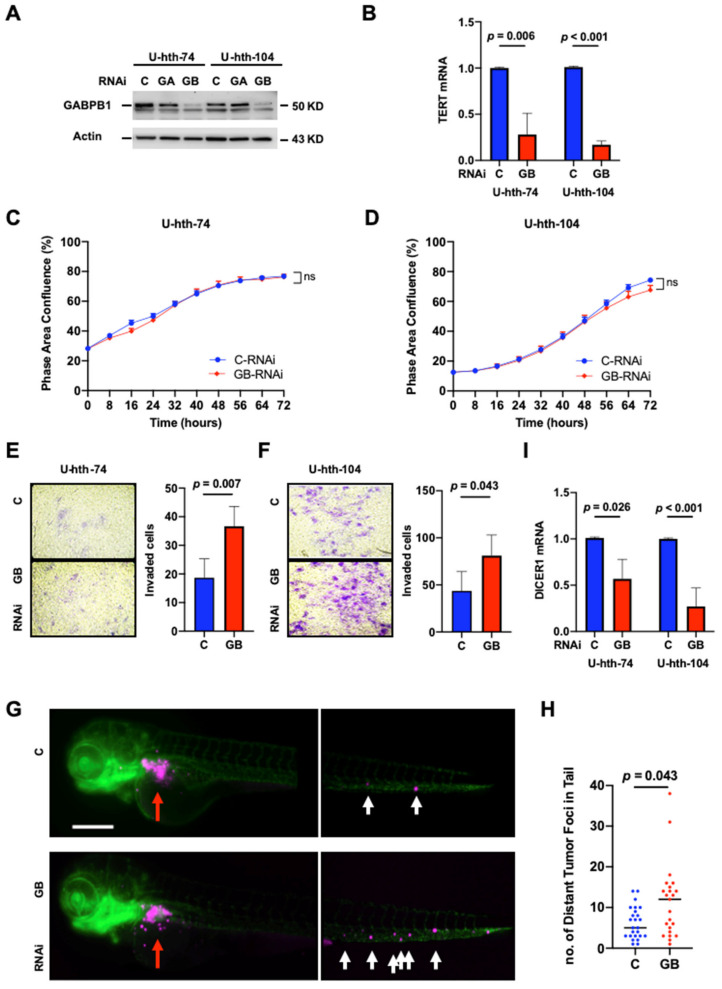
While it was previously demonstrated that GABPA inhibits the invasive phenotype of TC cells by stimulating DICER1 transcription [ref. 27,ref. 33], we further analyzed DICER1 mRNA levels in GABPB1-depleted cells. Indeed, a significant decrease in DICER1 expression occurred in GABPB1-depleted cells (U-hth-74: 1.01 ± 0.01 vs. 0.57 ± 0.21, p = 0.026; U-hth-104: 1.00 ± 0.01 vs. 0.27 ± 0.2, p < 0.001) (Figure 1I). Since the invasive phenotype might be related to the induction of EMT, we investigated the expression of vimentin and E-cadherin via flow cytometry. Since the ATC-derived U-hth-104 cells readily expressed very high levels of vimentin (Figure S2A), we used the PTC-derived MDA-T41 cell line with low basal vimentin expression for further studies. Interestingly in MDA-T41, we observed upregulation of vimentin protein expression and downregulation of E-cadherin expression upon knocking down GABPB1 (Figure S2). Similarly, in MDA-T41, knocking down of GABPB1 also resulted in increased invasion in a similar transwell assay setting (Figure S3) but no effect on apoptosis (Figure S1B). Taken together, the observed enhanced invasiveness may be explained by EMT at least partly.
Here, we demonstrated how the depletion of GABPB1 influences the invasiveness and migration of TC cells and that there is a functional similarity between GABPB1 and GABPA in altering the gene expressions of TERT and DICER1.
3.2. The Association between Low GABPB1 Expression and Aggressiveness in TC
The findings above suggest that GABPB1 is required for constitutive TERT expression, whereas it may itself suppress the invasiveness of TC cells. To investigate further, we compared the gene expression levels of GABPB1 between primary tumors from PTCK and ATCK using qPCR. The total amount of GABPB1 mRNAs (GABPB1−All; including all transcript variants by detecting the abundance of the shared region among different GABPB1 variants) was significantly lower in ATCK than in PTCK (PTCK vs. ATCK: 58.66 ± 37.64 vs. 36.08 ± 18.62, p = 0.008) (Figure 2A). Since the long variant of GABPB1 mRNA (GABPB1L) but not its shorter transcripts was observed to play a functional role in the activation of the mutated TERT promoter in glioblastoma [ref. 13], we further determined GABPB1L expression in the same tumors. Similarly, a downregulation of GABPB1L in ATCK tumors was revealed (PTCK vs. ATCK: 10.05 ± 4.0 vs. 6.54 ± 3.37, p = 0.0001) (Figure 2B).
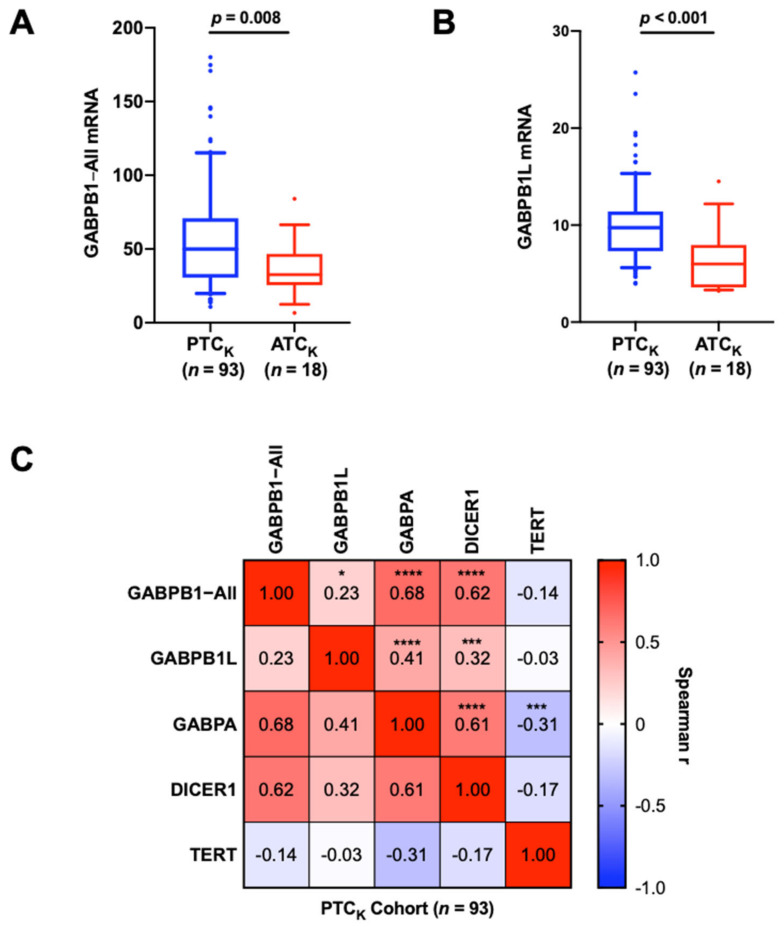
Given a tight relationship between GABPB1, GABPA, TERT, and DICER1, we sought to determine if there was any correlation between their expression levels in PTC tumors. We also analyzed the relationship between the abundances of GABPB1−All and GABPB1L transcripts. As shown in Figure 2C, the GABPB1−All and GABPB1L mRNA levels were highly correlated with each other in the PTCK cohort. In addition, GABPB1−All and GABPB1L were both correlated with GABPA and DICER1 expression levels. Similar positive correlations were found from the analysis of the PTCTCGA cohort (Figure S4A,B, Table S2). GABPB1−All and GABPA were also positively correlated in the ATCK cohort (Table S3). GABPB1 mRNA was also positively correlated with TERT mRNA expression in PTCTCGA (Figure S4C and Table S2) but not in PTCK (Table 1). Moreover, as the BRAFV600E mutation was recently shown to up-regulate GABPB1 expression [ref. 24], we further compared GABPB1 expression between BRAFwt and BRAFV600E tumors but found no significant difference in the PTCK or PTCTCGA cohorts (Table 1 and Table S2). Our clinical analysis was indicative that the loss of GABPB1 gene expression could potentially contribute to tumor progression, highlighting the need for further understanding of the regulatory mechanism underlying its gene expression.
Table 1: Clinical characteristics and statistical comparison for the 93 PTCK cases in the study.
| Parameter (n = Informative) | Observations | GABPB1−All mRNA | GABPB1L mRNA |
|---|---|---|---|
| Age at diagnosis (n = 93) | r = −0.258, p = 0.013 | r = −0.171, p = 0.101 | |
| Median (min–max) yrs | 51 (15–97) | ||
| Sex (n = 93) | p = 0.751 | p = 0.262 | |
| Female/Male | n = 67/n = 26 | ||
| Tumor size (n = 88) | r = −0.183, p = 0.089 | r = −0.109, p = 0.313 | |
| Median (min–max) cm | 2.5 (0.3–12) | ||
| Lymph node metastasis (n = 93) | p = 0.114 | p = 0.627 | |
| Yes | n = 49 | ||
| No | n = 44 | ||
| Distant metastasis (n = 93) | p = 0.176 | p = 0.973 | |
| Yes | n = 12 | ||
| No | n = 81 | ||
| BRAF V600E (n = 93) | p = 0.119 | p = 0.454 | |
| Mutation | n = 70 | ||
| Wild-type | n = 23 | ||
| TERT promoter mutation (n = 93) | p = 0.007 | p = 0.154 | |
| Mutation | n = 29 | ||
| C228T/C250T | n = 24/n = 5 | ||
| Wild-type | n = 64 | ||
| TERT mRNA (n = 93) | r = −0.137, p = 0.191 | r = −0.024, p = 0.818 | |
| Median (min–max) | 0.01 (0.00–12.3) | ||
| GABPA mRNA (n = 93) | r = 0.676, p < 0.001 | r = 0.410, p < 0.001 | |
| Median (min–max) | 6.8 (0.2–15.9) | ||
| DICER1 mRNA (n = 93) | r = 0.624, p < 0.001 | r = 0.321, p = 0.002 | |
| Median (min–max) | 19.8 (1.3–124.6) | ||
| Overall survival (n = 93) | * HR = 0.998, p = 0.674 | * HR = 0.930, p = 0.191 | |
| Dead | n = 32 | 95% CI = 0.998–1.008 | 95% CI = 0.835–1.037 |
| Alive | n = 61 | ||
| Follow-up: median (min–max) yrs | 14.8 (0.2–26.5) | ||
| Disease-free survival (n = 93) | * HR = 0.994, p = 0.314 | * HR = 0.952, p = 0.391 | |
| Relapsed/progression | n = 26 | 95% CI = 0.982–1.006 | 95% CI = 0.850–1.066 |
| No evidence of disease | n = 67 | ||
| Follow-up: median (min–max) yrs | 13.5 (0.1–26.5) |
Mann–Whitney U-test was used for comparison between groups. Spearman’s rank-order correlation r was used for correlation. Univariate Cox regression was used for survival analyses. * HR for GABPB1−All/GABPB1L mRNA expression as a continuous variable. Abbreviations: GABPB1−All = total amount of GABPB1 mRNAs, including all transcript variants of GABPB1; GABPB1L = long variant of GABPB1 mRNA.n = number; yrs = years; HR = hazard ratio; 95% CI = 95% confidence interval.
3.3. The Methylation Landscape of the GABPB1 Locus across TCGA Pan-Cancer
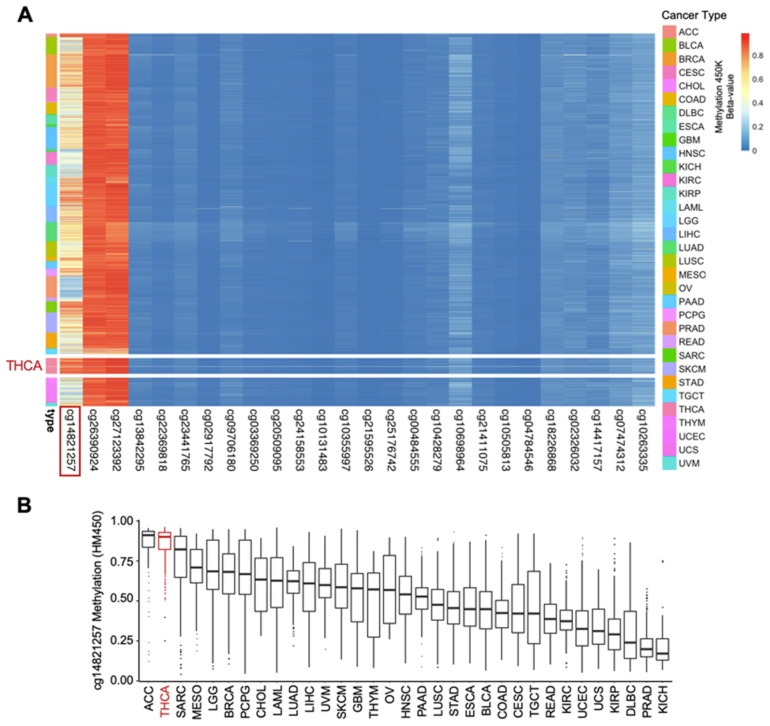
One of the potential mechanisms underlying reduced GABPB1 expression in aggressive TCs could be epigenetic regulation. Using a pan-cancer approach, the DNA methylation landscape of the GABPB1 locus was characterized in TCGA data sets. Across 33 cancer types, three major CpG sites were frequently hypermethylated, but only the cg14821257 site displayed high variability across different cancer types (Figure 3A). Among the 33 cancer types, the top three ranked cancers based on the median of β values of cg14821257 were ACC (adrenocortical carcinoma), THCA (thyroid cancer), and SARC (sarcoma), respectively (Figure 3B). By looking at the average β value across all CpG sites of GABPB1, THCA is ranked second following LUAD (lung adenocarcinoma) (Figure S5A). With a rank of 28th out of 33 cancer types, THCA is one of the cancer cohorts with the lowest GABPB1 mRNA expression (Figure S5B). Based on our pan-cancer analysis, the hypermethylation of cg14821257 of the GABPB1 gene may have a unique functional role to be further uncovered within thyroid cancer.
3.4. Hypermethylation of GABPB1 Promoter Resulted in GABPB1 Downregulation and Was Associated with Shorter Disease-Free Survival
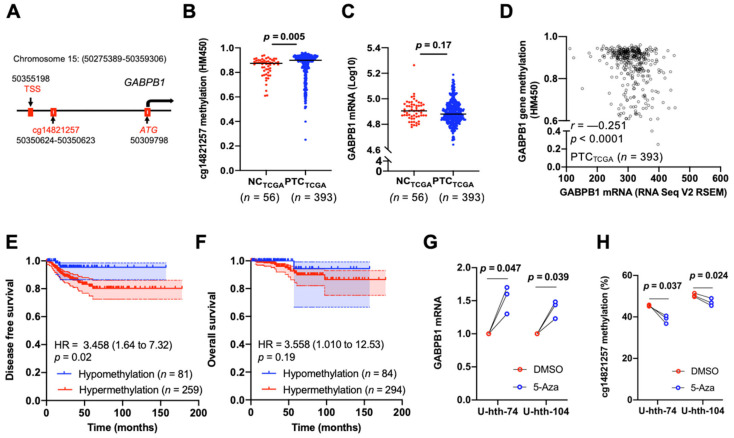
With the observed hypermethylation of GABPB1 in PTC from our TCGA pan-cancer analysis, we then investigated the effects of GABPB1 hypermethylation within PTC. Comparing non-cancerous thyroid tissues and tumors, only cg14821257, a CpG site within the GABPB1 promoter, was significantly hypermethylated in tumors (Figure S6 and Figure 4A,B). We further compared the GABPB1 mRNA expression levels between PTCTCGA and NCTCGA, but we did not observe a difference between the two groups (Figure 4C). However, a significant inverse correlation between GABPB1 gene methylation and its mRNA level was observed (r = −0.251, p < 0.0001) (Figure 4D). We also determined the correlation between GABPB1 expression and various CpG sites. cg14821257 was found most significantly correlated with GABPB1 expression (Table S4). Furthermore, patients with hypermethylated GABPB1 promoter at cg14821257 showed significantly shorter disease-free survival (Figure 4E and Table S5) but not overall survival (Figure 4F and Table S5) using a β value cut-off at 0.8. We then sought to directly address the relationship between DNA methylation and GABPB1 expression. U-hth-74 and U-hth-104 cells were treated with the DNA methylation inhibitor 5-Aza, and the methylation density of cg14821257 and GABPB1 expression were then determined. As shown in Figure 4G,H, 5-Aza treatment led to a significant upregulation of GABPB1 expression coupled with diminished methylation of cg14821257 in U-hth-74 and U-hth-104 cells as compared with those in control cells incubated with DMSO. Collectively, these data suggested that the increased DNA methylation density exerts its effect on the downregulation of GABPB1.
3.5. Association of GABPB1 Expression with Clinico-Pathological Variables in TC Tumors
Finally, the relationship between GABPB1 expression and clinical variables in the PTCK, ATCK, and PTCTCGA cohorts was explored. The levels of GABPB1−All mRNA were inversely correlated with patient age in PTCK (r = −0.258, p = 0.013) (Table 1), and similarly, GABPB1 mRNA expression was inversely correlated with patient age in PTCTCGA (Table S2). No associations were observed between GABPB1−All/GABPB1 mRNA expression and metastasis and survival in the PTCK, ATCK, and PTCTCGA cohort, respectively (Table 1, Tables S2 and S3). None of the above variables was correlated with GABPB1L mRNA expression (Table 1 and Table S3).
4. Discussion
The TERT promoter mutation, a novel mechanism for telomerase activation, occurs frequently in TCs, including PTCs and ATCs [ref. 16]. GABPA and GABPB1 have been shown to play a pivotal role in the activation of mutated TERT promoters [ref. 10,ref. 11]. More importantly, the oncogenic BRAFV600E up-regulates GABPB1 expression, amplifying the effect on TERT transcription [ref. 24]. Consistently, the co-occurrence of both TERT promoter mutations and BRAFV600E is related to PTCs with the poorest clinical outcomes [ref. 17]. However, to our surprise, the present findings show that GABPB1 knockdown reduces TERT expression while enhancing the invasiveness of TC cells and metastatic potential in a xenograft zebrafish model.
We have recently demonstrated that inhibition of GABPA, the interacting partner of GABPB1, similarly facilitates cellular invasion in TCs [ref. 27]. GABPA over-expression inhibits in vivo metastasis in xenograft murine models, while the lower expression of GABPA is associated with aggressive disease and poor outcomes in PTC patients [ref. 27]. Mechanistically, GABPA stimulates the transcription of its target gene, DICER1, through which metastasis is suppressed [ref. 27,ref. 33]. In the same PTCK and PTCTCGA cohort of tumors, GABPB1 and DICER1 expression were also highly correlated, suggesting a mechanistic link between GABPA and GABPB1 in the regulation of invasive phenotypes. We also demonstrated that the invasive phenotype might be caused by the induction of EMT. Upregulation of vimentin protein expression and downregulation of E-cadherin expression were observed upon knocking down GABPB1.
GABPB1, encoded by a single gene at chromosome 15q21, exists in four isoforms, including two long (GABPB1L) and two short (GABPB1S) members [ref. 11]. Mancini et al. showed that the expression of GABPB1L rather than GABPB1S was positively correlated to TERT mRNA levels in primary glioblastoma tumors and that GABPB1L was responsible for the activation of the mutated TERT promoter [ref. 13]. It is known that GABPB1L harbors highly homologous C-terminal leucine-zipper domains (LZD), mediating its homodimerization or heterodimerization, while GABPB1S does not [ref. 11]. Moreover, to activate target genes, GABPB1 needs to form the complex with its partner GABPA, and the heterotetramerization of two GABPA-GABPB1 complexes via LZD is the superb form for transcriptional activities [ref. 11]. These structural differences between GABPB1L and GABPB1S provide a putative explanation for the observations in glioblastomas mentioned above. In the present study, however, we did not see any associations of TERT expression with either GABPB1L or the GABPB1−All expression in PTCK tumors, although knocking down GABPB1 led to diminished TERT expression in TC cell lines harboring TERT promoter mutation. Intriguingly, we observed an inverse correlation between GABPA and TERT expression in this same cohort of PTCs, although GABPA is required for activation of the mutated TERT promoter. In contrast, the expression of DICER1, the target gene of GABPA, is significantly correlated with both GABPB1L and GABPB1−All. It is thus conceivable that the relationship between GABPA or GABPB1 and TERT is more complicated, and further studies are required to address this issue.
The underlying mechanism in which GABPB1 is involved in suppressing tumor progression remains elusive and seems to be independent of BRAFV600E mutation. It was previously shown that the BRAFV600E mutation could enhance the expression of GABPB1 [ref. 24], but we did not see a significant association of GABPB1 gene expression and BRAFV600E within our clinical analyses of PTCK and PTCTCGA, which was further supported by two other recent studies [ref. 34,ref. 35]. Instead, the hypermethylation of the GABPB1 promoter was inversely correlated with its expression independently of the presence of BRAFV600E, which indicated an epigenetic control of the GABPB1 regulation. Consistently, inhibiting DNA methylation indeed up-regulated GABPB1 expression coupled with the reduced GABPB1 promoter methylation in TC cells. The aberrant DNA methylation is a common mechanism to silence tumor suppressor genes, and here we observed that hypermethylation of GABPB1 promoter is prognostic for shorter disease-free survival besides an inhibitory effect of GABPB1 on TC cell invasion. As shown previously, the DNA hypermethylation similarly occurs in the GABPA promoter, which leads to the diminished GABPA expression, thereby attenuating its tumor suppressor function [ref. 36].
Given all the oncogenic effects of TERT, GABPB1 and GABPA-mediated TERT upregulation is expected to promote cancer progression. However, paradoxically, either GABPB1 or GABPA knockdown contributes to aggressive disease, despite reduced TERT expression. Evidently, the loss of GABPB1 or GABPA is a more potent cancer-driving force that compensates for the lack of TERT upregulation. However, Liu et al. observed that FOS inhibitor-mediated reduction in GABPB1 and TERT expression induced widespread apoptosis of TC and other cancer cells due to the downregulation of survivin expression, and they further identified TERT as a direct activator for the survivin gene transcription [ref. 25]. In contrast, we directly knocked down GABPB1 in TC cells but observed no difference in proliferation and apoptosis despite the diminished TERT expression. The contrasting results could be caused by the different cell lines, which calls for further investigations. Moreover, the present study highlighted that the tumor-suppressive functions of GABPB1 may be independent of the TERT promoter since we found a similar enhanced invasive ability after inhibition of GABPB1 in TC cells regardless of their TERT promoter mutation status.
5. Conclusions
The present findings demonstrate that GABPB1 activates TERT expression on one hand, while it inhibits invasion and progression of TC on the other, which is very similar to its partner GABPA. Likely, GABPB1 has a tumor-suppressive function in the TC pathogenesis to counteract the development of aggressive diseases. Therefore, targeting GABPB1 for anti-telomerase cancer therapy may counteract its tumor-suppressive activity, thereby promoting TC progression, which should be considered in the rational development of telomerase-based strategies against cancer.
References
- J.W. Shay, W.E. Wright. Telomeres and telomerase, Three decades of progress. Nat. Rev. Genet., 2019. [DOI | PubMed]
- X. Yuan, C. Larsson, D. Xu. Mechanisms underlying the activation of TERT transcription and telomerase activity in human cancer, Old actors and new players. Oncogene, 2019. [DOI | PubMed]
- M.A. Jafri, S.A. Ansari, M.H. Alqahtani, J.W. Shay. Roles of telomeres and telomerase in cancer, and advances in telomerase-targeted therapies. Genome Med., 2016. [DOI | PubMed]
- J.C. Schmidt, T.R. Cech. Human telomerase, Biogenesis, trafficking, recruitment, and activation. Genes Dev., 2015. [DOI | PubMed]
- D. Hanahan, R.A. Weinberg. Hallmarks of cancer, The next generation. Cell, 2011. [DOI | PubMed]
- B. Bernardes de Jesus, M.A. Blasco. Telomerase at the intersection of cancer and aging. Trends Genet., 2013. [DOI | PubMed]
- X. Chen, W.J. Tang, J.B. Shi, M.M. Liu, X.H. Liu. Therapeutic strategies for targeting telomerase in cancer. Med. Res. Rev., 2020. [DOI | PubMed]
- F.W. Huang, E. Hodis, M.J. Xu, G.V. Kryukov, L. Chin, L.A. Garraway. Highly recurrent TERT promoter mutations in human melanoma. Science, 2013. [DOI | PubMed]
- S. Horn, A. Figl, P.S. Rachakonda, C. Fischer, A. Sucker, A. Gast, S. Kadel, I. Moll, E. Nagore, K. Hemminki. TERT promoter mutations in familial and sporadic melanoma. Science, 2013. [DOI | PubMed]
- R.J.A. Bell, H.T. Rube, A. Kreig, A. Mancini, S.D. Fouse, R.P. Nagarajan, S. Choi, C. Hong, D. He, M. Pekmezci. The transcription factor GABP selectively binds and activates the mutant TERT promoter in cancer. Science, 2015. [DOI | PubMed]
- X. Yuan, M. Dai, D. Xu. TERT promoter mutations and GABP transcription factors in carcinogenesis, More foes than friends. Cancer Lett., 2020. [DOI | PubMed]
- A.G. Rosmarin, K.K. Resendes, Z.F. Yang, J.N. McMillan, S.L. Fleming. GA-binding protein transcription factor, A review of GABP as an integrator of intracellular signaling and protein-protein interactions. Blood Cells Mol. Dis., 2004. [DOI | PubMed]
- A. Mancini, A. Xavier-Magalhaes, W.S. Woods, K.T. Nguyen, A.M. Amen, J.L. Hayes, C. Fellmann, M. Gapinske, A.M. McKinney, C. Hong. Disruption of the beta1L Isoform of GABP Reverses Glioblastoma Replicative Immortality in a TERT Promoter Mutation-Dependent Manner. Cancer Cell, 2018. [DOI | PubMed]
- S. Yu, X. Jing, J.D. Colgan, D.M. Zhao, H.H. Xue. Targeting tetramer-forming GABPβ isoforms impairs self-renewal of hematopoietic and leukemic stem cells. Cell Stem Cell, 2012. [DOI | PubMed]
- J.L. Stern, D. Theodorescu, B. Vogelstein, N. Papadopoulos, T.R. Cech. Mutation of the TERT promoter, switch to active chromatin, and monoallelic TERT expression in multiple cancers. Genes Dev., 2015. [DOI | PubMed]
- X. Yuan, T. Liu, D. Xu. Telomerase reverse transcriptase promoter mutations in thyroid carcinomas, Implications in precision oncology-a narrative review. Ann. Transl. Med., 2020. [DOI | PubMed]
- M. Xing, R. Liu, X. Liu, A.K. Murugan, G. Zhu, M.A. Zeiger, S. Pai, J. Bishop. BRAF V600E and TERT promoter mutations cooperatively identify the most aggressive papillary thyroid cancer with highest recurrence. J. Clin. Oncol., 2014. [DOI | PubMed]
- M. Melo, A.G. da Rocha, J. Vinagre, M. Sobrinho-Simoes, P. Soares. Coexistence of TERT promoter and BRAF mutations in papillary thyroid carcinoma, Added value in patient prognosis?. J. Clin. Oncol., 2015. [DOI | PubMed]
- T. Liu, N. Wang, J. Cao, A. Sofiadis, A. Dinets, J. Zedenius, C. Larsson, D. Xu. The age- and shorter telomere-dependent TERT promoter mutation in follicular thyroid cell-derived carcinomas. Oncogene, 2014. [DOI | PubMed]
- I. Landa, I. Ganly, T.A. Chan, N. Mitsutake, M. Matsuse, T. Ibrahimpasic, R.A. Ghossein, J.A. Fagin. Frequent somatic TERT promoter mutations in thyroid cancer, Higher prevalence in advanced forms of the disease. J. Clin. Endocrinol. Metab., 2013. [DOI | PubMed]
- R. Liu, M. Xing. TERT promoter mutations in thyroid cancer. Endocr. Relat. Cancer, 2016. [DOI | PubMed]
- B. Xu, T. Fuchs, S. Dogan, I. Landa, N. Katabi, J.A. Fagin, R.M. Tuttle, E. Sherman, A.J. Gill, R. Ghossein. Dissecting Anaplastic Thyroid Carcinoma, A Comprehensive Clinical, Histologic, Immunophenotypic, and Molecular Study of 360 Cases. Thyroid, 2020. [DOI | PubMed]
- T. Liu, J. Wang, Y. Xiu, Y. Wu, D. Xu. DNA Methylation Age Drift Is Associated with Poor Outcomes and De-Differentiation in Papillary and Follicular Thyroid Carcinomas. Cancers, 2021. [DOI | PubMed]
- R. Liu, T. Zhang, G. Zhu, M. Xing. Regulation of mutant TERT by BRAF V600E/MAP kinase pathway through FOS/GABP in human cancer. Nat. Commun., 2018. [DOI | PubMed]
- R. Liu, J. Tan, X. Shen, K. Jiang, C. Wang, G. Zhu, M. Xing. Therapeutic targeting of FOS in mutant TERT cancers through removing TERT suppression of apoptosis via regulating survivin and TRAIL-R2. Proc. Natl. Acad. Sci. USA, 2021. [DOI | PubMed]
- Y.C. Henderson, S.H. Ahn, J. Ryu, Y. Chen, M.D. Williams, A.K. El-Naggar, M. Gagea, R.E. Schweppe, B.R. Haugen, S.Y. Lai. Development and characterization of six new human papillary thyroid carcinoma cell lines. J. Clin. Endocrinol. Metab., 2015. [DOI | PubMed]
- X. Yuan, N. Mu, N. Wang, K. Straat, A. Sofiadis, Y. Guo, A. Stenman, K. Li, G. Cheng, L. Zhang. GABPA inhibits invasion/metastasis in papillary thyroid carcinoma by regulating DICER1 expression. Oncogene, 2019. [DOI | PubMed]
- R.V. Lloyd. WHO Classification of Tumours of Endocrine Organs. WHO Classification of Tumours, 2017
- P. Du, X. Zhang, C.C. Huang, N. Jafari, W.A. Kibbe, L. Hou, S.M. Lin. Comparison of Beta-value and M-value methods for quantifying methylation levels by microarray analysis. BMC Bioinform., 2010. [DOI | PubMed]
- X. Ma, Y.W. Wang, M.Q. Zhang, A.F. Gazdar. DNA methylation data analysis and its application to cancer research. Epigenomics, 2013. [DOI | PubMed]
- C.B. Kimmel, W.W. Ballard, S.R. Kimmel, B. Ullmann, T.F. Schilling. Stages of embryonic development of the zebrafish. Dev Dyn, 1995. [DOI | PubMed]
- J.N. Wittbrodt, U. Liebel, J. Gehrig. Generation of orientation tools for automated zebrafish screening assays using desktop 3D printing. BMC Biotechnol., 2014. [DOI | PubMed]
- J.O. Paulsson, N. Wang, J. Gao, A. Stenman, J. Zedenius, N. Mu, W.O. Lui, C. Larsson, C.C. Juhlin. GABPA-dependent down-regulation of DICER1 in follicular thyroid tumours. Endocr. Relat. Cancer, 2020. [DOI | PubMed]
- Y.S. Song, S.K. Yoo, H.H. Kim, G. Jung, A.R. Oh, J.Y. Cha, S.J. Kim, S.W. Cho, K.E. Lee, J.S. Seo. Interaction of BRAF-induced ETS factors with mutant TERT promoter in papillary thyroid cancer. Endocr Relat Cancer, 2019. [DOI | PubMed]
- M. Bullock, G. Lim, Y. Zhu, H. Åberg, S. Kurdyukov, R. Clifton-Bligh. ETS Factor ETV5 Activates the Mutant Telomerase Reverse Transcriptase Promoter in Thyroid Cancer. Thyroid, 2019. [DOI | PubMed]
- Y. Guo, X. Yuan, K. Li, M. Dai, L. Zhang, Y. Wu, C. Sun, Y. Chen, G. Cheng, C. Liu. GABPA is a master regulator of luminal identity and restrains aggressive diseases in bladder cancer. Cell Death Differ., 2020. [DOI | PubMed]