
YBX1 Expression Marks Proliferative Tumour States with Context-Dependent Genomic Instability: A Pan-Cancer Analysis
Abstract
Y-box binding protein 1 (YB-1; encoded by YBX1) is a multifunctional DNA- and RNA-binding protein implicated in cell cycle regulation, DNA repair, stress adaptation, and therapy resistance. Elevated YBX1 expression has been associated with aggressive disease across multiple cancer types; however, its pan-cancer genomic and clinical correlates, and the extent to which these reflect proliferative activity versus genomic instability, remain incompletely defined. Here, we performed an integrative pan-cancer analysis across 53 independent datasets spanning 33 tumour types, incorporating transcriptomic (YBX1 mRNA), proteomic (RPPA), genomic, and clinical data. We found that YBX1 is rarely altered at the genomic level, whereas its mRNA expression is highly variable within tumour cohorts. Tumours with high YBX1 mRNA expression consistently exhibited conserved transcriptional programmes enriched for cell cycle, mitotic, RNA processing, and signalling pathways, patterns that were also reflected at the protein level by concordant pathway associations with elevated YB-1 abundance. These molecular features co-occurred with clinicopathological characteristics indicative of aggressive disease. High YBX1 mRNA expression was associated with increased mutation burden, chromosomal alteration burden, hypoxia, and homologous recombination deficiency at the pan-cancer level, with similar molecular associations observed in tumours stratified by elevated YB-1 protein levels. The association between YBX1 expression and chromosomal alteration burden was largely attenuated after accounting for proliferative activity, particularly G2/M-associated transcriptional programmes used as a proxy for mitotic activity. While the relationship with mutation burden was heterogeneous across tumour types, this pattern suggests that links between YBX1 expression and chromosomal instability primarily reflect shared proliferative and mitotic tumour biology rather than an independent genomic instability programme. Clinically, high YBX1 mRNA expression was associated with advanced disease stage, higher histologic grade, reduced progression-free survival, and poorer overall survival. Elevated YB-1 protein levels were also associated with advanced disease stage and poorer survival outcomes and demonstrated a similar, although non-significant, directional trend with histologic grade. Collectively, these findings demonstrate that elevated YBX1 expression marks proliferative and clinically aggressive tumour states within which genomic instability-related features arise in a context-dependent manner, providing a clarified pan-cancer framework for interpreting YB-1-associated tumour biology.
Article type: Research Article
Keywords: YBX1, YB-1, pan-cancer, genomic instability, chromosomal instability
Affiliations: Department of Pathology and Molecular Medicine, University of Otago, Dunedin 9016, New Zealand; wanse679@student.otago.ac.nz (S.W.); zahra.shafaei@otago.ac.nz (Z.S.P.); debina.sarkar@otago.ac.nz (D.S.); bhaap437@student.otago.ac.nz (A.A.B.); aaron.jeffs@otago.ac.nz (A.J.); glen.reid@otago.ac.nz (G.R.); antony.braithwaite@otago.ac.nz (A.B.); Maurice Wilkins Centre for Biodiscovery, University of Auckland, Auckland 1142, New Zealand; mak.sarwar@otago.ac.nz; Department of Obstetrics and Gynaecology, University of Otago, Christchurch 8011, New Zealand; School of Pharmacy and Biomedical Sciences, The University of Waikato Te Whare Wananga o Waikato, Hamilton 3240, New Zealand
License: © 2026 by the authors. CC BY 4.0 Licensee MDPI, Basel, Switzerland. This article is an open access article distributed under the terms and conditions of the Creative Commons Attribution (CC BY) license.
Article links: DOI: 10.3390/ijms27104340 | PMC: PMC13207732
Relevance: Moderate: mentioned 3+ times in text
Full text: PDF (2.3 MB)
1. Introduction
The Y-box binding protein 1 (YB-1; encoded by the YBX1 gene) is a cold-shock, multifunctional DNA and RNA binding protein that regulates transcription, mRNA splicing, translation, and cellular stress responses (reviewed in [ref. 1,ref. 2,ref. 3,ref. 4]). YB-1 has been implicated in numerous oncogenic processes across multiple cancer types, including regulation of cell cycle progression from the G1/S transition through mitosis and cytokinesis [ref. 5,ref. 6,ref. 7,ref. 8,ref. 9,ref. 10,ref. 11,ref. 12,ref. 13,ref. 14]. It also plays a critical role in DNA damage repair, including mismatch repair and double-strand break repair, thereby enabling tolerance to replication stress [ref. 15,ref. 16,ref. 17,ref. 18,ref. 19].
In the context of epithelial–mesenchymal transition (EMT), YB-1 acts downstream of Twist to promote the expression of EMT markers such as Snail and vimentin [ref. 7,ref. 20,ref. 21,ref. 22,ref. 23]. In addition, YB-1 regulates mRNA splicing of key genes, including CD44, which promotes EMT-associated plasticity and invasion, and KLF5, which reinforces EMT-associated transcriptional programmes [ref. 24,ref. 25]. Effects on EMT are mediated in part through translational activation of HIF1α, a key regulator of hypoxic responses [ref. 26], modulation of IL-6 expression [ref. 27], and targeting of the intrinsic PD-1/PD-L1 pathway [ref. 28].
Furthermore, YB-1 contributes to therapeutic resistance through transcriptional regulation of multi-drug resistance transporters-1 (MDR-1) such as ABCB1 [ref. 29,ref. 30,ref. 31], activation of the MDM2/p53 axis [ref. 32,ref. 33], suppression of EGR1 expression [ref. 34], and activation of AKT signalling [ref. 35]. Clinically, elevated YB-1 expression and aberrant subcellular localization are consistently associated with aggressive disease and poor prognosis across a broad spectrum of malignancies [ref. 1,ref. 2,ref. 13,ref. 31], underscoring its central role in cancer biology.
A central conceptual question emerging from these observations is how a single gene such as YBX1 can be implicated in such a broad spectrum of oncogenic phenotypes. Rather than independently driving each process, YB-1 may perturb one or more fundamental cellular programmes. In a context-dependent manner, these perturbations could result in diverse downstream consequences shaped by tumour lineage, microenvironmental stress, and co-occurring genetic alterations.
A potential explanation for these diverse phenotypic associations is that YBX1 may be associated with fundamental cellular programmes linked to genomic instability-related phenotypes. Genomic instability encompasses both chromosomal alterations and the accumulation of somatic mutations, processes that can promote tumour evolution, phenotypic plasticity, metastatic competence, immune evasion, and therapeutic resistance (reviewed in [ref. 36,ref. 37,ref. 38,ref. 39,ref. 40]). These features arise through multiple mechanisms, including defects in DNA damage repair, replication stress, chromosome segregation, and cell cycle checkpoint control, and are often facilitated by loss of key tumour suppressors such as TP53 [ref. 36,ref. 41]. Importantly, these processes may not be uniformly regulated across tumour types, reflecting the diverse biological contexts in which genomic instability emerges.
Genomic instability is closely intertwined with tumour hypoxia, a common feature of advanced tumours, with hypoxic stress both driving and resulting from genome destabilisation, thereby promoting the selection of aggressive tumour clones [ref. 38]. Although YB-1 has been experimentally linked to cell cycle defects, DNA damage responses, replication stress, and hypoxia-associated signalling [ref. 42], it remains unclear whether these processes converge to define a conserved YB-1-associated tumour state across cancers.
Recent studies have begun to examine YBX1 in a pan-cancer context. The YBX gene family comprises three closely related Y-box-binding proteins, YBX1, YBX2, and YBX3, which share a conserved cold shock domain but exhibit distinct expression patterns and biological functions. Pan-cancer analyses of the YBX gene family have demonstrated widespread overexpression of YBX1 across tumour types, along with associations with oncogenic signalling pathways, immune microenvironment features, and adverse clinical outcomes [ref. 43]. Additional large-scale survival analyses have confirmed that high-YBX1 expression is associated with poor overall survival across multiple solid tumours, while other bioinformatic studies have linked YBX1 expression to immune infiltration and metabolic pathway activity in selected cancers [ref. 44,ref. 45]. Collectively, these studies establish YBX1 as a pan-cancer-relevant gene with prognostic significance.
However, to date, existing analyses have largely focused on differential expression and outcome correlations, leaving fundamental questions unresolved. It remains unclear whether YBX1 is commonly altered at the genomic level or whether its oncogenic relevance is primarily driven by changes in gene dosage and expression. Moreover, despite extensive experimental evidence linking YB-1 to diverse cellular processes, it remains unclear whether elevated YB-1 expression reflects a conserved transcriptional programme across cancers, how it relates to genomic features including chromosomal alterations and mutation burden, and whether it marks clinically aggressive tumour states, either independently or in combination. The relationship between these states and genomic features, including chromosomal alterations and mutation burden, also remains unresolved.
In this study, we performed a comprehensive pan-cancer analysis across 53 independent cancer datasets using processed RNA-sequencing gene expression and matched somatic mutation data downloaded from cBioPortal [ref. 46,ref. 47,ref. 48]. We assessed the extent to which YBX1 is altered at the genomic level across cancers and evaluated whether its oncogenic relevance is primarily driven by expression. We further examined whether elevated YBX1 expression is associated with a conserved transcriptional programme across tumour types and investigated its relationship with genomic features, including mutation and chromosomal alteration burden. Given the intrinsic link between chromosomal alterations and cell division, we also evaluated the extent to which these associations are explained by proliferative activity and assessed their consistency across tumour types. Finally, the clinical relevance of YBX1 expression was examined in relation to tumour stage, grade, hypoxia, and patient outcomes. In parallel, we assessed whether YB-1 protein abundance across 31 TCGA tumour types is similarly associated with genomic features, tumour hypoxia, and clinical parameters. Together, these analyses provide a comprehensive framework to define the molecular and clinical context of YBX1 expression across human cancers.
2. Results
2.1. Somatic Alteration and Expression Patterns of YBX1 in Pan-Cancer Datasets
Oncogenes are frequently driven by changes in copy number or mutations [ref. 22]. Therefore, we sought to determine whether YBX1 follows a similar pattern across cancers. Analysis of multiple somatic pan-cancer datasets, including the TCGA, CPTAC, and BCGSC, encompassing over 12,000 samples across 33 tumour types from 53 studies, revealed that YBX1 is largely unaltered, with amplifications occurring in only ~0.5–8% of cases and mutations in less than ~4% overall (Figure 1A–C and Figure S1).
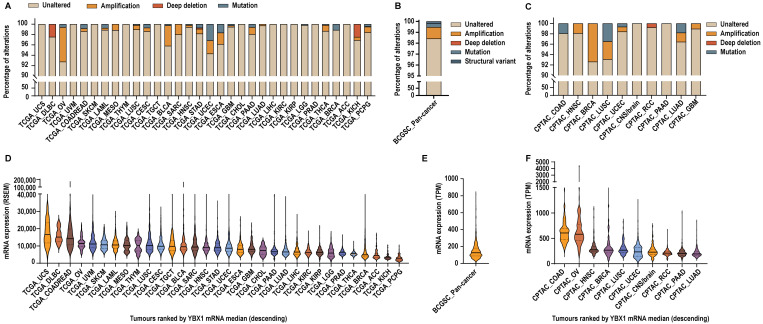
A few tumour types exhibited slightly higher rates of alteration. In TCGA cohorts, YBX1 was amplified in 6.65% of ovarian cancers (TCGA_OV), 3.93% of bladder cancers (TCGA_BLCA), 2.54% of endometrial cancers (TCGA_UCEC), and 2.2% of oesophageal cancers (TCGA_ESCA). Corresponding mutation frequencies were 3.13% in TCGA_UCEC and 1.65% in TCGA_ESCA cohorts. In CPTAC cohorts, amplification of YBX1 was observed in 7.37% of breast cancers (CPTAC_BRCA), whereas no amplifications were reported in the corresponding TCGA_BRCA dataset. Additionally, ~3% of CPTAC_LUSC tumours harboured YBX1 amplifications and another ~3% contained YBX1 mutations, compared with less than 1% of altered cases in the TCGA_LUSC cohort. Despite these dataset- and tumour-specific differences, direct genetic alterations in YBX1 are rare overall.
In contrast, pan-cancer transcriptomic analyses demonstrated that YBX1 mRNA is broadly expressed across all tumour types but exhibits substantial inter-tumour heterogeneity within cohorts. To quantify this variability, we calculated the expression range within each dataset, defined as the ratio of the maximum to the minimum YBX1 mRNA expression observed across tumours in that cohort. Across individual cancer types within the TCGA pan-cancer cohorts, YBX1 mRNA expression ranges from 2.5-fold to 135-fold, with a median within-cohort expression range of 10.63-fold. The BCGSC pan-cancer cohort exhibited an expression range of 173-fold, while CPTAC studies showed expression ranges from 5.76-fold to 13,923-fold, with a median expression range of 12.3-fold across studies. These data highlight pronounced heterogeneity of YBX1 mRNA expression within tumour cohorts, supporting the presence of distinct high-YBX1-expressing subsets across diverse cancer lineages (Figure 1D–F and Figure S1).
Collectively, these findings indicate that although YBX1 is rarely altered at the genomic level, elevated and heterogeneous expression is a common feature across cancers, suggesting that its oncogenic relevance is primarily mediated through transcriptional or post-transcriptional mechanisms rather than frequent genetic alteration.
2.2. Pan-Cancer Correlation Analysis Reveals Conserved Transcriptional and Signalling Programmes Associated with YBX1 Across Molecular Levels
To determine whether elevated YBX1 mRNA expression is associated with specific cancer-related biological programmes, we performed Spearman’s correlation analyses between YBX1 mRNA levels and the mRNA expression of 10,830 genes across 53 independent cancer datasets. Genes were selected based on consistent positive association with YBX1 expression, defined as a Spearman correlation coefficient (ρ) ≥ 0.3 with q ≤ 0.05 in at least ~80% (42/53) of the datasets analysed. This analysis identified 23 genes meeting these criteria (Figure 2A).
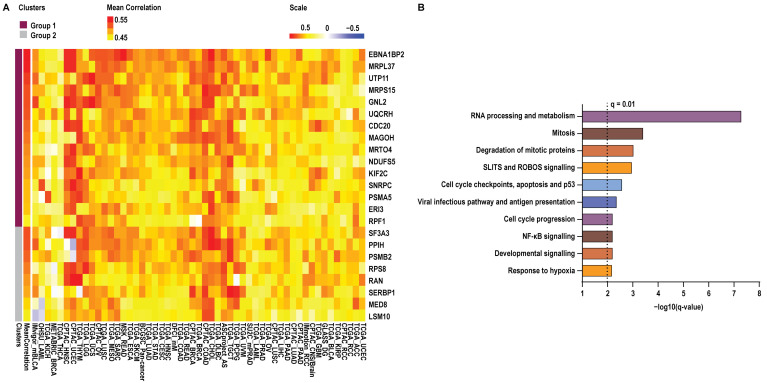
Notably, 15 of these genes showed positive correlation across all 53 datasets, with significant positive correlations observed in at least 45 datasets, indicating a highly robust association with YBX1 mRNA expression across diverse tumour contexts. The remaining eight genes were positively correlated in at least 51 of 53 datasets; among these, five genes (PPIH, PSMB2, RPS8, RAN, and MED8) were negatively correlated in a single dataset, while three genes (SF3A3, SERBP1, and LSM10) were negatively correlated in two datasets. For visualisation purposes, correlation coefficients across all datasets, including those not meeting significance thresholds, were displayed in the heatmap (Figure 2A).
In contrast, when the same consistency criteria were applied to negatively correlated genes, none were consistently shared across datasets (ρ ≤ −0.3, q ≤ 0.05 in ~80% of datasets), underscoring the specificity of positive YBX1-associated transcriptional programmes.
To assess the biological relevance of these associations, we next performed pathway enrichment analysis on genes whose mRNA expression correlated with YBX1 mRNA levels. This revealed a strong overrepresentation of pathways involved in RNA processing and metabolism, cell cycle regulation at G1/S and G2/M, DNA replication and checkpoint control, hypoxia, and multiple oncogenic signalling pathways (Figure 2B, Supplementary Table S1). Collectively, these findings indicate that high-YBX1 expression is tightly coupled to conserved proliferative and transcriptionally active tumour programmes across cancer types.
To extend these observations to the protein level, we analysed Reverse Phase Protein Array (RPPA) data from 31 TCGA tumour types to identify proteins whose abundance was significantly associated with YB-1 protein levels. Proteins were classified as positively or negatively associated based on a Spearman correlation coefficient (ρ ≥ 0.3 or ρ ≤ −0.3, respectively) with q ≤ 0.05 within each dataset. Unlike the mRNA analysis, protein-level associations were not consistently shared across tumour types at the level of individual proteins. Across the datasets, 27 tumour types contained significantly associated proteins to permit downstream analysis. Pathway enrichment analysis identified 283 positively associated and 163 negatively associated pathways, which were subsequently integrated by assessing their recurrence across tumour types (Supplementary Figure S2A,B and Supplementary Table S2).
Proteins positively associated with YB-1 were enriched in signalling-related pathways, including receptor tyrosine kinase signalling, cytokine and interleukin signalling, MAPK cascades, and cellular responses to external stimuli, reflecting active oncogenic signalling and microenvironmental responsiveness. In contrast, proteins negatively associated with YB-1 were enriched for pathways related to transcriptional regulation, DNA repair, apoptosis, and cell-cycle checkpoint control, including G2/M DNA damage checkpoint regulation and TP53-mediated transcriptional programmes.
Given that none of the genes consistently correlated with YBX1 mRNA expression were represented in the RPPA dataset, direct comparison between transcript- and protein-level candidates at the gene level was not possible. Moreover, as no genes were consistently negatively correlated with YBX1 mRNA across tumour types, cross-layer pathway integration was restricted to positively associated features. We therefore intersected pathways enriched from positively YBX1-associated mRNA expression with those derived from positively YB-1-associated protein abundance and assessed their recurrence across tumour types. This analysis identified a set of shared pathways consistently enriched across datasets (Supplementary Figure S2C), including transcriptional regulation (e.g., RNA polymerase II-mediated transcription and RUNX-dependent programmes), core gene expression processes, and cell-cycle-associated pathways such as G1/S transition, S-phase progression, cyclin-dependent kinase activity, and cell-cycle checkpoints. Additional enrichment was observed for apoptosis, cellular stress response pathways, developmental signalling pathways (including WNT and NOTCH), and pathways related to mRNA stability and post-transcriptional regulation.
Although several high-level biological processes, including cell-cycle regulation and apoptosis, were represented in both positively and negatively associated pathway sets, these corresponded to distinct components within those processes. Positively associated pathways were enriched for features linked to cell-cycle progression and signalling activity, whereas negatively associated pathways were enriched for DNA damage response and checkpoint-related processes (Supplementary Table S2).
Overall, these findings indicate that YBX1 expression is associated with coordinated transcriptional, cell-cycle, and signalling-related programmes across cancer types.
2.3. Pan-Cancer Genomic and Pathway Correlates of YBX1 mRNA Expression
To investigate whether YBX1 mRNA expression is associated with specific mutational patterns, we focused our analysis on the TCGA datasets, as they provide the most comprehensive, high-quality, and uniformly processed mutation and expression data across diverse cancer types. Mutation rates for each gene were compared between the high- and low-expression groups, and a delta value (Δ = high − low) was computed to quantify enrichment of mutations in high-YBX1 tumours. Genes were then classified as positive (Δ > 0), negative (Δ < 0), or unchanged (Δ = 0), and the number of tumour types with positive (pos) versus negative (neg) enrichment was summarised as a pos/neg ratio. Genes with a pos/neg ratio > 2 were considered consistently enriched in high-YBX1 tumours, whereas those with a ratio ≤ 0.8 were depleted (Figure 3A,B).
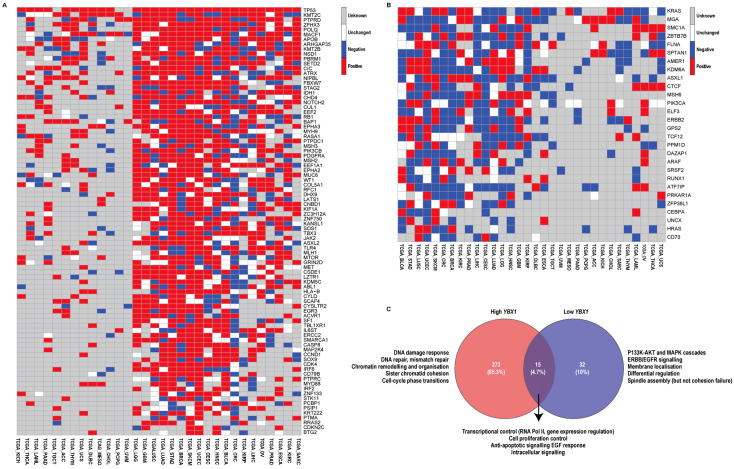
Using this approach, TP53, the key tumour suppressor and “guardian of the genome”, was consistently mutated at a higher frequency in high-YBX1 tumours in 29 of the 32 TCGA datasets analysed (Figure 3A). Beyond TP53, multiple genes with well-established roles in maintaining genome integrity were preferentially mutated in high-YBX1 tumours (Figure 3A). TP53 was mutated in all datasets where data were available, while the remaining genes were mutated across most datasets. These genes function across multiple genome-stabilising processes, including DNA repair (POLQ, SETD2, ATRX, MSH2, MSH3, MLH1, ERCC2, RFC1, DHX9, PSIP1), chromatin regulation (KMT2C, KMT2B, NSD1, PBRM1, CHD4, KANSL1, KDM5C, ASXL2, SMARCA1, SCAF4), chromosome segregation (STAG2, NIPBL, RB1, LATS1, FBXW7, CUL1), and cell-cycle checkpoint control (CDK4, CCND1, CDKN2C). Collectively, mutations in these pathways are known to promote genomic instability through defects in DNA damage repair, chromatin organisation, and mitotic fidelity.
In contrast, low-YBX1 tumours (Figure 3B) were enriched for mutations in receptor-proximal signalling and lineage-associated genes, including KRAS, ERBB2, PIK3CA, ARAF, HRAS, ELF3, and CEBPA. Compared with high-YBX1 tumours, this pattern was less uniform across datasets, but is consistent with a more signal-driven, differentiation-associated tumour state (Figure 3B).
To extend these observations beyond individual genes, we performed gene ontology-based pathway enrichment analysis using cancer driver genes differentially mutated between high- and low-YBX1 tumours. While both groups shared enrichment for core oncogenic programmes related to transcriptional regulation, cell proliferation, and growth factor responsiveness, high-YBX1 tumours were enriched for pathways associated with DNA damage response, DNA repair, mismatch repair, chromatin remodelling, chromosome organisation, sister chromatid cohesion, and cell-cycle phase transitions (Figure 3C, Supplementary Table S3). These pathway-level signatures are characteristic of replication stress and chromosomal instability, providing functional support for the elevated frequency of genome maintenance gene mutations observed in high-YBX1 tumours. Conversely, pathways uniquely enriched in low-YBX1 tumours were largely restricted to PI3K–AKT, MAPK, and ERBB/EGFR signalling cascades, as well as differentiation-related processes. Together, these findings are consistent with high-YBX1 tumours exhibiting greater proliferative and transcriptionally plastic features alongside increased enrichment of genomic instability-related processes.
2.4. YBX1 Expression Is Associated with Genomic Instability-Related and Hypoxia-Associated Tumour Features
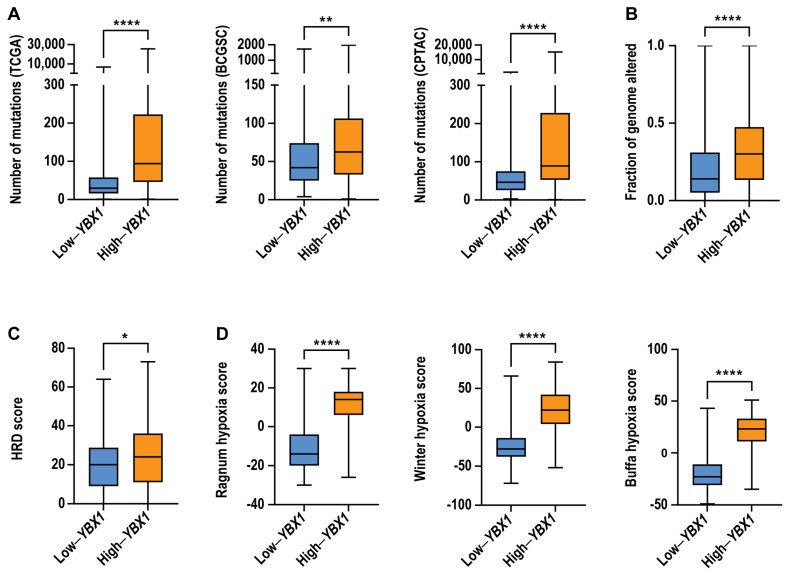
To determine whether elevated YBX1 mRNA expression is associated with increased genomic instability, we next examined whether high-YBX1 tumours exhibit increased mutational burden, copy number alterations, or defects in homologous recombination (HR), a high-fidelity DNA repair pathway. Tumours were stratified based on YBX1 mRNA expression, with high-YBX1 tumours defined as those at or above the 75th percentile and low-YBX1 tumours defined as those at or below the 25th percentile.
Across the TCGA pan-cancer cohort, as well as independent BCGSC and CPTAC datasets, tumours with high-YBX1 expression exhibited significantly higher numbers of somatic mutations compared to low-YBX1 tumours (Figure 4A). In addition, high-YBX1 tumours displayed increased chromosomal alteration burden, as measured by fraction of genome altered (FGA), within the TCGA cohort (Figure 4B). Consistent with these findings, high-YBX1 tumours in the BCGSC dataset were more likely to exhibit homologous recombination deficiency (Figure 4C). Furthermore, high-YBX1 tumours were associated with significantly elevated hypoxia scores across multiple hypoxia signatures (Figure 4D).
To assess whether these associations were also observed at the protein level, we analysed Reverse Phase Protein Array (RPPA) data from 31 TCGA tumour types. Tumours were stratified based on YB-1 protein abundance using the same percentile thresholds (≥75th percentile, high; ≤25th percentile, low). Consistent with the mRNA-based analysis, tumours with high YB-1 protein levels were associated with increased mutation counts, a higher fraction of the genome altered, and elevated hypoxia scores (Supplementary Figure S3A–C).
Together, these findings indicate that elevated YBX1 expression, at both the mRNA and protein levels, is associated with tumour features linked to increased mutational burden, genomic alteration, and hypoxic tumour microenvironments across cancer types.
2.5. Association Between YBX1 mRNA Expression and Genomic Instability-Related Features Is Influenced by Proliferative Activity
Given the observed association between YBX1 mRNA expression and genomic instability-related features, we next assessed the extent to which these relationships are influenced by proliferative activity. YBX1 mRNA expression was moderately correlated with proliferation, as measured by a multi-gene G2/M checkpoint score (ρ = 0.53, p < 0.0001), indicating overlap with cell cycle-associated transcriptional programmes. To distinguish general proliferative effects from mitosis-associated processes, we compared two proliferation metrics: MKI67, a marker of overall proliferative activity, and a multi-gene G2/M checkpoint score, which captures transcriptional programmes associated with the G2/M phase of the cell cycle. This distinction enables the separation of general proliferation from mitosis-associated processes linked to chromosomal segregation and instability.
Using these proliferation metrics, we next examined the relationship between YBX1 mRNA expression and genomic instability across tumour types. At the pan-cancer level, YBX1 mRNA expression was associated with both FGA and mutation burden. Adjustment for proliferation attenuated these associations, with a greater reduction observed following adjustment for the G2/M checkpoint score compared to MKI67 (Figure 5 and Table 1).
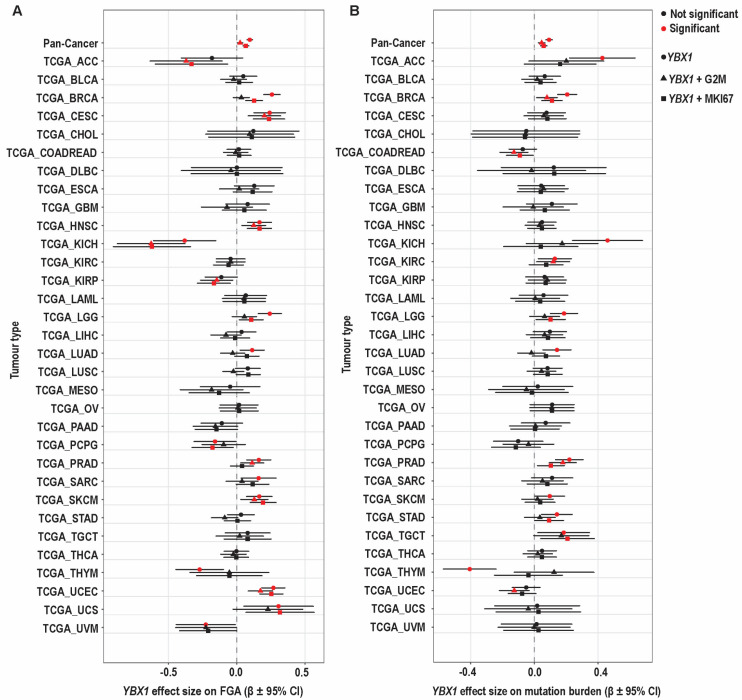
Table 1: Multivariable linear regression analysis of YBX1 mRNA expression and genomic instability (FGA and mutation count), adjusted for proliferation using either MKI67 expression or a multi-gene cell cycle (G2M) score. β denotes the regression coefficient.
| Model | Variable | FGA (β) | FGA (p-Value) | Mutation Count (β) | Mutation Count (p-Value) |
|---|---|---|---|---|---|
| YBX1 | YBX1 | 0.05 ± 0.003 | <2 × 10⁻¹⁶ | 0.58 ± 0.018 | <2 × 10⁻¹⁶ |
| YBX1 + MKI67 | YBX1 | 0.0138 ± 0.003 | 3.70 × 10⁻⁵ | 0.269 ± 0.018 | <2 × 10⁻¹⁶ |
| MKI67 | 0.0281 ± 0.001 | <2 × 10⁻¹⁶ | 0.245 ± 0.006 | <2 × 10⁻¹⁶ | |
| YBX1 + G2M Score | YBX1 | 0.0037 ± 0.003 | 0.258 | 0.427 ± 0.019 | <2 × 10⁻¹⁶ |
| G2M Score | 0.1496 ± 0.005 | <2 × 10⁻¹⁶ | 0.515 ± 0.03 | <2 × 10⁻¹⁶ |
At the individual tumour-type level, the relationship between YBX1 mRNA expression and FGA was heterogeneous but broadly consistent with the pan-cancer pattern (Figure 5A). Several tumour types, including CESC, HNSC, SKCM, and UCEC, showed positive associations that remained evident after adjustment. In BRCA and LGG, associations persisted after adjustment for MKI67 but were attenuated following adjustment for G2M, indicating a strong contribution from mitotic processes. In LUAD, the association was present only in unadjusted models and was attenuated after adjustment, whereas in PRAD, the association remained significant after adjustment for G2/M but not MKI67. KICH showed a consistent negative association across models, while THYM, UVM, and PCPG showed negative or model-dependent effects.
In many tumour types, including BLCA, CHOL, COADREAD, DLBC, ESCA, GBM, KIRC, LAML, LIHC, LUSC, MESO, OV, PAAD, STAD, TGCT, and THCA, no statistically significant association between YBX1 and FGA was observed. However, directional trends were evident: CHOL, ESCA, LAML, and TGCT showed consistently positive effect estimates, whereas KIRC, MESO, and PAAD demonstrated predominantly negative trends. The remaining tumour types showed effect estimates centred near zero.
Across tumour types, adjustment for proliferation reduced the magnitude of the YBX1–FGA association, with a greater effect observed for G2/M than MKI67, while preserving the direction of association. This pattern indicates that the YBX1–FGA relationship reflects shared mitotic and cell cycle–associated biology, consistent with the role of G2/M progression in generating chromosomal instability.
In contrast, the association between YBX1 mRNA expression and mutation burden was observed in fewer tumour types and was less consistent (Figure 5B). Positive associations were detected in ACC, KICH, LGG, LUAD, and SKCM in unadjusted models but were attenuated after adjustment. In BRCA and PRAD, associations persisted after adjustment, while in STAD, LGG, and TGCT, associations were retained after adjustment for MKI67 but not G2M. THYM showed a negative association in unadjusted models that was lost after adjustment. Among tumour types without statistically significant associations, effect estimates were generally weak and inconsistently directed, with some showing positive trends and others centred near zero.
Taken together, these findings show that YBX1 expression is associated with both chromosomal and mutational measures of genomic instability, with associations involving FGA observed more broadly across tumour types. The attenuation observed following adjustment for proliferation, particularly with the G2M checkpoint score, suggests that these relationships are influenced by mitotic and cell cycle-associated processes, whereas the association with mutation burden is more variable and less consistently affected by proliferation.
Overall, YBX1 mRNA expression is associated with tumour features linked to chromosomal instability, with these relationships largely influenced by proliferative and mitotic processes, particularly for chromosomal alteration burden. The attenuation observed following adjustment for proliferation, especially with G2/M-associated transcriptional programmes, indicates that these associations reflect shared cell-cycle and mitotic biology. Taken together, these findings indicate that, at the transcriptomic level, YBX1 mRNA expression does not independently capture chromosomal instability, but instead marks a proliferative tumour state in which such features arise.
2.6. High-YBX1 Expression Is Associated with Advanced Tumour Stage, Higher Grade, and Poor Clinical Outcomes
To determine whether the genomic and transcriptional features associated with high-YBX1 expression are reflected in clinical behaviour, we next examined the relationship between YBX1 expression and key clinicopathological parameters used in patient management. Tumours were stratified into high- and low-YBX1 groups based on YBX1 mRNA expression (high ≥ 75th and low ≤ 25th percentiles, respectively), and analyses were performed using clinical annotations available from the pan-cancer TCGA dataset.
Consistent with the proliferative and genomic features associated with high-YBX1 expression, we found that these tumours were significantly enriched for advanced disease stage. Specifically, high-YBX1 tumours exhibited a significantly higher proportion of AJCC T3- and T4-stage disease compared to low-YBX1 tumours (Figure 6A). In parallel, histopathological assessment revealed that histologic grade was also significantly higher in high-YBX1 tumours relative to low-YBX1 tumours, further supporting a more aggressive tumour phenotype (Figure 6B).
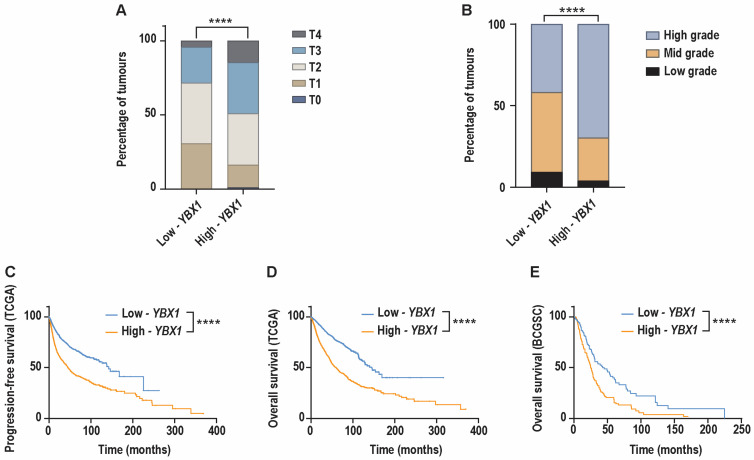
We next evaluated whether elevated YBX1 mRNA expression was associated with earlier disease recurrence. Progression-free survival was available for the pan-cancer TCGA cohort. This analysis demonstrated that patients with high-YBX1 tumours experienced a significantly shorter progression-free survival compared to those with low-YBX1 tumours (Figure 6C).
We next evaluated the association between YBX1 mRNA expression and clinical outcomes. In the TCGA pan-cancer cohort, patients with high-YBX1 tumours had significantly shorter progression-free survival compared to those with low-YBX1 tumours (Figure 6C). Similarly, analysis of overall survival in both the TCGA cohort and the metastatic pan-cancer BCGSC dataset showed that high-YBX1 expression was associated with reduced overall survival (Figure 6D,E).
To assess whether these associations were also observed at the protein level, we analysed YB-1 protein abundance using RPPA data across 31 TCGA tumour types. Tumours were stratified using the same percentile thresholds (≥75th and ≤25th percentiles). Consistent with the mRNA-based analysis, tumours with high YB-1 protein levels were enriched for advanced tumour stage (Supplementary Figure S4A). A similar trend was observed for histologic grade (Supplementary Figure S4B), although this did not reach statistical significance. In addition, patients with tumours expressing high levels of YB-1 protein showed reduced overall survival compared to those with low protein expression (Supplementary Figure S4C).
Taken together, these findings show that elevated YBX1 expression at both the mRNA and protein levels is associated with clinicopathological features and outcomes indicative of more aggressive disease.
3. Discussion
This study provides comprehensive pan-cancer integration of genomic, transcriptomic, proteomic, and clinical data to characterise tumour features associated with elevated YBX1 expression across multiple datasets and tumour types. Through this integrative analysis, we identify a reproducible set of molecular features that co-occur with high YBX1 expression, encompassing cell cycle and mitotic programmes, RNA processing, signalling pathways, and features related to DNA damage response and genome maintenance, alongside clinicopathological characteristics indicative of more advanced disease. Although these analyses are necessarily based on bulk datasets and are therefore subject to batch effects [ref. 49], variability in sequencing platforms [ref. 50,ref. 51], clinical annotation [ref. 52], and expression-based stratification across tumour types, the consistent emergence of these patterns across independent cohorts supports their reproducibility and relevance at the level of pan-cancer association.
The observed transcriptomic and proteomic associations are consistent with known roles of YB-1 in cell cycle regulation, RNA processing, and genome maintenance. Previous studies have shown that YB-1 regulates E2F-driven transcriptional programmes associated with tumour growth [ref. 13], promotes cell cycle progression via CDC6-dependent pathways [ref. 5], and modulates the G2/M transition through regulation of cyclins, including cyclin A1 [ref. 12], while also influencing G2/M arrest through interactions with cyclin D1 [ref. 11] and contributing to mitotic and cytokinetic regulation [ref. 6,ref. 9]. Concordant with these established functions, transcriptomic and proteomic analyses in the present study demonstrate consistent enrichment of cell cycle-related pathways in tumours with high YBX1 expression across tumour types. In addition to associations with cell cycle checkpoint pathways, proteomic analyses also identified positive associations with signalling pathways, including MAPK, receptor tyrosine kinase, and cytokine/interleukin signalling pathways that are closely linked to proliferative capacity.
Tumours with high YBX1 expression also exhibit features associated with altered genome maintenance. Genomic analyses demonstrate enrichment for mutations in TP53, as well as mutations affecting genes involved in DNA repair, chromatin organisation, chromosome segregation, and cell cycle progression, processes central to chromosomal alteration. TP53 is a key regulator of genomic integrity through its control of cell cycle arrest, DNA repair, and apoptosis, and disruption of TP53 is strongly associated with genomic instability, including both chromosomal alterations and mutational accumulation [ref. 53]. Proteomic analyses further show reduced association with TP53-mediated transcription, DNA repair, and cell cycle checkpoint pathways, consistent with a relative reduction in genome surveillance pathway engagement in high-YBX1 tumours. In line with this, prior studies have reported that YB-1 can antagonise p53-mediated tumour suppression through activation of MDM2 and repression of p53 target genes [ref. 32,ref. 33], providing a potential mechanistic context for the inverse association observed between YBX1 expression and TP53 pathway activity. Additional support for links between YB-1 and genome maintenance comes from studies demonstrating interactions between YB-1 and DNA repair machinery [ref. 15,ref. 16,ref. 17], promotion of double-strand break repair via DNA-PK-dependent mechanisms [ref. 16], and disruption of mismatch repair through interactions with PCNA and MutSα [ref. 19].
Despite these associations, the relationship between YBX1 expression and mutation burden is heterogeneous across tumour types. Although tumours with high YBX1 expression exhibit increased mutation burden at the pan-cancer level, this association varies across individual tumour contexts, suggesting that mutational processes are influenced by tumour-specific factors rather than by YBX1 expression alone. This variability is consistent with the well-established diversity of mutational mechanisms in cancer, including mismatch repair deficiency, APOBEC activity, and environmental exposures, which differ markedly across tumour lineages [ref. 54]. Consequently, the association between YBX1 expression and mutation burden appears context-dependent and is not uniformly coupled to broader genome maintenance-related features.
At both the transcriptomic and proteomic levels, YB-1 expression is also associated with developmental signalling pathways, including WNT and NOTCH, RUNX2-associated transcriptional programmes, and altered RNA processing and metabolic pathways. These features are consistent with a more plastic, stemness-associated tumour context that may favour invasion, adaptation, and therapeutic resistance. These pathway-level associations are supported by prior studies implicating YBX1 in transcriptional regulation and signalling through NOTCH [ref. 55] and WNT pathways [ref. 56,ref. 57]. In addition to its roles in cell cycle regulation, YB-1 functions as a multifunctional RNA-binding protein involved in RNA processing, stability, and metabolism, with studies demonstrating binding to A/C-rich RNA sequences to promote RNA stability and alternative splicing [ref. 58,ref. 59,ref. 60]. Enrichment of RUNX2- and RUNX3-associated transcriptional programmes further aligns with tumour contexts associated with proliferation, invasion, and EMT [ref. 7,ref. 21,ref. 22,ref. 26,ref. 27,ref. 28].
Overall, these findings are consistent with tumour contexts in which reduced engagement of checkpoint and genome maintenance pathways co-occurs with sustained proliferative and signalling activity. In line with these observations, high-YBX1 tumours are enriched for advanced disease stage and higher histologic grade and are associated with poorer clinical outcomes at both the mRNA and protein levels, although associations at the protein level appear more variable across tumour contexts. These findings are consistent with previous reports linking elevated YBX1 expression to poor prognosis [ref. 1,ref. 2,ref. 45,ref. 61], therapy resistance [ref. 29,ref. 30,ref. 31,ref. 32,ref. 34,ref. 35,ref. 56], and epithelial–mesenchymal transition (EMT) across cancers [ref. 7,ref. 20,ref. 21,ref. 22,ref. 23].
Taken together, this pan-cancer analysis places prior observations regarding YB-1 in a broader, integrative context. While YB-1 has been linked to proliferation, mitotic regulation, chromosomal instability, and DNA repair in individual experimental systems, our results indicate that across tumour types, YBX1 expression primarily marks proliferative and mitotic tumour states that are associated with, rather than independently predictive of, genomic instability-related features. Notably, the attenuation of associations with chromosomal alteration burden following adjustment for proliferative activity supports the interpretation that these relationships are embedded within shared cell-cycle and mitotic processes rather than representing a distinct YBX1-defined genomic instability programme.
These findings should also be interpreted in the context of several study limitations. The analyses presented here are correlative and do not establish causal relationships between YBX1 expression and the molecular or clinical features identified. In addition, although pan-cancer consistency was observed across multiple datasets, residual confounding by tumour lineage and molecular subtype remains possible, particularly given the known heterogeneity within tumour types. Furthermore, the use of bulk transcriptomic and proteomic datasets limits the resolution of cell-state and microenvironmental contributions to YBX1-associated programmes.
Within these limitations, the present study provides a framework for future investigation into the molecular mechanisms underlying these associations and their clinical relevance. Such studies will require functional validation using inducible and CRISPR-based perturbation models, organoid and in vivo systems, and cell cycle–resolved proteomic approaches to delineate YB-1-dependent regulatory networks. Longitudinal analyses integrating genomic profiling with DNA damage and repair assays will also be necessary to determine how YBX1 expression relates to mutation accumulation and tumour evolution in specific biological contexts. Defining these context-specific dependencies will be critical for assessing whether YBX1 expression can serve as a clinically meaningful biomarker for patient stratification or therapeutic targeting.
4. Materials and Methods
4.1. Data Retrieval from the cBioPortal Database
A total of 53 datasets from cBioPortal (accessed in January 2026) [ref. 46,ref. 47,ref. 48] were downloaded and integrated to analyse the genomic, transcriptomic, and clinical characteristics associated with YBX1 mRNA. This included two pan-cancer datasets, the British Columbia Genome Sciences Centre Pan-cancer Analysis of Advanced and Metastatic Tumors (BCGSC, 2020) and the Cancer Genome Atlas PanCancer Atlas studies (TCGA, PanCancer Atlas); 16 studies of various cancer types harmonised by the Clinical Proteomic Tumor Analysis Consortium (CPTAC), including colon adenocarcinoma (CPTAC, 2025), colon cancer (CPTAC-2 Prospective, 2019), CNS/brain cancer (CPTAC, 2025), glioblastoma (CPTAC, 2021), head and neck carcinoma, other (CPTAC, 2025), renal cell carcinoma (CPTAC, 2025), lung adenocarcinoma (CPTAC, 2020; CPTAC, 2025), lung squamous cell carcinoma (CPTAC, 2021; CPTAC, 2025), ovarian cancer (CPTAC, 2025), pancreatic cancer (CPTAC, 2025), endometrial carcinoma (CPTAC, 2020), Uterine endometrioid carcinoma (CPTAC, 2025), breast cancer (CPTAC, 2025), proteogenomic landscape of breast cancer (CPTAC, 2020); and 9 miscellaneous studies of various cancer types including metastatic bladder urothelial carcinoma (IMvigor210 Phase II Trial, 2024), renal cell carcinoma (IMmotion150 Clinical Trial, 2018), metastatic melanoma (DFCI, 2019), rectal cancer (MSK, 2022), breast cancer (METABRIC, 2012 and 2016), Diffuse Glioma (GLASS Consortium), acute myeloid leukaemia (OHSU, 2018), metastatic prostate adenocarcinoma (SU2C/PCF Dream Team, 2019), and the Angiosarcoma Project–Count Me In (Provisional, April 2025).
The BCGSC dataset (referred to as BCGSC, 2020) was retrieved at the pan-cancer level.
The TCGA PanCancer Atlas dataset (referred to as TCGA) was retrieved both at the pan-cancer level and across 33 individual cancer types. These are uterine carcinosarcoma (TCGA_UCS), diffuse large B-cell lymphoma (TCGA_DLBC), ovarian serous cystadenocarcinoma (TCGA_OV), uveal melanoma (TCGA_UVM), skin cutaneous melanoma (TCGA_SKCM), acute myeloid leukaemia (TCGA_LAML), colorectal adenocarcinoma (TCGA_COADREAD; comprising colon adenocarcinoma (TCGA_COAD) and rectal adenocarcinoma (TCGA_READ)), mesothelioma (TCGA_MESO), thymoma (TCGA_THYM), lung squamous cell carcinoma (TCGA_LUSC), cervical squamous cell carcinoma (TCGA_CESC), testicular germ cell tumours (TCGA_TGCT), bladder urothelial carcinoma (TCGA_BLCA), sarcoma (TCGA_SARC), head and neck squamous cell carcinoma (TCGA_HNSC), stomach adenocarcinoma (TCGA_STAD), uterine corpus endometrial carcinoma (TCGA_UCEC), esophageal adenocarcinoma (TCGA_ESCA), glioblastoma multiforme (TCGA_GBM), cholangiocarcinoma (TCGA_CHOL), pancreatic adenocarcinoma (TCGA_PAAD), lung adenocarcinoma (TCGA_LUAD), liver hepatocellular carcinoma (TCGA_LIHC), kidney renal clear cell carcinoma (TCGA_KIRC), kidney renal papillary cell carcinoma (TCGA_KIRP), brain lower grade glioma (TCGA_LGG), prostate adenocarcinoma (TCGA_PRAD), thyroid carcinoma (TCGA_THCA), breast invasive carcinoma (TCGA_BRCA), adrenocortical carcinoma (TCGA_ACC), kidney chromophobe (TCGA_KICH), and pheochromocytoma and paraganglioma (TCGA_PCPG).
Data from 16 CPTAC-harmonised studies (referred to as CPTAC) across 11 individual cancer types were retrieved, including colon cancer (CPTAC_COAD), ovarian cancer (CPTAC_OV), head and neck carcinoma (CPTAC_HNSC), breast cancer (CPTAC_BRCA), lung squamous cell carcinoma (CPTAC_LUSC), endometrial carcinoma (CPTAC_UCEC), CNS/brain Cancer (CPTAC_CNS/brain), renal cell carcinoma (CPTAC_RCC), pancreatic cancer (CPTAC_PAAD), lung adenocarcinoma (CPTAC_LUAD), and glioblastoma (CPTAC_GBM).
Data from 9 miscellaneous studies across 9 individual cancer types were retrieved, including metastatic bladder urothelial carcinoma (IMvigor_mBLCA), Renal Cell Carcinoma (IMmotion_RCC), metastatic melanoma (DFCI_mM), rectal adenocarcinoma (MSK_READ), breast cancer (METABRIC_BRCA), diffuse glioma (GLASS_DG), Acute myeloid leukaemia (OHSU_LAML), metastatic prostate adenocarcinoma (SU2C_mPRAD), and angiosarcoma (ASCproject_AS).
4.2. Genomic and Transcriptomic Profiles of YBX1
Genomic and transcriptomic profiles of YBX1, along with their corresponding tumour origins, were retrieved by querying the YBX1 gene in cBioPortal across all datasets.
Genomic alterations assessed include mutations (missense, nonsense, truncation, frameshift), copy number variations (amplifications and deletions), and structural variations. Mutation and copy number variation data were available for all BCGSC, TCGA, and CPTAC datasets, whereas structural variation data were only available in the BCGSC and TCGA datasets. For genomic alterations, the BCGSC dataset was assessed at the pan-cancer level, the TCGA dataset was assessed across 33 individual cancer types, the CPTAC dataset was assessed across 10 out of 11 individual cancer types due to data availability, and the 9 miscellaneous studies were assessed individually (Table 2).
Table 2: Summary of tumour types and sample sizes included in genomic and transcriptomic analyses of YBX1 and Spearman correlation analysis at the mRNA and protein level. N/A: not available.
| Studies | Tumour Type | Genomic Profilesof YBX1(Sample Size) | Transcriptomic Profiles and Spearman’sCorrelation of YBX1(Sample Size) | Proteomic Spearman’sCorrelation of YB-1(Sample Size) |
|---|---|---|---|---|
| BCGSC | Pan-cancer | 570 | 570 | – |
| TCGA | TCGA_UCS | 56 | 56 | 47 |
| TCGA_DLBC | 41 | 37 | 27 | |
| TCGA_OV | 511 | 201 | 304 | |
| TCGA_UVM | 80 | 80 | 12 | |
| TCGA_SKCM | 363 | 363 | 255 | |
| TCGA_LAML | 191 | 165 | – | |
| TCGA_COADREAD * | 532 | 524 | 417 | |
| TCGA_COAD * | – | – | – | |
| TCGA_READ * | – | – | – | |
| TCGA_LUSC | 484 | 82 | 309 | |
| TCGA_MESO | 86 | 119 | 59 | |
| TCGA_THYM | 123 | 484 | 90 | |
| TCGA_CESC | 287 | 275 | 152 | |
| TCGA_TGCT | 149 | 144 | 114 | |
| TCGA_BLCA | 407 | 402 | 338 | |
| TCGA_SARC | 253 | 251 | 217 | |
| TCGA_HNSC | 509 | 488 | 202 | |
| TCGA_STAD | 434 | 407 | 349 | |
| TCGA_UCEC | 511 | 507 | 406 | |
| TCGA_ESCA | 182 | 181 | 125 | |
| TCGA_GBM | 380 | 145 | 184 | |
| TCGA_CHOL | 36 | 36 | 30 | |
| TCGA_PAAD | 179 | 168 | 116 | |
| TCGA_LUAD | 511 | 503 | 356 | |
| TCGA_LIHC | 361 | 348 | 165 | |
| TCGA_KIRC | 400 | 352 | 315 | |
| TCGA_KIRP | 276 | 274 | 204 | |
| TCGA_LGG | 511 | 511 | 425 | |
| TCGA_PRAD | 489 | 488 | 346 | |
| TCGA_THCA | 487 | 480 | 358 | |
| TCGA_BRCA | 1053 | 994 | 810 | |
| TCGA_ACC | 89 | 76 | 44 | |
| TCGA_KICH | 65 | 65 | 62 | |
| TCGA_PCPG | 162 | 161 | 77 | |
| CPTAC | CPTAC_COAD | 209 | 105 | 106 |
| CPTAC_OV | N/A | 101 | 101 | |
| CPTAC_HNSC | 106 | 106 | 170 | |
| CPTAC_BRCA | 122 | 133 | 133 | |
| CPTAC_LUSC | 29 | 110 | 110 | |
| CPTAC_UCEC | 317 | 435 | 435 | |
| CPTAC_CNS/Brain | 95 | 221 | 221 | |
| CPTAC_RCC | 260 | 353 | 353 | |
| CPTAC_PAAD | 8 | 161 | 161 | |
| CPTAC_LUAD | 339 | 231 | 231 | |
| CPTAC_GBM | 192 | N/A | N/A | |
| Miscellaneous | IMvigor_mBLCA | 347 | 347 | 347 |
| IMmotion_RCC | 263 | 263 | 263 | |
| DFCI_mM | 122 | 122 | 122 | |
| MSK_READ | 725 | 100 | 100 | |
| METABRIC_BRCA | 1866 | 1866 | 1866 | |
| GLASS_DG | 329 | 355 | 355 | |
| OHSU_LAML | 562 | 451 | 451 | |
| SU2C_mPRAD | 429 | 208 | 208 | |
| ASCproject_AS | 274 | 157 | 157 |
* TCGA_COADREAD refers to colon adenocarcinoma and rectal adenocarcinoma combined; this was analysed separately as colon adenocarcinoma (TCGA_COAD) and rectal adenocarcinoma (TCGA_READ) in the Spearman correlation analysis at the transcriptomic level.
The mRNA expression of YBX1 analysed in this study was determined by RNA sequencing across all studies, except for the METABRIC_BRCA dataset, which was profiled using microarray. For YBX1 mRNA expression, the BCGSC dataset was assessed at the pan-cancer level, the TCGA dataset was assessed across 32 individual cancer types, the CPTAC dataset was assessed across 10 out of 11 individual cancer types due to data availability, and the 9 miscellaneous studies were assessed individually (Table 2).
Statistical analyses and graphical representations were conducted using GraphPad Prism (version 11.0.0) and Adobe Illustrator (version 29.5.1 (64 bit)).
4.3. Spearman’s Correlation Analysis and Pathway Analysis
The mRNA co-expression data against YBX1 mRNA was downloaded from cBioPortal by querying the YBX1 gene across the BCGSC pan-cancer dataset, the TCGA pan-cancer dataset, the CPTAC dataset, and across the 9 miscellaneous studies. The sample sizes for each dataset are detailed in Table 2.
To identify genes consistently correlated with YBX1 expression across multiple datasets, we collected all available CSV files containing gene-level correlation data (Spearman’s correlation coefficients and associated q-values) between YBX1 mRNA and other genes across independent cancer datasets. Data were imported and standardised using R (version 4.4.3) with the dplyr, tidyr, tibble, and pheatmap packages. Columns were harmonised across datasets to include gene, cytoband, correlation (ρ), p-value (p), q-value (q), and dataset identifiers. Only genes present in all datasets were retained for downstream analysis. For each gene, we determined the number of datasets in which the correlation with YBX1 met the following criteria: positive correlation (ρ ≥ 0.3 and p ≤ 0.01) or negative correlation (ρ ≤ −0.3 and p ≤ 0.01). Genes meeting these thresholds in ≥80% of datasets were considered consistently positively or negatively correlated with YBX1, respectively. For visualisation, correlation values for the filtered genes were arranged into a matrix with genes as rows and datasets as columns. Genes were ordered by mean correlation across datasets to highlight the most consistently associated genes. Side-bar annotations were added to indicate each gene’s mean correlation. Correlation values were visualised using colour gradients: negative correlations in blue, positive correlations from yellow to red, and values near zero in white. Heatmaps were generated with pheatmap, using hierarchical clustering for columns (datasets) and optional clustering for rows (genes), with row annotations for mean correlation values. To increase the robustness of results, genes with missing values in any dataset were removed. The analysis workflow produced summary statistics, including the number of genes consistently positively or negatively correlated with YBX1 across datasets.
For proteomic analyses, Reverse Phase Protein Array (RPPA) data were obtained from TCGA datasets encompassing 31 tumour types. Spearman’s correlation analyses were performed to identify proteins significantly associated with YB-1 protein levels across each tumour type, using thresholds of ρ ≥ 0.3 or ρ ≤ −0.3 with q ≤ 0.05.
Pathway enrichment analysis for both transcriptomic and proteomic datasets was subsequently conducted using the Reactome Pathways 2024 database through EnrichR [ref. 62,ref. 63,ref. 64], with pathways of q-value ≤ 0.01 being considered significant.
Statistical analyses and graphical representations were conducted using GraphPad Prism (version 11.0.0), R (version 4.4.3), and Adobe Illustrator (version 29.5.1 (64 bit)).
4.4. Enrichment of Driver Mutations in High- or Low-YBX1 Tumours and the Pathway Analysis
To assess the relationship between YBX1 mRNA expression and gene-specific mutation rates across multiple tumour types, we analysed mutation data from the 33 individual tumour types of the TCGA dataset. Tumours were stratified into high- and low-YBX1 expression groups based on the 75th and 25th percentiles of YBX1 mRNA expression within each tumour type, respectively. For each gene, the mutation rate was calculated in both groups, and a delta value (Δ = high − low) was computed to quantify enrichment of mutations in high-YBX1 tumours. Genes with missing mutation rates in either group were excluded from further analysis. The sample sizes for each cancer type are summarised in Table 3.
Table 3: Summary of tumour types and sample sizes included in the enrichment of driver mutations in high- or low-YBX1 tumours.
| Studies | Tumour Type | Enrichment of Driver Mutations | |
|---|---|---|---|
| High-YBX1(Sample Size) | Low-YBX1(Sample Size) | ||
| TCGA (individual) | TCGA_UCS | 14 | 14 |
| TCGA_DLBC | 10 | 10 | |
| TCGA_OV | 50 | 50 | |
| TCGA_UVM | 20 | 20 | |
| TCGA_SKCM | 91 | 91 | |
| TCGA_LAML | 41 | 42 | |
| TCGA_COADREAD | 131 | 131 | |
| TCGA_LUSC | 21 | 21 | |
| TCGA_MESO | 30 | 30 | |
| TCGA_THYM | 117 | 117 | |
| TCGA_CESC | 69 | 69 | |
| TCGA_TGCT | 36 | 36 | |
| TCGA_BLCA | 101 | 101 | |
| TCGA_SARC | 63 | 63 | |
| TCGA_HNSC | 122 | 122 | |
| TCGA_STAD | 101 | 101 | |
| TCGA_UCEC | 127 | 127 | |
| TCGA_ESCA | 45 | 45 | |
| TCGA_GBM | 37 | 37 | |
| TCGA_CHOL | 9 | 9 | |
| TCGA_PAAD | 42 | 42 | |
| TCGA_LUAD | 126 | 126 | |
| TCGA_LIHC | 87 | 87 | |
| TCGA_KIRC | 88 | 88 | |
| TCGA_KIRP | 69 | 69 | |
| TCGA_LGG | 128 | 128 | |
| TCGA_PRAD | 122 | 122 | |
| TCGA_THCA | 120 | 120 | |
| TCGA_BRCA | 249 | 249 | |
| TCGA_ACC | 19 | 19 | |
| TCGA_KICH | 17 | 17 | |
| TCGA_PCPG | 41 | 41 | |
A curated list of cancer-associated driver genes was obtained from a previously published study by Bailey et al. [ref. 65], and the analysis was restricted to these genes. Each gene was classified as positive (Δ > 0), negative (Δ < 0), or unchanged (Δ = 0). For each gene, the number of tumour types with positive (pos) versus negative (neg) enrichment was summarised as a pos/neg ratio. Genes with a pos/neg ratio > 2 were considered consistently enriched in high-YBX1 tumours, whereas genes with a ratio ≤ 0.8 were considered depleted.
Mutation enrichment status across tumour types was visualised using heatmaps. Genes were arranged in rows and tumour types in columns, with positive, negative, unchanged, or unknown status encoded as discrete categories. To facilitate visualisation, categorical status labels were mapped to numeric codes (positive = 1, negative = 2, unchanged = 3, unknown = 4) and heatmaps were generated using the pheatmap R package. Hierarchical clustering was applied to both genes and tumour types to reveal patterns of mutation enrichment across datasets. Separate heatmaps were produced for genes with pos/neg ratio > 2 and pos/neg ratio ≤ 0.8, highlighting consistent enrichment or depletion in high-YBX1 tumours.
All analyses were performed using R (version 4.4.3) with the tidyverse, pheatmap, dplyr, tidyr, readr, and tibble packages. Processed data and code for generating mutation delta values and heatmaps are available upon request.
Gene ontology analysis was subsequently conducted using the GO Biological Processes 2025 database through EnrichR [ref. 62,ref. 63,ref. 64] with pathways of q-value < 0.01 being considered significant. These are summarised in Supplementary Table S3.
Statistical analyses and graphical representations were conducted using GraphPad Prism (version 11.0.0), R (version 4.4.3), and Adobe Illustrator (version 29.5.1 (64 bit)).
4.5. Multivariable Analysis of YBX1 mRNA Expression and Genomic Instability with Adjustment for Proliferative Activity
To assess whether the association between YBX1 expression and genomic instability is independent of proliferative activity, we performed multivariable linear regression analyses adjusting for proliferation using both a single-gene marker and a multi-gene proliferation score. mRNA expression data for YBX1, MKI67, and genes included in the Hallmark G2M checkpoint gene set (MSigDB) were obtained from cBioPortal for the TCGA pan-cancer dataset (n = 9370). Corresponding data for the fraction of genome altered (FGA) and mutation count were also retrieved for the same samples.
Gene expression values were log2-transformed prior to analysis. Mutation count, defined as the total number of somatic mutations per sample, was log-transformed using log1p to account for skewness. FGA was used as a measure of chromosomal instability.
In addition to MKI67, a multi-gene proliferation score was derived using genes from the Hallmark G2M checkpoint gene set. For each gene, expression values were standardised across samples using z-score transformation, and a proliferation score for each sample was calculated as the mean of the standardised expression values across all genes in the set. To avoid redundancy, MKI67 was excluded from the G2M gene set prior to score calculation.
Multivariable linear regression models were constructed to evaluate the association between YBX1 expression and genomic instability metrics (FGA and mutation count), with adjustment for proliferation using either MKI67 expression or the G2M proliferation score. Separate models were fitted for each proliferation measure to avoid collinearity. Analyses were performed both at the pan-cancer level and within individual tumour types. For tumour-specific analyses, regression models were fitted separately for each cancer type to account for differences in baseline genomic features and biological context.
Model assumptions were assessed using standard diagnostic plots, and statistical significance was defined as a two-sided p-value < 0.05. Correlation between YBX1 expression and proliferation was assessed using Spearman correlation coefficients. Statistical analyses and graphical representations were conducted using R (version 4.4.3), and Adobe Illustrator (version 29.5.1 (64 bit)).
4.6. Molecular Characteristics Associated with YBX1 Levels
The molecular characteristics associated with YBX1 expression levels were analysed using the BCGSC pan-cancer dataset, the TCGA pan-cancer dataset, and CPTAC studies across 10 out of 11 individual tumour types due to data availability (CPTAC_COAD, CPTAC_OV, CPTAC_HNSC, CPTAC_BRCA, CPTAC_LUSC, CPTAC_UCEC, CPTAC_CNS/Brain, CPTAC_RCC, CPTAC_PAAD, CPTAC_LUAD). The CPTAC studies were collectively assessed at the pan-cancer level and are hereafter referred to as the CPTAC pan-cancer dataset. Tumour samples in each pan-cancer dataset were stratified into high- and low-YBX1 groups based on YBX1 mRNA expression levels, with the high-YBX1 group defined as the upper quartile (>75th percentile) and the low-YBX1 group defined as the lower quartile (<25th percentile).
Molecular features analysed included mutation count, fraction of genome altered (FGA), homologous recombination deficiency (HRD) score, and hypoxia scores (Ragnum, Winter, Buffa). Mutation count, capturing missense, insertion, deletion, and frameshift mutations, was available across all datasets. FGA, reflecting the proportion of the genome affected by copy-number variations, was available only in TCGA, while HRD score, indicating homologous recombination repair defects, was available only in BCGSC. Together, these measures serve as surrogates for genomic stability. Comparisons between high- and low-YBX1 tumours were performed using the Mann–Whitney U test, with p < 0.05 considered statistically significant.
Ragnum, Buffa, and Winter hypoxia scores are gene signature-based measures of transcriptional responses to low-oxygen levels within tumour microenvironments. This data was only available for the TCGA dataset. A Wilcoxon test was performed for comparisons between tumours with high- and low-YBX1, with a p-value < 0.05 considered to be statistically significant. The sample sizes for each molecular characteristic analysed are summarised in Table 4.
Table 4: Summary of sample sizes included in the analyses of molecular and clinical characteristics associated with YBX1 mRNA and protein levels.
| Studies | BCGSC | TCGA (mRNA) | TCGA(Protein) | CPTAC | ||
|---|---|---|---|---|---|---|
| Tumour Type | Pan-Cancer(Sample Size) | Pan-Cancer(Sample Size) | Pan-Cancer(Sample Size) | Pan-Cancer(Sample Size) | ||
| Molecular characteristics | Mutation counts | high-YBX1 | 142 | 2360 | 1689 | 483 |
| low-YBX1 | 143 | 2393 | 1689 | 278 | ||
| FGA | high-YBX1 | N/A | 2360 | 1689 | N/A | |
| low-YBX1 | 2393 | 1689 | ||||
| HRD score | high-YBX1 | 144 | N/A | N/A | N/A | |
| low-YBX1 | 143 | |||||
| Hypoxia scores * | high-YBX1 | N/A | 1722 | 1295 | N/A | |
| low-YBX1 | 2171 | 1244 | ||||
| Clinical characteristics | AJCC tumour stage | high-YBX1 | N/A | 1569 | 1392 | N/A |
| low-YBX1 | 1987 | 1149 | ||||
| Neoplasm histologic grade | high-YBX1 | N/A | 1027 | 556 | N/A | |
| low-YBX1 | 684 | 774 | ||||
| Progression-freesurvival | high-YBX1 | N/A | 2399 | N/A | N/A | |
| low-YBX1 | 2511 | |||||
| Overall survival | high-YBX1 | 143 | 2481 | 1671 | N/A | |
| low-YBX1 | 144 | 2514 | 1678 | |||
* Hypoxia scores: Ragnum, Wintere and Buffa.
To assess whether these associations were also observed at the protein level, YB-1 protein abundance was analysed using Reverse Phase Protein Array (RPPA) data from TCGA tumour types. Tumours were stratified into high and low YB-1 protein expression groups based on the 75th and 25th percentiles of YB-1 protein levels, respectively. Molecular characteristics assessed at the protein level included mutation count, fraction of genome altered (FGA), and the Ragnum, Buffa, and Winter hypoxia scores.
A Wilcoxon test was performed for comparisons between tumours with high and low YBX1, with a p-value < 0.05 considered statistically significant. The sample sizes for each molecular characteristic analysed are summarised in Table 4.
Statistical analyses and graphical representations were conducted using GraphPad Prism (version 11.0.0) and Adobe Illustrator (version 29.5.1 (64 bit)).
4.7. Clinical Characteristics Associated with YBX1 mRNA Levels
Clinical characteristics associated with YBX1 expression were analysed across the BCGSC and TCGA pan-cancer datasets by downloading the clinical data through cBioPortal. Tumour samples in each pan-cancer dataset were stratified into high- and low-YBX1 groups based on YBX1 mRNA expression levels, with the high-YBX1 group defined as the upper quartile (>75th percentile) and the low-YBX1 group defined as the lower quartile (<25th percentile).
The assessed parameters include the tumour stage derived from the American Joint Committee on Cancer (AJCC) tumour staging system, neoplasm histologic grade, and patient survival status.
Tumour stage (T1–4) represents the size and extent of invasion of the primary tumour. Neoplasm histologic grade describes the degree of abnormality (low-, mid-, and high-grade) of the cancerous tissue. Due to data availability, tumour stage and grade were analysed using the TCGA dataset only. A Chi-squared test was performed for comparisons between tumours with high- and low-YBX1, with a p-value < 0.05 considered to be statistically significant. The sample sizes for each of the clinal characteristics analysed are summarised in Table 4.
Patient survival was assessed using both progression-free survival (available for the TCGA study only) and overall survival (available for the TCGA and BCGSC studies). The sample sizes for each of the clinal characteristics analysed are summarised in Table 4. Progression-free survival refers to the length of time during and following treatment that a patient survives without the disease worsening, whereas overall survival refers to the length of time from diagnosis or treatment initiation that patients survive, regardless of disease status. A log-rank test was performed for comparisons between tumours with high and low YBX1, with a p-value < 0.05 considered to be statistically significant.
To assess whether these associations were also observed at the protein level, YB-1 protein abundance was analysed using Reverse Phase Protein Array (RPPA) data from the TCGA pan-cancer cohort. Tumours were stratified into high and low YB-1 protein expression groups based on the 75th and 25th percentiles of YB-1 protein levels, respectively. Associations between YB-1 protein expression and tumour stage, histologic grade, progression-free survival, and overall survival were assessed using the same statistical approaches as described for the mRNA-based analyses. Corresponding sample sizes for protein-level analyses are summarised in Table 4.
Statistical analyses and graphical representations were conducted using GraphPad Prism (version 11.0.0) and Adobe Illustrator (version 29.5.1 (64 bit)).
5. Conclusions
In summary, this study provides an integrated pan-cancer characterisation of tumour contexts associated with elevated YBX1 expression through the analysis of genomic, transcriptomic, proteomic, and clinical data across multiple independent cohorts. By assembling and systematically evaluating these data layers, we identify a reproducible pattern of tumour features that consistently co-occur with high YBX1 expression across diverse cancer types.
A key contribution of this work is the clarification of how YBX1 expression relates to genomic and clinical tumour characteristics at the pan-cancer level. In particular, our analyses delineate the extent to which associations between YBX1 expression and genomic instability-related features overlap with proliferative and mitotic-associated tumour biology, highlighting the importance of accounting for proliferative activity when interpreting these relationships.
Although the present study is inherently descriptive and based on bulk tumour data, it provides a consolidated framework that integrates prior observations with large-scale pan-cancer evidence. This framework helps to contextualise YBX1 expression within aggressive tumour phenotypes and establishes a foundation for future studies aimed at determining the context-specific functional roles of YB-1.
Future work will be required to determine the mechanistic basis and biological significance of these associations. Functional perturbation approaches, cell cycle-resolved analyses, and longitudinal models will be necessary to determine how YBX1 relates to tumour evolution and therapeutic response in specific tumour contexts. Such studies will be critical for evaluating the utility of YBX1 as a clinically informative biomarker and for defining conditions under which YB-1-associated pathways may represent actionable vulnerabilities.
References
- A. Lasham, C.G. Print, A.G. Woolley, S.E. Dunn, A.W. Braithwaite. YB-1: Oncoprotein, prognostic marker and therapeutic target?. Biochem. J., 2013. [DOI | PubMed]
- T.G. Johnson, K. Schelch, S. Mehta, A. Burgess, G. Reid. Why Be One Protein When You Can Affect Many? The Multiple Roles of YB-1 in Lung Cancer and Mesothelioma. Front. Cell Dev. Biol., 2019. [PubMed]
- A. Alkrekshi, W. Wang, P.S. Rana, V. Markovic, K. Sossey-Alaoui. A comprehensive review of the functions of YB-1 in cancer stemness, metastasis and drug resistance. Cell. Signal., 2021. [DOI | PubMed]
- Q. Yin, M. Zheng, Q. Luo, D. Jiang, H. Zhang, C. Chen. YB-1 as an Oncoprotein: Functions, Regulation, Post-Translational Modifications, and Targeted Therapy. Cells, 2022. [DOI | PubMed]
- Y. Basaki, K.-I. Taguchi, H. Izumi, Y. Murakami, T. Kubo, F. Hosoi, K. Watari, K. Nakano, H. Kawaguchi, S. Ohno. Y-box binding protein-1 (YB-1) promotes cell cycle progression through CDC6-dependent pathway in human cancer cells. Eur. J. Cancer, 2010. [DOI | PubMed]
- S. Mehta, M. Algie, T. Al-Jabry, C. McKinney, S. Kannan, C.S. Verma, W. Ma, J. Zhang, T.K. Bartolec, V.P. Masamsetti. Critical Role for Cold Shock Protein YB-1 in Cytokinesis. Cancers, 2020. [DOI | PubMed]
- V. Evdokimova, C. Tognon, T. Ng, P. Ruzanov, N. Melnyk, D. Fink, A. Sorokin, L.P. Ovchinnikov, E. Davicioni, T.J. Triche. Translational activation of snail1 and other developmentally regulated transcription factors by YB-1 promotes an epithelial-mesenchymal transition. Cancer Cell, 2009. [DOI | PubMed]
- T.G. Johnson, K. Schelch, K. Lai, K.A. Marzec, M. Kennerson, M. Grusch, G. Reid, A. Burgess. YB-1 Knockdown Inhibits the Proliferation of Mesothelioma Cells through Multiple Mechanisms. Cancers, 2020. [DOI | PubMed]
- A.H. Davies, I. Barrett, M.R. Pambid, K. Hu, A.L. Stratford, S. Freeman, I.M. Berquin, S. Pelech, P. Hieter, C. Maxwell. YB-1 evokes susceptibility to cancer through cytokinesis failure, mitotic dysfunction and HER2 amplification. Oncogene, 2011. [DOI | PubMed]
- K. Schelch, N. Maach, M. Hashim, B. Zitta, D. Kirchhofer, G. Timelthaler, A. Solta, D. Emminger, V. Kopatz, M.A. Hoda. Inhibition of YB-1 phosphorylation enhances cisplatin activity and disrupts cell division in pleural mesothelioma. Br. J. Cancer, 2025. [DOI | PubMed]
- P. Khandelwal, M.K. Padala, J. Cox, R.V. Guntaka. The N-terminal domain of y-box binding protein-1 induces cell cycle arrest in g2/m phase by binding to cyclin d1. Int. J. Cell Biol., 2009. [DOI | PubMed]
- Y. Murakami, D. Katsuchi, T. Matsumoto, K. Kanazawa, T. Shibata, A. Kawahara, J. Akiba, N. Yanaihara, A. Okamoto, H. Itamochi. Y-box binding protein 1/cyclin A1 axis specifically promotes cell cycle progression at G2/M phase in ovarian cancer. Sci. Rep., 2024. [DOI | PubMed]
- A. Lasham, W. Samuel, H. Cao, R. Patel, R. Mehta, J.L. Stern, G. Reid, A.G. Woolley, L.D. Miller, M.A. Black. YB-1, the E2F pathway, and regulation of tumor cell growth. J. Natl. Cancer Inst., 2012. [DOI | PubMed]
- S. Mehta, C. McKinney, M. Algie, C.S. Verma, S. Kannan, R. Harfoot, T.K. Bartolec, P. Bhatia, A.J. Fisher, M.L. Gould. Dephosphorylation of YB-1 is Required for Nuclear Localisation During G2 Phase of the Cell Cycle. Cancers, 2020. [DOI | PubMed]
- E.R. Kim, A.A. Selyutina, I.A. Buldakov, V. Evdokimova, L.P. Ovchinnikov, A.V. Sorokin. The proteolytic YB-1 fragment interacts with DNA repair machinery and enhances survival during DNA damaging stress. Cell Cycle, 2013. [DOI | PubMed]
- T. Nöthen, M.A. Sarabi, S. Weinert, W. Zuschratter, R. Morgenroth, P.R. Mertens, R.C. Braun-Dullaeus, S. Medunjanin. DNA-Dependent Protein Kinase Mediates YB-1 (Y-Box Binding Protein)-Induced Double Strand Break Repair. Arterioscler. Thromb. Vasc. Biol., 2023. [DOI | PubMed]
- I. Gaudreault, D. Guay, M. Lebel. YB-1 promotes strand separation in vitro of duplex DNA containing either mispaired bases or cisplatin modifications, exhibits endonucleolytic activities and binds several DNA repair proteins. Nucleic Acids Res., 2004. [DOI | PubMed]
- D. Liu, J. Ke, Y. Liu, H. Rao, Z. Tang, Y. Liu, Z. Zhang, L. You, X. Luo, Z. Sun. The interaction between PDCD4 and YB1 is critical for cervical cancer stemness and cisplatin resistance. Mol. Carcinog., 2021. [DOI | PubMed]
- Y.-W. Chang, R.-T. Mai, W.-H. Fang, C.-C. Lin, C.-C. Chiu, Y.-H. Wu Lee. YB-1 disrupts mismatch repair complex formation, interferes with MutSα recruitment on mismatch and inhibits mismatch repair through interacting with PCNA. Oncogene, 2014. [DOI | PubMed]
- M. Shiota, H. Izumi, T. Onitsuka, N. Miyamoto, E. Kashiwagi, A. Kidani, A. Yokomizo, S. Naito, K. Kohno. Twist promotes tumor cell growth through YB-1 expression. Cancer Res., 2008. [DOI | PubMed]
- D.H. Lovett, S. Cheng, L. Cape, A.S. Pollock, P.R. Mertens. YB-1 alters MT1-MMP trafficking and stimulates MCF-7 breast tumor invasion and metastasis. Biochem. Biophys. Res. Commun., 2010. [DOI | PubMed]
- T. Pang, M. Li, Y. Zhang, W. Yong, H. Kang, Y. Yao, X. Hu. Y Box-Binding Protein 1 Promotes Epithelial-Mesenchymal Transition, Invasion, and Metastasis of Cervical Cancer via Enhancing the Expressions of Snail. Int. J. Gynecol. Cancer, 2017. [DOI | PubMed]
- V. Evdokimova, C. Tognon, T. Ng, P.H.B. Sorensen. Reduced proliferation and enhanced migration: Two sides of the same coin? Molecular mechanisms of metastatic progression by YB-1. Cell Cycle, 2009. [DOI | PubMed]
- E. Stickeler, S.D. Fraser, A. Honig, A.L. Chen, S.M. Berget, T.A. Cooper. The RNA binding protein YB-1 binds A/C-rich exon enhancers and stimulates splicing of the CD44 alternative exon v4. EMBO J., 2001. [DOI | PubMed]
- D. Jiang, T. Qiu, J. Peng, S. Li, Tala, W. Ren, C. Yang, Y. Wen, C.-H. Chen, J. Sun. YB-1 is a positive regulator of KLF5 transcription factor in basal-like breast cancer. Cell Death Differ., 2022. [DOI | PubMed]
- A.M. El-Naggar, C.J. Veinotte, H. Cheng, T.G.P. Grunewald, G.L. Negri, S.P. Somasekharan, D.P. Corkery, F. Tirode, J. Mathers, D. Khan. Translational Activation of HIF1α by YB-1 Promotes Sarcoma Metastasis. Cancer Cell, 2015. [DOI | PubMed]
- B. Castellana, T. Aasen, G. Moreno-Bueno, S.E. Dunn, S. Ramón y Cajal. Interplay between YB-1 and IL-6 promotes the metastatic phenotype in breast cancer cells. Oncotarget, 2015. [DOI | PubMed]
- Q. Wu, Y. Xu, X. Li, H. Liu, T. You, T. Cai, F. Yang. YB-1 promotes cell proliferation and metastasis by targeting cell-intrinsic PD-1/PD-L1 pathway in breast cancer. Int. J. Biochem. Cell Biol., 2022. [DOI | PubMed]
- L. Taylor, P.K. Wade, J.E.C. Johnson, M. Aldighieri, S. Morlando, G. Di Leva, I.D. Kerr, B. Coyle. Drug Resistance in Medulloblastoma Is Driven by YB-1, ABCB1 and a Seven-Gene Drug Signature. Cancers, 2023. [DOI | PubMed]
- M. Saupe, L. Rauschenberger, M. Preuß, S. Oswald, S. Fussek, U. Zimmermann, R. Walther, C. Knabbe, M. Burchardt, M.B. Stope. Differential expression of the multidrug resistance 1 (MDR1) protein in prostate cancer cells is independent from anticancer drug treatment and Y box binding protein 1 (YB-1) activity. World J. Urol., 2015. [DOI | PubMed]
- T. Fujita, K.-i. Ito, H. Izumi, M. Kimura, M. Sano, H. Nakagomi, K. Maeno, Y. Hama, K. Shingu, S.-i. Tsuchiya. Increased nuclear localization of transcription factor Y-box binding protein 1 accompanied by up-regulation of P-glycoprotein in breast cancer pretreated with paclitaxel. Clin. Cancer Res. Off. J. Am. Assoc. Cancer Res., 2005. [DOI]
- H. Tong, K. Zhao, J. Zhang, J. Zhu, J. Xiao. YB-1 modulates the drug resistance of glioma cells by activation of MDM2/p53 pathway. Drug Des. Dev. Ther., 2019. [DOI]
- A. Lasham, S. Moloney, T. Hale, C. Homer, Y.F. Zhang, J.G. Murison, A.W. Braithwaite, J. Watson. The Y-box-binding protein, YB1, is a potential negative regulator of the p53 tumor suppressor. J. Biol. Chem., 2003. [DOI | PubMed]
- A. Lasham, S.Y. Mehta, S.J. Fitzgerald, A.G. Woolley, J.I. Hearn, D.G. Hurley, I. Ruza, M. Algie, A.N. Shelling, A.W. Braithwaite. A novel EGR-1 dependent mechanism for YB-1 modulation of paclitaxel response in a triple negative breast cancer cell line. Int. J. Cancer, 2016. [DOI | PubMed]
- L. Lou, J. Wang, F. Lv, G. Wang, Y. Li, L. Xing, H. Shen, X. Zhang. Y-box binding protein 1 (YB-1) promotes gefitinib resistance in lung adenocarcinoma cells by activating AKT signaling and epithelial-mesenchymal transition through targeting major vault protein (MVP). Cell. Oncol., 2021. [DOI]
- S. Negrini, V.G. Gorgoulis, T.D. Halazonetis. Genomic instability–an evolving hallmark of cancer. Nat. Rev. Mol. Cell Biol., 2010. [DOI | PubMed]
- A. Mazzagatti, J.L. Engel, P. Ly. Boveri and beyond: Chromothripsis and genomic instability from mitotic errors. Mol. Cell, 2024. [DOI | PubMed]
- A. Suvac, J. Ashton, R.G. Bristow. Tumour hypoxia in driving genomic instability and tumour evolution. Nat. Rev. Cancer, 2025. [DOI | PubMed]
- N. Rembiałkowska, Z. Kocik, A. Kłosińska, M. Kübler, A. Pałkiewicz, W. Rozmus, M. Sędzik, H. Wojciechowska, A. Gajewska-Naryniecka. Inflammation-Driven Genomic Instability: A Pathway to Cancer Development and Therapy Resistance. Pharmaceuticals, 2025. [DOI | PubMed]
- X. Chen, A.S. Agustinus, J. Li, M. DiBona, S.F. Bakhoum. Chromosomal instability as a driver of cancer progression. Nat. Rev. Genet., 2025. [DOI | PubMed]
- R.M. Drews, B. Hernando, M. Tarabichi, K. Haase, T. Lesluyes, P.S. Smith, L. Morrill Gavarró, D.-L. Couturier, L. Liu, M. Schneider. A pan-cancer compendium of chromosomal instability. Nature, 2022. [DOI | PubMed]
- T. Rauen, B.C. Frye, J. Wang, U. Raffetseder, C. Alidousty, A. En-Nia, J. Floege, P.R. Mertens. Cold shock protein YB-1 is involved in hypoxia-dependent gene transcription. Biochem. Biophys. Res. Commun., 2016. [DOI | PubMed]
- Z. Yuan, B. Li, W. Liao, D. Kang, X. Deng, H. Tang, J. Xie, D. Hu, A. Chen. Comprehensive pan-cancer analysis of YBX family reveals YBX2 as a potential biomarker in liver cancer. Front. Immunol., 2024. [DOI | PubMed]
- D.R. Grimes, T. Rassamegevanon, L. Marignol. In silico analysis of overall survival with YBX1 in male and female solid tumours. Sci. Rep., 2024. [DOI | PubMed]
- Z. Li, W. Lu, F. Yin, A. Huang. YBX1 as a prognostic biomarker and potential therapeutic target in hepatocellular carcinoma: A comprehensive investigation through bioinformatics analysis and in vitro study. Transl. Oncol., 2024. [DOI | PubMed]
- E. Cerami, J. Gao, U. Dogrusoz, B.E. Gross, S.O. Sumer, B.A. Aksoy, A. Jacobsen, C.J. Byrne, M.L. Heuer, E. Larsson. The cBio cancer genomics portal: An open platform for exploring multidimensional cancer genomics data. Cancer Discov., 2012. [DOI | PubMed]
- J. Gao, B.A. Aksoy, U. Dogrusoz, G. Dresdner, B. Gross, S.O. Sumer, Y. Sun, A. Jacobsen, R. Sinha, E. Larsson. Integrative analysis of complex cancer genomics and clinical profiles using the cBioPortal. Sci. Signal., 2013. [DOI | PubMed]
- I. de Bruijn, R. Kundra, B. Mastrogiacomo, T.N. Tran, L. Sikina, T. Mazor, X. Li, A. Ochoa, G. Zhao, B. Lai. Analysis and Visualization of Longitudinal Genomic and Clinical Data from the AACR Project GENIE Biopharma Collaborative in cBioPortal. Cancer Res., 2023. [DOI | PubMed]
- H.S. Parker, J.T. Leek. The practical effect of batch on genomic prediction. Stat. Appl. Genet. Mol. Biol., 2012. [DOI]
- Y. Sun, X. Zhao, X. Fan, M. Wang, C. Li, Y. Liu, P. Wu, Q. Yan, L. Sun. Assessing the impact of sequencing platforms and analytical pipelines on whole-exome sequencing. Front. Genet., 2024. [DOI | PubMed]
- L. Tong, P.-Y. Wu, J.H. Phan, H.R. Hassazadeh, S. Consortium, W. Tong, M.D. Wang. Impact of RNA-seq data analysis algorithms on gene expression estimation and downstream prediction. Sci. Rep., 2020. [DOI | PubMed]
- S. Mehta, D. Wright, M.A. Black, A. Merrie, A. Anjomshoaa, F. Munro, A. Reeve, J. McCall, C. Print. Impact of Clinical Data Veracity on Cancer Genomic Research. JNCI Cancer Spectr., 2022. [DOI | PubMed]
- C.M. Eischen. Genome Stability Requires p53. Cold Spring Harb. Perspect. Med., 2016. [PubMed]
- L.B. Alexandrov, S. Nik-Zainal, D.C. Wedge, S.A. Aparicio, S. Behjati, A.V. Biankin, G.R. Bignell, N. Bolli, A. Borg, A.L. Børresen-Dale. Signatures of mutational processes in human cancer. Nature, 2013. [DOI | PubMed]
- T. Rauen, U. Raffetseder, B.C. Frye, S. Djudjaj, P.J. Mühlenberg, F. Eitner, U. Lendahl, J. Bernhagen, S. Dooley, P.R. Mertens. YB-1 acts as a ligand for Notch-3 receptors and modulates receptor activation. J. Biol. Chem., 2009. [DOI | PubMed]
- X. Shi, Z. Hu, S. Bai, C. Zong, H. Xue, Y. Li, F. Li, L. Chen, J. Xuan, Y. Xia. YBX1 promotes stemness and cisplatin insensitivity in intrahepatic cholangiocarcinoma via the AKT/β-catenin axis. J. Gene Med., 2024. [DOI | PubMed]
- H.M. Chao, H.X. Huang, P.H. Chang, K.C. Tseng, A. Miyajima, E. Chern. Y-box binding protein-1 promotes hepatocellular carcinoma-initiating cell progression and tumorigenesis via Wnt/β-catenin pathway. Oncotarget, 2017. [DOI | PubMed]
- W.J. Wei, S.R. Mu, M. Heiner, X. Fu, L.J. Cao, X.F. Gong, A. Bindereif, J. Hui. YB-1 binds to CAUC motifs and stimulates exon inclusion by enhancing the recruitment of U2AF to weak polypyrimidine tracts. Nucleic Acids Res., 2012. [DOI | PubMed]
- F. Nasrin, M.A. Rahman, A. Masuda, K. Ohe, J. Takeda, K. Ohno. HnRNP C, YB-1 and hnRNP L coordinately enhance skipping of human MUSK exon 10 to generate a Wnt-insensitive MuSK isoform. Sci. Rep., 2014. [DOI | PubMed]
- Y.R. Zhang, W.Q. Li, Z.H. Zhang, R.X. Sun, H.J. Zhu, H.M. Qian, S.T. Yuan, Y.L. Wang. YBX1-driven TUBB6 upregulation facilitates ocular angiogenesis via WNT3A-FZD8 pathway. Theranostics, 2025. [DOI | PubMed]
- T. Shibata, E. Tokunaga, S. Hattori, K. Watari, Y. Murakami, N. Yamashita, E. Oki, J. Itou, M. Toi, Y. Maehara. Y-box binding protein YBX1 and its correlated genes as biomarkers for poor outcomes in patients with breast cancer. Oncotarget, 2018. [DOI | PubMed]
- E.Y. Chen, C.M. Tan, Y. Kou, Q. Duan, Z. Wang, G.V. Meirelles, N.R. Clark, A. Ma’ayan. Enrichr: Interactive and collaborative HTML5 gene list enrichment analysis tool. BMC Bioinform., 2013. [DOI]
- M.V. Kuleshov, M.R. Jones, A.D. Rouillard, N.F. Fernandez, Q. Duan, Z. Wang, S. Koplev, S.L. Jenkins, K.M. Jagodnik, A. Lachmann. Enrichr: A comprehensive gene set enrichment analysis web server 2016 update. Nucleic Acids Res., 2016. [DOI | PubMed]
- Z. Xie, A. Bailey, M.V. Kuleshov, D.J.B. Clarke, J.E. Evangelista, S.L. Jenkins, A. Lachmann, M.L. Wojciechowicz, E. Kropiwnicki, K.M. Jagodnik. Gene Set Knowledge Discovery with Enrichr. Curr. Protoc., 2021. [DOI | PubMed]
- M.H. Bailey, C. Tokheim, E. Porta-Pardo, S. Sengupta, D. Bertrand, A. Weerasinghe, A. Colaprico, M.C. Wendl, J. Kim, B. Reardon. Comprehensive Characterization of Cancer Driver Genes and Mutations. Cell, 2018. [DOI | PubMed]