
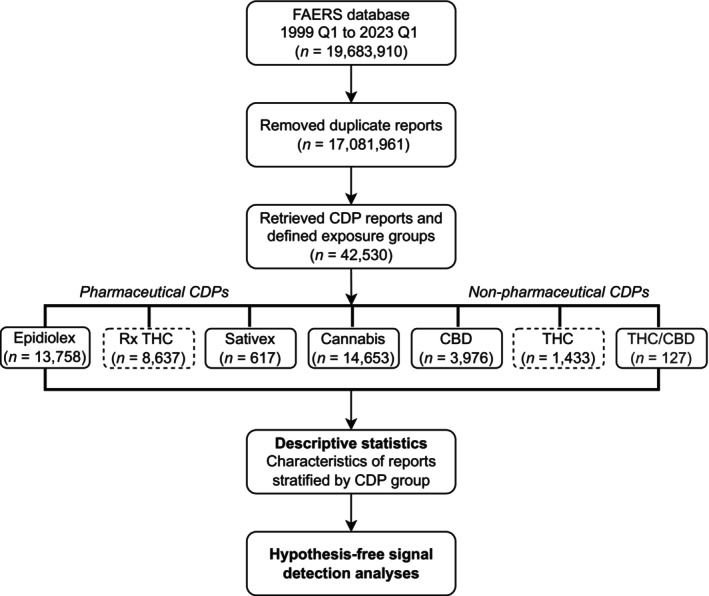
A Feasibility Assessment of the FDA Adverse Event Reporting System for the Detection of Cannabis‐Related Safety Signals
Abstract
Background:
The applicability of spontaneous reporting systems such as the US Food and Drug Administration Adverse Event Reporting System (FAERS) to detect cannabis‐related safety signals remains unclear due to the potential for discrepant reporting patterns between pharmaceutical and non‐pharmaceutical cannabis‐derived products (CDPs).
Methods:
We conducted a descriptive analysis of seven groups of CDP reports submitted to FAERS between 1999 and 2023 to investigate product definitions and reporting patterns. We then performed hypothesis‐free disproportionality analyses using reporting odds ratio, proportional reporting ratio, and information component for pharmaceutical cannabidiol (CBD) and non‐pharmaceutical CBD reports to assess differences in signal detection profiles, potential exposure misclassification, and the influence of reporting context.
Results:
We identified 42 530 reports related to CDPs, characterized by highly heterogeneous terminology and variable reporting patterns by product type, reflecting the real‐world CDP usage. Epidiolex reports often involved pediatric patients, whereas non‐pharmaceutical CBD reports were more frequently associated with older adults and concomitant product use. Disproportionality analysis showed divergent signal profiles, with strong seizure‐related events predominating for Epidiolex and a broader range of signals, including neoplasm‐related and neurological events, observed for non‐pharmaceutical CBD. These differences likely reflected variations in CDP indication and utilization and reporting behaviors.
Conclusions:
This study showed that signal detection using FAERS has potential feasibility for CDP safety surveillance. However, unique challenges related to exposure definitions, reporting patterns, motivation for utilization, and the need for a robust study design must be addressed to ensure reliable safety signal detection.
Article type: Research Article
Keywords: adverse events, cannabinoids, cannabis, disproportionality analysis, FAERS, pharmacovigilance
Affiliations: School of Epidemiology and Public Health University of Ottawa Ottawa Ontario Canada; Department of Biology University of Ottawa Ottawa Ontario Canada; Department of Chemistry and Biomolecular Sciences University of Ottawa Ottawa Ontario Canada; Department of Mathematics and Statistics University of Ottawa Ottawa Ontario Canada; Data Literacy Research Institute University of Ottawa Ottawa Ontario Canada
License: © 2026 The Author(s). Pharmacoepidemiology and Drug Safety published by John Wiley & Sons Ltd. CC BY 4.0 This is an open access article under the terms of the http://creativecommons.org/licenses/by/4.0/ License, which permits use, distribution and reproduction in any medium, provided the original work is properly cited.
Article links: DOI: 10.1002/pds.70392 | PubMed: 42130261 | PMC: PMC13172948
Relevance: Relevant: mentioned in keywords or abstract
Full text: PDF (569 KB)
Introduction
Legal and regulatory changes over the past two decades have altered the accessibility, composition, and usage of cannabis and cannabis‐derived products (CDPs) globally. In addition to pharmaceutical‐grade CDPs such as Epidiolex (cannabidiol [CBD]) [ref. 1], dronabinol (Marinol, Syndros) [ref. 2, ref. 3], nabilone (Cesamet) [ref. 4], and nabiximols (Sativex) [ref. 5], a range of non‐pharmaceutical CDPs is available through regulated and unregulated markets. This expansion in product types, formulations, and user populations has raised new challenges for pharmacovigilance, particularly in identifying potential adverse drug reactions (ADRs) associated with diverse CDP exposures [ref. 6, ref. 7].
Despite the increasing use of both pharmaceutical and non‐pharmaceutical CDPs, approaches for post‐market safety surveillance remain poorly characterized. Clinical trials for pharmaceutical CDPs are typically restricted to standardized formulations, narrow indications, and specific patient populations limiting their generalizability [ref. 8]. For non‐pharmaceutical CDPs, the absence of standardized dosing and manufacturing controls complicates safety assessment, as utilization data needed to contextualize adverse event (AE) reports cannot be reliably captured through conventional pharmacoepidemiological data sources [ref. 9]. Therefore, spontaneous reporting systems, like the US FDA Adverse Event Reporting System (FAERS), may support the detection of previously unknown CDP safety signals [ref. 10].
The multifaceted nature of CDP utilization complicates safety surveillance in FAERS using algorithms designed for medications without a recreational/non‐pharmaceutical counterpart. Challenges include inconsistent terminology within product type, coexistence of therapeutic and recreational use, and highly variable formulations and product compositions, particularly for non‐pharmaceutical CDPs. Varying regulatory oversight exacerbates these challenges, as legal restrictions may discourage AE reporting. Confounding by association may be present due to polysubstance use [ref. 11]. Together, the heterogeneity and complexity of the CDP landscape may influence reporter behavior and population‐level reporting patterns, with specific forms of reporting bias that depend on CDP type, whether pharmaceutical or recreational/non‐pharmaceutical [ref. 11].
Recently, the READUS‐PV guideline presented standards for disproportionality analyses in spontaneous reports for bias reduction and transparency [ref. 12]. To date, no study has systematically examined whether FAERS can support reliable signal detection for cannabis‐related AEs, and whether consensus guideline recommendations directly apply to CDPs or need adaptation. Understanding methodological constraints for CDP signal detection, and whether it carries a different potential for bias than other therapeutic products, is critical for optimizing cannabis science and surveillance efforts.
We assessed the feasibility of using FAERS for cannabis safety surveillance by first conducting a descriptive analysis of CDP‐related reports between 1999 and 2023 to explore the diversity of CDP terminology and reporting patterns. We then conducted hypothesis‐free signal detection of CBD‐containing products, reported as pharmaceutical or non‐pharmaceutical, to assess whether disproportionality reflects the cannabinoid itself or context‐dependent reporting introduced by ambiguous CDP definitions.
Methods
Data Source
We used the FAERS database from the first quarter (Q1) of 1999 to Q1 2023. Submission of suspected ADR reports to the FDA is voluntary for healthcare professionals, patients, and consumers, but is mandatory for product manufacturers. These reports include demographics, drug information (including the suspected role in the AE), clinical information about the reaction, outcomes, report sources, and indications and are publicly available in seven files linked through a unique identifier [ref. 13]. Suspected reactions are coded using Medical Dictionary for Regulatory Activities (MedDRA) terminology at the preferred term (PT) level, which links to a system organ class (SOC; hierarchical structure by etiology, site and purpose) [ref. 14].
We linked the quarterly data by case identification number, keeping the information in the most recent update linked to the initial report date. Reports were included regardless of the suspected role the reporter assigned to the CDP.
Exposure Definition
FAERS does not apply a standardized coding system specific to cannabinoid‐containing products. Therefore, drug names are recorded as reported. In 2025, the FDA revised MedWatch forms to include ‘Cannabinoid Hemp Products’ as an explicit product type category, though this classification was not available during our study period [ref. 15]. Due to the lack of standardized nomenclature for CDPs in FAERS and to improve the specificity of exposures, we searched for character strings associated with pharmaceutical and non‐pharmaceutical formulations of cannabinoids. Given that varying terminologies were used, we included medical and non‐medical names of major cannabinoids. The following terms were searched: ‘cannab’, ‘canab’, ‘mariju’, ‘marih’, ‘thc’, ‘cbd’, ‘nabixi’, ‘dronab’, ‘nabilo’, ‘cesam’, ‘syndros’, ‘marino’, ‘epidiol’, and ‘sative’. The string ‘cannab’ was selected to broadly capture cannabinoid‐related terms, including full chemical names such as tetrahydrocannabinol and cannabidiol. Following the initial query, we identified unanticipated variants, including misspellings, abbreviations, chemical isomers, and informal or international brand names. Considering sensitivity and specificity, each term was manually reviewed and either excluded (unrelated or ambiguous) or mapped to an exposure group. The details for this process are included in an R script and a table of the term mappings is provided in Online Appendix 1.
To identify potential toxicity to chemical constituents of cannabis products, we manually classified CDP reports on active ingredient and product quality control standards—similar to grouping pharmaceuticals by therapeutic class. Pharmaceutical CDPs containing derived tetrahydrocannabinol (THC), such as dronabinol (Marinol and Syndros) and nabilone (Cesamet), were grouped under prescription THC: (‘Rx THC’) (Figure 1). Reports with the brand name Epidiolex or Epidyolex were grouped as ‘Epidiolex’, and those referring exclusively to nabiximols (Sativex) were grouped as ‘Sativex’. Among non‐pharmaceutical CDPs, we categorized delta‐8‐tetrahydrocannabinol (D8‐THC) and delta‐9‐tetrahydrocannabinol (D9‐THC) together as ‘THC’, while the ‘CBD’ group included terms mentioning cannabidiol without reference to the branded product. Reports mentioning both THC and CBD were grouped under ‘THC/CBD’. Finally, reports with no reference to a particular cannabinoid were classified under the ‘Cannabis’ group and included terms such as cannabis, cannabinoids, or marijuana. The complete list of CDP terminology is provided in the Online Appendix 1.
Outcome Definition
Given the hypothesis‐free design, no AEs were specified a priori, and MedDRA terms were included at the PT level using version 27.0. Serious outcomes were summarized descriptively to characterize the severity of reports.
Calendar Time Restrictions
For the descriptive analysis, we included reports from 1999 Q1 to 2023 Q1 to capture the early expansion of medical cannabis legalization in the US [ref. 16]. For the disproportionality analyses, we restricted the study period to include 2018 Q2 to 2023 Q1 to reflect the later approval of Epidiolex by the FDA and legalization of hemp‐derived CBD with the 2018 Farm Bill [ref. 17].
Comparators
Given the lack of an a priori set of AEs, we included all other drugs reported in FAERS, while excluding the CDP of interest, as the comparator set.
Statistical Analysis
For the descriptive analysis, we summarized report characteristics, including age, sex, reporter country, role of the CDP in the report, and reported outcomes. Descriptive statistics were stratified by cannabinoid group, as defined through the mapping exercise. Reports with missing data for a variable were categorized as ‘missing’.
We estimated signals of disproportionate reporting for Epidiolex and non‐pharmaceutical CBD using three algorithms: the proportional reporting ratio (PRR) [ref. 18], the reporting odds ratio (ROR) [ref. 19], and the Bayesian confidence propagation neural network (BCPNN) [ref. 20], which estimates the information component (IC). The PRR is a reporting‐based analogue to relative risk and the ROR is the reporting version of an odds ratio. The IC compares observed drug‐AE reports against their expectation under independence and a Bayesian framework ‘shrinks’ estimates using a prior of independent reporting, reducing false positive rates in small sample settings—a known concern with PRR and ROR [ref. 20]. A signal was flagged for PRR and ROR if the lower bound of a 95% confidence interval (CI) of the point estimate exceeded 1, and for IC, the lower bound of a 95% credible interval (CrI) exceeded 0. All analyses were done with R version 4.2.3.
Results
CDP Terminology and Reporting Patterns
Of the 17 081 961 reports after data cleaning, we identified 42 530 reports that included a CDP‐related term, yielding 1204 unique terms. We excluded 44 related to minor cannabinoids or THC synthetics (e.g., ‘cannabinol’ and ‘spice/K2’, respectively). The largest categories by number of terms were CBD (339; 29.2%), Cannabis (319; 27.5%), and THC (244; 21.0%), while Epidiolex had the fewest (14; 1.2%) (Online Appendix 1).
Report frequencies by category differed from the corresponding distribution of terms (Table 1). The most frequently reported CDP was Cannabis (n = 14 653; 33.9% of CDP reports) and Epidiolex (n = 13 758; 31.8%), while Sativex (n = 617; 1.4%) and THC/CBD (n = 127; 0.3%) were less representative. Overall, pharmaceutical CDPs (Rx THC, Epidiolex, and Sativex) accounted for 53.3% of the CDP reports, while non‐pharmaceuticals (THC, THC/CBD, CBD, and Cannabis) constituted 46.7%.
TABLE 1: Patient demographics characteristics with reported use of CDPs queried from FAERS between 1999 Q1 and 2023 Q1.
| Characteristic | Cannabis‐derived products unique reports (n = 42 530) | ||||||
|---|---|---|---|---|---|---|---|
| Pharmaceutical | Non‐pharmaceutical | ||||||
| Rx THC (n = 8637) | Epidiolex (n = 13 758) | Sativex (n = 617) | THC (n = 1433) | THC/CBD (n = 127) | CBD (n = 3976) | Cannabis (n = 14 653) | |
| Age in yearspds70392-note-0003, n (%) | |||||||
| 0–12 | 118 (1.4) | 638 (4.6) | 4 (0.6) | 16 (1.1) | 5 (3.9) | 328 (8.2) | 155 (1.1) |
| 13–17 | 201 (2.3) | 230 (1.7) | 0 (0) | 61 (4.3) | 4 (3.1) | 96 (2.4) | 856 (5.8) |
| 18–35 | 764 (8.8) | 424 (3.1) | 54 (8.8) | 605 (42.2) | 29 (22.8) | 395 (9.9) | 4713 (32.2) |
| 36–54 | 1695 (19.6) | 180 (1.3) | 328 (53.2) | 395 (27.6) | 41 (32.3) | 698 (17.6) | 3437 (23.5) |
| 55–69 | 1970 (22.8) | 72 (0.5) | 123 (19.9) | 115 (8.0) | 19 (15.0) | 684 (17.2) | 1666 (11.4) |
| 70+ | 1249 (14.5) | 17 (0.1) | 16 (2.6) | 34 (2.4) | 8 (6.3) | 475 (11.9) | 515 (3.5) |
| Missing | 2640 (30.6) | 12 197 (88.7) | 92 (14.9) | 207 (14.4) | 21 (16.5) | 1300 (32.7) | 3311 (22.6) |
| Sex, n (%) | |||||||
| Female | 4190 (48.5) | 1678 (12.2) | 394 (63.9) | 524 (36.6) | 69 (54.3) | 2131 (53.6) | 5520 (37.7) |
| Male | 3918 (45.4) | 1990 (14.5) | 204 (33.1) | 762 (53.2) | 49 (38.6) | 1234 (31.0) | 7996 (54.6) |
| Missing | 529 (6.1) | 10 090 (73.3) | 19 (3.1) | 147 (10.3) | 9 (7.1) | 611 (15.4) | 1137 (7.8) |
| Role, n (%) | |||||||
| Primary suspect drug | 775 (9.0) | 12 788 (92.9) | 7 (1.1) | 346 (24.1) | 61 (48.0) | 353 (8.9) | 78 (0.5) |
| Secondary suspect drug | 649 (7.5) | 157 (1.1) | 68 (11.0) | 736 (51.4) | 16 (12.6) | 637 (16.0) | 7656 (52.2) |
| Interacting drug | 55 (0.6) | 40 (0.3) | 5 (0.8) | 54 (3.8) | 6 (4.7) | 148 (3.7) | 189 (1.3) |
| Concomitant drug | 7158 (82.9) | 773 (5.6) | 537 (87.0) | 297 (20.7) | 44 (34.6) | 2838 (71.4) | 6730 (45.9) |
| Outcome, n (%) | |||||||
| Hospitalization | 3459 (36.7) | 2942 (42.5) | 281 (42.6) | 409 (22.0) | 46 (30.3) | 915 (25.6) | 4703 (25.8) |
| Life‐threatening | 338 (3.6) | 47 (0.7) | 32 (4.8) | 105 (5.6) | 16 (10.5) | 123 (3.4) | 650 (3.6) |
| Death | 1527 (16.2) | 837 (12.1) | 17 (2.6) | 526 (28.3) | 1 (0.7) | 188 (5.3) | 3869 (21.2) |
| Other | 3839 (40.7) | 3056 (44.2) | 308 (46.7) | 650 (34.9) | 59 (38.8) | 2123 (59.5) | 8363 (45.8) |
| Disability | 188 (2.0) | 27 (0.4) | 22 (3.3) | 54 (2.9) | 11 (7.2) | 156 (4.4) | 441 (2.4) |
| Congenital abnormality | 20 (0.2) | 5 (0.1) | 0 (0) | 9 (0.5) | 0 (0) | 4 (0.1) | 152 (0.8) |
| Required intervention | 58 (0.6) | 4 (0.1) | 0 (0) | 107 (5.8) | 19 (12.5) | 59 (1.7) | 79 (0.4) |
| Reporting country, n (%) | |||||||
| Canada | 1426 (16.5) | 12 (0.1) | 22 (3.6) | 59 (4.1) | 20 (15.7) | 793 (19.9) | 2359 (16.1) |
| United States | 6066 (70.2) | 13 355 (97.1) | 9 (1.5) | 803 (56.0) | 93 (73.2) | 2407 (60.5) | 7446 (50.8) |
| Europe | 675 (7.8) | 219 (1.6) | 571 (92.5) | 358 (25.0) | 13 (10.2) | 581 (14.6) | 3745 (25.6) |
| Other | 45 (0.5) | 125 (0.9) | 12 (1.9) | 104 (7.3) | 1 (0.8) | 130 (3.3) | 425 (2.9) |
| Missing | 425 (4.9) | 47 (0.3) | 3 (0.5) | 109 (7.6) | 0 (0) | 65 (1.6) | 678 (4.6) |
Note: The estimated numbers of CDP reports are not mutually exclusive because people could have reported more than one suspected CDP in FAERS. Percentages were calculated using the total number of reports for each specific CDP group as the denominator.
Abbreviations: CBD, cannabidiol; CDP, cannabis‐derived product; FAERS, US Food and Drug Administration Adverse Event Reporting System; Rx THC, pharmaceutical‐containing THC; THC, non‐pharmaceutical containing tetrahydrocannabinol.
Age stratifications commonly used in cannabis epidemiology and public health surveillance [8, 26].
Demographic characteristics differed with reports for CBD, Rx THC, and Sativex more frequently associated with females aged 36–69, whereas THC and Cannabis involved males aged 18–54 years. Epidiolex was the primary suspect drug in 92.9% of reports (n = 12 788), highest among all CDPs, while Cannabis was the lowest, with 0.5% of reports. Reports for CBD, Rx THC, and Sativex were often flagged as concomitant drugs, while THC and Cannabis were commonly reported as secondary suspects. Age was frequently missing, but when available, children aged 0–12 years accounted for 8.2% of CBD and 4.6% of Epidiolex reports, the highest among CDPs. Serious outcomes were more frequently reported for THC and Cannabis, with death recorded in 28.3% of THC and 23.3% of Cannabis reports, although these proportions do not imply causality.
Hypothesis‐Free Signal Detection of CBD‐Containing Products
Given the propensity for false positives expected with PRR and ROR [ref. 21], and the absence of a priori AE selection, we used IC as the primary method to identify potential signals (Table 2). In the disproportionality analysis for Epidiolex, potential signals were primarily with nervous system disorders (18.75%), psychiatric disorders (16.48%), and injury, poisoning and procedural complications (10.23%). Seizure‐related AEs comprised a proportion of the strongest signals: seizure cluster (IC, 6.36; 95% CrI 6.05–6.68), change in seizure presentation (IC, 6.07; 95% CrI 5.68–6.45), atonic seizures (IC, 6.02; 95% CrI 5.64–6.41), seizure (IC, 5.47; 95% CrI 5.43–5.51), and weight abnormal (IC, 5.67; 95% CrI 5.40–5.93) (Table 2). CBD signals were classified under nervous system disorders (13.79%), investigations (11.13%), and general disorders (10.03%), with the highest linked to neoplasm‐related events (IC range: 3.5–5.1) (Table 2). The strongest signals for CBD included multiple‐drug resistance (IC, 5.73; 95% CrI 5.35–6.12), blood pressure diastolic decreased (IC, 4.88; 95% CrI 4.49–5.27), device related thrombosis (IC, 5.00; 95% CrI 4.36–5.65), malignant cranial nerve neoplasm (IC, 5.1; 95% CrI 4.33–5.87), and retro‐orbital neoplasm (IC, 5.08; 95% CrI 4.31–5.85) (Table 2). Noting the seizure‐related indication for Epidiolex we ran post hoc subgroup analyses stratified by this indication and presented the results in Online Appendix 3.
TABLE 2: The top IC estimates for Epidiolex (top panel) and CBD (bottom panel) at the preferred term level (FAERS 2018 Q2 to 2023 Q1).
| Epidiolex IC (95% CrI) | CBD IC (95% CrI) | |
|---|---|---|
| Top 15 PTs by Epidiolex disproportionality | ||
| Seizure cluster | 6.36 (6.05 to 6.68) | 2.43 (0.44 to 4.42) |
| Change in seizure presentation | 6.07 (5.68 to 6.45) | 2.88 (1.19 to 4.57) |
| Atonic seizures | 6.02 (5.64 to 6.41) | 2.51 (0.52 to 4.5) |
| Seizure | 5.47 (5.43 to 5.51) | 2.89 (2.68 to 3.1) |
| Weight abnormal | 5.67 (5.40 to 5.93) | NSD |
| Product supply issue | 5.31 (5.14 to 5.48) | NSD |
| Anticonvulsant drug level increased | 5.56 (5.14 to 5.99) | 2.80 (1.12 to 4.49) |
| Emergency care | 5.39 (5.12 to 5.65) | NSD |
| Product administration interrupted | 4.97 (4.77 to 5.18) | 1.80 (0.56 to 3.03) |
| Sudden unexplained death in epilepsy | 4.66 (3.95 to 5.36) | 3.47 (2.13 to 4.82) |
| Drooling | 4.20 (3.86 to 4.54) | 1.76 (0.27 to 3.25) |
| Prescribed overdose | 3.94 (3.72 to 4.16) | NSD |
| Product distribution issue | 3.93 (3.59 to 4.27) | NSD |
| Therapy responder | 4.45 (3.56 to 5.33) | NSD |
| Generalized tonic–clonic seizure | 3.78 (3.55 to 4.01) | 3.06 (2.51 to 3.60) |
| Top 15 PTs by CBD disproportionality | ||
| Multiple‐drug resistance | NSD | 5.73 (5.35 to 6.12) |
| Blood pressure diastolic decreased | NSD | 4.88 (4.49 to 5.27) |
| Device related thrombosis | NSD | 5.00 (4.36 to 5.65) |
| Malignant cranial nerve neoplasm | NSD | 5.10 (4.33 to 5.87) |
| Retro‐orbital neoplasm | NSD | 5.08 (4.31 to 5.85) |
| Neuroblastoma recurrent | NSD | 4.96 (4.17 to 5.76) |
| Blood pressure diastolic abnormal | NSD | 4.65 (4.12 to 5.18) |
| Tonic convulsion | 3.94 (3.19 to 4.69) | 4.81 (4.09 to 5.54) |
| Metal poisoning | NSD | 4.78 (3.96 to 5.60) |
| Urine leukocyte esterase positive | NSD | 4.42 (3.60 to 5.24) |
| Behavior disorder | 3.01 (2.57 to 3.46) | 4.08 (3.54 to 4.61) |
| Sinus headache | NSD | 4.18 (3.49 to 4.87) |
| Blood pressure systolic abnormal | NSD | 4.12 (3.45 to 4.79) |
| Blood pressure systolic increased | NSD | 3.76 (3.38 to 4.14) |
| Post viral fatigue syndrome | NSD | 4.33 (3.36 to 5.30) |
Abbreviations: CrI, credible interval; FAERS, US FDA Adverse Event Reporting System; IC, information component; PT, preferred term; NSD, no signal detected (lower bound of the 95% credible interval for the information component IC025 ≤ 0).
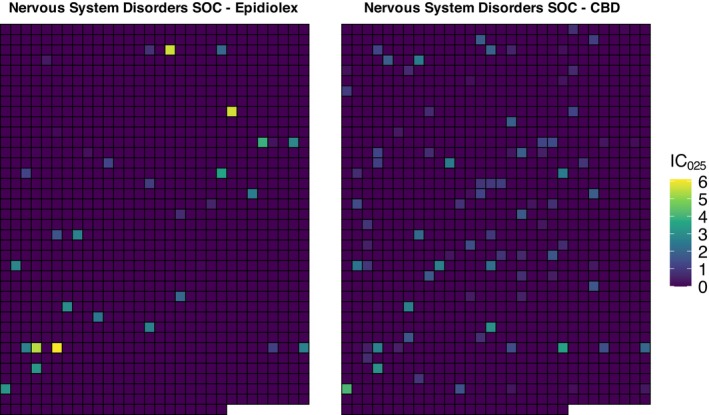
For both Epidiolex and CBD, the highest IC estimates were classified under nervous system disorders SOC, although the nature of signals differed between groups. We present IC estimates in a sector map (Figure 2) comparing pharmaceutical and non‐pharmaceutical CBD, where each cell corresponds to the same PT in the nervous system SOC. The color gradient from dark purple to bright yellow represents the lower bound of the 95% CrI for the IC (IC025), with darker shades indicating IC025 ≤ 0 (no signal) and brighter shades indicating IC025 > 0. We observed 33 highlighted cells for Epidiolex and 88 for CBD. Of the 33, 13 (39.4%) contained seizure or convulsion, with ICs ranging from 1.62 to 6.36. In contrast, CBD reports showed 2.6‐fold more signals; however, only 12 (13.6%) were seizure/convulsion related, with ICs ranging from 1.97 to 4.81. Most CBD‐related signals in this SOC were linked to diverse conditions, such as multiple sclerosis, Parkinson’s, and neuralgia.
Discussion
Our study evaluated the feasibility of using the FAERS database for cannabis‐related safety surveillance. We grouped diverse CDP terminologies into relevant categories, stratified by pharmaceutical and recreational motivations for utilization, and descriptively summarized reporting characteristics across groups. We conducted hypothesis‐free disproportionality analysis of Epidiolex and non‐pharmaceutical CBD as a relative comparison of signal detection profiles for the same cannabinoid under different regulatory and utilization contexts to assess feasibility. We observed substantial heterogeneity in CDP reporting terminology, patterns, and signal detection results, which was also observed in a post hoc subgroup analysis stratified by seizure indication.
We identified 1160 terms describing CDPs, with fragmented and inconsistent nomenclature. Terminology included diversity of products, mentioning legal statuses (e.g., ‘illegal marijuana’ and ‘legal cannabis’), highlighting the additional complexity of studying CDPs in FAERS beyond the usual concerns of linking commercial and chemical terms with small proportions of spelling errors [ref. 22]. While we provide a preliminary effort for categorizing CDP terms into meaningful groupings for future research, we demonstrated that manual intervention and contextual standardization are additional necessary steps for data cleaning in CDP‐related signal detection analysis. These processes are more complex and time‐consuming than for pharmaceutical drugs, but the risk of information bias and exposure misclassification may further compromise the reliability of safety signal detection [ref. 23] and we have provided our mappings to support implementation in future studies in Online Appendix 1.
Despite these challenges, our descriptive analysis revealed reporting patterns consistent with known CDP indications and user demographics. Epidiolex reports were predominantly flagged as primary suspect and frequently involved pediatric patients, reflecting its approved indication for refractory epilepsy [ref. 1]. In contrast, non‐pharmaceutical CBD reports were more heterogeneous, with higher representation of women and older adults, and concomitant reporting alongside other products. This pattern may reflect broader use of CBD formulations for symptom management in conditions such as chronic pain, anxiety, and sleep disturbances, consistent with previous surveys and observational studies [ref. 24, ref. 25].
Reports involving THC and Cannabis were associated with males aged 18 to 54 years and were often recorded as secondary suspects. This reflects national cannabis surveys, where males report higher percentages of cannabis use than females [ref. 26, ref. 27]. Our findings highlighted that, while Epidiolex and non‐pharmaceutical CBD both contain cannabidiol as a primary active ingredient, they likely differ in composition, purity, and concentration. Moreover, reporters vary in utilization and demographic characteristics, which may introduce heterogeneity in motivation to report, impacting the nature of reporting bias.
The disproportionality analysis highlighted these differences as two distinct signal detection profiles were observed. Epidiolex exhibited strong signals for seizure‐related adverse events, reflecting indication and heightened reporting in clinical settings. Such findings were anticipated, as pharmaceutical drugs are subject to legislative requirements for mandatory reporting [ref. 28]. In contrast, non‐pharmaceutical CBD reports showed a broader spectrum of signals, including neoplasm events and neurological disorders, likely reflecting the use of CBD to treat or manage these symptoms or health conditions. Seizure‐related events were less prominent compared to Epidiolex reports. The indication‐specific reporting profiles were noted further in our subgroup analyses (Online Appendix 3) where, notably, in the non‐seizure subgroup, the top signals detected for the non‐pharmaceutical version of CBD had no counterparts in the Epidiolex analysis with one exception (behavior disorder).
While some signals reflect ADRs consistent with the Epidiolex product monograph [ref. 1] (e.g., drooling, sedation, fluctuations in weight), observed differences with non‐pharmaceutical CBD imply factors beyond indication alone. Reporting context, product composition, dose, product quality, and patient characteristics may influence reporting behaviors [ref. 29]. Reporting bias and attribution effects may contribute to non‐pharmaceutical CBD signals, as individuals without medical supervision may be less likely to recognize or report AEs, or may misattribute them to underlying conditions [ref. 30]. In contrast, patients treated with Epidiolex are monitored in specialized care settings, where AEs are systematically documented, increasing the capture of seizure‐related events and other known risks. Selection bias may contribute, as individuals with chronic or severe illnesses may proactively report AEs, particularly when concerns are overlooked by clinicians [ref. 31]. Furthermore, non‐pharmaceutical CBD formulations exhibit variability in composition, purity, and labeling accuracy, potentially contributing to ADRs themselves as well as to reports linked to contaminants or inconsistent cannabinoid content [ref. 32]. Therefore, differences in regulatory status, prescribing practices, utilization patterns, and reporting behaviors may influence the signals detected for the same cannabinoid.
Our study has limitations. First, grouping CDP terms relied on manual, subjective decision‐making based on reported terms and associated cannabinoid pharmacology and regulatory status. Although this process was designed to maximize sensitivity and specificity, it may have introduced some degree of exposure misclassification, particularly for ambiguous or inconsistently reported terms. Second, our analysis was a broad, hypothesis‐free screening approach intended to compare high‐level signal detection profiles between pharmaceutical and non‐pharmaceutical CBD, rather than a study robustly designed to identify or validate individual ADRs. Hence, the observed signals may be influenced by systematic biases inherent to spontaneous reporting, such as confounding by association, competition bias, and under‐reporting or stimulated reporting [ref. 33, ref. 34, ref. 35], that were not addressed given the exploratory nature of this design. The choice of comparators in disproportionality analysis has been shown to influence both the magnitude and directionality of signal estimates [ref. 36, ref. 37], and we used the full‐data reference set, as this approach was not intended to optimize signal detection for any single ADR.
Accordingly, signals identified should not be interpreted as definitive evidence of the CDP safety profile or to infer differences between pharmaceutical and non‐pharmaceutical formulations. They reflect CDP reporting patterns within a specific timeframe and context. These findings are exploratory, and individual drug‐event combinations require validation in rigorously designed studies. Finally, disproportionality estimates alone cannot establish causality and must be evaluated in conjunction with complementary sources of evidence, including biological plausibility, controlled clinical data, patient‐level characteristics, and alternative explanations for the reported events [ref. 38].
Conclusion
Our feasibility study showed that FAERS may provide a valuable foundation for hypothesis generation in cannabis pharmacovigilance, but there are challenges beyond standard limitations of disproportionality analysis. Inconsistent terminology leading to ambiguous exposure definitions, the potential for specific forms of reporting bias arising from differing patterns of utilization for the same cannabinoid, and confounding by indication stratified by regulatory status contribute to the uncertainty underlying CDP signal detection. These limitations can substantially influence disproportionality estimates and complicate interpretation, and the informativeness of such estimates in isolation remains limited without more targeted study designs. Nevertheless, our findings suggest that rigorous methodological design, including population‐specific analytical approaches and systematic evaluation of exposure classification, can improve the reliability of CDP safety surveillance; however, future work is needed to evaluate their impacts. We posit that coordinated efforts by regulatory authorities, independent researchers, and pharmacovigilance experts to develop standardized nomenclature and operational definitions for CDPs may contribute to a more rigorous and transparent evaluation of the safety of cannabis‐derived therapies.
Author Contributions
Priscilla O. M. V. Lopes: conceptualization, formal analysis, visualization, writing – original draft, and writing – review and editing; Cory S. Harris: conceptualization, funding acquisition, methodology, and writing – review and editing; Christopher A. Gravel: conceptualization, methodology, writing – review and editing, and supervision. All authors read and approved the final version.
Funding
This study was supported by the Natural Sciences and Engineering Research Council of Canada (NSERC) CREATE Quality Assurance and Quality Control for Cannabis Production, Products and Training Program, grant number 543319‐2020.
Ethics Statement
The authors have nothing to report.
Consent
The authors have nothing to report.
Conflicts of Interest
C.S.H. has received research support from companies in the cannabis industry for unrelated projects including chemical analysis, process optimization, and new product development. The other authors declare no conflicts of interest.
References
- “Product Monograph Including Patient Medication Information Epidiolex (Cannabidiol Oral Solution),” (. 2024
- “Full Prescribing Information Marinol (Dronabinol) Capsules,” (. 2023
- “Full Prescribing Information Syndros (Dronabinol) Oral Solution,” (. 2024
- “Product Monograph Cesamet (Nabilone) Capsules,” (. 2019
- “Product Monograph Including Patient Medication Information Sativex (Delta‐9‐Tetrahydrocannabinol [THC] and Cannabidiol [CBD] Buccal Spray),” (. 2024
- “Cannabis‐Derived Products Data Acceleration Plan | FDA,” (. 2021
- “Better Data for a Better Understanding of the Use and Safety Profile of Cannabidiol (CBD) Products. FDA Voices – U.S. Food and Drug Administration,” (. 2023
- 8 National Academies of Sciences E, Division H and M, Practice B on PH and PH, Agenda C on the HE of MAER and R , “Therapeutic Effects of Cannabis and Cannabinoids,” in The Health Effects of Cannabis and Cannabinoids: The Current State of Evidence and Recommendations for Research (National Academies Press (US), 2017), https://www.ncbi.nlm.nih.gov/books/NBK425767/.
- Toking, Vaping, and Eating for Health or Fun: Marijuana Use Patterns in Adults, U.S., 2014,”. American Journal of Preventive Medicine, 2016. [DOI | PubMed]
- The Role of Quantitative Safety Evaluation in Regulatory Decision Making of Drugs,”. Journal of Biopharmaceutical Statistics, 2016. [DOI | PubMed]
- 11 S. Jack , “Pharmacovigilance of Cannabis Products for Medical and Non‐Medical Purposes,” in Pharmacovigilance for Herbal and Traditional Medicines, ed. J. Barnes (Springer Nature Switzerland, 2022), 317–333, 10.1007/978-3-031-07275-8_20.
- The REporting of A Disproportionality Analysis for DrUg Safety Signal Detection Using Individual Case Safety Reports in PharmacoVigilance (READUS‐PV): Explanation and Elaboration,”. Drug Safety, 2024. [DOI | PubMed]
- 13 U.S. Food and Drug Administration , FDA Adverse Event Reporting System (FAERS) Public Dashboard (FDA, 2023), https://www.fda.gov/drugs/fdas‐adverse‐event‐reporting‐system‐faers/fda‐adverse‐event‐reporting‐system‐faers‐public‐dashboard.
- The Medical Dictionary for Regulatory Activities (MedDRA),”. Drug Safety, 1999. [DOI | PubMed]
- Agency Information Collection Activities; Submission for Office of Management and Budget Review; Comment Request; Food and Drug Administration’s Adverse Event and Product Experience Reporting Program,”. Federal Register, 2025
- “Mapped: Countries Where Recreational Cannabis Is Legal,” (. 2024
- 17 United States Congress , Agriculture Improvement Act of 2018, vol. 4490 (United States Congress, 2018), https://www.govinfo.gov/content/pkg/PLAW‐115publ334/pdf/PLAW‐115publ334.pdf.
- Use of Proportional Reporting Ratios (PRRs) for Signal Generation From Spontaneous Adverse Drug Reaction Reports,”. Pharmacoepidemiology and Drug Safety, 2001. [DOI | PubMed]
- The Reporting Odds Ratio and Its Advantages Over the Proportional Reporting Ratio,”. Pharmacoepidemiology and Drug Safety, 2004. [DOI | PubMed]
- A Bayesian Neural Network Method for Adverse Drug Reaction Signal Generation,”. European Journal of Clinical Pharmacology, 1998. [DOI | PubMed]
- Benefits and Strengths of the Disproportionality Analysis for Identification of Adverse Drug Reactions in a Pharmacovigilance Database,”. British Journal of Clinical Pharmacology, 2011. [DOI | PubMed]
- Perspectives on the Use of Data Mining in Pharmacovigilance,”. Drug Safety, 2005. [DOI | PubMed]
- Nationally Representative Surveys on Cannabis Use Lack Product Details Relevant to Public Health,”. Drug and Alcohol Dependence Reports, 2023. [DOI | PubMed]
- A Cross‐Sectional Study of Cannabidiol Users,”. Cannabis and Cannabinoid Research, 2018. [DOI | PubMed]
- Use and Perceptions of Cannabidiol Products in Canada and in the United States,”. Cannabis and Cannabinoid Research, 2022. [DOI | PubMed]
- National Estimates of Marijuana Use and Related Indicators – National Survey on Drug Use and Health, United States, 2002–2014,”. MMWR Surveillance Summaries, 2016. [DOI]
- “Canadian Cannabis Survey 2024: Summary,” (. 2024
- 28 U.S. Food and Drug Administration , Best Practices for FDA Staff in the Postmarketing Safety Surveillance of Human Drug and Biological Products (US Department of Health and Human Services, 2024), https://www.fda.gov/media/130216/download.
- Factors Associated With Underreporting of Adverse Drug Reactions by Patients: A Systematic Review,”. International Journal of Clinical Pharmacy, 2023. [DOI | PubMed]
- Effect of Reporting Bias in the Analysis of Spontaneous Reporting Data,”. Pharmaceutical Statistics, 2015. [DOI | PubMed]
- Factors Associated With Underreporting of Adverse Drug Reactions by Health Care Professionals: A Systematic Review Update,”. Drug Safety, 2023. [DOI | PubMed]
- Product Labeling Accuracy and Contamination Analysis of Commercially Available Cannabidiol Product Samples,”. Frontiers in Pharmacology, 2024. [DOI | PubMed]
- A Potential Competition Bias in the Detection of Safety Signals From Spontaneous Reporting Databases,”. Pharmacoepidemiology and Drug Safety, 2010. [DOI | PubMed]
- Signal Detection Methodologies to Support Effective Safety Management,”. Expert Opinion on Drug Safety, 2007. [DOI | PubMed]
- Good Signal Detection Practices: Evidence From IMI PROTECT,”. Drug Safety, 2016. [DOI | PubMed]
- Considerations on the Use of Different Comparators in Pharmacovigilance: A Methodological Review,”. British Journal of Clinical Pharmacology, 2023. [DOI | PubMed]
- Comparators in Pharmacovigilance: A Quasi‐Quantification Bias Analysis,”. Drug Safety, 2024. [DOI | PubMed]
- Conducting and Interpreting Disproportionality Analyses Derived From Spontaneous Reporting Systems,”. Frontiers in Drug Safety and Regulation, 2024. [DOI]