Deciphering the role of Hashimoto’s Thyroiditis-related key genes in thyroid cancer via detailed in silico analysis followed by the experimental validation
Abstract
Background:
Thyroid cancer, characterized by significant genetic and epigenetic alterations, remains a critical focus of molecular oncology. This study investigates eight key genes (BRAF, EIF1 AX, FOXE1, KRAS, PDGFRA, PIK3 CA, PTEN, and TERT) that are deregulated in Hashimoto’s Thyroiditis and their roles in thyroid cancer.
Methods:
Cell culture, nucleic acid extraction, RT-qPCR, bisulfite sequencing, and various in silico tools and databases.
Results:
Expression analysis using RT-qPCR revealed significant (p-value < 0.05) down-regulation of BRAF, EIF1 AX, FOXE1, KRAS, PDGFRA, PIK3 CA, PTEN, and TERT genes in thyroid cancer cell lines compared to controls, with ROC curves indicating high diagnostic accuracy (AUC 0.93–0.99). Bisulfite sequencing demonstrated increased promoter methylation across all eight genes in cancerous samples, suggesting epigenetic silencing as a regulatory mechanism. Validation through UALCAN, OncoDB, and HPA confirmed reduced gene and protein expression in additional thyroid cancer cohorts. Genetic alteration analysis via cBioPortal showed prevalent BRAF mutations, whereas other genes exhibited fewer alterations. Kaplan–Meier survival analysis linked lower expression of BRAF and PIK3 CA to poorer overall survival. Correlation studies using TISIDB and TISCH2 databases highlighted associations between gene expression and immune modulation, revealing significant correlations with immune cell infiltration and diverse immune subtypes. Moreover, miRNA-mRNA network analysis identified hsa-mir- 628 – 5p as a critical regulator targeting these genes. The impact of BRAF overexpression on SW579 cells was assessed through various functional assays. Overexpression of BRAF resulted in reduced cell proliferation, colony formation, and wound healing, which may reflect context-dependent effects. While BRAF is typically oncogenic, its overexpression may lead to cellular stress or negative feedback mechanisms that impair these processes.
Conclusion:
This comprehensive analysis elucidates the complex regulatory landscape of these genes in thyroid cancer, emphasizing the significant role of epigenetic modifications and providing insights into potential diagnostic and therapeutic avenues.
Supplementary Information:
The online version contains supplementary material available at 10.1186/s41065-025-00429-0.
Article type: Research Article
Keywords: Thyroid cancer, Hashimoto’s Thyroiditis, Diagnosis, Prognosis, Treatment
Affiliations: https://ror.org/02f81g417grid.56302.320000 0004 1773 5396Department of Botany and Microbiology, College of Science, King Saud University, P.O. Box 2455, 11451 Riyadh, Saudi Arabia; https://ror.org/02f81g417grid.56302.320000 0004 1773 5396Biochemistry Department-College of Science-King, Saud University, Riyadh, Saudi Arabia; https://ror.org/01wf1es90grid.443359.c0000 0004 1797 6894Faculty of Science, Zarqa University, Zarqa, 13110 Jordan; https://ror.org/01an3r305grid.21925.3d0000 0004 1936 9000UPMC Hillman Cancer Center, Division of Hematology and Oncology, Department of Medicine, University of Pittsburgh, Pittsburgh, PA 15213 USA; https://ror.org/02f81g417grid.56302.320000 0004 1773 5396Department of Food Sciences & Nutrition, College of Food and Agricultural Sciences, King Saud University, P.O. Box 270677, 11352 Riyadh, Saudi Arabia; https://ror.org/002rc4w13grid.412496.c0000 0004 0636 6599Department of Biochemistry and Biotechnology, The Islamia University of Bahawalpur, Bahawalpur, Pakistan
License: © The Author(s) 2025 CC BY 4.0 Open Access This article is licensed under a Creative Commons Attribution 4.0 International License, which permits use, sharing, adaptation, distribution and reproduction in any medium or format, as long as you give appropriate credit to the original author(s) and the source, provide a link to the Creative Commons licence, and indicate if changes were made. The images or other third party material in this article are included in the article’s Creative Commons licence, unless indicated otherwise in a credit line to the material. If material is not included in the article’s Creative Commons licence and your intended use is not permitted by statutory regulation or exceeds the permitted use, you will need to obtain permission directly from the copyright holder. To view a copy of this licence, visit http://creativecommons.org/licenses/by/4.0/. The Creative Commons Public Domain Dedication waiver (http://creativecommons.org/publicdomain/zero/1.0/) applies to the data made available in this article, unless otherwise stated in a credit line to the data.
Article links: DOI: 10.1186/s41065-025-00429-0 | PubMed: 40450370 | PMC: PMC12126899
Relevance: Moderate: mentioned 3+ times in text
Full text: PDF (3.4 MB)
Introduction
Thyroid cancer is the most common malignancy of the endocrine system, with a steadily increasing incidence worldwide [ref. 1]. In 2023, the incidence of thyroid cancer continues to show an upward trend globally, making it one of the most rapidly increasing malignancies [ref. 2, ref. 3]. According to recent epidemiological data, the rise in thyroid cancer cases is particularly notable among women, who are three times more likely to be diagnosed with this disease than men [ref. 4, ref. 5]. Factors contributing to this increase include advancements in diagnostic techniques, such as high-resolution ultrasound and fine-needle aspiration biopsies, leading to the detection of smaller and asymptomatic tumors [ref. 6–ref. 9]. Additionally, environmental and genetic factors, as well as exposure to radiation, have been identified as significant risk contributors [ref. 10, ref. 11]. Despite the growing incidence, the mortality rate for thyroid cancer remains relatively low due to the generally favorable prognosis of the most common types, like papillary thyroid carcinoma, when detected early and managed appropriately [ref. 1, ref. 7, ref. 12]. This cancer encompasses a variety of histological types, including papillary, follicular, medullary, and anaplastic thyroid carcinoma [ref. 13]. Among these, papillary thyroid carcinoma (PTC) is the most prevalent, known for its generally favorable prognosis. However, the clinical course of thyroid cancer can vary significantly, and the presence of autoimmune thyroid diseases [ref. 14], particularly Hashimoto’s Thyroiditis (HT), has been implicated in altering the risk and progression of thyroid malignancies [ref. 15, ref. 16].
HT is a chronic autoimmune disorder characterized by lymphocytic infiltration and progressive destruction of thyroid tissue [ref. 16, ref. 17]. This condition is associated with an increased risk of developing thyroid cancer, particularly PTC. The precise molecular mechanisms underlying the association between HT and thyroid cancer remain an area of active research. However, dysregulation of certain key genes has been recognized as a critical factor in this process. In our study, we focus on eight such genes—PDGFRA, TERT, BRAF, KRAS, PIK3 CA, PTEN, FOXE1, and EIF1 AX—which play significant roles in both HT and thyroid cancer. These genes were selected for this study based on a comprehensive literature review, which highlighted their broad associations with HT and thyroid cancer and their roles in various cancer-related pathways. These genes have been extensively studied individually in the context of HT and thyroid cancer, but their collective analysis has not been explored before. The novelty of this study lies in the fact that these genes have not been analyzed together through both in silico and in vitro methods in the context of thyroid cancer. By combining these approaches, this study provides new insights into the molecular mechanisms underlying HT-associated thyroid cancer, offering a more comprehensive understanding of the interactions between these key genes in the development and progression of thyroid cancer.
Given the pivotal roles these genes play in the pathogenesis of thyroid cancer and their dysregulation in the context of HT, our study aims to analyze their diagnostic, prognostic, and therapeutic values using a comprehensive in silico [ref. 18, ref. 19] and molecular experimental approach [ref. 20, ref. 21]. Understanding the molecular alterations in these genes can provide insights into the mechanisms linking HT to thyroid cancer, aid in the identification of potential biomarkers for early detection, and inform targeted therapeutic strategies to improve patient outcomes.
Methodology
Cell culture
A total of 12 thyroid cancer cell lines, BHP 5–16, 8505 C, TPC- 1, FTC- 133, K1, BCPAP, SW579, WRO, CAL- 62, OCUT- 2, Nthy-ori 3–1, and ML- 1 and six normal thyroid cell lines, Nthy-ori 3–1, HTori- 3, Thy- 3, TE 354.T, and TTA1 were purchased from American Type Culture Collection (ATCC). Ethical approval was not required for this study as it involved the use of commercially available, immortalized cell lines that do not involve human or animal subjects. These cell lines were cultured in Dulbecco’s Modified Eagle Medium (DMEM), supplemented with 10% fetal bovine serum (FBS) and 1% penicillin–streptomycin. Additional supplements, such as sodium pyruvate, non-essential amino acids, or specific hormones like thyrotropin (TSH) were also added. All cultures are maintained at 37 °C in a humidified atmosphere containing 5% CO2.
Nucleic acid extraction
DNA and RNA were extracted from the cell lines using organic methods [ref. 22, ref. 23]. Initially, the cells were lysed to release DNA and RNA from the cellular matrix. Organic solvents, such as phenol–chloroform, were then used to separate the nucleic acids from proteins and other cellular components. Following this, isopropanol or ethanol was used to precipitate and concentrate the DNA and RNA into visible pellets. These nucleic acid pellets were washed with ethanol to remove any residual contaminants. Finally, the purified DNA and RNA were resuspended in appropriate buffers.
Synthesis of the cDNA
cDNA was synthesized using the RevertAid First Strand cDNA Synthesis Kit (Thermo Scientific) following the manufacturer’s instructions. RNA templates were first adjusted to a concentration of 0.5–1 μg per reaction. Each sample was then combined with 1 μl of oligo dT and incubated at 65 °C for 5 min. Following this, a mixture containing 1 μl of primer, nuclease-free water up to 12 μl, 4 μl of 5X reaction buffer, 1 μl of Ribolock RNase inhibitor, 2 μl of 10 mM dNTP mix, and 1 μl of RevertAid M-MuLV RT was added. The samples were mixed thoroughly, briefly centrifuged, and incubated for 60 min at 42 °C, followed by 5 min at 70 °C.
RT-qPCR analysis
The RT-qPCR reaction mixture consisted of 10 µl of SensiFast Lo-ROX reagent (Bioline), 0.8 µl of a primer mixture containing forward and reverse primers, 1 µl of the cDNA sample, 0.1 µl of Taq polymerase, and 8.1 µl of distilled water, resulting in a total volume of 20 µl. The reactions were carried out using the QuantStudio 5 system (Thermo Fisher Scientific) according to the manufacturer’s instructions. Positive signals from the amplified product were detected at the conclusion of the annealing step. All samples were run in duplicates. GAPDH was used as the reference gene for expression normalization, and its expression was evaluated alongside all candidate genes. GAPDH was chosen as the reference gene based on its widespread use and assumed stable expression under the experimental conditions.
The amplification results were computed using the subsequent formula:
\Delta \Delta \text{Ct }= \Delta \text{Ct}\left(\text{a target sample}\right) – \Delta \text{Ct}\left(\text{a reference sample}\right)
\]
The details of primer used are given in Table 1:
Table 1: Detail of the primers
| Gene | Primer | Sequence | Annealing Temperature (°C) | Cycles (n) |
|---|---|---|---|---|
| GAPDH | F | ACCCACTCCTCCACCTTTGAC | 59 | 35 |
| GAPDH | R | CTGTTGCTGTAGCCAAATTCG | ||
| BRAF | F | AACGAGACCGATCCTCATCAGC | 60 | |
| BRAF | R | GGTAGCAGACAAACCTGTGGTTG | ||
| EIF1 AX | F | GGGAAATGGACGGCTAGAAGCA | 61 | |
| EIF1 AX | R | TCCTGGTAGTCTCGGAGACCAA | ||
| FOXE1 | F | CACACTCAACGACTGCTTCCTC | 60 | |
| FOXE1 | R | CAGGAAGCTGCCGCTCTCGAA | ||
| KRAS | F | CAGTAGACACAAAACAGGCTCAG | 58 | |
| KRAS | R | TGTCGGATCTCCCTCACCAATG | ||
| PDGFRA | F | GACTTTCGCCAAAGTGGAGGAG | 60 | |
| PDGFRA | R | AGCCACCGTGAGTTCAGAACGC | ||
| PIK3 CA | F | GAAGCACCTGAATAGGCAAGTCG | 62 | |
| PIK3 CA | R | GAGCATCCATGAAATCTGGTCGC | ||
| TERT | F | GCCGATTGTGAACATGGACTACG | 61 | |
| TERT | R | GCTCGTAGTTGAGCACGCTGAA |
Bisulfite sequencing
For the construction of normal BS-seq libraries, 10 μg of genomic DNA was fragmented using a Covaris sonication system (Covaris S2). After fragmentation, libraries were prepared according to the Illumina Paired-End protocol, which included end repair, addition of < A > bases, and ligation of methylated adaptors. The ligated DNA was then subjected to bisulfite conversion using the EZ DNA Methylation-Gold kit (ZYMO) and subsequently amplified by PCR. The PCR amplification was carried out using the JumpStart™ Taq DNA polymerase kit (Sigma-Aldrich), in a final volume of 50 μl, containing 20 μl of purified DNA, 4 μl of 2.5 mM dNTP, 5 μl of 10X buffer, 0.5 μl of JumpStart™ Taq DNA polymerase, 2 μl of 10 μM PCR primers, and 37.5 μl of water. The thermal cycling program included an initial denaturation at 94 °C for 30 s, followed by 10 cycles of 94 °C for 30 s, 60 °C for 30 s, and 72 °C for 30 s, with a final extension at 72 °C for 1 min. Sequencing was then performed using the HighSeq2000 platform (Illumina). Methylation calling was performed using Bismark (v0.22.3) with a calling threshold set at ≥ 0.25 for significant methylation events. The methylation levels were normalized as beta values.
Expression analysis across pooled datasets
UALCAN [ref. 24, ref. 25] and OncoDB [ref. 26] are invaluable online resources for cancer research. UALCAN provides interactive analyses of cancer transcriptome data from The Cancer Genome Atlas (TCGA), enabling the exploration of gene expression patterns and clinical associations across various cancer types. OncoDB, on the other hand, offers comprehensive analysis tools for gene expression profiling and interactive visualization of RNA sequencing data, facilitating the discovery of potential biomarkers and therapeutic targets in cancer. These databases were utilized to validate the mRNA expression of the BRAF, EIF1 AX, FOXE1, KRAS, PDGFRA, PIK3 CA, PTEN, and TERT genes across THCA-TCGA datasets, containing 59 normal samples and 505 thyroid cancer samples, each.
The Human Protein Atlas (HPA) is a comprehensive resource that maps the human proteome, offering valuable insights into protein expression patterns and localization across various tissues and cell types [ref. 27]. Through extensive immunohistochemistry-based profiling and antibody validation, HPA provides researchers with a wealth of data on protein expression in both normal and diseased tissues. In this work, HPA was utilized to validate the expression of BRAF, EIF1 AX, FOXE1, KRAS, PDGFRA, PIK3 CA, PTEN, and TERT genes at the protein level in thyroid cancer tissue samples.
Promoter methylation levels of BRAF, EIF1 AX, FOXE1, KRAS, PDGFRA, PIK3 CA, PTEN, and TERT genes across pooled datasets
OncoDB [ref. 28] and GSCA [ref. 26] are integral resources for cancer research, providing comprehensive platforms for analyzing genomic alterations and gene expression profiles across various cancer types. OncoDB offers curated multi-omics data, enabling researchers to explore oncogenes, tumor suppressor genes, and clinical annotations to elucidate cancer mechanisms. GSCA specializes in gene expression analysis, facilitating the comparison of gene expression patterns and the identification of molecular signatures associated with cancer development and progression. In the present work, OncoDB and GSCA were utilized to validate the promoter methylation levels of the BRAF, EIF1 AX, FOXE1, KRAS, PDGFRA, PIK3 CA, PTEN, and TERT genes in the pooled THCA-TCGA datasets. The THCA-TCGA dataset available via OncoDB included 59 normal and 505 thyroid cancer samples, while the THCA-TCGA dataset available via GSCA included 59 normal and 513 thyroid cancer samples.
Genetic alterations in BRAF, EIF1 AX, FOXE1, KRAS, PDGFRA, PIK3 CA, PTEN, and TERT genes
cBioPortal is a widely used web-based platform that offers visualization and analysis tools for exploring large-scale cancer genomics datasets [ref. 29, ref. 30]. It enables researchers to interactively visualize genomic alterations such as mutations, copy number variations, and gene expression changes across various cancer types and subtypes. Users can explore genetic alterations in individual genes or pathways, correlate genomic alterations with clinical outcomes, and identify potential therapeutic targets. In our study, the cBioPortal database was utilized to conduct mutational analysis of BRAF, EIF1 AX, FOXE1, KRAS, PDGFRA, PIK3 CA, PTEN, and TERT genes in Thyroid carcinoma (TCGA, Firehose legacy) dataset containing 492 samples.
Survival analysis
cSurvival is a specialized database designed to facilitate survival analysis in cancer research [ref. 31]. It provides a user-friendly platform for investigators to explore and analyze survival data derived from various cancer studies. With cSurvival, researchers can assess the prognostic significance of specific genes, mutations, or clinical variables in relation to patient survival outcomes. The database offers robust statistical tools and visualization options, enabling users to perform Kaplan–Meier survival curves, Cox regression analysis, and subgroup comparisons. In this study, the cSurvival database was utilized for the survival analysis of BRAF, EIF1 AX, FOXE1, KRAS, PDGFRA, PIK3 CA, PTEN, and TERT genes in thyroid cancer patients.
TISIDB database
The TISIDB serves as a comprehensive repository integrating multidimensional data on tumor-immune interactions [ref. 32]. Tailored for cancer immunology research, it offers a user-friendly platform to explore the intricate interplay between tumors and the immune system. The database consolidates diverse datasets, ranging from gene expression profiles to immune cell infiltration levels, immunomodulatory gene signatures, and clinical outcomes across multiple cancer types. In our study, the TISIDB database was employed to analyze the correlations of BRAF, EIF1 AX, FOXE1, KRAS, PDGFRA, PIK3 CA, PTEN, and TERT genes with immune subtypes and immune modulator genes in thyroid cancer patients.
miRNA-mRNA network
miRNET is an extensive online resource specifically designed for the analysis and visualization of miRNA-target interactions and functional associations [ref. 33]. It integrates miRNA-target interactions from various prediction algorithms and experimentally validated databases, providing users with a comprehensive understanding of miRNA regulatory networks. In our study, the miRNET database was utilized for constructing the miRNA-mRNA network of the BRAF, EIF1 AX, FOXE1, KRAS, PDGFRA, PIK3 CA, PTEN, and TERT genes.
Furthermore, the expression level of hsa-mir- 628 – 5p was evaluated using UALCAN and RT-qPCR assay, following the previously mentioned protocol. U6 was utilized as the reference gene. The relative expression of hsa-mir- 628 – 5p miRNA to U6 was determined using the 2−ΔΔCt method. The following primers were employed for amplifying hsa-mir- 628 – 5p and U6:
- hsa-mir- 628 – 5p-F: 5’-GCAGTTCTAGTAAGAGTGGCA- 3’
- hsa-mir- 628 – 5p-R: 5’-GTCCAGTTTTTTTTTTTTTTTCGAC- 3’
- U6-F: 5’-CTCGCTTCGGCAGCACAT- 3’
Immunolytic and drug sensitivity analysis
To analyze the correlations among immune cells infiltration level, drug sensitivity, and BRAF, EIF1 AX, FOXE1, KRAS, PDGFRA, PIK3 CA, PTEN, and TERT genes expression across thyroid cancer, GSCA database [ref. 26] was utilized in the current research.
CancerSEA
CancerSEA, also known as Cancer Single-cell State Atlas, stands out as a distinctive database focusing on the analysis of single-cell RNA sequencing (scRNA-seq) data within the context of cancer [ref. 34]. Unlike conventional bulk RNA sequencing, scRNA-seq empowers researchers to delve into the heterogeneity of cancer cells at the single-cell level, offering insights into various cell types, states, and interactions within the tumor microenvironment. By integrating scRNA-seq data from diverse cancer studies, CancerSEA provides users with a comprehensive platform to explore and analyze these data thoroughly. In our study, CancerSEA was employed to unravel the correlations of BRAF, EIF1 AX, FOXE1, KRAS, PDGFRA, PIK3 CA, PTEN, and TERT genes with 14 essential functional states within thyroid cancer.
Gene enrichment
DAVID is a widely used bioinformatics resource for functional annotation and enrichment analysis of large gene lists. It integrates diverse biological data sets [ref. 35], including gene ontology annotations, protein–protein interactions, and pathway information, to elucidate the biological significance of gene sets. DAVID offers a suite of tools for functional annotation, gene set enrichment analysis, and visualization of functional annotation charts and graphs. In the present work, DAVID was used for the gene enrichment analysis of the BRAF, EIF1 AX, FOXE1, KRAS, PDGFRA, PIK3 CA, PTEN, and TERT genes.
Cell transfection
SW579 cells were cultured in DMEM (Dulbecco’s Modified Eagle Medium) supplemented with 10% FBS (Fetal Bovine Serum) and 1% penicillin–streptomycin. Cells were maintained at 37 °C in a humidified atmosphere with 5% CO₂. To induce BRAF overexpression, cells were transfected with a BRAF expression vector (pCMV-BRAF) using Lipofectamine™ 3000 Transfection Reagent (Thermo Fisher Scientific, Cat. No. L3000015) following the manufacturer’s protocol. A control group was transfected with an empty vector (pCMV).
Western blot analysis
Cells were lysed using RIPA Buffer (Thermo Fisher Scientific, Cat. No. 89900) containing a protease inhibitor cocktail (Thermo Fisher Scientific, Cat. No. 78429). Protein concentration was quantified using the Pierce™ BCA Protein Assay Kit (Thermo Fisher Scientific, Cat. No. 23227). Equal amounts of protein (30 µg) were separated on a 10% SDS-PAGE gel and transferred to a PVDF membrane (Thermo Fisher Scientific, Cat. No. 88518). Membranes were blocked with 5% non-fat milk in TBST and incubated overnight at 4 °C with primary antibodies against BRAF (1:1000 dilution, Thermo Fisher Scientific, Cat. No. PA5 – 85114) and GAPDH (1:2000 dilution, Thermo Fisher Scientific, Cat. No. MA5 – 15738) as a loading control. After washing, membranes were incubated with HRP-conjugated secondary antibodies (Thermo Fisher Scientific, Cat. No. 31460) for 1 h at room temperature. Protein bands were visualized using SuperSignal™ West Dura Extended Duration Substrate (Thermo Fisher Scientific, Cat. No. 34075) and imaged on a ChemiDoc™ Imaging System.
Colony formation assay
Transfected SW579 cells were trypsinized and seeded at a density of 500 cells per well in a 6-well plate. Cells were cultured for 14 days, with medium changes every 3 days. Colonies were fixed with 4% paraformaldehyde and stained with 0.5% crystal violet solution. The number of colonies was counted manually. Each experiment was performed in triplicate.
Cell proliferation assay
Cell proliferation was assessed using the Cell Counting Kit- 8 (CCK- 8, Thermo Fisher Scientific, Cat. No. A31122). Transfected cells were seeded in a 96-well plate at a density of 3,000 cells per well. Cell viability was measured at 24-, 48-, and 72-h post-transfection by adding 10 µL of CCK- 8 solution to each well and incubating for 2 h at 37 °C. The absorbance was measured at 450 nm using a microplate reader. The proliferation rate was calculated relative to the control group.
Wound healing assay
To evaluate cell migration, a wound healing assay was performed. Transfected SW579 cells were seeded in 6-well plates and grown to 90% confluence. A scratch was made in the monolayer using a sterile pipette tip, and the wells were washed with PBS to remove detached cells. The cells were then incubated in serum-free DMEM. Images of the wound area were captured at 0 and 24 h using an inverted microscope. The wound closure was quantified using ImageJ software, and the percentage of wound closure was calculated.
Statistics
The analysis utilized the t-test to assess group differences for variables displaying a normal distribution. Evaluation of the diagnostic potential of BRAF, EIF1 AX, FOXE1, KRAS, PDGFRA, PIK3 CA, PTEN, and TERT gene expression involved the receiver operating characteristic (ROC) curve, with the area under the curve (AUC) serving as the diagnostic metric. Survival analyses were conducted using Kaplan–Meier analysis, and log-rank test. Correlations between variables were examined using Spearman’s or Pearson’s test. All statistical tests were two-sided, with significance set at p < 0.05. Statistical analyses were performed using the R software (version 4.0.2).
Results
Expression and diagnostic performance analysis using clinical samples
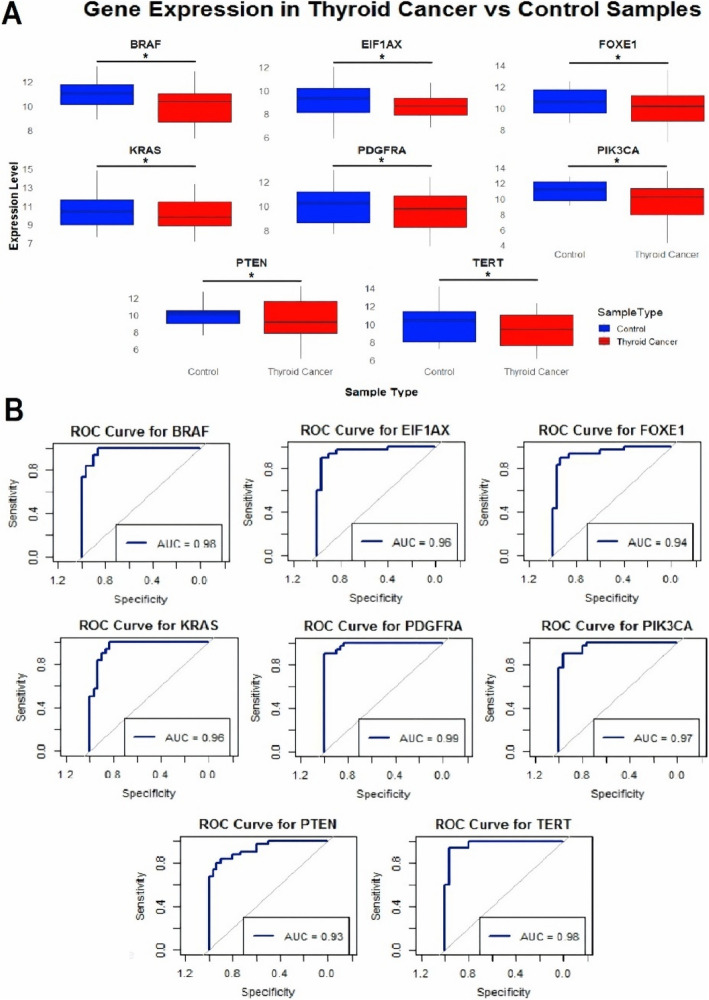
Expression analysis was conducted using RT-qPCR for eight genes (BRAF, EIF1 AX, FOXE1, KRAS, PDGFRA, PIK3 CA, PTEN, and TERT) in thyroid cancer versus control cell line samples. The results revealed that the expression levels of these genes were significantly (p-value < 0.05) down-regulated in thyroid cancer cell lines compared to control cell lines (Fig. 1A). Additionally, ROC curve analysis demonstrated that these genes had high sensitivity and specificity as biomarkers for distinguishing thyroid cancer from control samples. The area under the curve (AUC) values ranged from 0.93 to 0.99, indicating excellent discriminative power for each gene. Notably, PDGFRA (AUC = 0.99) and BRAF (AUC = 0.98) showed particularly strong potential as diagnostic markers (Fig. 1B). Overall, the RT-qPCR analysis confirmed that BRAF, EIF1 AX, FOXE1, KRAS, PDGFRA, PIK3 CA, PTEN, and TERT were significantly down-regulated in thyroid cancer cell lines. The high AUC values from the ROC curves further validated the utility of these genes as effective biomarkers for identifying thyroid cancer.
Promoter methylation analysis via bisulfite sequencing
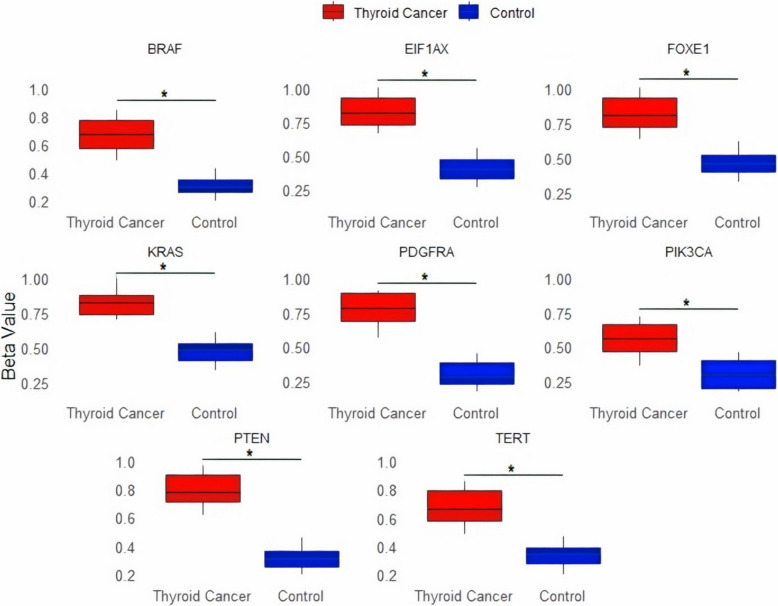
Promoter methylation analysis was performed using the bisulfite sequencing method. The results demonstrated that the promoter methylation levels of BRAF, EIF1 AX, FOXE1, KRAS, PDGFRA, PIK3 CA, PTEN, and TERT genes in thyroid cancer cell line samples (n = 12) were significantly (p-value < 0.05) higher compared to control cell line samples (n = 06), as illustrated by the beta values representing the degree of methylation (Fig. 2). Thyroid cancer samples (represented in red) consistently exhibited higher beta values than control samples (represented in blue), indicating a significant (p-value < 0.05) increase in promoter methylation in the cancerous cell lines (Fig. 2). This uniform pattern of increased methylation across these genes suggests that promoter hypermethylation is a common mechanism contributing to the down-regulation of gene expression in thyroid cancer.
Gene expression validation using additional cohorts
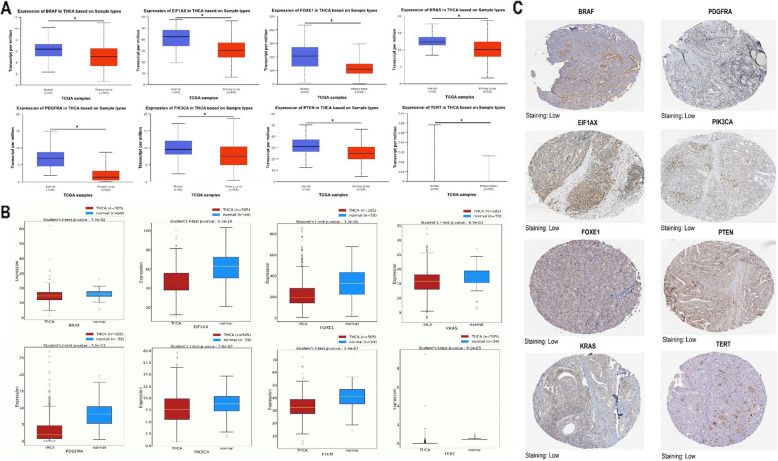
The expression validation of BRAF, EIF1 AX, FOXE1, KRAS, PDGFRA, PIK3 CA, PTEN, and TERT genes in thyroid cancer cohorts was performed utilizing three different databases: UALCA, OncoDB, and the HPA. The results showed that for all the genes analyzed (BRAF, EIF1 AX, FOXE1, KRAS, PDGFRA, PIK3 CA, PTEN, TERT), there was a general trend of significantly (p-value < 0.05) lower expression levels in thyroid cancer samples compared to normal tissues. Boxplots displaying the transcript levels per million for each gene in normal (blue) and thyroid cancer (red) samples from the UALCAN and OncoDB databases illustrated this trend (Fig. 3A-B). Additionally, immunohistochemical staining images for the same set of genes in thyroid cancer tissues, obtained from the HPA database, showed low staining intensity for all genes (Fig. 3C). This suggests that the protein expression levels of these genes were also down-regulated in thyroid cancer patients.
Promoter methylation validation using additional cohorts
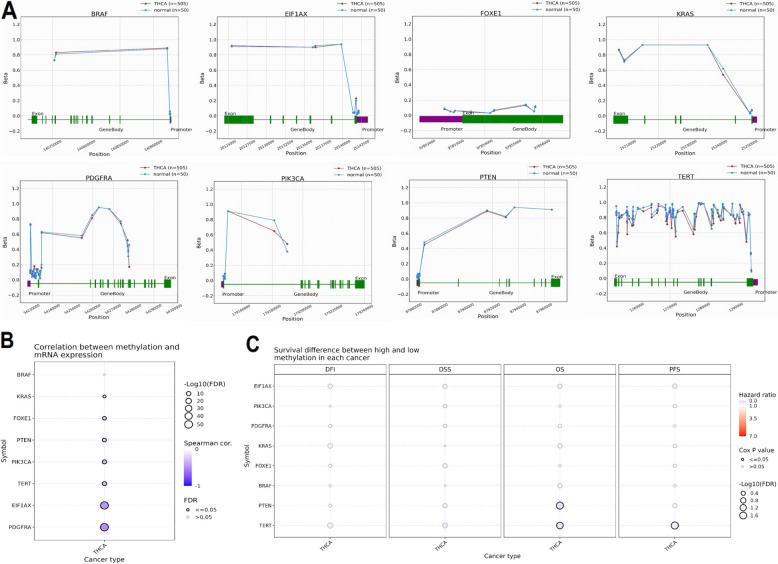
The comprehensive validation analysis of promoter methylation and its effects on gene expression and survival in thyroid cancer was conducted using data from the OncoDB and GSCA databases. Results from the OncoDB database indicated that BRAF, EIF1 AX, FOXE1, KRAS, PDGFRA, PIK3 CA, PTEN, and TERT genes exhibited significantly (p-value < 0.05) higher beta values, indicating increased promoter methylation in thyroid cancer samples compared to normal tissues (Fig. 4A). The GSCA database revealed a negative correlation between promoter methylation and mRNA expression for these genes, suggesting that hypermethylation leads to gene silencing (Fig. 4B). Additionally, analysis of survival metrics showed that higher methylation levels were associated with poorer survival outcomes, emphasizing the potential of promoter methylation as a prognostic biomarker in thyroid cancer (Fig. 4C). These findings highlight the significant role of epigenetic modifications in gene regulation and their prognostic implications in thyroid cancer.
Genetic alteration analysis
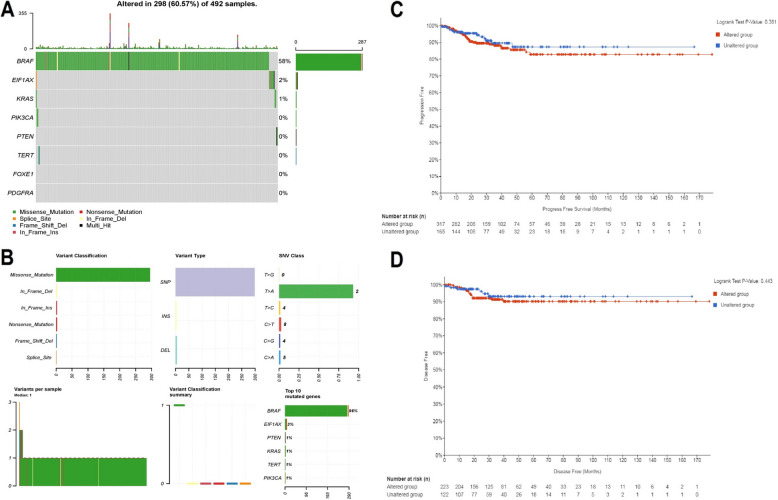
A comprehensive analysis of genetic alterations in BRAF, EIF1 AX, FOXE1, KRAS, PDGFRA, PIK3 CA, PTEN, and TERT genes and their impact on survival outcomes was performed in a cohort of 492 thyroid cancer samples using the cBioPortal database. In total, 60.57% (298 out of 492) of the samples exhibited genetic mutations, with BRAF mutations being the most prevalent, found in 58% of the samples (Fig. 5A). Other genes, including EIF1 AX, KRAS, PIK3 CA, PTEN, TERT, FOXE1, and PDGFRA, showed alterations in 2% or fewer samples (Fig. 5A). The mutations were categorized into SNPs (single nucleotide polymorphisms), insertions (INS), and deletions (DEL), with SNPs being the most common. The SNV (single nucleotide variant) class distribution revealed that C > T transitions were particularly prevalent (Fig. 5B). These mutations, especially in key genes like BRAF and KRAS, are known to affect critical signaling pathways involved in cell proliferation, apoptosis, and tumorigenesis. For instance, BRAF mutations, particularly the V600E variant, lead to the activation of the MAPK/ERK pathway, contributing to uncontrolled cell growth and resistance to apoptosis. Similarly, mutations in KRAS often result in the constitutive activation of the RAS/MAPK pathway, which is implicated in several cancer types. Alterations in genes such as PIK3 CA and PTEN affect the PI3 K/AKT pathway, which regulates cell survival, growth, and metabolism. Kaplan–Meier curves comparing progression-free survival (PFS) and disease-free survival (DFS) between samples with genetic alterations (altered group) and those without (unaltered group) showed no significant differences, with Logrank test p-values of 0.361 for PFS and 0.443 for DFS, indicating no significant survival advantage or disadvantage associated with the presence of genetic alterations in this cohort of thyroid cancer patients (Fig. 5C-D).
Survival analysis
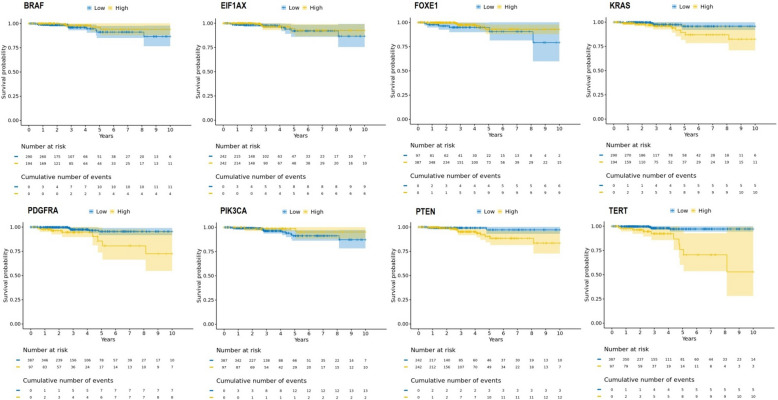
The Kaplan–Meier survival analysis of BRAF, EIF1 AX, FOXE1, KRAS, PDGFRA, PIK3 CA, PTEN, and TERT genes, comparing survival probabilities between high and low expression groups across thyroid cancer patients was conducted using cSurvival database. For most genes (EIF1 AX, FOXE1, KRAS, PDGFRA, PTEN, and TERT), survival curves show no significant difference between high and low expression, with similar numbers of patients at risk and cumulative events (Fig. 6). However, BRAF and PIK3 CA exhibit some differences. Lower expression of BRAF and PIK3 CA shows a notable separation, with lower expression linked to a significantly (p-value < 0.05) lower overall survival probability and higher cumulative events (Fig. 6). These findings indicate that, for the majority of genes analyzed, no meaningful survival differences were observed, and conclusions drawn from these analyses should be interpreted with caution. Further investigation may be needed to confirm these trends (Fig. 6).
Correlation analysis of BRAF, EIF1 AX, FOXE1, KRAS, PDGFRA, PIK3 CA, PTEN, and TERT expression with immune modulators genes and immune subtypes of thyroid cancer
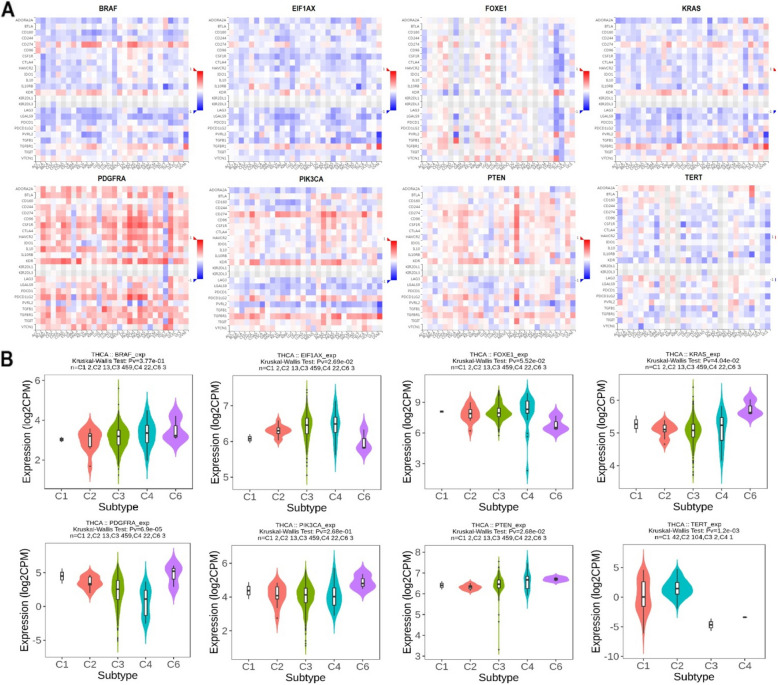
Correlation analysis of BRAF, EIF1 AX, FOXE1, KRAS, PDGFRA, PIK3 CA, PTEN, and TERT expression with immune modulator genes and immune subtypes of thyroid cancer was conducted using the TISIDB database. Heatmap analysis revealed mixed correlations between these genes and various immune modulator genes, suggesting that these genes may be involved in the down-regulation of key immune modulator genes in thyroid cancer (Fig. 7A). Additionally, violin plots comparing the expression levels of these genes across different immune subtypes of thyroid cancer (C1 to C6) indicated significant expression differences. Notably, BRAF expression was higher in subtypes C3 and C4, while TERT showed elevated expression in subtypes C1 and C2 (Fig. 7B). These expression patterns emphasize the potentially diverse roles that BRAF, TERT, and other genes may play in shaping the immune landscape of different thyroid cancer subtypes, potentially influencing immune evasion and response.
Single-cell sequencing data analyses
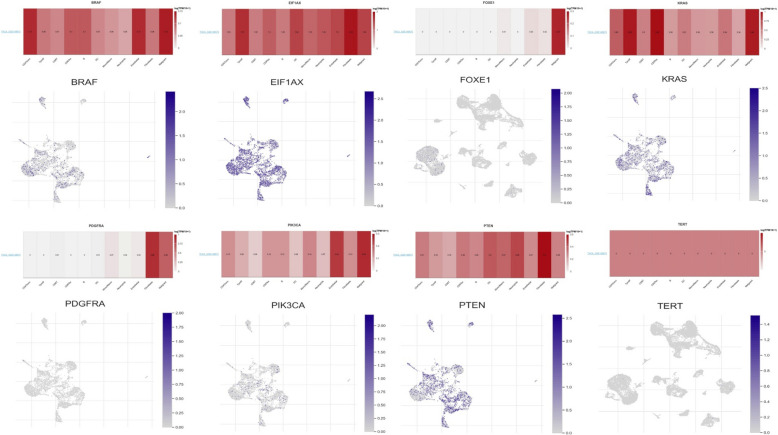
The expressions of BRAF, EIF1 AX, FOXE1, KRAS, PDGFRA, PIK3 CA, PTEN, and TERT in immune cells within thyroid cancer were analyzed using the TISCH2 database. The results revealed significant increases in the expression of BRAF, EIF1 AX, KRAS, PIK3 CA, and TERT genes across all types of immune cells in thyroid cancer, indicating their variability and potential regulatory roles in the immune microenvironment (Fig. 8). In contrast, FOXE1 and PDGFRA exhibited significantly higher expression only in a limited number of immune cell types (Fig. 8). These findings suggest that BRAF, EIF1 AX, KRAS, PIK3 CA, and TERT genes are critical in modulating the immune microenvironment of thyroid cancer cells, potentially influencing immune response and tumor progression.
miRNA-mRNA network construction and analysis
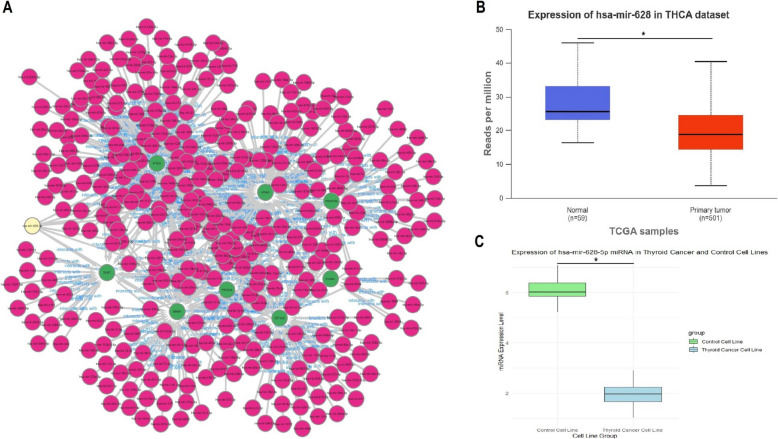
The miRNA-mRNA network for PTEN, KRAS, PDGFRA, FOXE1, PIK3 CA, BRAF, TERT, and EIF1 AX genes was constructed using the miRNET database. The PPI network in Fig. 9A illustrates miRNAs targeting these eight genes, highlighting hsa-mir- 628 – 5p as a key miRNA that targets all of them simultaneously. The genes, shown in green, are connected to numerous miRNAs (in red), with hsa-mir- 628 – 5p standing out for its unique role in potentially regulating the expression of all eight genes, indicating its significant regulatory function in thyroid cancer (Fig. 9A). Expression analysis of hsa-mir- 628 – 5p was performed using the UALCAN platform and RT-qPCR. The UALCAN data, derived from TCGA, revealed a significant (p-value < 0.05) down-regulation of hsa-mir- 628 – 5p in primary thyroid tumor samples compared to normal tissues, as shown in the box plot (Fig. 9B). Similarly, the RT-qPCR results for thyroid cancer cell lines also demonstrated a significant (p-value < 0.05) down-regulation of hsa-mir- 628 – 5p when compared to control cell lines, further corroborating the findings from the TCGA data (Fig. 9C). These results suggest that hsa-mir- 628 – 5p plays a critical role in the regulation of the targeted genes in thyroid cancer.
Gene enrichment analysis
Gene enrichment analysis of PTEN, KRAS, PDGFRA, FOXE1, PIK3 CA, BRAF, TERT, and EIF1 AX genes was conducted using the DAVID database. The analysis revealed strong enrichment in various cellular components, molecular functions, biological processes, and pathways associated with these genes. In terms of cellular components (Fig. 10A), the genes showed significant enrichment in the"RNA-directed RNA polymerase complex,"multiple phosphatidylinositol 3-kinase complexes (Class IB, IA, and Class I), and the telomere cap complex, indicating their roles in key cellular structures and functions. The molecular functions (Fig. 10B) associated with these genes demonstrated significant enrichment in activities like"platelet-derived growth factor-activated receptor activity,""telomerase activity,""RNA-directed DNA polymerase activity,"and"vascular endothelial growth factor receptor activity."These functions point to their involvement in cellular signaling, growth regulation, and DNA synthesis.
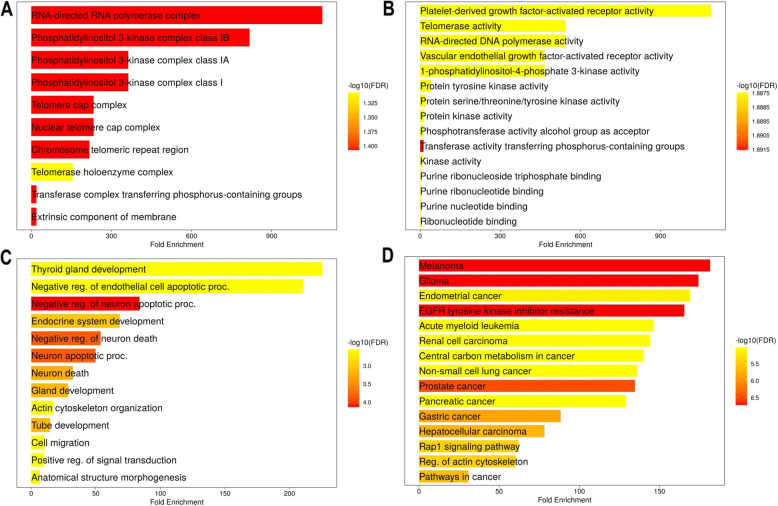
The biological processes (Fig. 10C) highlighted in the analysis showed that these genes are involved in"thyroid gland development,""negative regulation of endothelial cell and neuron apoptotic processes,"and"endocrine system development,"suggesting their roles in tissue development and apoptosis regulation in thyroid cancer. Additionally, the genes were significantly enriched in several cancer-related pathways (Fig. 10D), particularly in"melanoma,""glioma,""endometrial cancer,""EGFR tyrosine kinase inhibitor resistance,"and other cancers such as"acute myeloid leukemia,""renal cell carcinoma,"and"non-small cell lung cancer."These pathways emphasize the potential role of these genes in various cancer types, particularly thyroid cancer.
Correlation analysis of PTEN, KRAS, PDGFRA, FOXE1, PIK3 CA, BRAF, TERT, and EIF1 AX genes with diverse functional states, immune cells, and drug sensitivity in thyroid cancer
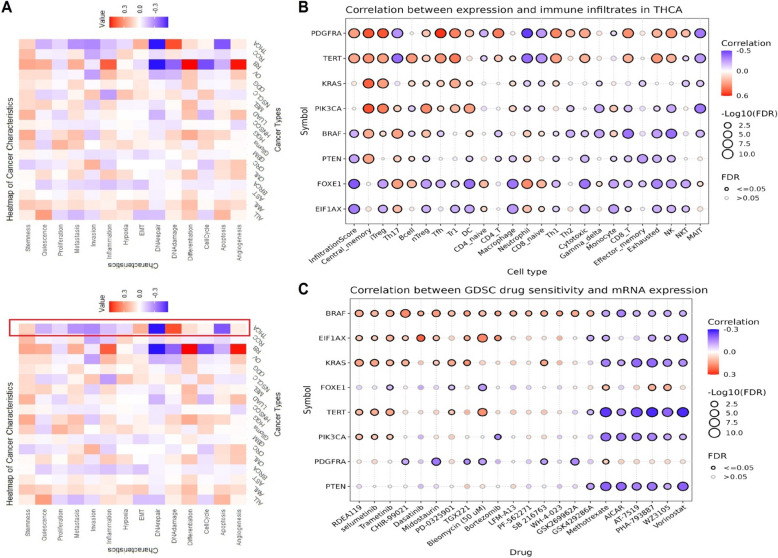
Initial exploration of correlations between the expression of PTEN, KRAS, PDGFRA, FOXE1, PIK3 CA, BRAF, TERT, and EIF1 AX genes and 14 diverse functional states of thyroid cancer was performed using the CancerSEA database. The heatmaps in Fig. 11A-B showed the correlations between these gene expressions and various functional states, including angiogenesis, cell cycle, differentiation, DNA damage, epithelial-mesenchymal transition (EMT), and stemness. The results revealed that these genes were positively correlated withsome of these functional states across thyroid cancer samples, suggesting their involvement in critical processes such as tumor progression and metastasis (Fig. 11A). Further analysis through the GSCA database (Fig. 11B) explored the correlation between gene expression and immune cell infiltrates in thyroid cancer. Each dot in the plot represented the correlation between a specific gene and a particular type of immune cell. The results indicated that the genes were predominantly positively correlated with immune cells, implying their potential role in modulating the immune landscape of thyroid cancer. For example, KRAS and TERT exhibited strong positive correlations with immune cell types, including CD8 T, iTreg, and Tr1 cells, suggesting their involvement in the immune response within the tumor microenvironment (Fig. 11B). Additionally, Fig. 11C presented correlations between gene expression and drug sensitivity data from the GDSC dataset. The down-regulation of PTEN, KRAS, PDGFRA, FOXE1, PIK3 CA, BRAF, TERT, and EIF1 AX was found to be associated with resistance to several key drugs. Notably, BRAF expression showed strong resistance to drugs like RDEA119 and selumetinib, both of which targeted BRAF mutations, indicating the potential impact of these genetic alterations on treatment efficacy (Fig. 11C).
Induction of BRAF overexpression in SW579 cells and functional assays
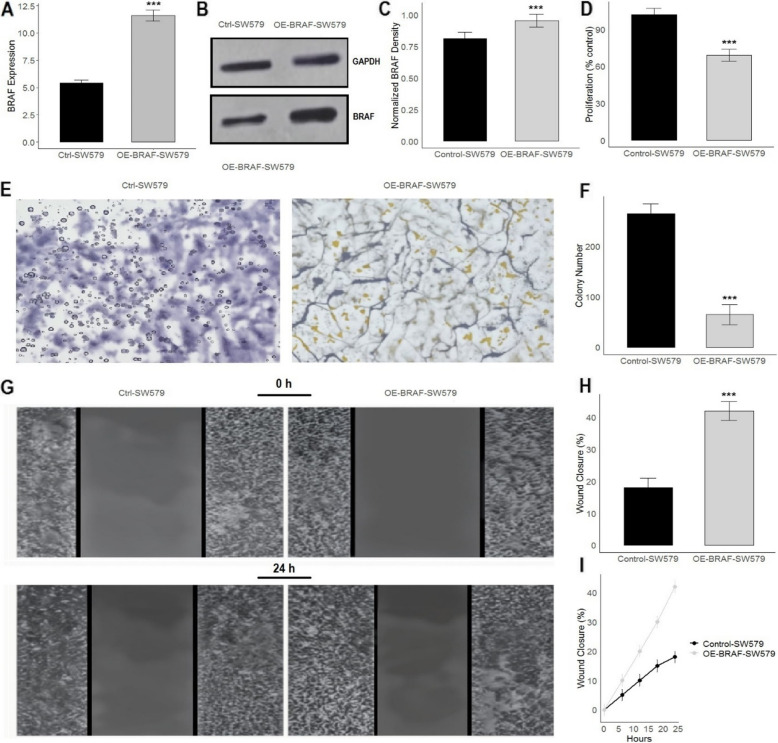
The data presented in Fig. 12 provided a comprehensive analysis of the impact of BRAF overexpression in SW579 cells, which was achieved by expression vectors. Figure 12A illustrated that the BRAF expression levels in OE-BRAF-SW579 cells were significantly (p-value < 0.001) higher than in control cells, confirming successful overexpression at the mRNA level. This finding was corroborated by the Western blot analysis shown in Fig. 12B and supplementary data Fig. 1, which demonstrated a substantial (p-value < 0.001) increase in BRAF protein levels in OE-BRAF-SW579 cells compared to control cells. The quantification of this increase was depicted in Fig. 12C, where the normalized BRAF density was markedly (p-value < 0.001) higher in the overexpressing cells. Figure 12D revealed that OE-BRAF-SW579 cells exhibited significantly (p-value < 0.001) reduced proliferation rates compared to control cells. This suggested that elevated BRAF levels might negatively impact cell division. These outcomes were further supported by the results of the colony formation assay shown in Fig. 12E and F, where OE-BRAF-SW579 cells formed significantly (p-value < 0.001) fewer and smaller colonies, indicating a diminished capacity for long-term proliferation and survival. The effects of BRAF overexpression also extended to cell migration, as demonstrated by the wound healing assay in Figs. 12G, H, and I. Images taken at 0 and 24 h (Fig. 12G) showed that wound closure was considerably higher in OE-BRAF-SW579 cells than in control cells. The quantitative analysis in Fig. 12H highlighted a significant (p-value < 0.001) increase in wound closure percentage in the BRAF overexpressing cells after 24 h. The time-course analysis in Fig. 12I further confirmed this trend, with OE-BRAF-SW579 cells displaying consistently higher wound closure rates over the entire observation period.
Discussion
Thyroid cancer, the most common malignancy of the endocrine system, has seen rising incidence rates globally [ref. 36, ref. 37]. Despite advancements in diagnostic and therapeutic strategies [ref. 38–ref. 40], the molecular mechanisms underlying thyroid cancer remain inadequately understood, necessitating comprehensive studies to elucidate these pathways. In particular, genes such as BRAF, EIF1 AX, FOXE1, KRAS, PDGFRA, PIK3 CA, PTEN, and TERT have been implicated in both thyroid cancer and autoimmune conditions like HT, where dysregulation of these genes can contribute to chronic inflammation and subsequent tumorigenesis. Understanding the expression, methylation, and genetic alterations of these genes can uncover critical insights into thyroid cancer pathogenesis and potential therapeutic targets [ref. 41–ref. 43].
Our study reveals that the expression levels of BRAF, EIF1 AX, FOXE1, KRAS, PDGFRA, PIK3 CA, PTEN, and TERT are significantly down-regulated in thyroid cancer cell lines compared to controls. The ROC curves for these genes exhibit high sensitivity and specificity, with AUC values ranging from 0.93 to 0.99, suggesting their strong potential as diagnostic biomarkers. BRAF and KRAS are critical components of the MAPK/ERK and PI3 K/AKT signaling pathways, and their down-regulation can cause compensatory changes that lead to aberrant cell behavior and tumorigenesis [ref. 44–ref. 46]. EIF1 AX, involved in protein synthesis, when down-regulated, can impair cellular homeostasis and stress responses, favoring oncogenic mutations [ref. 47, ref. 48]. FOXE1, essential for thyroid differentiation, when down-regulated, can result in undifferentiated, proliferative cells [ref. 49]. PDGFRA and PIK3 CA, both important for cell growth and survival signaling, when down-regulated, can disrupt these pathways, promoting cancer through alternative oncogenic mechanisms [ref. 50, ref. 51]. PTEN, a tumor suppressor, when down-regulated, leads to increased PI3 K/AKT pathway activity, enhancing cell survival and proliferation [ref. 52]. Lastly, TERT, crucial for telomere maintenance, when down-regulated, can cause genomic instability, driving oncogenic transformation [ref. 53]. Collectively, these gene down-regulations create a cellular environment characterized by uncontrolled proliferation, evasion of apoptosis, and genomic instability, contributing to the development of thyroid cancer.
Our promoter methylation analysis via bisulfite sequencing indicates increased promoter methylation of these genes in thyroid cancer cell lines compared to controls, which correlates with their down-regulated expression. This hypermethylation-driven gene silencing supports the notion that epigenetic modifications play a crucial role in thyroid cancer [ref. 54, ref. 55]. Previous studies on thyroid cancer epigenetics have shown that promoter hypermethylation plays a critical role in the down-regulation of tumor suppressor genes and other key regulators [ref. 56, ref. 57]. Our findings are consistent with these reports, highlighting the widespread promoter methylation across several genes, including BRAF, EIF1 AX, FOXE1, KRAS, PDGFRA, PIK3 CA, PTEN, and TERT, in thyroid cancer cell lines. Previous research has identified similar methylation patterns, particularly in genes such as BRAF [ref. 58], which is known to be involved in thyroid carcinogenesis through activation of the MAPK signaling pathway. Additionally, studies have reported that PIK3 CA, TERT, and KRAS genes often exhibit methylation-mediated silencing in various cancer types [ref. 59–ref. 61], including thyroid cancer, contributing to the development of a malignant phenotype. These findings reinforce the idea that promoter hypermethylation is a frequent and significant mechanism of gene expression repression in thyroid cancer, potentially serving as both a marker for disease progression and a target for therapeutic intervention.
Our analysis of genetic alterations revealed a high prevalence of BRAF mutations, present in 58% of the thyroid cancer samples, with other genes showing mutations in 2% or fewer samples. These alterations did not significantly impact progression-free or disease-free survival, which is consistent with findings from other studies, such as Romei et al., who reported that BRAF mutations are common but not necessarily prognostic in thyroid cancer [ref. 62]. Clinically, the presence of BRAF mutations in thyroid cancer has important implications for treatment strategies. In cases of advanced or metastatic BRAF-mutant thyroid cancer, targeted therapies such as BRAF inhibitors (e.g., vemurafenib and dabrafenib) and MEK inhibitors (e.g., trametinib) have shown promise in clinical trials, offering a therapeutic option for patients with refractory disease [ref. 63, ref. 64]. However, the clinical relevance of BRAF mutations as a standalone marker for treatment selection remains under investigation. Current treatment protocols for thyroid cancer primarily rely on surgery, radioactive iodine therapy, and thyroid hormone suppression, with targeted therapies considered for patients with progressive or iodine-refractory disease Kaplan–Meier survival analysis indicated that lower expression of BRAF and PIK3 CA is associated with poorer overall survival, while other genes did not show significant differences. This suggests that BRAF and PIK3 CA could be potential prognostic biomarkers. These results are in line with the study by Harahap et al., which also identified BRAF and PIK3 CA as key prognostic markers in cancer patients [ref. 65].
Our correlation analysis using the TISIDB database shows significant mixed correlations between the studied genes and various immune modulators. Additionally, these genes exhibited differential expression across immune subtypes of thyroid cancer, highlighting their diverse roles in the immune landscape. These findings suggest that these genes may influence immune responses in thyroid cancer, as supported by studies like those of Liotti et al. (2020), which explored the immunological aspects of thyroid cancer [ref. 66]. Analysis of single-cell sequencing data revealed that BRAF, EIF1 AX, KRAS, PIK3 CA, and TERT are significantly up-regulated in various immune cells within thyroid cancer, underscoring their potential regulatory roles in the immune microenvironment.
Our predicted miRNA-mRNA network via miRNET database identified hsa-mir- 628 – 5p as a key regulator, targeting all eight critical genes, which were significantly down-regulated in thyroid cancer. This miRNA may play a central role in coordinating the expression of these genes, as suggested by similar studies, such as those by Guo et al. [ref. 67]. Our correlation analysis showed positive correlations of BRAF, EIF1 AX, FOXE1, KRAS, PDGFRA, PIK3 CA, PTEN, and TERT genes with various functional states of thyroid cancer, including angiogenesis, cell cycle, and DNA damage. Additionally, these genes positively correlated with immune cell infiltrates and drug resistance, suggesting their roles in tumor progression and therapeutic responses.
Conclusion
In summary, our comprehensive study emphasizes the clinical significance of BRAF, EIF1 AX, FOXE1, KRAS, PDGFRA, PIK3 CA, PTEN, and TERT in thyroid cancer. The down-regulation and hypermethylation of these genes highlight their potential as diagnostic and prognostic biomarkers. Furthermore, their interactions with immune modulators and involvement in key cancer pathways provide insights into the molecular mechanisms underlying thyroid cancer, paving the way for potential therapeutic strategies. Future research should focus on further elucidating the mechanistic roles of these genes and their interactions within the tumor microenvironment, as well as developing targeted therapies to improve patient outcomes. Future research should focus on validating these findings in larger and more diverse clinical cohorts to confirm the relevance of these biomarkers in real-world clinical settings. This could include investigating their role in different subtypes of thyroid cancer, as well as their potential to guide personalized treatment approaches. Furthermore, exploring therapeutic interventions targeting the pathways associated with these genes, such as BRAF inhibitors for BRAF-mutant thyroid cancers, or epigenetic modulators for reversing the hypermethylation of tumor suppressor genes, may offer promising avenues for improving patient outcomes.
Supplementary Materials
References
- J Huang, CH Ngai, Y Deng, CN Pun, V Lok, L Zhang. Incidence and mortality of thyroid cancer in 50 countries: a joinpoint regression analysis of global trends. Endocrine, 2023. [DOI | PubMed]
- S Hu, X Wu, H Jiang. Trends and projections of the global burden of thyroid cancer from 1990 to 2030. J Global Health, 2024. [DOI]
- D Sonkin, A Thomas, BA Teicher. Cancer treatments: Past, present, and future. Cancer Genet, 2024. [DOI | PubMed]
- CD Seib, JA Sosa. Evolving understanding of the epidemiology of thyroid cancer. Endocrinol Metab Clin, 2019. [DOI]
- A Miranda-Filho, J Lortet-Tieulent, F Bray, B Cao, S Franceschi, S Vaccarella. Thyroid cancer incidence trends by histology in 25 countries: a population-based study. Lancet Diabetes Endocrinol, 2021. [DOI | PubMed]
- D Bradley. Obesity, thyroid nodularity, and thyroid cancer: epiphenomenon or cause?. J Clin Endocrinol Metab, 2020. [DOI | PubMed]
- YC Hsu, SYH Cheng, MN Chien, SP Cheng. Impact of social and economic factors on global thyroid cancer incidence and mortality. Eur Arch Oto Rhino Laryngol, 2023. [DOI]
- 8.Health Commission Of The People’s Republic Of China N. National guidelines for diagnosis and treatment of thyroid cancer 2022 in China (English version). Chin J Cancer Res. 2022;34(3):131–50.
- SA Wells, SL Asa, H Dralle, R Elisei, DB Evans, RF Gagel. Revised American thyroid association guidelines for the management of medullary thyroid carcinoma. Thyroid, 2015. [DOI | PubMed]
- M Fiore, G Oliveri Conti, R Caltabiano, A Buffone, P Zuccarello, L Cormaci. Role of emerging environmental risk factors in thyroid cancer: a brief review. Int J Environ Res Public Health, 2019. [DOI | PubMed]
- MA Abdel-Maksoud, S Ullah, A Nadeem, A Shaikh, MK Zia, AM Zakri. Unlocking the diagnostic, prognostic roles, and immune implications of BAX gene expression in pan-cancer analysis. Am J Transl Res, 2024. [DOI | PubMed]
- L Huang, S Irshad, U Sultana, S Ali, A Jamil, A Zubair. Pan-cancer analysis of HS6ST2: associations with prognosis, tumor immunity, and drug resistance. Am J Transl Res, 2024. [DOI | PubMed]
- B Xu, RA Ghossein. Advances in thyroid pathology: high grade follicular cell-derived thyroid carcinoma and anaplastic thyroid carcinoma. Adv Anat Pathol, 2023. [DOI | PubMed]
- Y Gao, C Wang, K Wang, C He, K Hu, M Liang. The effects and molecular mechanism of heat stress on spermatogenesis and the mitigation measures. Syst Biol Reprod Med, 2022. [DOI | PubMed]
- R Paparodis, S Imam, K Todorova-Koteva, A Staii, JC Jaume. Hashimoto’s thyroiditis pathology and risk for thyroid cancer. Thyroid, 2014. [DOI | PubMed]
- M Ralli, D Angeletti, M Fiore, V D’Aguanno, A Lambiase, M Artico. Hashimoto’s thyroiditis: An update on pathogenic mechanisms, diagnostic protocols, therapeutic strategies, and potential malignant transformation. Autoimmun Rev, 2020. [DOI | PubMed]
- M Cellini, MG Santaguida, C Virili, S Capriello, N Brusca, L Gargano. Hashimoto’s thyroiditis and autoimmune gastritis. Front Endocrinol, 2017. [DOI]
- L Liang, X Liang, X Yu, W Xiang. Bioinformatic analyses and integrated machine learning to predict prognosis and therapeutic response based on E3 ligase-related genes in colon cancer. J Cancer, 2024. [DOI | PubMed]
- T Bin, J Tang, B Lu, XJ Xu, C Lin, Y Wang. Construction of AML prognostic model with CYP2E1 and GALNT12 biomarkers based on golgi-associated genes. Ann Hematol, 2024. [DOI | PubMed]
- Y Hameed. Decoding the significant diagnostic and prognostic importance of maternal embryonic leucine zipper kinase in human cancers through deep integrative analyses. J Cancer Res Ther, 2023. [DOI | PubMed]
- J Wang, SF Gilani, N Noor, MR Ahmed, M Munazir, A Zubair. Decoding the DSCC1 gene as a pan-cancer biomarker in human cancers via comprehensive multi-omics analyses. Am J Transl Res, 2024. [DOI | PubMed]
- S Ghatak, RB Muthukumaran, SK Nachimuthu. A simple method of genomic DNA extraction from human samples for PCR-RFLP analysis. J Biomol Tech, 2013. [PubMed]
- AB Hummon, SR Lim, MJ Difilippantonio, T Ried. Isolation and solubilization of proteins after TRIzol extraction of RNA and DNA from patient material following prolonged storage. Biotechniques, 2007. [DOI | PubMed]
- DS Chandrashekar, B Bashel, SAH Balasubramanya, CJ Creighton, I Ponce-Rodriguez, B Chakravarthi. UALCAN: a portal for facilitating tumor subgroup gene expression and survival analyses. Neoplasia, 2017. [DOI | PubMed]
- M Luo, A Rehman, S Haque, S Izhar, F Perveen, M Haris. Thorough examination of the potential biological implications of the cuproptosis-related gene LIPT2 in the prognosis and immunotherapy in pan-cancer. Am J Transl Res, 2024. [DOI | PubMed]
- CJ Liu, FF Hu, GY Xie, YR Miao, XW Li, Y Zeng. GSCA: an integrated platform for gene set cancer analysis at genomic, pharmacogenomic and immunogenomic levels. Brief Bioinform, 2023. [DOI | PubMed]
- PJ Thul, C Lindskog. The human protein atlas: a spatial map of the human proteome. Protein Sci, 2018. [DOI | PubMed]
- G Tang, M Cho, X Wang. OncoDB: an interactive online database for analysis of gene expression and viral infection in cancer. Nucleic Acids Res, 2022. [DOI | PubMed]
- E Cerami, J Gao, U Dogrusoz, BE Gross, SO Sumer, BA Aksoy. The cBio cancer genomics portal: an open platform for exploring multidimensional cancer genomics data. Cancer Discov, 2012. [DOI | PubMed]
- F Jiang, S Ahmad, S Kanwal, Y Hameed, Q Tang. Key wound healing genes as diagnostic biomarkers and therapeutic targets in uterine corpus endometrial carcinoma: an integrated in silico and in vitro study. Hereditas, 2025. [DOI | PubMed]
- X Cheng, Y Liu, J Wang, Y Chen, AG Robertson, X Zhang. cSurvival: a web resource for biomarker interactions in cancer outcomes and in cell lines. Brief Bioinform, 2022. [DOI | PubMed]
- B Ru, CN Wong, Y Tong, JY Zhong, SSW Zhong, WC Wu. TISIDB: an integrated repository portal for tumor-immune system interactions. Bioinformatics, 2019. [DOI | PubMed]
- L Chang, G Zhou, O Soufan, J Xia. miRNet 2.0: network-based visual analytics for miRNA functional analysis and systems biology. Nucleic Acids Res, 2020. [DOI | PubMed]
- H Yuan, M Yan, G Zhang, W Liu, C Deng, G Liao. CancerSEA: a cancer single-cell state atlas. Nucleic Acids Res, 2019. [DOI | PubMed]
- BT Sherman, M Hao, J Qiu, X Jiao, MW Baseler, HC Lane. DAVID: a web server for functional enrichment analysis and functional annotation of gene lists (2021 update). Nucleic Acids Res, 2022. [DOI | PubMed]
- Y Li, J Piao, M Li. Secular trends in the epidemiologic patterns of thyroid cancer in China over three decades: an updated systematic analysis of global burden of disease study 2019 data. Front Endocrinol, 2021. [DOI]
- KL Yan, S Li, C-H Tseng, J Kim, DT Nguyen, NB Dawood. Rising incidence and incidence-based mortality of thyroid cancer in California, 2000–2017. J Clin Endocrinol Metab, 2020. [DOI]
- D-F Cao, X-Y Zhou, Q Guo, M-Y Xiang, M-H Bao, B-S He. Unveiling the role of histone deacetylases in neurological diseases: focus on epilepsy. Biomarker Res, 2024. [DOI]
- Y Chen, Y Deng, Y Li, Y Qin, Z Zhou, H Yang. Oxygen-independent radiodynamic therapy: radiation-boosted chemodynamics for reprogramming the tumor immune environment and enhancing antitumor immune response. ACS Appl Mater Interfaces, 2024. [DOI | PubMed]
- P Luo, Y Guo, Y He, C Wang. Clinical characteristics, treatment and outcome of pembrolizumab-induced acute pancreatitis. Invest New Drugs, 2024. [DOI | PubMed]
- W Fang, W Sun, W Fang, J Zhang, C Wang. Clinical features, treatment, and outcome of pembrolizumab induced cholangitis. Naunyn Schmiedebergs Arch Pharmacol, 2024. [DOI | PubMed]
- 42.Wang Y, Xu Y, Song J, Liu X, Liu S, Yang N, et al. Tumor cell-targeting and tumor microenvironment–responsive nanoplatforms for the multimodal imaging-guided photodynamic/photothermal/chemodynamic treatment of cervical cancer. International journal of nanomedicine. 2024:5837–58.
- Y Nie, D Li, Y Peng, S Wang, S Hu, M Liu. Metal organic framework coated MnO2 nanosheets delivering doxorubicin and self-activated DNAzyme for chemo-gene combinatorial treatment of cancer. Int J Pharm, 2020. [DOI | PubMed]
- S Lee, J Rauch, W Kolch. Targeting MAPK signaling in cancer: mechanisms of drug resistance and sensitivity. Int J Mol Sci, 2020. [DOI | PubMed]
- C Lliberos, G Richardson, A Papa. Oncogenic pathways and targeted therapies in ovarian cancer. Biomolecules, 2024. [DOI | PubMed]
- AM Rasteh, H Liu, P Wang. Pan-cancer genetic profiles of mitotic DNA integrity checkpoint protein kinases. Cancer Biomarkers, 2024. [PubMed]
- Q Chen, B Yang, N Nass, C Schatz, J Haybaeck. Impact of eukaryotic translation initiation factors on breast cancer: still much to investigate. Cancers, 2020. [DOI | PubMed]
- K Grafanaki, D Anastasakis, G Kyriakopoulos, I Skeparnias, S Georgiou, C Stathopoulos. Translation regulation in skin cancer from a tRNA point of view. Epigenomics, 2019. [DOI | PubMed]
- 49.Rurale G. Zebrafish as model system to study the role of the glis3 transcription factor in the pathogenesis of congenital hypothyroidism. 2019.
- X Zou, XY Tang, ZY Qu, ZW Sun, CF Ji, YJ Li. Targeting the PDGF/PDGFR signaling pathway for cancer therapy: a review. Int J Biol Macromol, 2022. [DOI | PubMed]
- Y Dong, L Jia, X Wang, X Tan, J Xu, Z Deng. Selective inhibition of PDGFR by imatinib elicits the sustained activation of ERK and downstream receptor signaling in malignant glioma cells. Int J Oncol, 2011. [PubMed]
- M Hu, S Zhu, S Xiong, X Xue, X Zhou. MicroRNAs and the PTEN/PI3K/Akt pathway in gastric cancer. Oncol Rep, 2019. [PubMed]
- F Dogan, NR Forsyth. Telomerase regulation: a role for epigenetics. Cancers, 2021. [DOI | PubMed]
- J Gallon, A Rodriguez-Calero, A Benjak, D Akhoundova, S Maletti, U Amstutz. DNA methylation landscapes of prostate cancer brain metastasis are shaped by early driver genetic alterations. Can Res, 2023. [DOI]
- A Lakshmanan, A Wojcicka, M Kotlarek, X Zhang, K Jazdzewski, SM Jhiang. microRNA-339-5p modulates Na+/I− symporter-mediated radioiodide uptake. Endocr Relat Cancer, 2015. [DOI | PubMed]
- A Botezatu, IV Iancu, A Plesa, D Manda, O Popa, M Bostan. Methylation of tumour suppressor genes associated with thyroid cancer. Cancer Biomark, 2019. [DOI | PubMed]
- S Sheikholeslami, M Zarif-Yeganeh, S Farashi, F Azizi, SK Kia, L Teimoori-Toolabi. Promoter methylation of tumor suppressors in thyroid carcinoma: a systematic review. Iran J Public Health, 2021. [PubMed]
- JW Yi, SY Ha, HG Jee, K Kim, SJ Kim, YJ Chai. Induction of the BRAFV600E mutation in thyroid cells leads to frequent hypermethylation. Clin Exp Otorhinolaryngol, 2022. [DOI | PubMed]
- WF Wang, Y Xie, ZH Zhou, ZH Qin, JC Wu, JK He. PIK3CA hypomethylation plays a key role in activation of the PI3K/AKT pathway in esophageal cancer in Chinese patients. Acta Pharmacol Sin, 2013. [DOI | PubMed]
- TJ Rowland, AJ Bonham, TR Cech. Allele-specific proximal promoter hypomethylation of the telomerase reverse transcriptase gene (TERT) associates with TERT expression in multiple cancers. Mol Oncol, 2020. [DOI | PubMed]
- BY Tew, JK Durand, KL Bryant, TK Hayes, S Peng, NL Tran. Genome-wide DNA methylation analysis of KRAS mutant cell lines. Sci Rep, 2020. [DOI | PubMed]
- C Romei, R Elisei. A narrative review of genetic alterations in primary thyroid epithelial cancer. Int J Mol Sci, 2021. [DOI | PubMed]
- M Cabanillas, A Patel, B Danysh, R Dadu, S Kopetz, G Falchook. BRAF inhibitors: experience in thyroid cancer and general review of toxicity. Hormones and Cancer, 2015. [DOI | PubMed]
- JN Sanchez, T Wang, MS Cohen. BRAF and MEK inhibitors: use and resistance in BRAF-mutated cancers. Drugs, 2018. [DOI | PubMed]
- WA Harahap, T Tofrizal, O Oktahermoniza. Relationship between the expression of BRAF V600E and Ki-67 with the recurrence of well-differentiated thyroid cancer. Asian Pac J Cancer Prev, 2022. [DOI | PubMed]
- 66.Liotti F, Prevete N, Vecchio G, Melillo RM. Recent advances in understanding immune phenotypes of thyroid carcinomas: prognostication and emerging therapies. F1000Res. 1000;28(8)
- F Guo, J Xue. MicroRNA-628-5p inhibits cell proliferation and induces apoptosis in colorectal cancer through downregulating CCND1 expression levels. Mol Med Rep, 2020. [PubMed]