Regulator of nonsense transcripts 3B is a prognostic biomarker and associated with immune cell infiltration in lung squamous cell and hepatocellular carcinoma
Abstract
Purpose:
The characteristic of RENT3B in cancer remains ambiguous. We aimed to study the relationship between RENT3B and immune infiltration in liver hepatocellular carcinoma (LIHC) and lung squamous cell carcinoma (LUSC).
Patients and methods:
We investigated the expression levels of RENT3B using ONCOMINE and TIMER databases, and assessed the interrelationship between RENT3B expression and survival using PrognoScan, GEPIA, and Kaplan–Meier plotter. Additionally, we examined the association between RENT3B and immune cells in the tumor microenvironment (TME), as well as markers of immune cells, using TIMER. Subsequently, we performed prognostic analysis based on the expression level of RENT3B within specific immune cell subgroups. Furthermore, we evaluated the promoter methylation profile of RENT3B between tumor and normal tissues in LIHC and LUSC using the DNMIVD database.
Results:
RENT3B exhibited increased levels in both in LIHC and LUSC. High RENT3B expression was associated with unfavorable prognosis in LIHC, whereas it indicated a beneficial prognosis in LUSC. In LIHC, the expression of RENT3B positively correlated with immune infiltration levels of B cells, CD4 + T cells, CD8 + T cells, neutrophils, macrophages, and dendritic cells. However, in LUSC, the expression of RENT3B showed a negative correlation with immune infiltration levels of B cells, CD8 + T cells, neutrophils, macrophages, and dendritic cells. RENT3B exhibited positive correlations with 42 immune markers in LIHC, while it displayed negative associations with 10 immune markers in LUSC. Despite variations in immune cell enrichment and reduction subgroups, high RENT3B expression consistently indicated poor prognosis in LIHC, whereas it remained favorable in LUSC. Additionally, there were no significant differences observed in RENT3B promoter methylation between tumor and normal tissues in both LIHC and LUSC.
Conclusion:
RENT3B can affect the overall tumor prognosis and is associated with immune infiltration, especially in LIHC and LUSC. Consequently, RENT3B can become a prognostic biomarker for LIHC and LUSC.
Supplementary Information:
The online version contains supplementary material available at 10.1007/s12672-024-01369-3.
Article type: Research Article
Keywords: RENT3B, Pan-cancer, Immune infiltration, Prognosis analysis
Affiliations: grid.33199.310000 0004 0368 7223Hepatic Surgery Center, Clinical Medicine Research Centre for Hepatic Surgery of Hubei Province, and Hubei Key Laboratory of Hepato-Pancreato-Biliary Diseases, Tongji Hospital, Tongji Medical College, Huazhong University of Science and Technology, Wuhan, Hubei 430030 People’s Republic of China; grid.33199.310000 0004 0368 7223Department of Internal Medicine, Union Hospital, Tongji Medical College, Huazhong University of Science and Technology, Wuhan, Hubei 430071 People’s Republic of China
License: © The Author(s) 2024 CC BY 4.0 Open Access This article is licensed under a Creative Commons Attribution 4.0 International License, which permits use, sharing, adaptation, distribution and reproduction in any medium or format, as long as you give appropriate credit to the original author(s) and the source, provide a link to the Creative Commons licence, and indicate if changes were made. The images or other third party material in this article are included in the article’s Creative Commons licence, unless indicated otherwise in a credit line to the material. If material is not included in the article’s Creative Commons licence and your intended use is not permitted by statutory regulation or exceeds the permitted use, you will need to obtain permission directly from the copyright holder. To view a copy of this licence, visit http://creativecommons.org/licenses/by/4.0/.
Article links: DOI: 10.1007/s12672-024-01369-3 | PubMed: 39331207 | PMC: PMC11436519
Relevance: Moderate: mentioned 3+ times in text
Full text: PDF (5.9 MB)
Introduction
The occurrence of tumors is intricately linked to the physiological state of cells and the stroma in the tumor microenvironment (TME). Moreover, tumor progression is heavily reliant on specific characteristics of the TME, which can significantly influence both prognosis and chemotherapy efficacy [ref. 1]. The tumor microenvironment encompasses a diverse array of cells, with infiltrating immune cells comprising a substantial proportion. These include T and B lymphocytes, natural killer cells, and tumor-associated macrophages [ref. 2]. While it has been conventionally believed that immune cells have anti-tumor effects, recent research has revealed a contrasting perspective. Immune cells that have infiltrated the tumor microenvironment can paradoxically aid in preventing cancer cell eradication while also contributing to cancer development [ref. 2, ref. 3]. For instance, tumor-associated macrophages (TAMs) can assist tumor cells through various mechanisms, including immune evasion, tumor angiogenesis, and metastasis [ref. 4–ref. 7]. The degree of immune infiltration exerts a crucial impact on tumor progression and patient prognosis. Considering the factors influencing immune infiltration, early identification of these factors may potentially delay tumor progression and enhance patient prognosis.
The RENT3B gene encodes a protein that is a component of a spliced multiprotein complex involved in the nuclear export of mRNA and mRNA monitoring. This protein binds to mRNA and remains bound after nuclear export, acting as a nuclear-cytoplasmic shuttle protein. mRNA monitoring plays a critical role in identifying mRNA with truncated open reading frames and initiating nonsense-mediated mRNA decay (NMD) process [ref. 8]. Most research on RENT3B has focused on NMD, with numerous studies exploring its association with diseases such as intellectual disability, autism, and schizophrenia [ref. 9–ref. 11]. However, there is a scarcity of studies investigating the involvement of RENT3B in tumor, particularly its relationship with immune infiltration. This article aims to provide a brief overview of the connection between RENT3B and tumor.
In the present study, we investigated the expression of RENT3B in various cancers using the ONCOMINE and Tumor Immune Estimation Resource (TIMER) databases. [ref. 12, ref. 13]Additionally, we explored the prognostic value of RENT3B expression in pan-cancer by utilizing the PrognoScan, GEPIA, and Kaplan–Meier plotters databases [ref. 14–ref. 17]. Notably, our analysis revealed distinct prognostic patterns of RENT3B in LIHC and LUSC. Furthermore, we examined the relationship between RENT3B and immune infiltration levels in these two tumor types using the TIMER database. Additionally, we investigated the promoter methylation profile of RENT3B in these cancers by analyzing the DNMIVD database [ref. 18]. Our findings suggest that RENT3B may significantly impact the prognosis of cancer patients through its interaction with immune cells within the tumor microenvironment.
Results
The mRNA expression level of RENT3B in pan-cancer
To investigate the alteration of RENT3B expression levels in various cancers, we conducted an analysis of RENT3B mRNA expression using the ONCOMINE database. Our results revealed that compared to the control group, RENT3B expression was upregulated in Medullary Breast Carcinoma, Ductal Breast Carcinoma, Cervical Cancer, Colorectal Cancer, Esophageal Squamous Cell Carcinoma, Gastric Cancer, Leukemia, Liver Cancer, Lung Cancer, Lymphoma, Other Cancer (Vulvar Intraepithelial Neoplasia, Embryonal Carcinoma, Mixed Germ Cell Tumor), Ovarian Serous Cystadenocarcinoma, Pancreatic Cancer, and Sarcoma. Conversely, RENT3B was downregulated in Invasive Breast Carcinoma, Esophageal Adenocarcinoma, Barrett’s Esophagus, Other Cancer (Yolk Sac Tumor), and Ovarian Carcinoma (Fig. 1A). The detailed changes in RENT3B expression across pan-cancer are summarized in Supplementary Table 1.
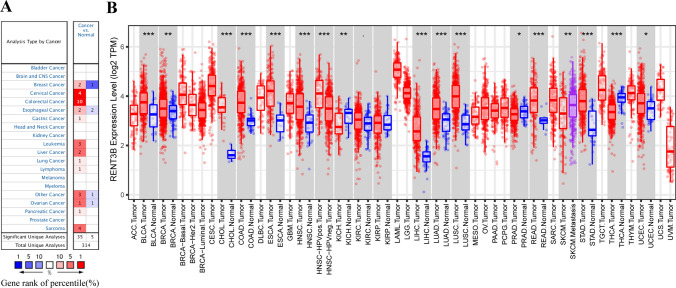
Furthermore, we analyzed the RNA-seq data of malignant tumors from TCGA in the TIMER database to gain a deeper understanding of RENT3B expression in different tumors and healthy tissues. The results of different expression patterns of RENT3B in pan-cancer are shown in Fig. 1B. High expression of RENT3B was observed in BRCA (Breast invasive carcinoma), CHOL (Cholangiocarcinoma), BLCA (Bladder Urothelial Carcinoma), ESCA (Esophageal carcinoma), COAD (Colon adenocarcinoma), HNSC (Head and Neck squamous cell carcinoma), HNSC-HPV positive (Head and Neck Squamous Carcinoma-HPV positive), LIHC, LUAD (Lung adenocarcinoma), STAD (Stomach adenocarcinoma), READ (Rectum adenocarcinoma), LUSC, and UCEC (Uterine Corpus Endometrial Carcinoma). Conversely, the expression of RENT3B was downregulated in KICH (Kidney Chromophobe), PRAD (Prostate adenocarcinoma), and THCA (Thyroid carcinoma). However, there were no significant changes detected in KIRC and KIRP (Kidney renal papillary cell carcinoma). Additionally, we observed variations in RENT3B expression levels among different subtypes of esophageal carcinoma, breast cancer, and ovarian cancer.
The prognosis of RENT3B in different cancers
We would like to further explore the correlation between RENT3B expression and prognosis in various tumor types to determine whether this gene acts as a promoter or inhibitor in different cancers. Initially, we assessed the correlation between RENT3B expression and prognosis in each cancer type using PrognoScan. The prognostic factors included overall survival (OS), disease-specific survival (DSS), recurrence-free survival (RFS), distant metastasis-free survival (DMFS), and disease-free survival (DRFS). The results indicated that RENT3B expression was significantly associated with eight types of cancers: blood tumor, brain cancer, breast cancer, colorectal cancer, lung cancer, ovarian cancer, skin cancer, and soft tissue tumor (Fig. 2). Among these, RENT3B had a poor prognosis in six cancer types: blood tumor (OS: HR = 2.43), brain cancer (OS: HR = 1.77), breast cancer (RFS: HR = 1.85; DSS: HR = 2.94; DMFS: HR = 1.95), colorectal cancer (OS: HR = 1.83; DSS: HR = 1.86), lung cancer (OS: HR = 1.92), and soft tissue tumor (DRFS: HR = 2.54). However, RENT3B had a favorable prognosis in three cancer types: blood tumor (DSS: HR = 0.323), ovarian cancer (OS: HR = 0.77), and skin cancer (OS: HR = 0.47). These results are summarized in Table 1. Moreover, in the GSE2658 dataset of blood tumor, two corresponding probes of the RENT3B gene showed diametrically opposite prognoses.
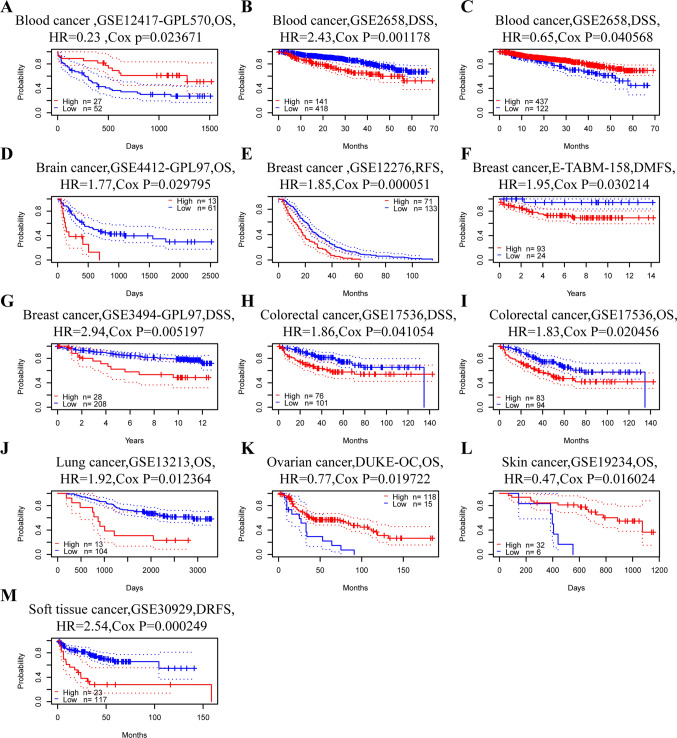
Table 1: Correlations between RENT3B expressions and prognoses in different cancers in PrognoScan database
| Cancer type | Dataset | Subtype | Endpoint | N | COX p-value | HR [95% CI-low CI-up] |
|---|---|---|---|---|---|---|
| Blood cancer | GSE2658 | Multiple myeloma | Disease Specific Survival | 559 | 1.1776E-03 | 2.43 [1.42–4.16] |
| GSE12417-GPL570 | AML | Overall Survival | 79 | 2.3671E-02 | 0.23 [0.06–0.82] | |
| GSE2658 | Multiple myeloma | Disease Specific Survival | 559 | 4.0568E-02 | 0.65 [0.43–0.98] | |
| Brain cancer | GSE4412-GPL97 | Glioma | Overall Survival | 74 | 2.9795E-02 | 1.77 [1.06–2.95] |
| Breast cancer | GSE12276 | Relapse Free Survival | 204 | 5.1252E-05 | 1.85 [1.37–2.49] | |
| GSE3494-GPL97 | Disease Specific Survival | 236 | 5.1971E-03 | 2.94 [1.38–6.26] | ||
| E-TABM-158 | Distant Metastasis Free Survival | 117 | 3.0214E-02 | 1.95 [1.07–3.55] | ||
| Colorectal cancer | GSE17536 | Overall Survival | 177 | 2.0456E-02 | 1.83 [1.10–3.06] | |
| GSE17536 | Disease Specific Survival | 177 | 4.1054E-02 | 1.86 [1.03–3.37] | ||
| Lung cancer | GSE13213 | Adenocarcinoma | Overall Survival | 117 | 1.2364E-02 | 1.92 [1.15–3.21] |
| Ovarian cancer | DUKE-OC | Overall Survival | 133 | 1.9722E-02 | 0.77 [0.61–0.96] | |
| Skin cancer | GSE19234 | Melanoma | Overall Survival | 38 | 1.6024E-02 | 0.47 [0.26–0.87] |
| Soft tissue cancer | GSE30929 | Liposarcoma | Distant Recurrence Free Survival | 140 | 2.4945E-04 | 2.54 [1.54–4.18] |
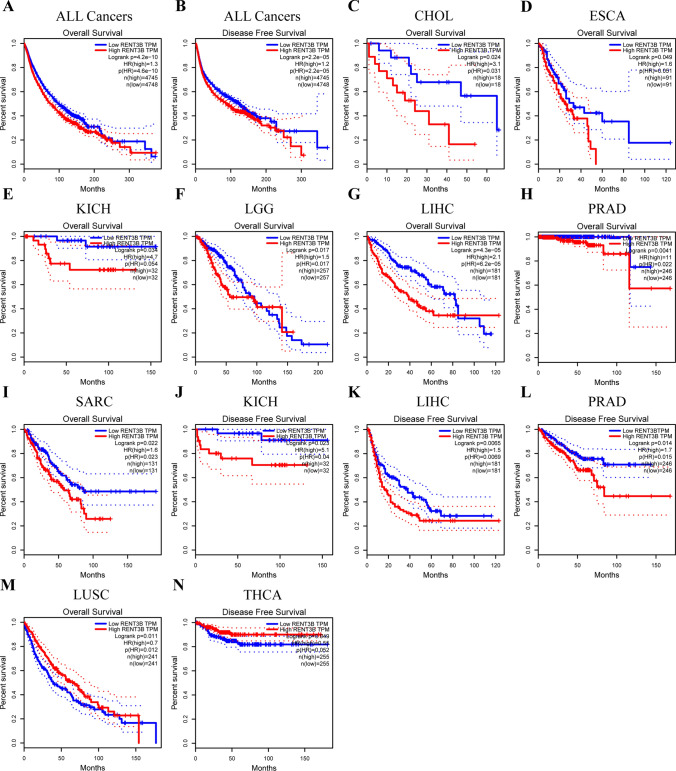
Subsequently, we used data from 33 cancer types in the TCGA database through GEPIA to investigate the relationship between RENT3B expression and OS and DFS separately. Overall, RENT3B was found to be an indicator of poor prognosis in most cancers (RENT3B, OS: n = 9493, HR = 1.3, log-rank p = 4.6e-10; DFS: n = 9502, HR = 1.2, log-rank p = 2.2e-05) (Fig. 3A, B). Specifically, high expression of RENT3B was associated with worse overall survival in CHOL, ESCA, KICH, LGG, LIHC, PRAD, and SARC, and worse disease-free survival in KICH, LIHC, and PRAD (Fig. 3C–L). On the contrary, high RENT3B expression indicated better overall survival in LUSC and better disease-free survival in THCA (Fig. 3M, N).
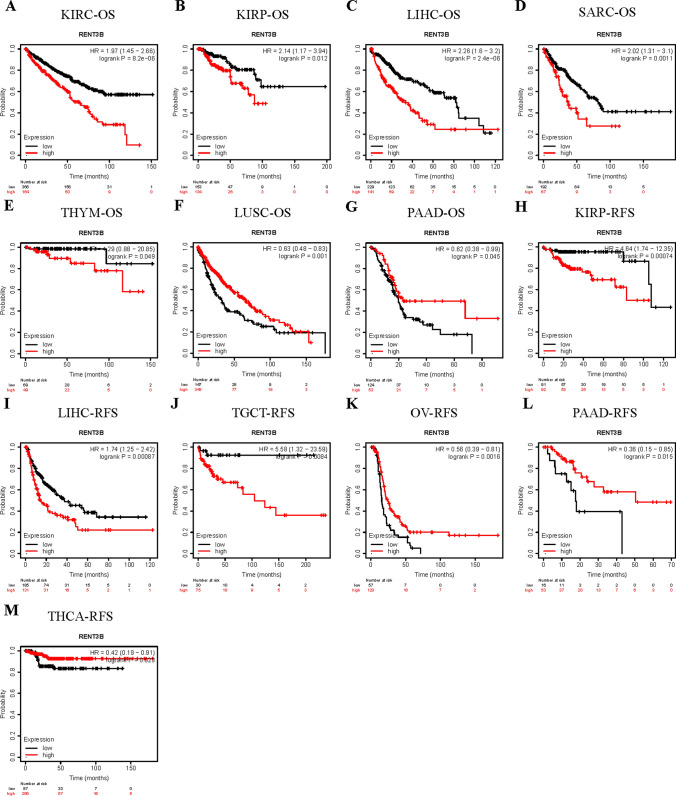
To further evaluate the survival association of RENT3B in various cancers, we utilized the Kaplan–Meier Plotter, which integrates data from the TCGA, EGA, and GEO databases. This analysis included OS and RFS in 21 cancer types. High expression of RENT3B was significantly associated with adverse overall survival in KIRC, KIRP, LIHC, SARC, THYM, and adverse recurrence-free survival in KIRP, LIHC, and TGCT (Fig. 4A–E, H–J). Conversely, high RENT3B expression indicated better overall survival in LUSC and PAAD, as well as better recurrence-free survival in OV, PAAD, and THCA (Fig. 4F, G, K–M). Notably, RENT3B exhibited no significant correlation with other cancer types.
Then, we have incorporated numerous prognostic indicators and conducted corresponding univariate and multivariate Cox analyses. For Liver Hepatocellular Carcinoma, the added prognostic indicators included age, Child–Pugh stage, Gender, histologic grade, liver cirrhosis, TNM stage, tumor stage, and vascular invasion. In the univariate Cox analysis, M stage, T stage, tumor stage, and RENT3B were identified as independent adverse prognostic factors (all Hazard Ratios [HRs] exceeded 1). Moreover, in the multivariate Cox analysis that combined these four factors, the HR of RENT3B continued to exceed 1 (Table 2). These dual analysis results collectively suggest a positive correlation between an elevated expression of RENT3B and an increased mortality risk among patients. In other words, as RENT3B expression rises, patient mortality risk proportionately increases. The prognostic indicators incorporated for LUSC include Age, EGFR mutation, EML4-ALK translocation, Gender, TNM stage, new tumor event, and Tumor stage. Univariate Cox analysis results indicate that M stage, T stage, new tumor event, and Tumor stage act as independent adverse prognostic factors, each with HRs exceeding 1. Interestingly, the HR of RENT3B is below 1 (HR = 0.769), suggesting that high RENT3B expression correlates with a positive prognosis. This is further confirmed by multivariate Cox analysis, which consistently identifies high RENT3B expression as a favorable prognostic factor (HR = 0.606) (Table 3). To conclude, an increase in RENT3B expression is associated with a higher risk of mortality in patients diagnosed with LIHC. However, this correlation is inverse for patients with LUSC as the risk of mortality decreases with an increase in RENT3B expression. This disparity further substantiates that RENT3B can serve as a valuable prognostic indicator, exhibiting varying outcomes in LIHC and LUSC.
Table 2: Univariate and Multivariate analyses of prognostic parameters in LIHC
| Prognostic parameters | Univariate analysis | Multivariate analysis | ||||
|---|---|---|---|---|---|---|
| HR | 95%CI | p value | HR | 95%CI | p value | |
| Age (≥ 60 vs. < 60) | 0.812 | 0.572–1.151 | 0.24201044 | NA | NA | NA |
| Child–Pugh stage (A vs. B + C) | 1.616 | 0.797–3.275 | 0.18293092 | NA | NA | NA |
| Gender (Male vs. Female) | 0.834 | 0.585–1.19 | 0.31769585 | NA | NA | NA |
| Histologic grade (G4 + G3 vs. G2 + G1) | 1.144 | 0.798–1.64 | 0.46481719 | NA | NA | NA |
| Liver cirrhosis (Yes vs. No) | 0.747 | 0.453–1.234 | 0.25460995 | NA | NA | NA |
| M stage (M1 vs. M0) | 3.889 | 1.223–12.367 | 0.02137948 | 2.633 | 0.782–8.8672 | 0.118052452 |
| N stage (N1 + N2 + N3 vs. N0) | 1.956 | 0.479–7.98 | 0.34990276 | NA | NA | NA |
| T stage (T3 + T4 vs. T2 + T1) | 2.549 | 1.79–3.631 | 2.17E-07 | 1.904 | 0.258–14.0615 | 0.527981969 |
| Tumor stage (IV + III vs. II + I) | 2.446 | 1.685–3.55 | 2.54E-06 | 1.362 | 0.185–10.0205 | 0.761271243 |
| Vascular invasion (Yes vs. No) | 1.323 | 0.871–2.008 | 0.18955356 | NA | NA | NA |
| RENT3B (High vs. Low) | 1.74 | 1.226–2.468 | 0.00191921 | 1.573 | 1.012–2.4445 | 0.044056531 |
Table 3: Univariate and Multivariate Analyses of prognostic parameters in LUSC
| Prognostic parameters | Univariate analysis | Multivariate analysis | ||||
|---|---|---|---|---|---|---|
| HR | 95% CI | p value | HR | 95% CI | p value | |
| Age (≥ 60 vs. < 60) | 0.791 | 0.534–1.172 | 0.242069843 | NA | NA | NA |
| EGFR mutation (Yes vs. No) | 1.078 | 0.526–2.211 | 0.837079897 | NA | NA | NA |
| EML4 ALK translocation (Yes vs. No) | 0.711 | 0.175–2.885 | 0.632672156 | NA | NA | NA |
| Gender (Male vs. Female) | 1.184 | 0.859–1.632 | 0.303570879 | NA | NA | NA |
| M stage (M1 vs. M0) | 3.107 | 1.269–7.605 | 0.013068581 | 3.128 | 0.911–10.7435 | 0.07001048 |
| N stage (N1 + N2 + N3 vs. N0) | 1.149 | 0.868–1.521 | 0.331827504 | NA | NA | NA |
| T stage (T3 + T4 vs. T2 + T1) | 1.705 | 1.233–2.357 | 0.001247179 | 1.567 | 0.912–2.6919 | 0.1036299 |
| New tumor event (Yes vs. No) | 2.593 | 1.866–3.605 | 1.42E-08 | 2.561 | 1.78–3.6826 | 3.95E-07 |
| Tumor stage (IV + III vs. II + I) | 1.566 | 1.136–2.159 | 0.006172146 | 0.938 | 0.519–1.6977 | 0.83366567 |
| RENT3B (High vs. Low) | 0.769 | 0.585–1.01 | 0.04880452 | 0.606 | 0.421–0.8739 | 0.00729772 |
Based on these findings, RENT3B generally served as a poor prognostic factor. In LIHC, the overall survival, disease-free survival, and recurrence-free survival associated with RENT3B were consistent with the overall results. However, we observed the opposite effect of RENT3B in LUSC, where it acted as a tumor suppressor. This discrepancy piqued our interest, leading us to select the RENT3B gene for further investigation in LIHC and LUSC.
The relationship between RENT3B expression and immune infiltration
Some previous studies have demonstrated the impact of immune cells in the tumor microenvironment on patients’ prognosis. Therefore, we aimed to investigate the potential association between RENT3B expression and immune infiltration in LIHC and LUSC. To determine the interrelationship between RENT3B expression and immune cells in the tumor microenvironment, we utilized the TIMER database. In LIHC, we observed an inverse correlation between RENT3B expression and B cell (R = 0.291, p = 9.97e-09), CD4 + T cell (R = 0.363, p = 4.53e-13), CD8 + T cell (R = 0.226, p = 1e-05), neutrophil (R = 0.378, p = 3.98e-14), macrophage (R = 0.387, p = 8.75e-15), and dendritic cell (R = 0.364, p = 3.85e-13) infiltration (Fig. 5A). Conversely, in LUSC, RENT3B showed a positive correlation with B cell (R = − 0.204, p = 4.12e-06), CD8 + T cell (R = − 0.276, p = 3.17e-10), neutrophil (R = − 0.313, p = 7.92e-13), macrophage (R = − 0.303, p = 4.31e-12), and dendritic cell (R = − 0.349, p = 9.79e-16) infiltration (Fig. 5B). These findings clearly indicate a direct relationship between RENT3B expression and immune infiltration in LIHC, whereas a negative relationship was observed in LUSC.
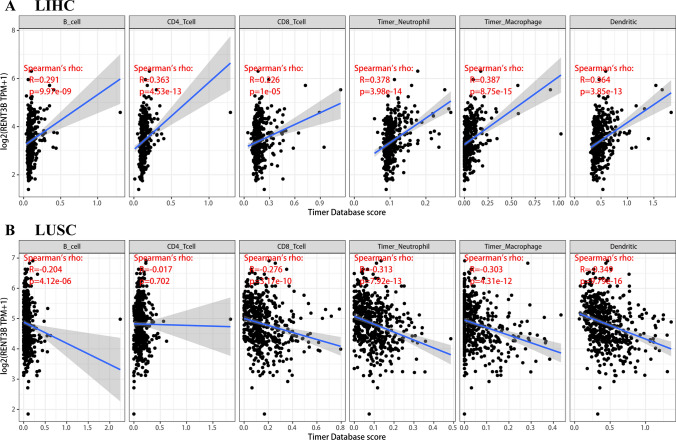
Based on our comprehensive analysis, it is evident that RENT3B influences patient prognosis by modulating immune infiltration in both LIHC and LUSC. This result provides a possible explanation for the unfavorable prognostic factor of RENT3B in LIHC and its favorable prognostic factor in LUSC.
Correlation between RENT3B and immune cell marker
We planned to investigate further the correlation between the expression of RENT3B and markers of various immune cells in the TIMER database. We selected 45 immune cell markers, involving 19 types of immune cells: B cell, CD8+ T cell, Thf, Th1, Th2, Th9, Th17, Th22, Treg, exhausted T cells, Macrophage, M1/M2 macrophage, Monocyte, TAM, NK, Neutrophil, DC.
RENT3B showed a significant correlation with almost all immune cell markers in LIHC, except NOS2 and FUT4. Among them, RENT3B was negatively correlated only with ARG1 in M2 and CD14 in Monocyte, and positively correlated with the rest. Importantly, these correlation results remained consistent even after considering tumor purity. Notably, there were strong positive correlation coefficients observed for CD38 (Cor = 0.32830733) in B cells, ICOS (Cor = 0.35149583) and BCL6 (Cor = 0.38061806) in Thf, IL12RB2 (Cor = 0.3053123) and IL27RA (Cor = 0.43571992) in Th1, CCR3 (Cor = 0.42179223) and GATA3 (Cor = 0.30572785) in Th2, TGFBR2 (Cor = 0.318355), IRF4 (Cor = 0.34292587), and SPI1 (Cor = 0.43936172) in Th9, IL21R (Cor = 0.41680877) and STAT3 (Cor = 0.40314791) in Th17, CCR10 (Cor = 0.36084895) in Th22, CCR8 (Cor = 0.49796427) and IL2RA (Cor = 0.42935477) in Treg, PDCD1 (Cor = 0.30167985) and CTLA4 (Cor = 0.35324917) in T cell exhaustion, CD68 (Cor = 0.3345455) and ITGAM (Cor = 0.41813729) in Macrophage, CD80 (Cor = 0.44930451) and CD86 (Cor = 0.42657434) in TAM, FCGR3A (Cor = 0.42997605) in Monocyte, and FUT4 (Cor = 0.4565848) in Neutrophil after considering tumor purity. These findings indicate that RENT3B is associated with these 18 immune cells in LIHC. In LUSC, RENT3B is correlated with 36 immune markers. However, these correlation results slightly decreased when considering tumor purity, and RENT3B showed significant correlations with only 19 immune markers. Among these 19 markers, 13 exhibited negative correlation coefficients, which corresponded to Thf, Th9, Th22, Treg, Macrophage, M2, TAM, Monocyte, and DC (Table 4).
Table 4: Correlation analysis between RENT3B and immune cell type markers in TIMER database
| Cell type | Gene marker | LIHC | LUSC | |||||||
|---|---|---|---|---|---|---|---|---|---|---|
| None | Purity | None | Purity | |||||||
| Cor | P | Cor | P | Cor | P | Cor | P | |||
| B Cell | CD19 | 0.258727 | *** | 0.28698734 | *** | − 0.09503 | * | 0.055153 | ||
| MS4A1 | 0.116874 | * | 0.15932186 | ** | − 0.0757 | 0.07086 | ||||
| CD38 | 0.263327 | *** | 0.32830733 | *** | − 0.13593 | ** | − 0.06288 | |||
| CD8 + T Cell | CD8A | 0.200286 | *** | 0.2565562 | *** | − 0.15527 | *** | − 0.08005 | ||
| CD8B | 0.128614 | * | 0.17703867 | *** | − 0.09896 | * | − 0.06313 | |||
| Thf | CXCR5 | 0.188115 | *** | 0.2434024 | *** | − 0.07744 | 0.081372 | |||
| ICOS | 0.264942 | *** | 0.35149583 | *** | − 0.21213 | *** | − 0.10616 | * | ||
| BCL6 | 0.37643 | *** | 0.38061806 | *** | 0.292219 | *** | 0.269096 | *** | ||
| Th1 | IL12RB2 | 0.307446 | *** | 0.3053123 | *** | − 0.02127 | 0.023393 | |||
| IL27RA | 0.385243 | *** | 0.43571992 | *** | 0.022366 | 0.063116 | ||||
| TBX21 | 0.143725 | ** | 0.18911557 | *** | − 0.05777 | 0.053801 | ||||
| Th2 | CCR3 | 0.370275 | *** | 0.42179223 | *** | − 0.16355 | *** | − 0.09407 | * | |
| STAT6 | 0.327995 | *** | 0.29391503 | *** | 0.200499 | *** | 0.217357 | *** | ||
| GATA3 | 0.214019 | *** | 0.30572785 | *** | − 0.09998 | * | − 0.04033 | |||
| Th9 | TGFBR2 | 0.303021 | *** | 0.318355 | *** | − 0.24689 | *** | − 0.14855 | ** | |
| IRF4 | 0.266861 | *** | 0.34292587 | *** | − 0.08996 | * | 0.05626 | |||
| SPI1 | 0.333282 | *** | 0.43936172 | *** | − 0.21649 | *** | − 0.09296 | * | ||
| Th17 | IL21R | 0.324948 | *** | 0.41680877 | *** | − 0.14693 | *** | − 0.02528 | ||
| IL23R | 0.272172 | *** | 0.27867336 | *** | 0.002882 | 0.081797 | ||||
| STAT3 | 0.385856 | *** | 0.40314791 | *** | 0.121256 | ** | 0.151405 | *** | ||
| Th22 | CCR10 | 0.339312 | *** | 0.36084895 | *** | − 0.14423 | ** | − 0.08622 | ||
| AHR | 0.277777 | *** | 0.28128734 | *** | − 0.1506 | *** | − 0.13621 | ** | ||
| Treg | FOXP3 | 0.234103 | *** | 0.24892093 | *** | − 0.09796 | * | 0.026437 | ||
| CCR8 | 0.429812 | *** | 0.49796427 | *** | − 0.12767 | ** | − 0.02861 | |||
| IL2RA | 0.344081 | *** | 0.42935477 | *** | − 0.21319 | *** | − 0.12874 | ** | ||
| T cell exhaustion | PDCD1 | 0.241481 | *** | 0.30167985 | *** | − 0.08818 | * | 0.020951 | ||
| CTLA4 | 0.274083 | *** | 0.35324917 | *** | − 0.09167 | * | 0.033182 | |||
| Macrophage | CD68 | 0.269446 | *** | 0.3345455 | *** | − 0.27607 | *** | − 0.18944 | *** | |
| ITGAM | 0.361413 | *** | 0.41813729 | *** | − 0.08824 | * | 0.028923 | |||
| M1 | NOS2 | 0.091313 | 0.08692134 | 0.214358 | *** | 0.20685 | *** | |||
| ROS1 | 0.219953 | *** | 0.20938038 | *** | − 0.14987 | *** | − 0.07116 | |||
| M2 | ARG1 | − 0.19119 | *** | − 0.19992131 | *** | 0.040843 | 0.038302 | |||
| MRC1 | 0.108917 | * | 0.12599962 | * | − 0.23425 | *** | − 0.14353 | ** | ||
| TAM | HLA-G | 0.197759 | *** | 0.19154881 | *** | − 0.05982 | 0.010555 | |||
| CD80 | 0.376909 | *** | 0.44930451 | *** | − 0.24007 | *** | − 0.15774 | *** | ||
| CD86 | 0.329481 | *** | 0.42657434 | *** | − 0.27601 | *** | − 0.1816 | *** | ||
| Monocyte | CD14 | − 0.29228 | *** | − 0.29594981 | *** | − 0.32502 | *** | − 0.23014 | *** | |
| FCGR3A | 0.370164 | *** | 0.42997605 | *** | − 0.29009 | *** | − 0.21327 | *** | ||
| NK | XCL1 | 0.255527 | *** | 0.28733954 | *** | 0.227955 | *** | 0.204352 | *** | |
| KIR3DL1 | 0.131863 | * | 0.13662685 | * | − 0.07197 | − 0.02786 | ||||
| CD7 | 0.220835 | *** | 0.26815455 | *** | − 0.11723 | ** | − 0.00195 | |||
| Neutrophil | FUT4 | 0.435389 | 0.4565848 | *** | 0.157745 | *** | 0.214515 | *** | ||
| MPO | 0.121979 | * | 0.14561821 | ** | − 0.0982 | * | − 0.02858 | |||
| DC | CD1C | 0.134203 | ** | 0.17869505 | *** | − 0.28461 | *** | − 0.16808 | *** | |
| THBD | 0.110285 | * | 0.15847987 | ** | − 0.08849 | * | − 0.07121 | |||
LIHC liver hepatocellular carcinoma, LUSC lung squamous cell carcinoma, Tfh follicular helper T cell, Th T helper cell, Treg Regulatory T cell, TAM tumor-associated- macrophage, NK natural killer cell, DC dendritic cell, None correlation without adjustment, Purity correlation adjusted for tumor purity, Cor r value of Spearman’s correlation. *P < 0.01; **P < 0.001; ***P < 0.0001
Overall, these findings suggest that the expression of RENT3B is associated with immune infiltration in both LIHC and LUSC, with different correlations observed in each tumor type. Combined with previous prognosis results, it can be inferred that the impact of RENT3B expression on prognosis is most likely due to immune infiltration in these two tumors. Furthermore, these results demonstrate tissue heterogeneity of RENT3B in LIHC and LUSC, as it influences immune infiltration in different tumor tissues, leading to varying survival outcomes.
Survival analysis of RENT3B expressions in pan-cancer based on immune cells
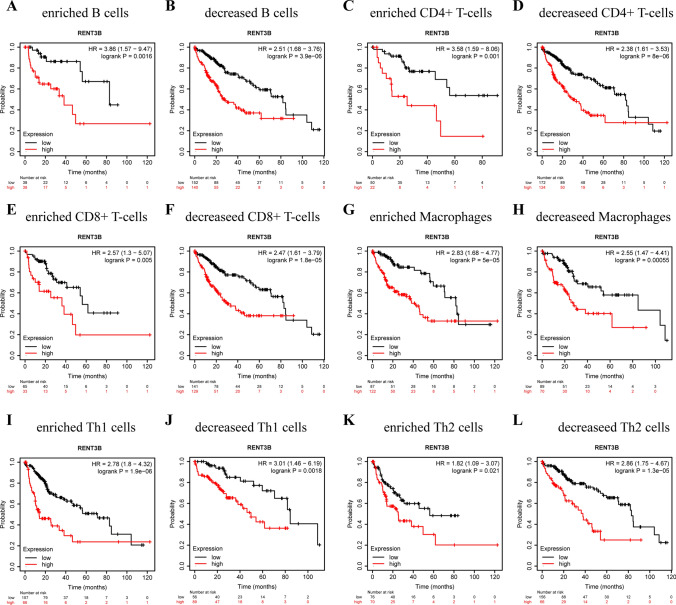
After discovering the correlation between RENT3B expression and immune infiltration, we employed the Kaplan–Meier Plotter to divide LIHC and LUSC samples into enriched and decreased subgroups based on immune cell subtypes. Our objective was to investigate whether specific types of immune cells have an impact on tumor prognosis. Building upon this, we further investigated the relationship between RENT3B expression and survival outcomes. As expected, our results revealed that HCC patients with high expression of RENT3B exhibited a poorer prognosis in the enriched and decreased cohorts of B cells, CD4+ T cells, CD8+ T cells, Macrophages, Th1 cells, and Th2 cells (Fig. 6). Conversely, in the enriched and decreased cohorts of B cells, CD4+ T cells, CD8+ T cells, Macrophages, Th1 cells, and Th2 cells in LUSC, high RENT3B expression was associated with a more favorable prognosis [Supplementary Fig. 1]. This finding aligns with our previous survival analysis that did not differentiate among immune cell subgroups. By analyzing these results, we can conclude that among the six types of immune cells examined, only a particular type did not impact the survival rates of LIHC and LUSC patients.
The high expression of RENT3B is not due to promoter methylation in LIHC and LUSC
Generally speaking, the transcriptional activity of a gene is inversely proportional to the methylation of CpG sites in the gene promoter. Therefore, upon discovering the relationship between the prognosis of RENT3B and immune infiltration, we aimed to investigate whether the upregulation of RENT3B expression is caused by promoter methylation in LIHC and LUSC.
To analyze DNA methylation, the DNMIVD database utilizes high-throughput microarray data from TCGA and GEO. According to the results obtained from DNMIVD, there was only a marginal difference in the promoter methylation of RENT3B between normal and tumor samples in LIHC, and this difference was not statistically significant (p > 0.05). Similarly, no statistical difference (p > 0.05) in promoter methylation was observed in LUSC (Supplementary Fig. 2). These findings indicate that the high expression of RENT3B is unrelated to promoter methylation in both LIHC and LUSC.
Discussion
In this study, we aimed to investigate the role of RENT3B in pan-cancers, specifically its expression, prognosis, and, most importantly, its association with immune infiltration. Understanding the tumor microenvironment, particularly immune cell infiltration, is crucial for elucidating the mechanisms underlying tumor development. We identified a significant relationship between RENT3B and immune cell infiltration. The interaction patterns varied between LIHC and LUSC. However, it is important to emphasize that our current research design does not establish a causal relationship between RENT3B and immune infiltration. Therefore, this study focuses on investigating the potential of RENT3B as a prognostic marker for pan-cancers from an immuno-oncology perspective. These findings may have implications for future mechanistic research and contribute to the advancement of immunotherapy.
Despite variations in data collection methods among different databases, we were able to determine distinct prognostic values of RENT3B in LIHC and LUSC by combining data from multiple sources. Therefore, we found the protein expression levels of RENT3B in LIHC and LUSC on The Human Protein Atlas database. The Human Protein Atlas database utilizes immunohistochemistry to visualize protein abundance differences. As shown in the figure, RENT3B is predominantly localized in the cytoplasm. In LIHC, the protein content of RENT3B in the tumor is significantly higher than in normal liver tissue. The same result applies to LUSC (Supplementary Fig. 3).
To evaluate patient prognosis, we conducted prognostic analyses of RENT3B using the GEPIA and Kaplan–Meier Plotter platforms. The results indicated that high expression of RENT3B was associated with an unfavorable prognosis in LIHC, whereas high RENT3B expression correlated with a favorable prognosis in LUSC. Subsequently, we employed both univariate and multivariate Cox regression analyses to assess the distinct prognostic implications of RENT3B in LIHC and LUSC (Tables 2 and 3). Collectively, these findings suggest that RENT3B may serve as a prognostic biomarker across various cancer types.
Another significant finding of this study is the correlation between RENT3B expression and tumor immune infiltration, particularly in LIHC and LUSC. Our results demonstrate that RENT3B expression closely correlates with the infiltration levels of various immune cell types. In LIHC, the correlation coefficient between RENT3B expression and immune infiltration is positive, whereas in LUSC, it is negative. Regarding the association between RENT3B expression and immune cell markers, our results reveal a positive correlation between RENT3B and nearly all immune cell markers in LIHC. However, the correlation pattern differs somewhat in LUSC. Notably, the associations between RENT3B and certain immune cell markers do not precisely follow the overall trend observed, indicating a specific interaction between RENT3B expression and particular immune cell subtypes. In conclusion, our study highlights the significant role of RENT3B in regulating immune infiltrating cells in cancer, which may ultimately influence patient prognosis.
The above results demonstrate that RENT3B is an unfavorable prognostic indicator in LIHC. Conversely, in LUSC, RENT3B was found to be a factor of good prognosis. Why do opposite prognostic outcomes occur? We have conducted further analysis to address this question. In the TCGA-LIHC and TCGA-LUSC RNA-seq data, we performed differential analysis by grouping tumor samples based on the expression level of RENT3B using the minimum p-value method. Subsequently, we conducted KEGG and GSEA pathway enrichment analyses on the differential results. In LIHC, we observed that high expression of RENT3B is more enriched in the “Cell cycle” and “DNA replication” pathways according to KEGG analysis. GSEA analysis showed greater enrichment in the “G2M_CHECKPOINT” and “MITOTIC_SPINDLE” pathways [Supplementary Fig. 4]. These results indicate that the expression level of RENT3B is closely and positively correlated with proliferative characteristics in LIHC. In LUSC, KEGG analysis revealed that the “Natural killer cell mediated cytotoxicity” and “PD-L1 expression and PD-1 checkpoint pathway in cancer” signaling pathway are suppressed in the high RENT3B expression group. GSEA analysis indicated that RENT3B negatively correlates with the “HALLMARK_EPITHELIAL_MESENCHYMAL_TRANSITION”, and “HALLMARK_TGF_BETA_SIGNALING” pathways (Supplementary Fig. 4). Therefore, high expression of RENT3B indicates activation of tumor immunity in LUSC, with suppression of EMT and metastatic behavior. Therefore, high RENT3B expression in LUSC is associated with a better prognosis.
Previous findings have demonstrated an association between RENT3B and immune cells in the tumor microenvironment, as well as immune cell markers. Furthermore, immune cells within the immune microenvironment not only aid tumor cells in evading destruction but also participate in tumor development [ref. 2, ref. 3]. Taking these factors into account, along with the analysis of the prognostic results of RENT3B in LIHC and LUSC, it can be concluded that RENT3B impacts the prognosis of tumor patients through immune infiltration. This finding strengthens our conclusion. RENT3B does not interact exclusively with specific types of immune cells, but rather collaborates with various immune cells to collectively influence immune infiltration. Ultimately, this interaction may impact the survival outcome of cancer patients. However, due to database limitations and technical constraints, we were unable to explore in-depth the mechanisms underlying RENT3B’s interactions with different immune cells.
Material and methods
The expression of RENT3B in pan-cancer in Oncomine and TIMER
The gene expression of RENT3B was examined using various tumor datasets available on the Oncomine database (https://www.oncomine.org/resource/main.html). [ref. 12] The selection criteria included a p-value threshold of 0.01, a fold change of at least 1.5, and consideration of all genes. It is important to note that the data analyzed in this study specifically involved mRNA rather than DNA. To explore the differential expression of RENT3B or any other gene of interest between tumor and healthy tissues across all TCGA data, the DiffExp module in TIMER (https://cistrome.shinyapps.io/timer/) was employed [ref. 13]. The distribution of gene expression levels was visualized using a box plot, and the significance of differential expression was determined through statistical analysis utilizing the Wilcoxon test (*: p-value < 0.05; **: p-value < 0.01; ***: p-value < 0.001).
Prognosis analysis in PrognoScan, GEPIA, Kaplan–Meier plotter
The association between the expression of RENT3B and prognosis in various cancers was investigated using PrognoScan (http://dna00.bio.kyutech.ac.jp/PrognoScan/index.html), Kaplan–Meier Plotter (https://kmplot.com/analysis/), and GEPIA (http://gepia.cancerpku.cn/). [ref. 14–ref. 17]
We analyzed the correlation between RENT3B expression and survival using all available chip data from PrognoScan, including OS (Overall Survival), DSS (Disease Specific Survival), RFS (Relapse Free Survival), DMFS (Distant Metastasis Free Survival), and DRFS (Distant Recurrence Free Survival). The screening criterion used was a cox p-value < 0.05.
GEPIA (Gene Expression Profiling Interactive Analysis) is an interactive online platform that contains information on 9736 tumor samples from TCGA and 8587 standard samples from TCGA and GTEx projects. Its RNA-Seq datasets are derived from the UCSC Xena project. The effects of RENT3B expression on OS and DFS (Disease Free Survival) in 33 cancers are explored in GEPIA.
Kaplan–Meier Plotter is a powerful tool that can evaluate the effect of 54,000 genes on the survival rate of 21 types of cancer. The mRNA subsystem contains RNA-seq data from 74,000 samples of 21 types of tumors. The association between RENT3B and OS and RFS in various cancers, such as LIHC and LUSC, was analyzed. We also divided the tumor samples into enriched and decreased subgroups based on the immune cell subgroup in Kaplan–Meier Plotter. The HR value, 95% confidence interval, and log-rank p-value were calculated, and the screening criterion for the log-rank p-value was < 0.05.
The correlation between RENT3B and immune infiltration in TIMER
We utilized the TIMER and GEPIA databases to investigate the correlation between RENT3B and immune cells. The TIMER Web server is a comprehensive resource for systematically analyzing immune infiltration in various types of cancer. The TIMER database comprises over 10,000 samples from 39 types of cancer collected from TCGA. The TIMER algorithm Synapse estimated six types of immune infiltrating cells (B cells, CD4+ T cells, CD8+ T cells, Neutrophils, Macrophages, and Dendritic cells). The Gene module of TIMER allows exploration and visualization of the association between gene expression and the abundance of immune infiltrating cells. We analyzed the correlation between RENT3B expression and the abundance of these six immune infiltrating cells across the 39 cancer types. To correct gene expression levels, we used the log2TPM method. The correlation between RENT3B and immune infiltrating cells was displayed as a scatterplot, with RENT3B gene expression on the Y-axis and immune cell infiltration level on the X-axis. The scatterplot includes Spearman’s Rho value and the estimated statistical significance (p-value).
In addition to assessing immune infiltrating cells, we also investigated the relationship between gene expression and immune cell markers to identify immune cell subtypes. We selected 45 markers representing various immune cells, corresponding to a total of 19 immune cell types (B cells, CD8+ T cells, follicular helper T cells (Tfh), T-helper 1 (Th1) cells, T-helper 2 (Th2) cells, T-helper 9 (Th9) cells, T-helper 17 (Th17) cells, T-helper 22 (Th22) cells, Regulatory T cells (Tregs), exhausted T cells, M1 macrophages, M2 macrophages, tumor-associated macrophages, monocytes, natural killer (NK) cells, neutrophils, and dendritic cells). We adjusted the correlation coefficient based on None and Purity, and recorded the correlation coefficient and P-value between RENT3B and each type of immune cell marker.
DNMIVD database analysis
DNMIVD (DNA Methylation Interactive Visualization Database) is a comprehensive annotation and interactive visualization database for DNA methylation profiles in various human tumors [ref. 18]. It was constructed using high-throughput microarray data from the TCGA and GEO databases (http://119.3.41.228/dnmivd/index/). By utilizing DNMIVD, researchers can explore differences in promoter region methylation between tumor and normal samples. In this study, we aimed to investigate the promoter methylation level of RENT3B in LIHC and LUSC using the DNMIVD database.
Statistical analysis
The results with P-values generated in ONCOMINE are determined by t-test, fold change, and gene grade. The statistically significant Wilcoxon test assessed the differences in expression in TIMER’s cancer samples. Survival curves were estimated using the Kaplan–Meier method, and the log-rank test was employed to calculate hazard ratios (HR) and log-rank p-values in Kaplan–Meier plotter and GEPIA for comparing various survival curves. Additionally, HR and Cox-p values were calculated in PrognoScan using the univariate Cox regression model. Spearman’s correlation was used to determine the association between RENT3B expression and immune infiltration. Unless otherwise specified, a p-value of less than 0.05 was considered statistically significant.
Limitations
Although we gathered information from multiple databases, this study still has several limitations. Firstly, most of the tumor tissue information used in this study came from microarray and sequencing data. Consequently, there may be a systemic bias introduced during the analysis of immune cell markers at the cellular level. Future research with higher resolution, such as single-cell RNA sequencing, should be pursued to overcome this challenge [ref. 21, ref. 22]. Secondly, this study solely focused on bioinformatics analysis of RENT3B expression and patient prognosis across different databases, without conducting in vivo/in vitro experiments. Thirdly, while we observed a correlation between RENT3B expression and immune cell infiltration in tumors, we cannot establish a causal relationship in our study. Fourthly, although we discovered that RENT3B can interact with various immune cells to influence immune infiltration, we were unable to determine how exactly RENT3B affects patient survival by influencing immune infiltration due to limitations in databases and technical methods. Fifthly, we identified potential heterogeneity of RENT3B in different tumor tissues, and also found differences in the ways it affects tumor immune infiltration. However, we currently lack the technical means and databases to fully explain this heterogeneity. Sixthly, gene expression upregulation or downregulation in tumor tissues is influenced by numerous factors, such as methylation and miRNA. However, in this study, we solely focused on the effect of promoter methylation on gene expression. Prospective studies investigating RENT3B expression and immune infiltration in tumor patients may provide more precise answers regarding their relationship in the future.
Conclusion
RENT3B can impact the prognosis of cancer and is closely associated with immune infiltration, particularly in hepatocellular carcinoma and lung squamous cell carcinoma. Therefore, RENT3B has the potential to serve as a prognostic biomarker for hepatocellular carcinoma and lung squamous cell carcinoma, which may contribute to the development of immune-based anti-tumor strategies and the improvement of cancer patients’ prognosis. Furthermore, our findings will provide a new direction for molecular biology research on RENT3B.
Supplementary Materials
References
- RT Netea-Maier, JWA Smit, MG Netea. Metabolic changes in tumor cells and tumor-associated macrophages: a mutual relationship. Cancer Lett, 2018. [DOI | PubMed]
- G Bindea, B Mlecnik, M Tosolini. Spatiotemporal dynamics of intratumoral immune cells reveal the immune landscape in human cancer. Immunity, 2013. [DOI | PubMed]
- DF Quail, JA Joyce. Microenvironmental regulation of tumor progression and metastasis. Nat Med, 2013. [DOI | PubMed]
- Y Zhu, J Yang, D Xu. Disruption of tumour-associated macrophage trafficking by the osteopontin-induced colony-stimulating factor-1 signalling sensitises hepatocellular carcinoma to anti-PD-L1 blockade. Gut, 2019. [DOI | PubMed]
- M De Palma, D Biziato, TV Petrova. Microenvironmental regulation of tumour angiogenesis. Nat Rev Cancer, 2017. [DOI | PubMed]
- X Li, W Yao, Y Yuan. Targeting of tumour-infiltrating macrophages via CCL2/CCR2 signalling as a therapeutic strategy against hepatocellular carcinoma. Gut, 2017. [DOI | PubMed]
- M Cully. Re-educating tumour-associated macrophages with nanoparticles. Nat Rev Drug Discov, 2018. [DOI | PubMed]
- G Stelzer, N Rosen, I Plaschkes. The GeneCards suite: from gene data mining to disease genome sequence analyses. CP Bioinformatics, 2016. [DOI]
- F Laumonnier. Mutations of the UPF3B gene, which encodes a protein widely expressed in neurons, are associated with nonspecific mental retardation with or without autism. Mol Psychiatry, 2010. [DOI | PubMed]
- PS Tarpey, F Lucy Raymond, LS Nguyen. Mutations in UPF3B, a member of the nonsense-mediated mRNA decay complex, cause syndromic and nonsyndromic mental retardation. Nat Genet, 2007. [DOI | PubMed]
- AM Addington, J Gauthier, A Piton. A novel frameshift mutation in UPF3B identified in brothers affected with childhood onset schizophrenia and autism spectrum disorders. Mol Psychiatry, 2011. [DOI | PubMed]
- DR Rhodes, S Kalyana-Sundaram, V Mahavisno. Oncomine 3.0: genes, pathways, and networks in a collection of 18,000 cancer gene expression profiles. Neoplasia, 2007. [DOI | PubMed]
- T Li, J Fan, B Wang. TIMER: a web server for comprehensive analysis of tumor-infiltrating immune cells. Can Res, 2017. [DOI]
- H Mizuno, K Kitada, K Nakai, A Sarai. PrognoScan: a new database for meta-analysis of the prognostic value of genes. BMC Med Genomics, 2009. [DOI | PubMed]
- Z Tang, C Li, B Kang, G Gao, C Li, Z Zhang. GEPIA: a web server for cancer and normal gene expression profiling and interactive analyses. Nucleic Acids Res, 2017. [DOI | PubMed]
- B Győrffy. Integrated analysis of public datasets for the discovery and validation of survival-associated genes in solid tumors. The Innovation, 2024. [DOI | PubMed]
- B Győrffy. Transcriptome-level discovery of survival-associated biomarkers and therapy targets in non-small-cell lung cancer. Br J Pharmacol, 2024. [DOI | PubMed]
- W Ding, G Chen, T Shi. Integrative analysis identifies potential DNA methylation biomarkers for pan-cancer diagnosis and prognosis. Epigenetics, 2019. [DOI | PubMed]
- G Neu-Yilik, E Raimondeau, B Eliseev. Dual function of UPF3B in early and late translation termination. EMBO J, 2017. [DOI | PubMed]
- T Alrahbeni, F Sartor, J Anderson, Z Miedzybrodzka, C McCaig, B Müller. Full UPF3B function is critical for neuronal differentiation of neural stem cells. Mol Brain, 2015. [DOI | PubMed]
- A Giladi, I Amit. Single-cell genomics: a stepping stone for future immunology discoveries. Cell, 2018. [DOI | PubMed]
- E Papalexi, R Satija. Single-cell RNA sequencing to explore immune cell heterogeneity. Nat Rev Immunol, 2018. [DOI | PubMed]