Identification and validation of a prognostic anoikis-related gene signature in papillary thyroid carcinoma by integrated analysis of single-cell and bulk RNA-sequencing
Abstract
Papillary thyroid carcinoma (PTC) prognosis may be deteriorated due to the metastases, and anoikis palys an essential role in the tumor metastasis. However, the potential effect of anoikis-related genes on the prognosis of PTC was unclear. The mRNA and clinical information were obtained from the cancer genome atlas database. Hub genes were identified and risk model was constructed using Cox regression analysis. Kaplan–Meier (K–M) curve was applied for the survival analysis. Immune infiltration and immune therapy response were calculated using CIBERSORT and TIDE. The identification of cell types and cell interaction was performed by Seurat, SingleR and CellChat packages. GO, KEGG, and GSVA were applied for the enrichment analysis. Protein-protein interaction network was constructed in STRING and Cytoscape. Drug sensitivity was assessed in GSCA. Based on bulk RNA data, we identified 4 anoikis-related risk signatures, which were oncogenes, and constructed a risk model. The enrichment analysis found high risk group was enriched in some immune-related pathways. High risk group had higher infiltration of Tregs, higher TIDE score and lower levels of monocytes and CD8 T cells. Based on scRNA data, we found that 4 hub genes were mainly expressed in monocytes and macrophages, and they interacted with T cells. Hub genes were significantly related to immune escape-related genes. Drug sensitivity analysis suggested that cyclin dependent kinase inhibitor 2A may be a better chemotherapy target. We constructed a risk model which could effectively and steadily predict the prognosis of PTC. We inferred that the immune escape may be involved in the development of PTC.
Article type: Research Article
Keywords: anoikis, drug sensitivity, immune escape, papillary thyroid carcinoma, single-cell RNA
Affiliations: Department of Thyroid and Breast Surgery, Linping Campus, The Second Affiliated Hospital of Zhejiang University School of Medicine, Hangzhou, China.
License: Copyright © 2024 the Author(s). Published by Wolters Kluwer Health, Inc. CC BY 4.0 This is an open access article distributed under the Creative Commons Attribution License 4.0 (CCBY), which permits unrestricted use, distribution, and reproduction in any medium, provided the original work is properly cited.
Article links: DOI: 10.1097/MD.0000000000038144 | PubMed: 38728457 | PMC: PMC11081552
Relevance: Moderate: mentioned 3+ times in text
Full text: PDF (27 KB)
1. Introduction
Thyroid cancer (THCA) is the most common endocrine cancer with a rapidly increasing incidence over several decades,[1] and papillary thyroid carcinoma (PTC) is the main type of THCA, comprising approximately 80% to 85% of all THCA.[2] While the 5-year survival rate in its incipient stages stands commendably over 90%, patients afflicted with advanced PTC encounter a considerably bleaker prognosis, with a 5-year survival rate plummeting below 60% due to the ominous convergence of metastasis and uninhibited tumor proliferation,[3,4]. The current treatment options for PTC include surgical resection, thyroid hormone suppression, and radioiodine therapy, all of which may result in a relatively good prognosis for patients with PTC.[5] Regrettably, the clinical trajectory of PTC sufferers remains stifled by the persistent specters of recurrence and metastatic dissemination, both of which serve as primary instigators of mortality in this context.[6] Thus, a comprehensive comprehension pertaining to the intricate mechanisms governing the initiation and advancement of PTC stands poised to contribute significantly to the diagnostic and therapeutic endeavors undertaken within the realm of this affliction.
Anoikis is a member of programmed cell death triggered by cell detachment from the extracellular matrix.[7] This vital process assumes a paramount role as the primary line of defense against metastasis, while simultaneously orchestrating tissue homeostasis and development.[8,9] Additionally, it has been extensively elucidated that anoikis protects against metastasis and aberrant proliferation of detached tumor cells, thus emerging as a pivotal player in the genesis and progression of neoplastic formations.[10,11] Moreover, as the frontiers of omics technology and bioinformatics continue to expand, mounting evidence underscores the stringent influence exerted by a subset of anoikis-related genes (ARGs) upon the intricate machinery governing tumor metastasis. Windham et al identified that SRC could enhance the anoikis-resistant to promote the metastasis of tumor cells.[12] Moreover, it was widely reported that ARGs could predict the prognosis of some tumors including gastric cancer, breast cancer and lung cancer.[13–15] Anoikis resistance is the inherent characteristics of tumor cell,[16] but there were few reports about the function of anoikis in the PTC development.
Therefore, we tried to investigate the prognosis value of ARGs in PTC and constructed a risk model based on ARGs. Besides, we also preliminarily explored the potential mechanism of anoikis in PTC development.
2. Methods
2.1. Data collection and process
The mRNA expression, clinical data and survival data (overall survival [OS] status and OS time) were downloaded from the cancer genome atlas (TCGA) database. The raw microarray mRNA data were subjected to log2 transformation, with genes having multiple probes being averaged. Besides, the single-cell RNA (scRNA) data (GSE193581) was obtained from the GEO database, and 4 PTC samples were selected for the analysis. The ARGs were determined in GeneCard (https://www.genecards.org/), and immune escape-related genes were obtained from a previous study.[17]
2.2. The identification of hub genes
The limma package in R was utilized to identify differentially expressed genes (DEGs). Besides, the threshold values for identifying DEGs were set at fold change > 1.5 and P < .05.
2.3. The construction and validation of the risk model
After the DEGs were determined, univariate Cox regression analysis was conducted to determine the genes closely related to the prognosis of PTC. Then, the least absolute shrinkage and selection operator regression analysis was used to prevent over-fitting using the glmnet package. Next, the hub genes and corresponding coefficients were determined using multivariate Cox analysis, and the risk model was constructed based on the expression and coefficient value of hub genes. Additionally, the patients were divided into low and high risk groups based on the optimal cutoff value using the maxstat package. Finally, the Kaplan–Meier (K–M) and operating characteristic curve (ROC) curves were performed to validate the stability and suitability of the risk model using survival and qROC packages.
2.4. The immune infiltration and immune response analysis
The CIBERSORT algorithm, a deconvolution tool, was utilized to calculate the abundance of 22 immune cells using the CIBERSORT package. Tumor Immune Dysfunction and Exclusion (TIDE) is a computational approach designed to forecast the effectiveness of immune checkpoint blockade therapy in cancer patients, which was a more reliable biomarker than TMB or PD-L1 expression in determining the response to immunotherapy.[18] After the raw expression profiles were normalized using z-scores, TIDE, microsatellite instability (MSI), Dysfunction and Exclusion scores were calculated to predict the immunotherapy response in the TIDE website (http://tide.dfci.harvard.edu/). A lower TIDE score suggests a reduced likelihood of immune escape.
2.5. The single-cell RNA analysis
Before the analysis of scRNA data, the cells with the number of nFeature RNA <500 were excluded, and the cells with the number of nCount RNA <1000 or more than 20,000 were filtered out, and the cells with mitochondria percent more than 10% were excluded. Overall, a total of 44,842 cells were chosen for further analysis. After the determination of the optimal dimension using principal component analysis, t-SNE was used for dimensionality reduction and cluster identification. Then, we identify marker genes through the Find All Markers function with min. pct = 0.25 and log2 (Fold change) = 0.3. Finally, the SingleR package was used for the cluster annotation. Then, the cell interaction and the interactions of ligand and receptor were estimated using the Cell Chat package.
2.6. The enrichment analysis
The ClusterProfiler package was performed for Gene Ontology (GO) and Kyoto Encyclopedia of Genes and Genomes (KEGG) analysis. Gene set variation analysis (GSVA) package was used for GSVA analysis of the differential marker genes between 2 groups. All reference gene sets were obtained in the Molecular Signatures Database (MSigDB, https://www.gsea-msigdb.org/gsea/msigdb/index.jsp).
2.7. Cell culture and quantitative real-time polymerase chain reaction (qRT-PCR)
The normal thyroid cells (Htori-3) and THCA cells (TPC-1) were obtained from the American Type Culture Collection (American Type Culture Collection, Manassas, VA, USA), maintained in DEME/F12 medium (Hyclone, UT, USA) containing 10% fetal bovine serum (FBS) and 1% penicillin/streptomycin and incubated in 5% CO2 at 37°C.
Total RNA was extracted from cells using Trizol Reagent (15596026, Invitrogen, Car, CA, USA). The Nanodrop 2000 Micro-UV Spectrophotometer (1011U, NanoDrop Technologies, Wilmington, DE, USA) was employed to determine the ratio of A260/A230 to A260/A280. After RNA samples were measured, they were reversely transcribed into cDNA with PrimeScript™ RT reagent Kit (RR037A, Takara Bio Inc., Osaka, Japan). qRT-PCR was conducted using TB Green qPCR Master Mix (639676, Takara Biotechnology, Japan) in the Mx3005P system (Agilent Technologies, Inc., CA, USA). The expressions of hub genes were determined using the 2-ΔΔCt method with glyceraldehyde-3-phosphate dehydrogenase as control (32). PCR reaction conditions were: 1 minute at 95°C, then 20 seconds at 95°C, and 45 seconds at 58°C for 40 cycles. The primer sequences are shown in Table 1.
Table 1: All primers in qRT-PCR experiments in this study.
| Gene | Forward | Reverse |
|---|---|---|
| CDKN2A | 5’-CCACGGCGCGGAGCCCAA-3’ | 5’-GCAGCACCACCAGCGTGTCCA-3’ |
| IRX1 | 5’-CCTATGGTCAGTTTCAATACG-3’ | 5’-GGTCATCTTGGTGATAATGG-3’ |
| SCD1 | 5’-CTGGCCTATGACCGGAAGAAA-3’ | 5’-GACCCCAAACTCATTCCATAGG-3’ |
| SNAI1 | 5’-CTCGGACCTTCTCCCGAATG-3’ | 5’-AAAGTCCTGTGGGGCTGATG-3’ |
CDKN2A = cyclin dependent kinase inhibitor 2A, IRX1 = Iroquois homeobox 1, SCD1 = stearoyl-CoA desaturase 1, SNAI1 = Snail family transcriptional repressor 1.
2.8. The construction of protein-protein interaction network
After the hub gene list was uploaded to STRING (https://cn.string-db.org/), the interaction among proteins was assessed. Then, the protein-protein interaction (PPI) network was analyzed, adjusted and visualized in Cytoscape.
2.9. The analysis of drug sensitivity
Gene Set Cancer Analysis (GSCA) is a comprehensive platform integrating genomic, pharmacogenomic and immunogenomic GSCA. Besides, GSCA incorporates over 750 small-molecule drugs from the Genomics of Drug Sensitivity in Cancer (GDSC) and the Cancer Therapeutics Response Portal (CTRP) databases.
2.10. Statistics
All statistical analyses were performed using R software v4.3.1. The log-rank test was used to assess the statistical difference between the 2 groups. Spearman correlation analysis was performed for the correlation analysis. P-values < .05 were considered statistically significant.
3. Results
3.1. Identification of differentially expressed anoikis-related genes
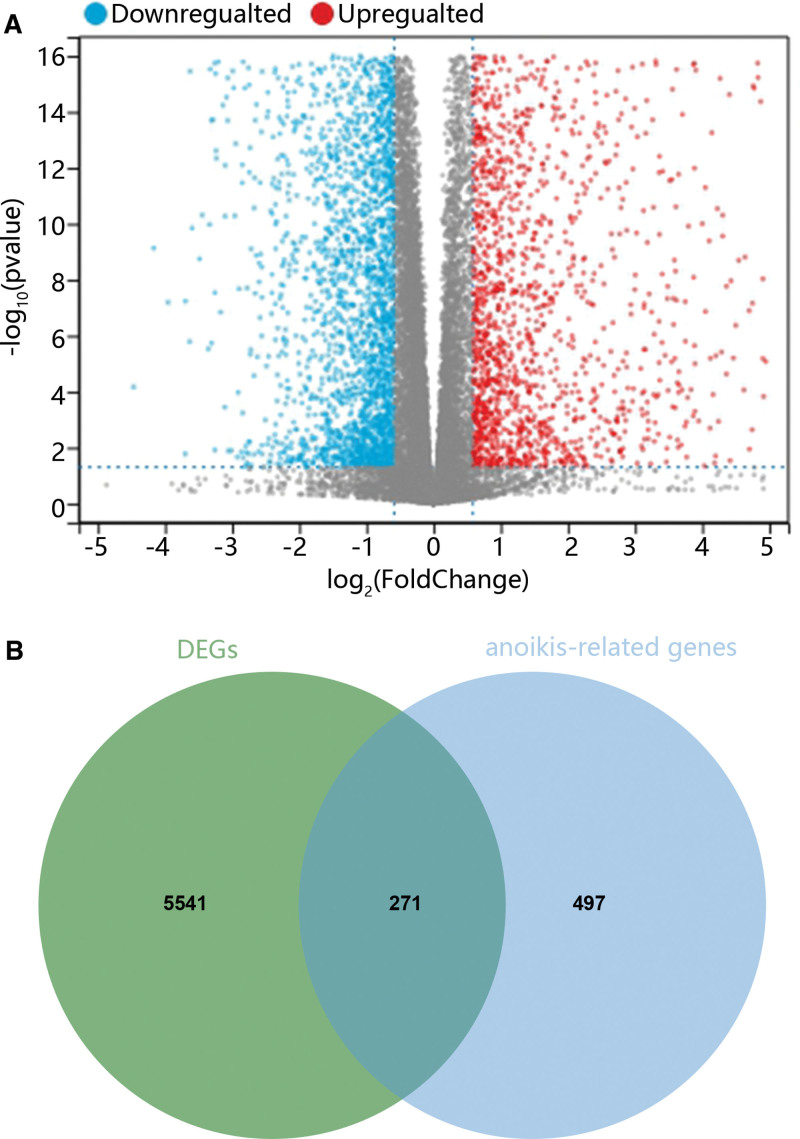
At first, we analyze gene expression differences using bioinformatics. As shown in Figure 1A, there were 2971 upregulated genes and 2841 downregulated genes in PTC samples compared with normal samples. Combined with the dataset of ARGs, we found that 271 ARGs were differentially expressed between tumor and normal samples (Fig. 1B).
3.2. Construction and validation of risk model
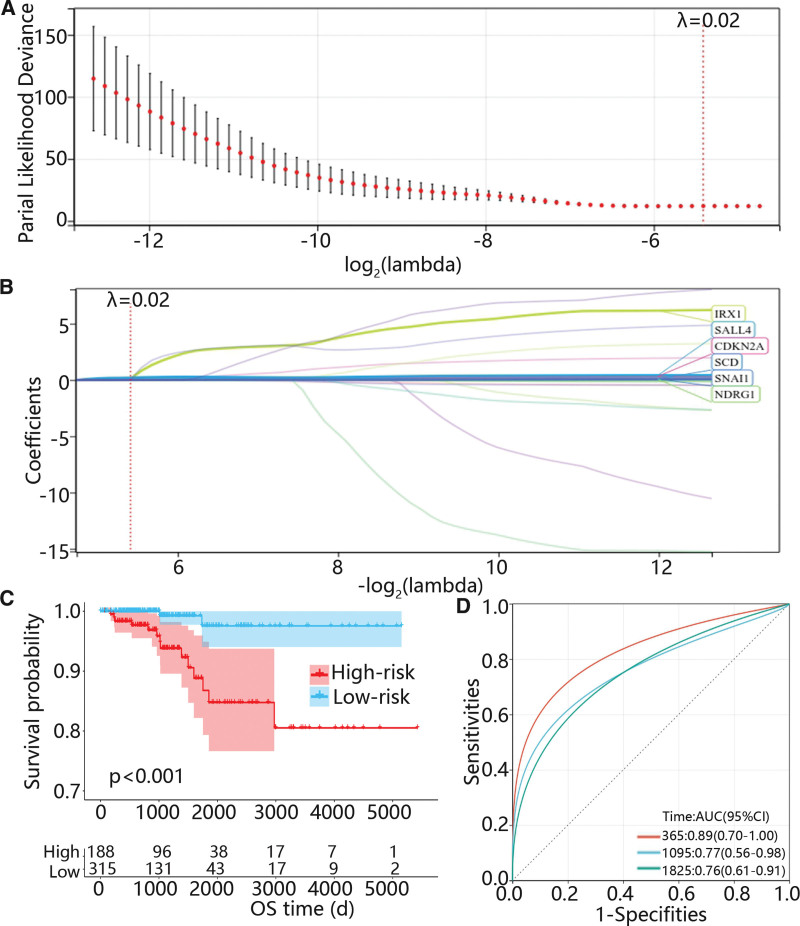
Then, a total of 93 ARGs related to the prognosis of PTC were screened out using univariate Cox regression analysis. Besides, the Lasso Cox was used to further exclude some genes which may be highly associated with other genes, and 6 genes were selected when λ was 0.02 (Figs. 2A-B). Subsequently, multivariate Cox regression analysis was applied to determine the mRNA which could independently predict the prognosis of PTC and corresponding coefficients to construct a risk model. The risk score = 0.168 * expression (cyclin dependent kinase inhibitor 2A [CDKN2A]) + 3.296 * expression (Iroquois homeobox 1 [IRX1]) + 0.07 * expression (stearoyl-CoA desaturase [SCD]) + 0.107 * expression (Snail family transcriptional repressor 1 [SNAI1]). Furthermore, the patients were divided into low and high risk groups according to the optimal cutoff, and the K–M curve displayed that the overall survival probability of the high-risk group was significantly lower than that of the low-risk group (Fig. 2C). Moreover, the area under the curve values for predicting 1-, 3- and 5-years survival probability were 0.89, 0.77 and 0.76, respectively (Fig. 2D).
3.3. The function enrichment analysis between high and low risk groups
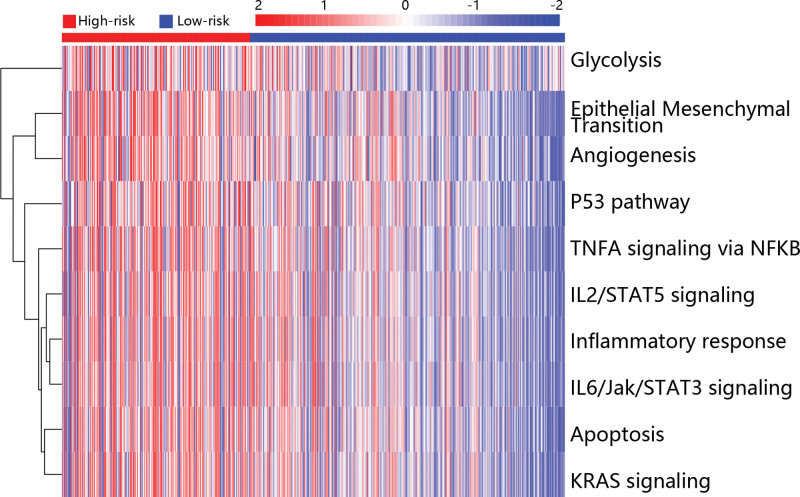
To explore the potential mechanism in the development of PTC, the GSVA analysis was used to assess the differentially enriched pathways in low and high risk groups. The top 10 pathways were shown in Figure 3, and it can be seen that glycolysis, epithelial mesenchymal transition (EMT) and angiogenesis were highly enriched in the high risk group.
3.4. The immune response and immune infiltration between high and low risk groups
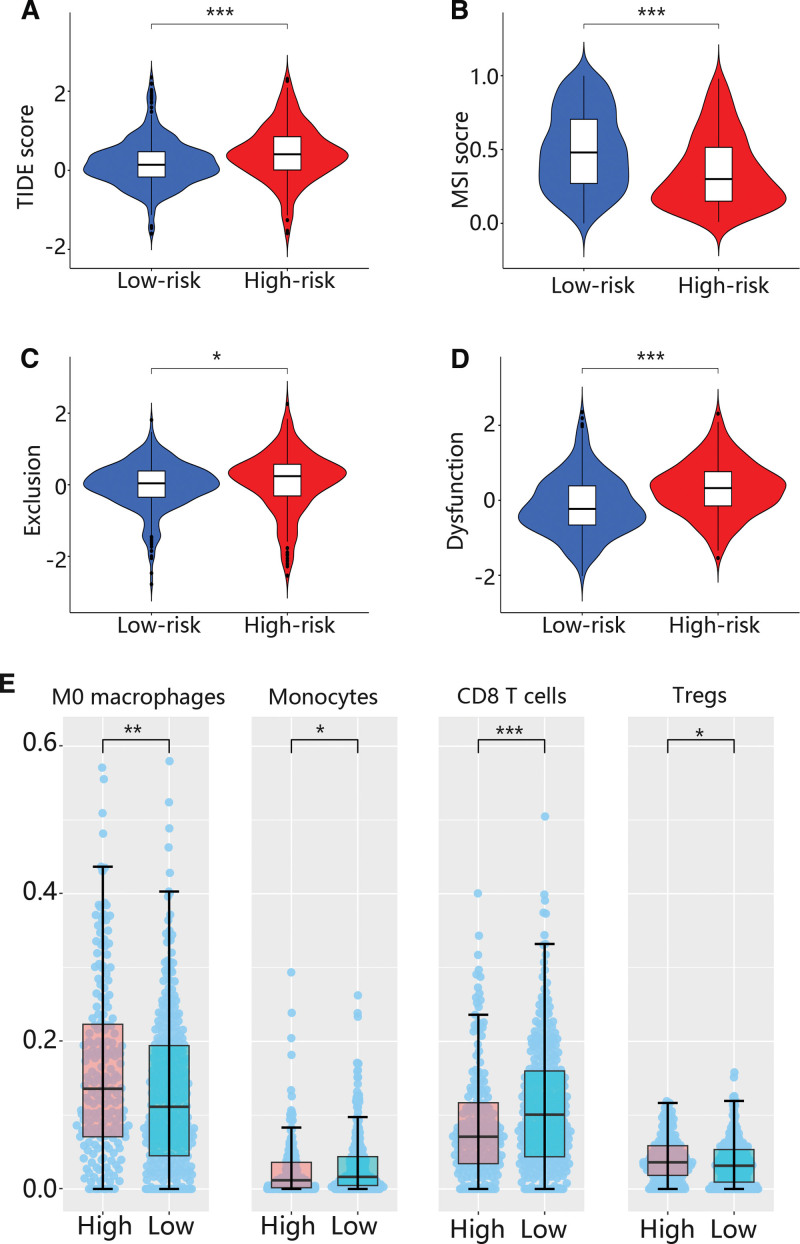
Because some results were related to the immune system, we further analyzed the immune response using TIDE. The TIDE score was higher in the high risk group than that of the low risk group (Fig. 4A), while MSI, exclusion and dysfunction scores were lower in the high risk group than that of the low risk group (Figs. 4B-D). Besides, the immune infiltration levels of M0 macrophage and regulatory T cells (Tregs) were higher in high risk groups in comparison with low risk group, while the immune infiltration levels of monocytes and CD8 T cells were higher in low risk groups (Fig. 4E).
3.5. The single-cell RNA analysis of papillary thyroid carcinoma samples
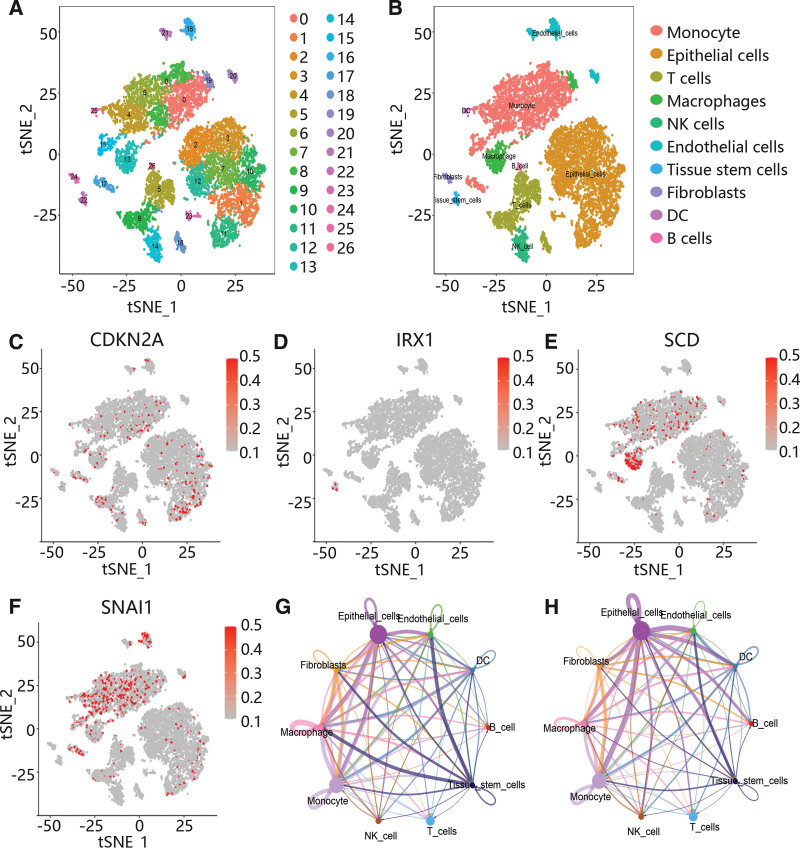
Subsequently, to further explore the potential mechanism, 4 scRNA data were integrated and analyzed. After quality control and batch normalization, these cells were clustered using t-SNE. A total of 27 clusters were identified, and 10 major cell types were annotated, including monocyte, epithelial cells, T cells, macrophages, endothelial cells, tissue stem cells, fibroblasts, dendritic cell and B cells (Figs. 5A-B). Moreover, CDKN2A, SCD, and SNAI1 were highly expressed in monocytes, macrophages and epithelial cells, while IRX1 was highly expressed in tissue stem cells (Figs. 5C-F). Furthermore, the cell communication results showed that monocytes, macrophages and epithelial cells had the most and strongest interactions with other cells (Fig. 5G-H, Figure S1, Supplemental Digital Content, http://links.lww.com/MD/M495), and some receptor-ligand pairs played vital roles in the interaction among different cell types, including TGFB1/TGFbR1_R2 and TNF/ TNFRSF1B (Figure S2, Supplemental Digital Content, http://links.lww.com/MD/M496).
3.6. The expression and prognosis value of hub genes
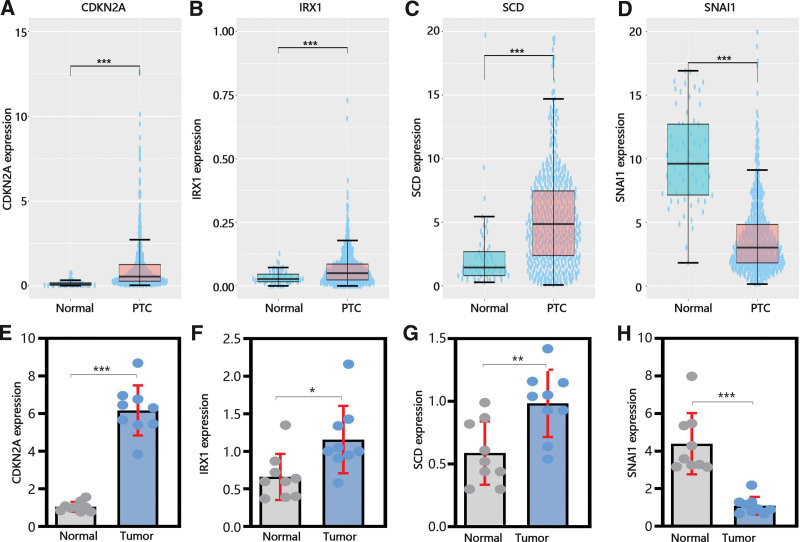
Next, to explore the function of hub genes in the development and metastasis of PTC. We determined their expression in normal and tumor samples. From Figure 6A-C, it was obvious that CDKN2A, IRX1, and SCD was upregulated in PTC samples compared with normal samples in TCGA database, while SNAI1 was downregulated in PTC samples (Fig. 6D). As similar as the results of TCGA database, qRT-PCR results also exhibited that the expression of CDKN2A, IRX1 and SCD were upregulated in PTC samples and SNAI1 was downregulated in PTC samples (Figs. 6E-H).
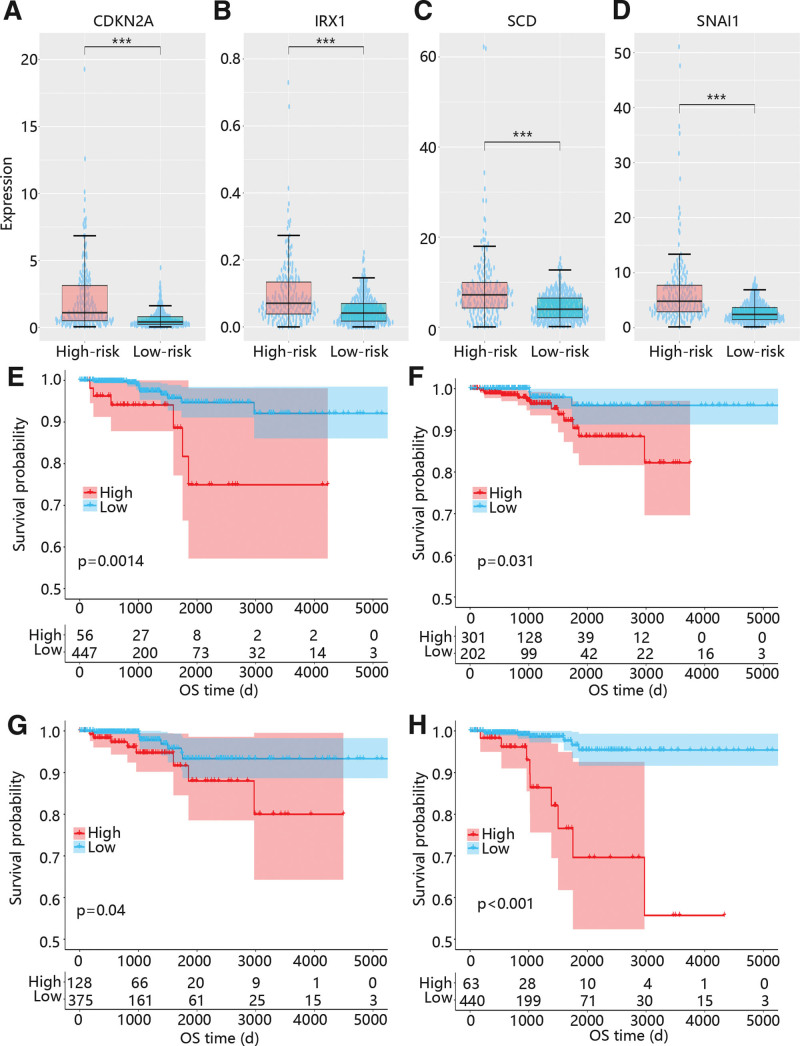
As shown in Figure 7, CDKN2A, IRX1, SCD, and SNAI1 were all upregulated in high risk groups (Figs. 7A-D), and the high expressions of them were all closely related to the poor prognosis of PTC (Figs. 7E-H).
3.7. The correlation of hub genes with immune escape-related genes and pairs of ligand and receptor
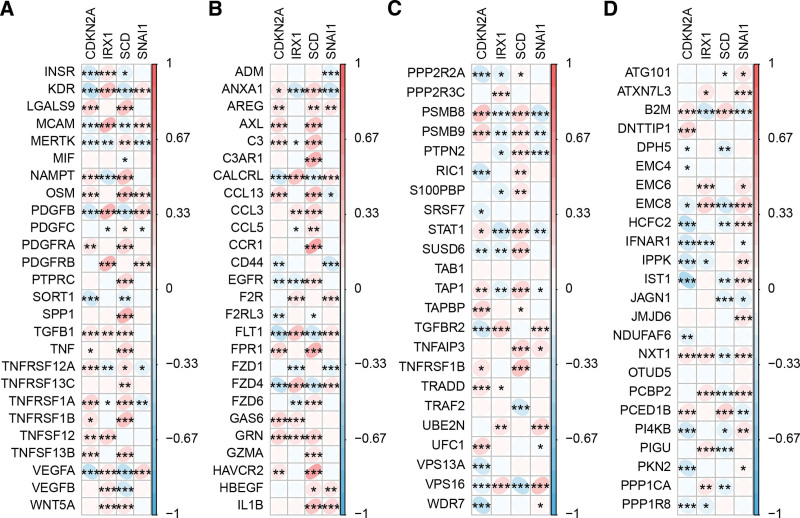
Next, we analyzed the function of hub genes in the immune system. The results showed that CDKN2A, IRX1, SCD, and SNAI1 were most closely and positively related to PSMB8, VPS16, TNFRSF1B, and VPS16, respectively, based on the immune escape-related genes (Figs. 8A-B). In addition, CDKN2A, IRX1, SCD, and SNAI1 were most closely and positively related to GAS6, MCAM, CCR1, and VEGFA, respectively, based on the ligand and receptor pairs of monocytes, macrophages and epithelial cells (Figs. 8C-D).
3.8. The function enrichment analysis and PPI network of the hub genes
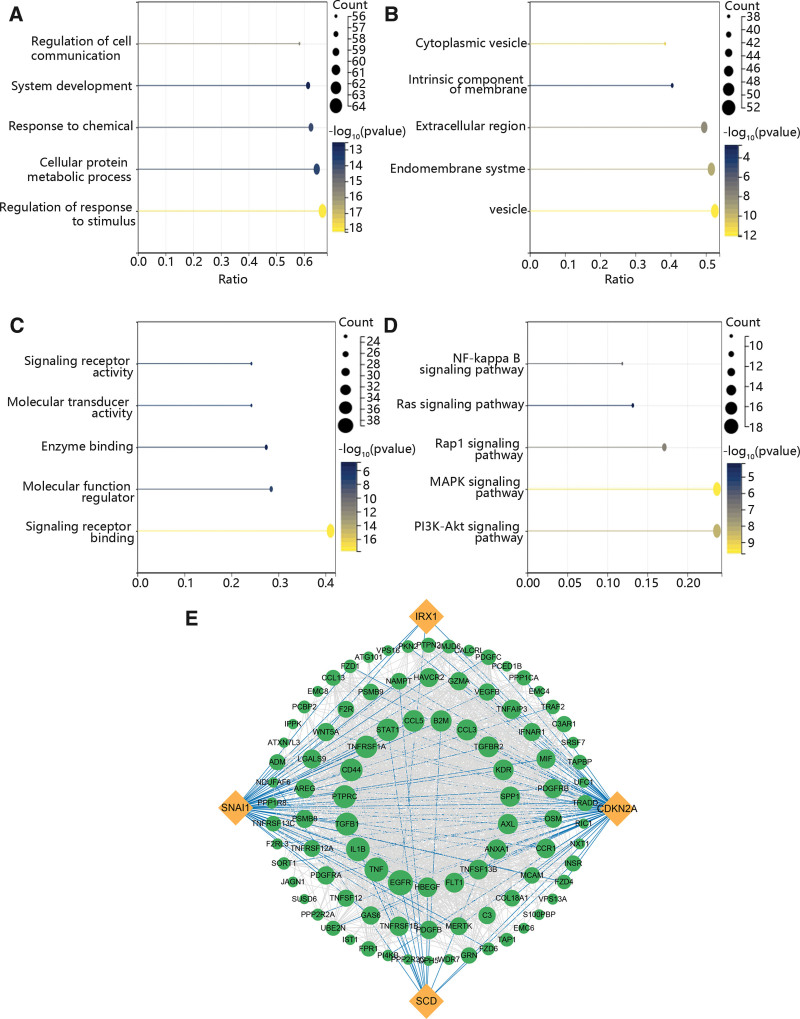
Based on the above results, we determined the enriched function of immune escape-related genes and pairs of ligands and receptors which were significantly related to the hub genes using GO and KEGG analysis. The results exhibited that these genes played vital roles in the regulation of response to stimulus, cellular protein metabolic process and response to chemical (Fig. 9A). The GO results also displayed that these genes were mainly expressed in vesicle, endomembrane system and extracellular region (Fig. 9B). In the term of MF, they were enriched in signaling receptor binding, molecular function regulator and enzyme binding (Fig. 9C). KEGG enrichment pathway included PI3K-Akt signaling pathway, MAPK signaling pathway and Rap1 signaling pathway (Fig. 9D). Additionally, we constructed a PPI network to further assess their correlation. Figure 9E exhibited that CDKN2A has the highest degree, while IRX1 has the lowest degree.
3.9. The drug sensitivity of hub genes
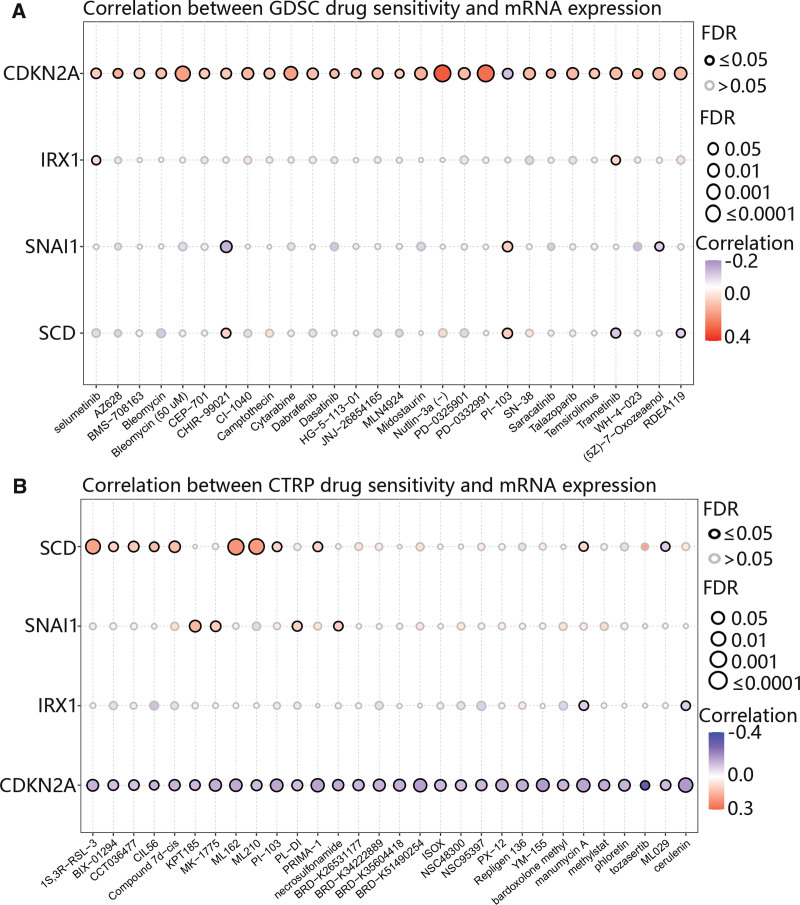
Finally, we assess the value of hub genes for clinical treatment using the GDSC and CTRP databases. It was obvious that CDKN2A was positively related to most drugs based on the GDSC database (Fig. 10A), In stark contrast, the CTRP database revealed a negative relationship between CDKN2A and the majority of the drugs investigated (Fig. 10B). Additionally, SCD was closely related to ML210, ML162, and 1S,3R-RSL-3 (Fig. 10B).
4. Discussion
PTC is a common tumor and generally has a good prognosis, but the metastasis of the tumor is usually related to a poor prognosis of PTC.[19] Anoikis is a physiologically programmed apoptosis, which could maintain tissue homeostasis through eliminating detached cells.[20] Moreover, anoikis has been considered as an essential factor in promoting tumor metastasis.[21] Thus, anoikis may be involved in the development of PTC. Given that ARG signatures and potential mechanisms have not been studied in PTC, we identified the function of anoikis-related signatures in PTC using a comprehensive analysis of scRNA and bulk RNA.
In this study, we leveraged ARGs and the expression profiles of PTC to ascertain the differentially expressed ARGs that are closely related to the OS of PTC patients. Furthermore, a risk model based on 4 ARGs was developed with stable and effective accuracy for predicting the OS of PTC. GSVA results exhibited that the high risk group was enriched in EMT and apoptosis, which fit with previous mechanistic knowledge.
As previous studies described, the increasing level of TNFA-NFκB could enhance the suppressive function of Treg cells through inducing the proliferation of Treg cells, resulting in the immune escape of tumor cells.[22,23] In addition, IL2-STAT5 could also regulate the activation of Treg cells through inducing Foxp3.[24] Besides, we found that the high risk group was also enriched in angiogenesis, TNFA-NFκB signal pathway and IL2-STAT5 signal pathway. It indicated that ARGs may be involved in the development of PTC through promoting angiogenesis and inhibiting immune response. Moreover, it had been reported that CD8 T cells mediated cytotoxicity and played a vital role in immune response,[25] but the activation and differentiation of CD8 T cells was negatively regulated by Treg cells.[26] Furthermore, previous studies have highlighted the suppressive effects of Treg cells on CD8 + T cells, leading to increased expression of immunosuppressive molecules by tumors as a means of immune evasion.[27] In our study, we observed an increased TIDE score and a decreased MSI score in the high-risk group. Moreover, the infiltration levels of CD8T cells and monocytes were downgraded, while the Treg infiltration level was upgraded. These results suggested that the high risk group was closely related to the high possibility of tumor immune escape and poor prognosis of immune checkpoint blocking therapy through activating Treg cells and inhibiting CD8 T cells.
The risk model included 4 signatures, namely CDKN2A, IRX1, SCD, and SNAI1. CDKN2A is a member of the family of cyclin-dependent kinase inhibitor genes and may be involved in the development of EMT and infiltration of immune cells through regulating LIPH expression.[28] Besides, it had been widely reported that CDKN2A was related to the poor prognosis of various cancers, including hepatocellular carcinoma, gliomas and colorectal cancer.[29–31] Both SCD and SNAI1 are recognized oncogenes in multiple cancer types. Liu et al found that SCD could promote the metastasis of tumor cells through mediating lipid metabolic reprogramming.[32] Besides, SNAI1 have a positive effect on the development and invasion of various tumors through inducing EMT.[33–35] In addition, IRX1, a member of the iroquois homeobox transcription factor family, has been identified as a tumor suppressor in several cancers, including lung adenocarcinoma, gastric cancer and invasive ductal carcinoma.[36–39] In our study, we found that high expressions of CDKN2A, SCD and SNAI1 were closely related to the poor prognosis, which was consistent with previous studies. However, our results identified that IRX1 was an oncogene in PTC. It suggested that the function of IRX1 may vary depending on the type of cancer cells. Moreover, we found they were significantly related to the immune escape genes and the receptor and ligand pairs existed in the monocytes, macrophages and T cells. Combining the previous results of immune infiltration, we inferred that hub genes may activate the Tregs to inhibit the function of CD8T cells, which caused the immune escape of tumor cells and promoted the development of PTC. Moreover, while the TIDE scores and immune microenvironment analysis suggest challenges in achieving beneficial effects from immunotherapy in high-risk groups, the drug sensitivity results demonstrated that CDKN2A could be a target for chemotherapy because the low CDKN2A expression was closely related to the promising prognosis and high drug sensitivity.
However, our analysis was based on the TCGA database which was mainly containing Caucasians. Thus, the results may be not suitable for all human beings. Secondly, ensure the accuracy and reliability of our findings, it is crucial to perform large-scale clinical trials that directly validate the associations we have identified. Clinical trials would provide more comprehensive and robust evidence regarding the prognostic value of the hub genes included in our risk model. Thirdly, the results were inferred based on the bioinformation, which needs to be verified in vivo and in vitro experiments. In conclusion, we identified that high expressions of CDKN2A, IRX1, SCD and SNAI1 were closely related to the poor prognosis of PTC, and we constructed a risk model based on these hub genes with great effectiveness and stability. Moreover, we inferred that the potential mechanism of anoikis may be related to the immune escape of tumor cells through mediating the activity of Tregs cells and CD8 T cells.
Author contributions
Conceptualization: Ke Zheng.
Data curation: Ke Zheng, Xiu-xia Zhang, Yi-fei Yang.
Formal analysis: Ke Zheng, Xiu-xia Zhang.
Investigation: Xin Yu.
Methodology: Ke Zheng, Xin Yu, Bin Yu.
Supervision: Yi-fei Yang.
Writing – original draft: Ke Zheng, Xiu-xia Zhang, Xin Yu, Bin Yu.
Writing – review & editing: Yi-fei Yang.
Supplementary Materials
References
- C Shao, Z Li, C Zhang. Optical diagnostic imaging and therapy for thyroid cancer.. Mater Today Bio., 2022
- X Xu, J Jing. Advances on circRNAs contribute to carcinogenesis and progression in papillary thyroid carcinoma.. Front Endocrinol (Lausanne)., 2020. [PubMed]
- Y Yao, X Chen, H Yang. Hsa_circ_0058124 promotes papillary thyroid cancer tumorigenesis and invasiveness through the NOTCH3/GATAD2A axis.. J Exp Clin Cancer Res., 2019. [PubMed]
- Y Huang, K Zhang, Y Li, Y Dai, H Zhao. The DLG1-AS1/miR-497/YAP1 axis regulates papillary thyroid cancer progression.. Aging (Albany NY)., 2020. [PubMed]
- Y Ding, L Wu, X Zhuang. The direct miR-874-3p-target FAM84A promotes tumor development in papillary thyroid cancer.. Mol Oncol., 2021. [PubMed]
- H Li, Q Han, Y Chen. Upregulation of the long non-coding RNA FOXD2-AS1 is correlated with tumor progression and metastasis in papillary thyroid cancer.. Am J Transl Res., 2019. [PubMed]
- FO Adeshakin, AO Adeshakin, LO Afolabi, D Yan, G Zhang, X Wan. Mechanisms for modulating anoikis resistance in cancer and the relevance of metabolic reprogramming.. Front Oncol., 2021. [PubMed]
- X Zhou, L Li, X Guo. HBXIP induces anoikis resistance by forming a reciprocal feedback loop with Nrf2 to maintain redox homeostasis and stabilize Prdx1 in breast cancer.. NPJ Breast Cancer., 2022. [PubMed]
- Y Li, Q Pan, M Cheng, Z Wu. Identification and validation of anoikis-associated gene SNCG as a prognostic biomarker in gastric cancer.. Aging (Albany NY)., 2023. [PubMed]
- S Chen, J Gu, Q Zhang, Y Hu, Y Ge. Development of biomarker signatures associated with anoikis to predict prognosis in endometrial carcinoma patients.. J Oncol., 2021. [PubMed]
- X Lu, Q Yuan, C Zhang, S Wang, W Wei. Predicting the immune microenvironment and prognosis with a anoikis – related signature in breast cancer.. Front Oncol., 2023. [PubMed]
- TC Windham, NU Parikh, DR Siwak. Src activation regulates anoikis in human colon tumor cell lines.. Oncogene., 2002. [PubMed]
- G Ye, Q Yang, X Lei. Nuclear MYH9-induced CTNNB1 transcription, targeted by staurosporin, promotes gastric cancer cell anoikis resistance and metastasis.. Theranostics., 2020. [PubMed]
- L Jin, J Chun, C Pan. The PLAG1-GDH1 axis promotes anoikis resistance and tumor metastasis through CamKK2-AMPK signaling in LKB1-deficient lung cancer.. Mol Cell., 2018. [PubMed]
- CL Buchheit, BL Angarola, A Steiner, KJ Weigel, ZT Schafer. Anoikis evasion in inflammatory breast cancer cells is mediated by Bim-EL sequestration.. Cell Death Differ., 2015. [PubMed]
- Z Cai, F Zhou. A novel Anoikis and immune-related genes marked prognostic signature for colorectal cancer.. Medicine (Baltimore)., 2022. [PubMed]
- J Dubrot, PP Du, SK Lane-Reticker. In vivo CRISPR screens reveal the landscape of immune evasion pathways across cancer.. Nat Immunol., 2022. [PubMed]
- B Gao, Y Wang, C Li, S Lu. Estrogen-related genes influence immune cell infiltration and immunotherapy response in hepatocellular carcinoma.. Front Immunol., 2023. [PubMed]
- M Selmansberger, A Michna, H Braselmann. Transcriptome network of the papillary thyroid carcinoma radiation marker CLIP2.. Radiat Oncol., 2020. [PubMed]
- Q Li, K Wang, Y Shen, C Lin, J Miao, X Hu. Bioinformatics based exploration of hsa-miR-194-5p regulation of CHD4 through PI3K/AKT signal pathway to enhance tumor resistance to apoptosis due to loss of nests and participate in poor prognosis of oral squamous cell carcinoma.. Ann Transl Med., 2023. [PubMed]
- R Di Micco, V Krizhanovsky, D Baker, F d’Adda di Fagagna. Cellular senescence in ageing: from mechanisms to therapeutic opportunities.. Nat Rev Mol Cell Biol., 2021. [PubMed]
- MK Jung, JS Lee, JE Kwak, EC Shin. Tumor necrosis factor and regulatory T cells.. Yonsei Med J., 2019. [PubMed]
- Y Cui, M Benamar, K Schmitz-Abe. A Stk4-Foxp3-NF-kappaB p65 transcriptional complex promotes T(reg) cell activation and homeostasis.. Sci Immunol., 2022. [PubMed]
- DM Jones, KA Read, KJ Oestreich. Dynamic roles for IL-2-STAT5 signaling in effector and regulatory CD4(+) T cell populations.. J Immunol., 2020. [PubMed]
- T Zhang, H Liu, L Jiao. Genetic characteristics involving the PD-1/PD-L1/L2 and CD73/A2aR axes and the immunosuppressive microenvironment in DLBCL.. J Immunother Cancer., 2022. [PubMed]
- S Niu, K Liu, Y Xu. Genomic landscape of Chinese clear cell renal cell carcinoma patients with venous tumor thrombus identifies chromosome 9 and 14 deletions and related immunosuppressive microenvironment.. Front Oncol., 2021. [PubMed]
- L Zhang, D Hu, S Huangfu. DNA repair and replication-related gene signature based on tumor mutation burden reveals prognostic and immunotherapy response in gastric cancer.. J Oncol., 2022. [PubMed]
- H Zhuang, X Chen, Y Wang. Identification of LIPH as an unfavorable biomarkers correlated with immune suppression or evasion in pancreatic cancer based on RNA-seq.. Cancer Immunol Immunother., 2022. [PubMed]
- JP Luo, J Wang, JH Huang. CDKN2A is a prognostic biomarker and correlated with immune infiltrates in hepatocellular carcinoma.. Biosci Rep., 2021. [PubMed]
- P Sledzinska, MG Bebyn, J Furtak, J Kowalewski, MA Lewandowska. Prognostic and predictive biomarkers in gliomas.. Int J Mol Sci., 2021. [PubMed]
- CC Lee, YC Kuo, JM Hu. MTNR1B polymorphisms with CDKN2A and MGMT methylation status are associated with poor prognosis of colorectal cancer in Taiwan.. World J Gastroenterol., 2021. [PubMed]
- HH Liu, Y Xu, CJ Li. An SCD1-dependent mechanoresponsive pathway promotes HCC invasion and metastasis through lipid metabolic reprogramming.. Mol Ther., 2022. [PubMed]
- T Shen, C Yue, X Wang. NFATc1 promotes epithelial-mesenchymal transition and facilitates colorectal cancer metastasis by targeting SNAI1.. Exp Cell Res., 2021. [PubMed]
- Z Liang, S Tang, R He, W Luo, S Qin, H Jiang. The effect and mechanism of miR-30e-5p targeting SNAI1 to regulate epithelial-mesenchymal transition on pancreatic cancer.. Bioengineered., 2022. [PubMed]
- D Singh, RK Deshmukh, A Das. SNAI1-mediated transcriptional regulation of epithelial-to-mesenchymal transition genes in breast cancer stem cells.. Cell Signal., 2021. [PubMed]
- J Lu, G Song, Q Tang. IRX1 hypomethylation promotes osteosarcoma metastasis via induction of CXCL14/NF-kappaB signaling.. J Clin Invest., 2015. [PubMed]
- MM Kuster, MA Schneider, AM Richter. Epigenetic inactivation of the tumor suppressor IRX1 occurs frequently in lung adenocarcinoma and its silencing is associated with impaired prognosis.. Cancers (Basel)., 2020. [PubMed]
- D Wu, Z Li, S Zhao, B Yang, Z Liu. Downregulated microRNA-150 upregulates IRX1 to depress proliferation, migration, and invasion, but boost apoptosis of gastric cancer cells.. IUBMB Life., 2020. [PubMed]
- B He, J Chen, W Song, Y Bai. miR-646/TET1 mediated demethylation of IRX1 promoter upregulates HIST2H2BE and promotes the progression of invasive ductal carcinoma.. Genomics., 2021. [PubMed]