
The Role of ULK3 in Cancer Progression: A Pan-Cancer Bioinformatics Analysis Integrated with Experimental Validation in Prostate Cancer
Abstract
Unc-51-like kinase 3 (ULK3) is a key member of the ULK serine/threonine kinase family. Aberrant ULK3 expression has been increasingly linked to tumorigenesis and malignant progression in multiple cancer types. However, the precise role of ULK3 in tumor initiation and progression remains incompletely understood. Leveraging integrated multi-omics data from The Cancer Genome Atlas (TCGA), the Genotype-Tissue Expression (GTEx) project, and the Clinical Proteomic Tumor Analysis Consortium (CPTAC), we systematically characterized the expression of ULK3 at both the transcript and protein levels across 33 cancer types. We also evaluated genomic alterations, prognostic significance, alternative splicing, pathway enrichment, tumor stemness, immune infiltration, and immunotherapy-related biomarkers. In parallel, we investigated the function of ULK3 in prostate cancer PC-3 cells using cellular localization analysis, wound-healing assays, and MTT assays. We further applied Connectivity Map (CMap) screening and molecular docking to identify candidate ULK3 activators. ULK3 was significantly upregulated in 13 cancer types, including Bladder Urothelial Carcinoma, Breast Invasive Carcinoma, and Lung Adenocarcinoma. In contrast, ULK3 was downregulated in Cholangiocarcinoma and Head and Neck Squamous Cell Carcinoma. High ULK3 expression was associated with poor overall survival in Adrenocortical Carcinoma, Kidney Renal Clear Cell Carcinoma, and Skin Cutaneous Melanoma. Copy number amplification contributed to ULK3 overexpression. A recurrent A206V missense mutation was detected in the protein kinase (Pkinase) domain. Genes co-expressed with ULK3 were enriched in RNA splicing, methylation, oxidative phosphorylation, and energy metabolism. ULK3 expression showed positive correlations with tumor stemness indices and m1A/m5C/m6A RNA modification regulators. From an immunological perspective, high ULK3 expression was associated with lower Immune Score, increased M2 macrophage infiltration, and co-expression of PD-L1, CTLA4, and LAG3 in most cancers. ULK3 expression was also correlated with Tumor Mutational Burden in Kidney Renal Clear Cell Carcinoma and Rectum Adenocarcinoma. In addition, ULK3 expression was associated with Microsatellite Instability in Brain Lower Grade Glioma, Lung Adenocarcinoma, and Uterine Corpus Endometrial Carcinoma. ULK3 overexpression promoted proliferation and migration in PC-3 cells. Cephaeline was screened as a putative ULK3 activator. Overall, ULK3 expression and amplification were associated with poor clinical outcomes, tumor stemness, immunosuppression, and RNA dysregulation. These findings highlight the potential value of ULK3 as a pan-cancer diagnostic and prognostic biomarker and as a predictor of immunotherapy response, particularly in prostate cancer.
Article type: Research Article
Keywords: pan-cancer, prognostic biomarkers, immunity, prostate cancer
Affiliations: Department of Biology, School of Basic Medical Sciences, Xinjiang Medical University, Urumqi 830017, China; yyhan@xjmu.edu.cn (Y.H.); 13894343612@163.com (M.Z.); 18999960754@163.com (M.R.); 15098373960@163.com (X.L.); 18199840012@163.com (Y.L.); 13899065367@163.com (N.Z.); sm199901@163.com (M.S.); 18768900024@163.com (Y.Z.); Xinjiang Key Laboratory of Molecular Biology for Endemic Diseases, Xinjiang Medical University, Urumqi 830017, China; axiangu@xjmu.edu.cn; Key Laboratory of High Incidence Disease Research in Xingjiang, Xinjiang Medical University, Ministry of Education, Urumqi 830017, China; Department of Basic Medicine, Xinjiang Medical University, Urumqi 830017, China
License: © 2026 by the authors. CC BY 4.0 Licensee MDPI, Basel, Switzerland. This article is an open access article distributed under the terms and conditions of the Creative Commons Attribution (CC BY) license.
Article links: DOI: 10.3390/ijms27136040 | PMC: PMC13361878
Relevance: Moderate: mentioned 3+ times in text
Full text: PDF (39.7 MB)
1. Introduction
At present, cancer remains one of the leading causes of death worldwide. Its marked heterogeneity, high tendency for recurrence and metastasis, and frequent drug resistance severely limit the improvement of clinical outcomes [ref. 1]. Although targeted therapy and immunotherapy have achieved major advances in certain cancers, most patients still face several critical challenges. These challenges include the lack of effective predictive markers, variable treatment responses, and inaccurate prognostic assessment. Therefore, the identification of novel biomarkers with diagnostic, prognostic, and treatment-guiding value has become a central need in cancer therapy.
The ULK (Unc-51-like kinase) family comprises a group of serine/threonine protein kinases. These kinases play important roles in autophagy initiation, cellular metabolism, and signal transduction [ref. 2]. This family includes Unc-51-like kinase 1 (ULK1), Unc-51-like kinase 2 (ULK2), and Unc-51-like kinase 3 (ULK3). Among them, ULK1 and ULK2 are core regulators of the canonical autophagy pathway and have been widely investigated [ref. 3]. Accumulating evidence shows that dysregulated ULK1 expression occurs in various malignancies. ULK1 contributes to major oncogenic processes, including tumor growth and dissemination, therapy resistance, and regulation of the tumor immune landscape. For example, ULK1 deficiency in pancreatic ductal adenocarcinoma (PDAC) suppresses autophagic activity, inhibits tumor growth, and increases CD8+ T lymphocyte infiltration [ref. 4]. In contrast, elevated ULK1 expression in epithelial ovarian cancer (EOC) is strongly associated with shorter overall survival [ref. 5]. In addition, ULK1 and ULK2 may negatively regulate the PTK2/SRC signaling axis by phosphorylating the focal adhesion protein PXN through a non-canonical autophagy pathway. This process suppresses focal adhesion formation, disrupts cellular mechano-transduction, and reduces the migratory capacity of breast cancer cells [ref. 6]. ULK2 also acts as a tumor suppressor in gastric cancer. Promoter methylation-mediated silencing of ULK2 expression may be associated with epithelial–mesenchymal transition through autophagy activation. This mechanism may promote gastric cancer cell migration and phenotypic transition toward poor differentiation [ref. 7].
The substrate specificity and regulatory network of ULK3 differ from those of ULK1 and ULK2. In cancer, ULK3 expression and function appear to be tissue-specific. In squamous cell carcinoma (SCC), ULK3 is upregulated. ULK3 silencing significantly inhibits tumor cell proliferation, colony formation, and in vivo tumorigenicity. The underlying mechanism involves regulation of PRMT1/5 activity, which alters histone methylation and modulates stem cell-associated signaling pathways [ref. 8]. In breast cancer, ULK3 expression shows greater complexity. Its overall expression level is lower in tumor tissues than in matched normal tissues. In vitro studies have shown that ULK3 overexpression suppresses the proliferation and migration of MCF-7 cells [ref. 9]. Moreover, ULK3 upregulation activates autophagy and induces neuronal injury in an Alzheimer’s disease model. In contrast, ULK3 inhibition effectively alleviates the related pathological phenotypes [ref. 10]. These findings indirectly suggest that ULK3 is involved in cellular homeostasis. Current evidence indicates that ULK3 may function as either a tumor-promoting or tumor-suppressive factor in different cancer types. This dual role highlights its potential importance as a prognostic biomarker and therapeutic target.
Although ULK1 and ULK2 have been extensively studied in multiple cancers and have shown clear clinical potential, ULK3 remains largely unexplored in the pan-cancer context. Existing studies are mainly limited to individual cancer types, such as SCC and breast invasive carcinoma (BRCA). Comprehensive analyses of ULK3 expression profiles, prognostic associations, and immune-regulatory mechanisms across cancers remain insufficient. Large-scale multi-omics databases, including The Cancer Genome Atlas Program (TCGA), Genotype-Tissue Expression (GTEx), and the Clinical Proteomic Tumor Analysis Consortium (CPTAC), provide valuable resources for such analyses. ULK3 may exert opposite functional effects in different tumor types, such as tumor-promoting effects in SCC and tumor-suppressive effects in BRCA [ref. 8,ref. 9]. Moreover, the role of ULK3 in shaping the tumor immune microenvironment remains poorly understood. Its potential influence on immune checkpoint expression, immunotherapy response, and downstream signaling networks also requires further investigation. Therefore, this study comprehensively evaluates ULK3 expression patterns, prognostic significance, and immune-regulatory mechanisms across multiple cancer types. This study aims to provide a theoretical basis and empirical evidence for the potential clinical application of ULK3 as a functional biomarker in oncology.
The role of ULK3 in prostate cancer remains unclear. Our group has long focused on basic and translational research in prostate cancer. In previous studies, we showed that prostate cancer cell lines are suitable models for validating pan-cancer oncogene functions. In the present study, we analyzed ULK3 expression across multiple cancer types. We found that ULK3 was significantly upregulated in prostate cancer. High ULK3 expression was significantly associated with poor progression-free survival in patients with prostate cancer. ULK3 expression was also closely related to multiple immune checkpoint molecules and indicators of an immunosuppressive microenvironment. Therefore, we further investigated the expression characteristics, clinical significance, and potential biological functions of ULK3 in prostate cancer cells in vitro. These analyses aimed to provide experimental evidence supporting ULK3 as a potential biomarker and therapeutic target in prostate cancer. This rationale explains why prostate cancer was selected as the validation model.
2. Results
2.1. Differential Expression Analysis of ULK3 in Pan-Cancer
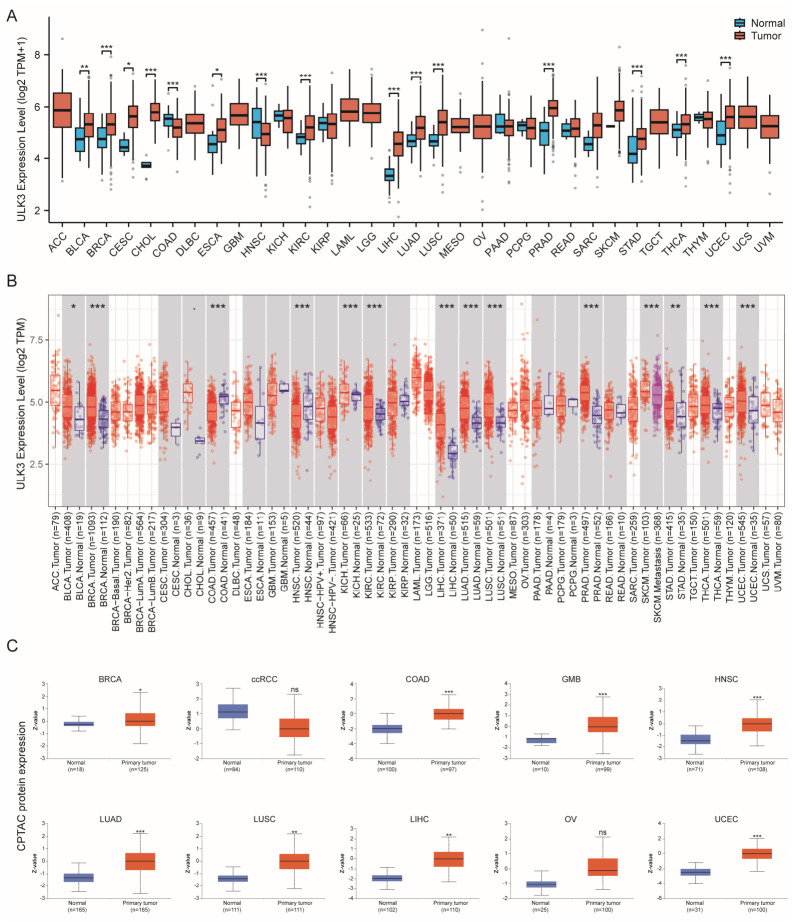
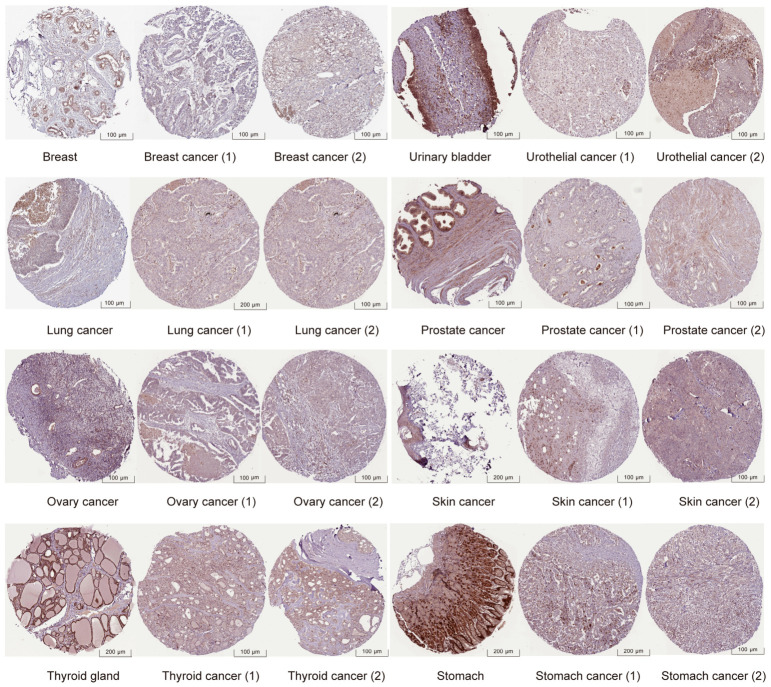
We investigated the mRNA expression levels of ULK3 in normal human tissues and tumor tissues by analyzing RNA sequencing (RNA-seq) data from the TCGA and GTEx databases. Our analysis revealed marked heterogeneity in ULK3 expression across 33 cancer types, after excluding malignancies without matched normal tissue controls. Compared with normal controls, ULK3 expression was significantly increased in Bladder Urothelial Carcinoma (BLCA, p = 0.0016), Breast Invasive Carcinoma (BRCA, p = 2.01 × 10⁻¹⁹), Cervical Squamous Cell Carcinoma and Endocervical Adenocarcinoma (CESC, p = 0.0126), Colon Adenocarcinoma (COAD, p = 1.34 × 10⁻⁵), Esophageal Carcinoma (ESCA, p = 0.041), Kidney Renal Clear Cell Carcinoma (KIRC, p = 5.58 × 10⁻⁸), Liver Hepatocellular Carcinoma (LIHC, p = 2.71 × 10⁻²³), Lung Adenocarcinoma (LUAD, p = 2.58 × 10⁻¹¹), Lung Squamous Cell Carcinoma (LUSC, p = 2.35 × 10⁻¹³), Prostate Adenocarcinoma (PRAD, p = 3.20 × 10⁻²¹), Stomach Adenocarcinoma (STAD, p = 0.001), Thyroid Carcinoma (THCA, p = 0.0001), and Uterine Corpus Endometrial Carcinoma (UCEC, p = 0.0001) (Figure 1A). In contrast, ULK3 expression was significantly decreased in Cholangiocarcinoma (CHOL, p < 0.001) and Head and Neck Squamous Cell Carcinoma (HNSC, p < 0.001) compared with the corresponding normal tissues (Figure 1A, Supplementary Table S2). To further assess the pan-cancer expression pattern of ULK3, we analyzed ULK3 mRNA expression across different tumor types using the Tumor Immune Estimation Resource (TIMER) database. TIMER analysis showed that ULK3 expression was significantly higher in Bladder Urothelial Carcinoma (BLCA, p < 0.05), Breast Invasive Carcinoma (BRCA, p < 0.001), Colon Adenocarcinoma (COAD, p < 0.001), Kidney Chromophobe (KICH, p < 0.001), Kidney Renal Clear Cell Carcinoma (KIRC, p < 0.001), Liver Hepatocellular Carcinoma (LIHC, p < 0.001), Lung Adenocarcinoma (LUAD, p < 0.001), Lung Squamous Cell Carcinoma (LUSC, p < 0.001), Prostate Adenocarcinoma (PRAD, p < 0.001), Skin Cutaneous Melanoma (SKCM, p < 0.001), Stomach Adenocarcinoma (STAD, p < 0.01), Thyroid Carcinoma (THCA, p < 0.001), and Uterine Corpus Endometrial Carcinoma (UCEC, p < 0.001) (Figure 1B, Supplementary Table S2). We also compared ULK3 protein expression between primary tumor tissues and normal tissues using the UALCAN database. This database includes proteomic data across multiple cancer types. The results showed that ULK3 protein expression was significantly higher in eight cancer types, including Breast Invasive Carcinoma (BRCA, p = 3.14 × 10⁻²), Colon Adenocarcinoma (COAD, p = 3.45 × 10⁻⁵), Glioblastoma Multiforme (GBM, p = 2.94 × 10⁻¹⁵), Head and Neck Squamous Cell Carcinoma (HNSC, p = 2.19 × 10⁻²⁶), Lung Adenocarcinoma (LUAD, p = 2.79 × 10⁻⁷), Lung Squamous Cell Carcinoma (LUSC, p = 1.55 × 10⁻³), Liver Hepatocellular Carcinoma (LIHC, p = 1.04 × 10⁻³), and Uterine Corpus Endometrial Carcinoma (UCEC, p = 1.22 × 10⁻⁶) (Figure 1C, Supplementary Table S3). We further examined ULK3 protein expression using immunohistochemical staining images from The Human Protein Atlas (HPA) public database. ULK3 protein showed differential expression in eight cancer types compared with the corresponding normal tissues (Figure 2). These immunohistochemical findings were generally consistent with the mRNA expression results shown in Figure 1. Collectively, these data indicate that ULK3 expression is significantly altered in multiple cancer types. The increased expression of ULK3 in many tumors suggests that ULK3 may be involved in tumorigenesis. These findings also support its potential value as a candidate diagnostic biomarker in specific cancer types. Furthermore, these observations highlight the need for a comprehensive pan-cancer analysis to clarify the broader oncological significance of ULK3.
2.2. Analysis of the Correlation Between ULK3 Expression and Pan-Cancer Prognosis
We further analyzed the association between ULK3 expression and patient prognosis across multiple cancer types. In the overall survival (OS) analysis, high ULK3 expression was significantly associated with shorter OS in ACC (HR = 2.54, 95% CI: 1.14–5.66, p = 0.0221), KIRC (HR = 1.14, 95% CI: 1.04–1.90, p = 0.0291), LAML (HR = 1.80, 95% CI: 1.18–2.76, p = 0.0072), SKCM (HR = 1.55, 95% CI: 1.18–2.03, p = 0.0021), and UVM (HR = 3.99, 95% CI: 1.48–10.80, p = 0.0064). In contrast, ULK3 expression was negatively associated with OS in PAAD (HR = 0.59, 95% CI: 0.39–0.90, p = 0.0031) (Figure 3A and Supplementary Figure S1A). In the disease-specific survival (DSS) analysis, high ULK3 expression was significantly associated with poorer outcomes in ACC (HR = 2.78, 95% CI: 1.20–6.44, p = 0.0170), LGG (HR = 1.45, 95% CI: 1.01–2.08, p = 0.0413), MESO (HR = 1.98, 95% CI: 1.08–3.65, p = 0.0308), SKCM (HR = 1.51, 95% CI: 1.13–2.01, p = 0.0074), and UVM (HR = 3.69, 95% CI: 1.35–10.09, p = 0.0108) (Figure 3B and Supplementary Figure S1B). Moreover, elevated ULK3 expression was correlated with a shorter progression-free interval (PFI) in ACC (HR = 2.15, 95% CI: 1.14–4.07, p = 0.0186), LGG (HR = 1.38, 95% CI: 1.04–1.82, p = 0.0399), LIHC (HR = 1.51, 95% CI: 1.13–2.03, p = 0.0061), PRAD (HR = 1.69, 95% CI: 1.11–2.56, p = 0.0275), UVM (HR = 2.52, 95% CI: 1.14–5.58, p = 0.0219) (Figure 3C, Supplementary Table S4 and Supplementary Figure S1C). To determine whether ULK3 expression independently influenced patient prognosis, we performed multivariate Cox regression analyses. We adjusted for clinicopathological covariates, including age, tumor stage, pathological grade, and sex. The results showed that ULK3 expression remained an independent prognostic factor for OS in ACC (HR = 2.14, 95% CI: 1.23–3.72, p = 0.007), KIRC (HR = 1.68, 95% CI: 1.12–2.51, p = 0.012), and SKCM (HR = 1.89, 95% CI: 1.18–3.02, p = 0.008). These associations were independent of conventional clinicopathological parameters. Taken together, these results demonstrate a strong correlation between ULK3 expression and poor clinical prognosis in diverse malignancies.
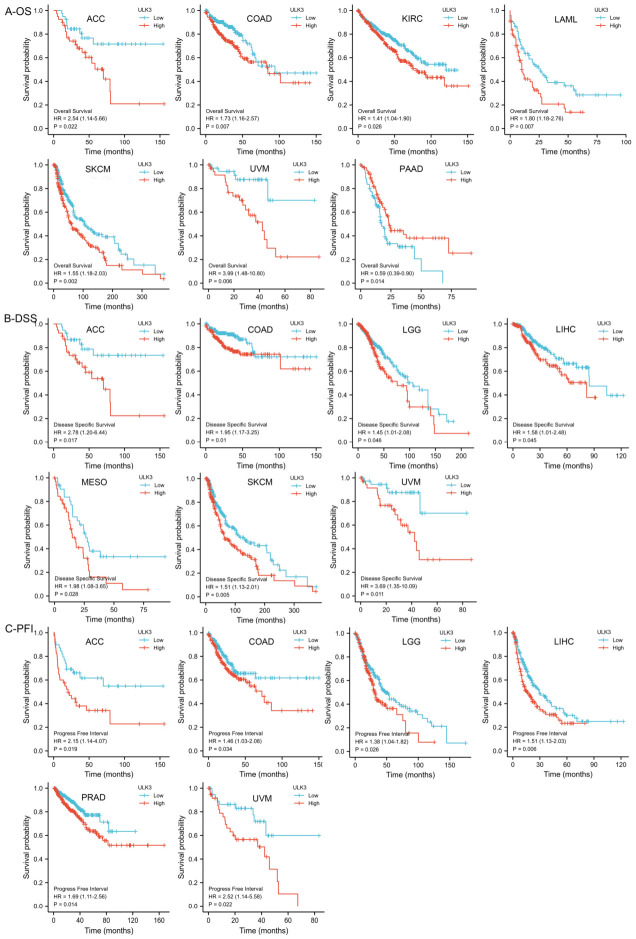
We also conducted a systematic analysis to examine whether ULK3 mRNA expression was associated with key clinicopathological parameters across multiple tumor types. In ACC, STAD, and SKCM, tumor stage was significantly associated with ULK3 expression levels. Notably, ULK3 expression was significantly associated with pathological stage in BLCA, SKCM, and TGCT (Supplementary Figure S2). Kaplan–Meier survival analysis further revealed that ULK3 expression was associated with prognosis in multiple cancer types, including BLCA (HR = 0.67, 95% CI: 0.49–0.92, p = 0.012), EAC (HR = 0.34, 95% CI: 0.15–0.77, p = 0.0074), ESCC (HR = 0.41, 95% CI: 0.18–0.95, p = 0.031), HNSC (HR = 0.66, 95% CI: 0.51–0.86, p = 0.0022), KIRC (HR = 1.84, 95% CI: 1.35–2.50, p = 1 × 10⁻⁴), KIRP (HR = 0.49, 95% CI: 0.27–0.88, p = 0.015), OV (HR = 0.76, 95% CI: 0.59–0.99, p = 0.042), PDAC (HR = 0.48, 95% CI: 0.31–0.73, p = 5 × 10⁻⁴), SARC (HR = 0.64, 95% CI: 0.43–0.96, p = 0.028), SCC (HR = 0.54, 95% CI: 0.34–0.87, p = 0.01), STAD (HR = 0.65, 95% CI: 0.47–0.90, p = 0.0097), and THYM (HR = 5.9, 95% CI: 1.47–23.63, p = 0.0044). Patients with reduced ULK3 expression showed markedly worse overall survival outcomes in the corresponding survival analyses (Supplementary Figure S3). These findings suggest that ULK3 may function as a tumor suppressor in specific cancer contexts and may influence both cancer aggressiveness and clinical prognosis.
2.3. Genomic Variation and Epigenetic Characteristics of ULK3
We next analyzed the genomic variation and epigenetic characteristics of ULK3 across cancers. Pan-cancer analysis based on SangerBox and TIMER 2.0 showed that ULK3 had a significant mutation frequency (>6%) and structural variant frequency (>4%) in lung cancer. Significant structural variant frequencies (>2%) were also detected in embryonal tumors, ovarian cancer, and esophagogastric cancer (Figure 4A). Among the cancer samples, UCEC showed the highest proportion of ULK3 mutations (2.825%), followed by BRCA (1.266%), COAD (1.232%), ACC (1.086%), SKCM (0.855%), and KIRC (0.811%). Missense mutations were the predominant mutation type (Figure 4B). Further analysis using cBioPortal and SangerBox showed that both missense mutations and deep deletions of ULK3 were detectable. Gene amplification was the most frequent genomic alteration. Missense mutations mainly occurred in the protein kinase (Pkinase) domain, and A206V represented the predominant variant. Collectively, these results indicate the potential utility of ULK3 genomic alterations as candidate biomarkers for clinical diagnosis (Figure 4C–E, Supplementary Table S5).
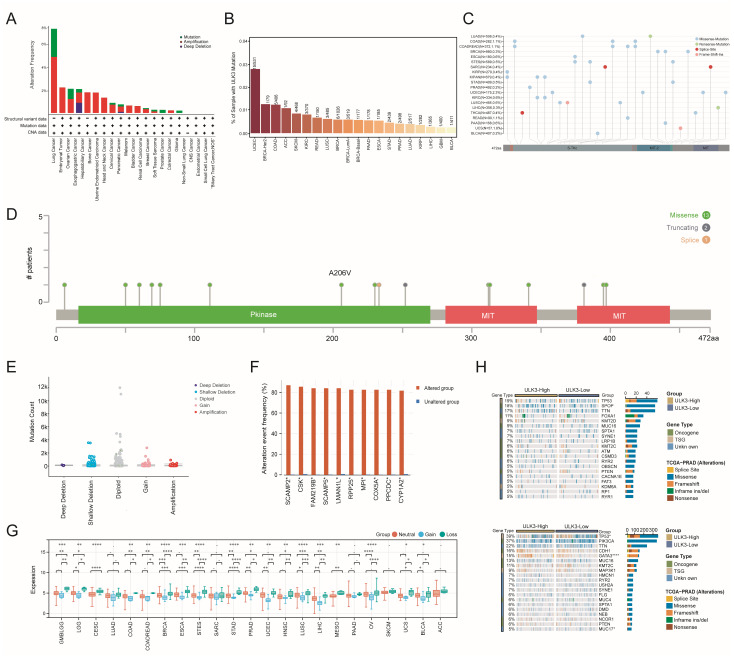
The most common copy number variation patterns were copy number gain and diploid status. Subsequent analysis using SangerBox showed that higher ULK3 copy number was significantly correlated with increased ULK3 mRNA expression in 18 different cancer types, including GBMLGG, LGG, CESC, COAD, COADREAD, BRCA, ESCA, STAD, PRAD, UCEC, HNSC, LIHC, LUSC, MESO, UCS, OV, and BLCA (Figure 4G, Supplementary Table S5). These findings indicate that copy number alterations may represent a major genomic mechanism regulating ULK3 expression.
Against the background of ULK3 genomic alterations, co-occurrence gene analysis showed that the mutation frequencies of SCAMP2, CSK, FAM219B, SCAMP5, LMAN1L, RPP25, MPI, COX5A, PPCDC, and CYP1A2 were significantly increased in the ULK3-altered group. These observations suggest that these molecules may cooperate with ULK3 in oncogenic signaling or jointly modulate malignant progression (Figure 4F). Finally, we used the cBioPortal web resource to investigate potential correlations between ULK3 expression levels and somatic mutation profiles. Across a broad spectrum of malignancies, ULK3 expression showed a statistically significant association with tumor mutational burden. In BRCA, the high-ULK3-expression group exhibited elevated frequencies of somatic mutations in TP53 (39%), GATA3 (15%), and MUC17 (5%) (Figure 4H, bottom).
In conclusion, genomic alterations in ULK3, including point mutations, copy number gains, and copy number losses, were observed across diverse tumor types. Missense mutations and copy number alterations represented the predominant forms of single-nucleotide variants and large-scale genomic structural alterations, respectively. These genomic changes may be involved in key oncogenic processes, including tumor initiation, growth, and progression. They may also serve as useful indicators for cancer diagnosis and prognostic assessment.
2.4. The Role of ULK3 Alternative Splicing in Determining Cancer Outcomes
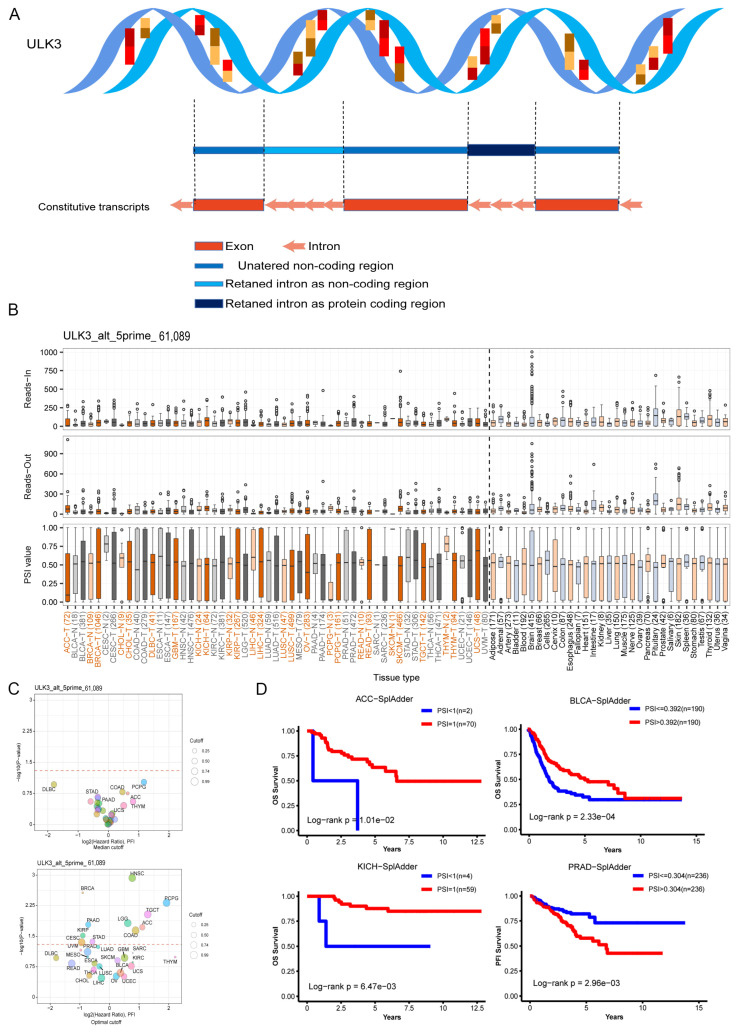
The impact of alternative splicing on cancer progression has been well recognized. Using the OncoSplice platform, we identified several ULK3 splicing variants. Figure 5A illustrates the ULK3-ALT-5-prist-61089 splicing event. This panel shows its splice-site architecture and cancer type-specific distribution pattern. Figure 5B shows the percent spliced-in (PSI) values of this splicing event in cancer tissues and normal tissues (Supplementary Table S6). This panel also presents the read-out and read-in data. Notably, the PSI values in BLCA, BRCA, COAD, HNSC, KICH, KIRC, KIRP, PCPG, READ, and THCA were higher than those in normal tissues. Figure 5C stratifies survival prognosis according to the median and optimal cutoff values of ULK3-ALT-5-prist-61089 expression. The results showed significant differences in kidney renal clear cell carcinoma and breast cancer. The Kaplan–Meier survival curves in Figure 5D showed that high PSI values in ACC, BLCA, and KICH were associated with shorter overall survival (OS). High PSI values in PRAD were associated with shorter progression-free interval (PFI). These results suggest that dysregulated ULK3 alternative splicing may play an important role in determining clinical outcomes in cancer patients.
2.5. Enrichment Evaluation of Genes Co-Expressed with ULK3 in a Range of Tumors
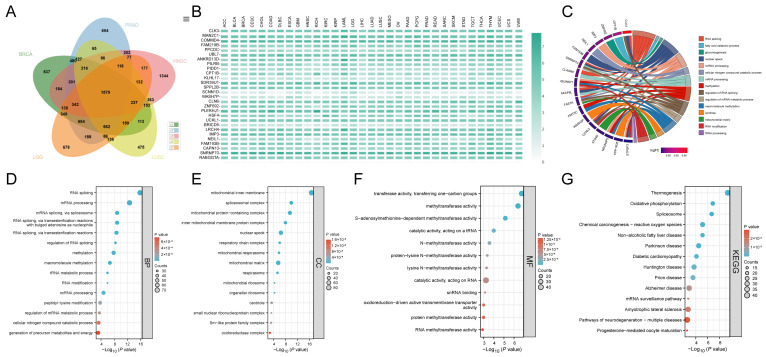
To explore the biological relevance of ULK3 and its co-expressed genes in cellular functions, we performed Gene Ontology (GO) term and Kyoto Encyclopedia of Genes and Genomes (KEGG) pathway enrichment analyses. These analyses were used to clarify the potential impact of ULK3-related genes on cancer progression. GO and KEGG enrichment analyses are essential approaches for elucidating the functional roles of genes in biological processes and cellular mechanisms. Based on the above results, BRCA, LUSC, PRAD, LGG, and HNSC showed high ULK3 mRNA expression, stemness features, high levels of RNA modification, and poor patient survival. These five cancers also represent distinct tissue origins, including breast, lung, prostate, brain, and head and neck tissues. Therefore, they allowed us to identify ULK3-associated transcriptional programs that may extend beyond tissue-specific effects. We sought to determine whether common ULK3 co-expressed genes could be identified across these cancers. We also assessed their potential contribution to critical ULK3-related functions in tumorigenesis. We first downloaded ULK3-positive co-expressed genes in these five cancers from cBioPortal. We then performed Venn diagram analysis using the SangerBox platform and identified 1579 shared genes among the five cancer types examined (Figure 6A). Next, we examined the mRNA expression profiles of these 1579 shared genes across cancer types. The heat map showed that 30 of these genes were highly expressed in multiple cancers (Figure 6B). This finding suggested that these genes may play important roles in organismal development and cancer progression. GO enrichment analysis showed that these genes were associated with several biological processes. These processes included precursor metabolite generation, energy production, RNA splicing, mRNA processing, regulation of RNA splicing, methylation, macromolecular methylation, RNA modification, non-coding RNA processing, and cellular nitrogen compound catabolism (Figure 6C,D). Cellular component analysis showed that these genes were mainly localized in mitochondria, nuclei, ribosomes, and neutrophil-related structures (Figure 6E). Molecular function enrichment analysis showed that these genes were associated with one-carbon group transferase activity, methyltransferase activity, S-adenosylmethionine-dependent methyltransferase activity, tRNA-directed catalytic activity, N-methyltransferase activity, and lysine/protein-lysine N-methyltransferase activity. Many of these functions are related to RNA regulation. These genes were also enriched in catalytic activity, rRNA binding, oxidoreductase-driven active transmembrane transporter activity, protein methyltransferase activity, and RNA methyltransferase activity (Figure 6F). KEGG pathway enrichment analysis further showed that these genes were closely associated with thermogenesis, oxidative phosphorylation, chemical carcinogenesis-reactive oxygen species, non-alcoholic fatty liver disease, diabetic cardiomyopathy, mRNA surveillance pathways, and multiple neurodegenerative disease pathways. These neurodegenerative disease pathways included Alzheimer’s disease, Parkinson’s disease, Huntington’s disease, amyotrophic lateral sclerosis, and prion disease (Figure 6G). Taken together, these results indicate that ULK3 co-expressed genes are involved in core biological processes, including energy metabolism, RNA post-transcriptional modification and processing, methylation, and catabolism. These genes may contribute to the pathogenesis of metabolic disorders, cancers, and various neurodegenerative diseases by modulating key pathways, such as oxidative phosphorylation, oxidative stress responses, and mRNA homeostasis.
2.6. The Link Between ULK3, Cancer Stem Cells, and RNA Modification
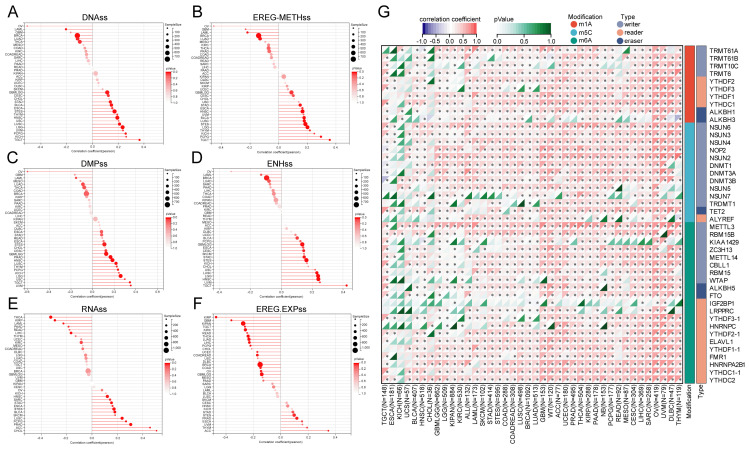
We assessed the relationship between ULK3 and tumor stemness indices across multiple cancer types. Significant associations were observed in several tumor types. Across multiple stemness indices, including DNAss, EREG-METHss, DMPss, ENHss, RNAss, and EREG-EXPss, ULK3 showed notable positive correlations with these indices in ESCA, PRAD, stomach and esophageal carcinoma (STES), THYM, and ACC. These results indicate that ULK3 may help maintain the stemness phenotype of tumor cells. ULK3 may also facilitate invasion and confer resistance to therapy. In contrast, ULK3 showed strong negative correlations with stemness indices in tumors such as LAML, BRCA, and LUAD (Figure 7A–F, Supplementary Table S7). We further found that ULK3 expression was correlated with promoter methylation status. Tumors with high ULK3 expression also showed RNA profiles resembling those of stem cells. In most tumor types, ULK3 mRNA expression was significantly and positively correlated with m1A, m5C, and m6A RNA-modifying enzymes. In contrast, ULK3 showed a negative correlation with these RNA modification regulators in TGCT (Figure 7G). These results suggest that RNA modification may be involved in ULK3-related mechanisms of tumor progression. This study indicates that ULK3 may serve as a potential marker of tumor stemness and may provide a new therapeutic target for aggressive disease phenotypes.
2.7. Association Analysis Between ULK3 and Immune Infiltration in the Tumor Microenvironment
Within the tumor microenvironment (TME), multiple cell types, including immune cells and stromal cells, coexist with extracellular components. Immune infiltration profiling provides a detailed view of the cellular composition and activation status of immune populations within the TME. It also reflects the capacity of the TME to either promote or suppress tumor growth and metastasis. Stromal Score quantifies stromal cells, such as fibroblasts and mesenchymal cells, and reflects the connective tissue compartment that provides structural support within the TME. Tumors with abundant stromal components tend to show more aggressive phenotypes, greater resistance to therapy, and poorer prognosis. Immune Score estimates the abundance of infiltrating immune cell populations in the TME, especially lymphocytes such as T cells, B cells, and natural killer (NK) cells. A higher Immune Score is generally associated with improved responsiveness to immunotherapy and better survival outcomes. ESTIMATE Score is a composite score derived from Stromal Score and Immune Score. A higher ESTIMATE Score indicates a poorer response to immunotherapy. We investigated whether ULK3 expression was associated with immune infiltration patterns and patient responses to immunotherapy. Immune-related scores were calculated using raw data obtained from SangerBox. Our findings showed a strong positive correlation between ULK3 expression and Stromal Score in UVM (R = 0.32, p = 4.6 × 10⁻³) and LAML (R = 0.27, p = 5.1 × 10⁻⁵). In contrast, ULK3 expression was significantly negatively correlated with Stromal Score in GBM (R = −0.33, p = 3.8 × 10⁻⁵), GBMLGG (R = −0.21, p = 3.7 × 10⁻⁸), LGG (R = −0.19, p = 2.5 × 10⁻⁵), UCEC (R = −0.27, p = 3.5 × 10⁻⁴), BRCA (R = −0.17, p = 2.4 × 10⁻⁸), CESC (R = −0.20, p = 7.1 × 10⁻⁴), LUAD (R = −0.25, p = 1.8 × 10⁻⁸), ESCA (R = −0.36, p = 7.3 × 10⁻⁷), STES (R = −0.32, p = 1.1 × 10⁻¹⁴), SARC (R = −0.36, p = 2.3 × 10⁻⁹), KIRP (R = −0.25, p = 1.7 × 10⁻⁵), the pan-kidney cohort KIPAN (R = −0.26, p = 1.5 × 10⁻¹⁴), PRAD (R = −0.37, p = 2.8 × 10⁻¹⁷), STAD (R = −0.24, p = 1.2 × 10⁻⁶), HNSC (R = −0.15, p = 5.1 × 10⁻⁴), KIRC (R = −0.23, p = 1.3 × 10⁻⁷), LUSC (R = −0.37, p = 1.2 × 10⁻¹⁷), SKCM-P (R = −0.39, p = 4.4 × 10⁻⁵), SKCM (R = −0.31, p = 1.3 × 10⁻¹¹), BLCA (R = −0.42, p = 5.2 × 10⁻¹⁹), SKCM-M (R = −0.28, p = 1.4 × 10⁻⁷), THCA (R = −0.17, p = 8.5 × 10⁻⁵), NB (R = −0.22, p = 5.2 × 10⁻³), OV (R = −0.13, p = 6.2 × 10⁻³), PAAD (R = −0.17, p = 0.02), PCPG (R = −0.30, p = 5.0 × 10⁻⁵), ACC (R = −0.48, p = 1.2 × 10⁻⁵), ALL-R (R = −0.24, p = 0.02), and CHOL (R = −0.56, p = 3.9 × 10⁻⁴) (Figure 8A, Supplementary Table S8). For Immune Score, ULK3 expression was positively correlated with Immune Score in UVM (R = 0.38, p = 4.7 × 10⁻⁴) and DLBC (R = 0.41, p = 4.6 × 10⁻³). In contrast, ULK3 expression was significantly negatively correlated with Immune Score in GBM (R = −0.28, p = 5.7 × 10⁻⁴), GBMLGG (R = −0.17, p = 2.1 × 10⁻⁵), LGG (R = −0.13, p = 3.5 × 10⁻³), UCEC (R = −0.22, p = 2.8 × 10⁻³), BRCA (R = −0.14, p = 2.0 × 10⁻⁶), CESC (R = −0.28, p = 8.5 × 10⁻⁷), LUAD (R = −0.13, p = 3.7 × 10⁻³), ESCA (R = −0.37, p = 3.1 × 10⁻⁷), STES (R = −0.31, p = 1.9 × 10⁻¹⁴), SARC (R = −0.28, p = 4.6 × 10⁻⁶), KIRP (R = −0.23, p = 9.2 × 10⁻⁵), KIPAN (R = −0.19, p = 2.9 × 10⁻⁸), PRAD (R = −0.13, p = 3.6 × 10⁻¹²), STAD (R = −0.23, p = 3.6 × 10⁻⁶), LUSC (R = −0.29, p = 1.1 × 10⁻¹⁰), LIHC (R = −0.15, p = 4.3 × 10⁻³), WT (R = −0.27, p = 0.02), SKCM-P (R = −0.37, p = 1.7 × 10⁻⁴), SKCM (R = −0.28, p = 2.5 × 10⁻⁹), BLCA (R = −0.42, p = 2.1 × 10⁻¹⁸), SKCM-M (R = −0.24, p = 8.1 × 10⁻⁶), THCA (R = −0.24, p = 8.3 × 10⁻⁸), MESO (R = −0.23, p = 0.04), PCPG (R = −0.26, p = 5.3 × 10⁻⁴), ACC (R = −0.45, p = 4.6 × 10⁻⁵), ALL-R (R = −0.26, p = 0.01), and CHOL (R = −0.35, p = 0.04) (Figure 8B, Supplementary Table S8). ULK3 expression showed a strong positive correlation with ESTIMATE Score in UVM (R = 0.38, p = 5.3 × 10⁻⁴) and LAML (R = 0.14, p = 0.04) (Figure 8C). In contrast, ULK3 expression was significantly negatively correlated with ESTIMATE Score in GBM (R = −0.31, p = 1.0 × 10⁻⁴), GBMLGG (R = −0.19, p = 1.0 × 10⁻⁶), LGG (R = −0.16, p = 4.4 × 10⁻⁴), UCEC (R = −0.26, p = 4.0 × 10⁻⁴), BRCA (R = −0.18, p = 7.0 × 10⁻⁹), CESC (R = −0.28, p = 1.5 × 10⁻⁶), LUAD (R = −0.20, p = 7.7 × 10⁻⁶), ESCA (R = −0.40, p = 3.6 × 10⁻⁸), STES (R = −0.34, p = 6.7 × 10⁻¹⁷), SARC (R = −0.34, p = 3.4 × 10⁻⁸), KIRP (R = −0.25, p = 1.7 × 10⁻⁵), KIPAN (R = −0.23, p = 4.3 × 10⁻¹²), PRAD (R = −0.36, p = 7.2 × 10⁻¹⁷), STAD (R = −0.26, p = 2.0 × 10⁻⁷), HNSC (R = −0.11, p = 0.01), KIRC (R = −0.13, p = 2.7 × 10⁻³), LUSC (R = −0.35, p = 3.0 × 10⁻¹⁵), LIHC (R = −0.12, p = 0.02), WT (R = −0.25, p = 0.02), SKCM-P (R = −0.41, p = 2.0 × 10⁻⁵), SKCM (R = −0.31, p = 1.5 × 10⁻¹¹), BLCA (R = −0.45, p = 2.3 × 10⁻²¹), SKCM-M (R = −0.27, p = 2.9 × 10⁻⁷), THCA (R = −0.23, p = 2.6 × 10⁻⁷), MESO (R = −0.21, p = 0.05), OV (R = −0.11, p = 0.02), PAAD (R = −0.16, p = 0.03), PCPG (R = −0.30, p = 6.7 × 10⁻⁵), ACC (R = −0.48, p = 1.1 × 10⁻⁵), ALL-R (R = −0.27, p = 6.9 × 10⁻³), and CHOL (R = −0.45, p = 5.6 × 10⁻³) (Figure 8C, Supplementary Table S8). Taken together, these results support the potential role of ULK3 as a predictor of tumor sensitivity to various treatments. To further explore the contribution of ULK3 at the immune cell level and its potential value as an immune-related marker in cancer, we used the CIBERSORT algorithm to analyze correlations between ULK3 expression and 22 immune cell subsets. The key finding was that ULK3 expression was positively correlated with M2 macrophages in eight cancer types, including BLCA, HNSC, KIRC, KIRP, LUSC, PAAD, SARC, and TGCT. By comparison, ULK3 expression was negatively associated with regulatory T cells (Tregs) in six distinct tumor types (Figure 8D). This integrative analysis supported a robust correlation between ULK3 expression and M2 macrophage infiltration. These findings provide evidence for further investigation of the role of macrophages in cancer.
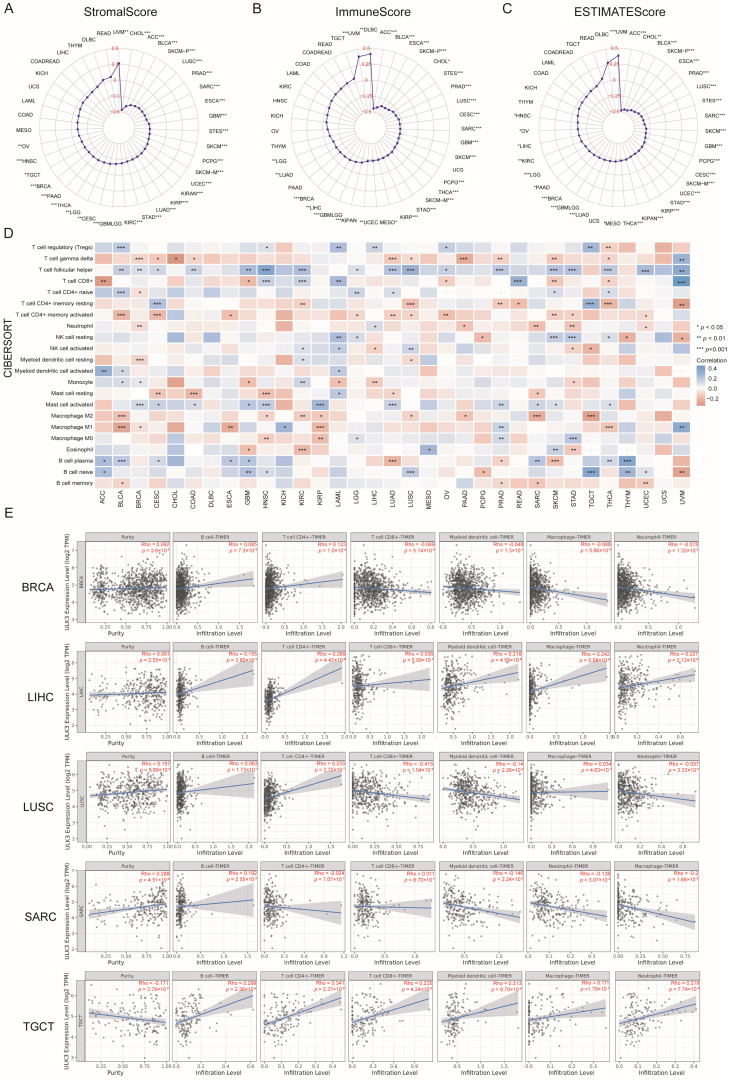
We further investigated additional components of the tumor immune microenvironment that contribute to immunosuppression. Using TIMER2.0, we analyzed the relationship between ULK3 expression and immunosuppressive cells, including B cells, CD4+ T cells, CD8+ T cells, myeloid dendritic cells (MDCs), macrophages, and neutrophils (NE). Significant associations with at least two distinct immune cell types were confirmed in BRCA, LIHC, LUSC, SARC, and TGCT. After adjusting for tumor purity as a covariate, ULK3 showed the strongest association with NE (Figure 8E).
2.8. The Function of ULK3 in Immune Modulation and Tumor Infiltration
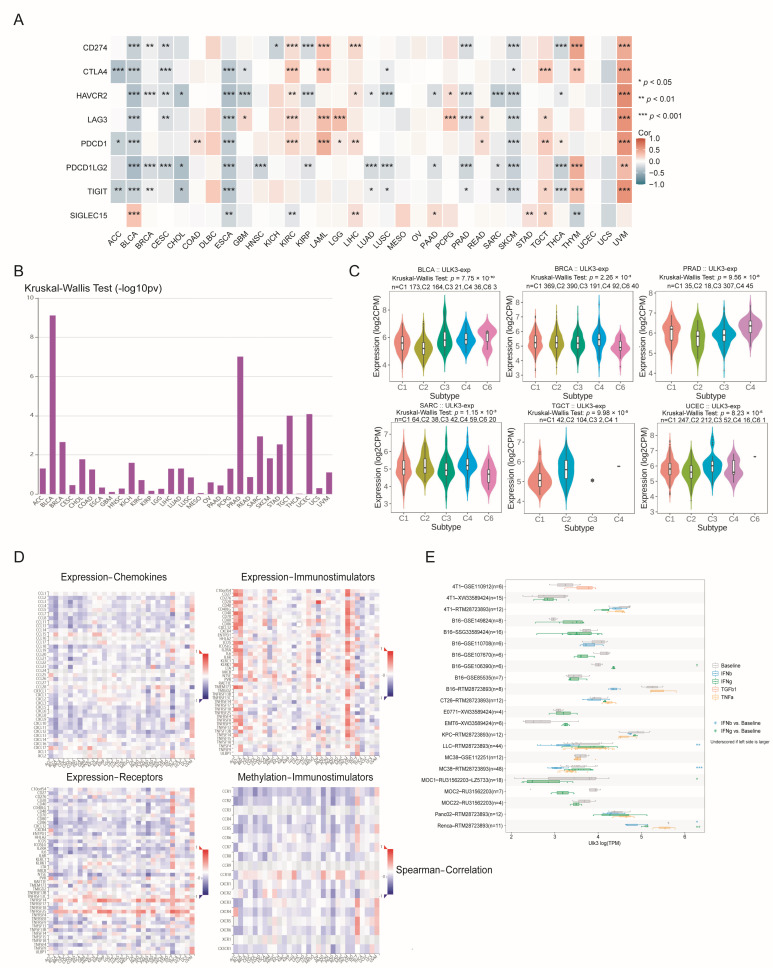
We further assessed the potential regulatory involvement of ULK3 in immune checkpoints by co-expression profiling across 33 cancer types. As shown in the heat map, ULK3 was co-expressed with most immune checkpoint genes across cancers. However, this pattern was not observed in CHOL, DLBC, KICH, MESO, OV, PAAD, READ, UCEC, and UCS (p < 0.05) (Figure 9A). Among these associations, strong positive correlations with CD274, CTLA4, and LAG3 were observed in 25 cancers, especially in BLCA. These findings highlight the potential role of ULK3 in immune checkpoint regulation. Based on data from the Tumor–Immune System Interactions and DrugBank database (TISIDB), we systematically evaluated ULK3 expression across multiple immune subtypes. Statistically significant associations were detected in nine cancer types. The most significant correlations, including those in BLCA, BRCA, PRAD, SARC, TGCT, and UCEC, are presented as bar graphs (Figure 9B) and are shown in detail in Figure 9C. According to the heat map shown in Figure 9D, ULK3 expression was inversely associated with immunostimulatory, chemokines, and their receptors in several tumor types. Finally, we used the Tumor Immune Syngeneic Mouse (TISMO) database to compare ULK3 expression levels in multiple cancer cell lines before and after cytokine exposure. The results showed that IFN-β treatment decreased ULK3 expression in three cell lines. IFN-γ treatment caused similar reductions in all three cell lines. In contrast, TNF-α treatment did not reduce ULK3 expression in these cell lines (Figure 9E). These findings indicate that ULK3 may contribute to the immunosuppressive environment in multiple cancers by interacting with immunostimulatory and regulating immune checkpoint mechanisms. This multidimensional analysis provides important insights into the complex mechanisms through which ULK3 may influence immune regulation and cancer progression.
2.9. Analysis of the Association Between ULK3 Expression and Immunotherapy Biomarkers
We further investigated whether ULK3 expression was correlated with tumor mutational burden (TMB), microsatellite instability (MSI) status, and neoantigen (NEO) abundance. These analyses were performed to clarify the potential association of ULK3 with neoantigen production and immunotherapy response. ULK3 expression showed significant positive correlations with TMB in KIPAN (R = 0.075, p = 4.98 × 10⁻²), KIRC (R = 0.111, p = 4.21 × 10⁻²), and READ (R = 0.261, p = 1.28 × 10⁻²). These findings suggest an association between increased ULK3 expression and elevated mutation counts in these tumors. In contrast, ULK3 expression showed significant negative correlations with TMB in GBM (R = −0.161, p = 4.93 × 10⁻²) and LAML (R = −0.241, p = 7.21 × 10⁻³), indicating an inverse relationship between ULK3 expression and mutation burden in these tumor types (Figure 10A, Supplementary Table S9). ULK3 expression was significantly positively correlated with MSI in GBMLGG (R = 0.149, p = 1.17 × 10⁻⁴), LGG (R = 0.209, p = 1.93 × 10⁻⁶), CESC (R = 0.123, p = 3.20 × 10⁻²), LUAD (R = 0.254, p = 6.13 × 10⁻⁹), KIRP (R = 0.120, p = 4.24 × 10⁻²), KIPAN (R = 0.186, p = 8.71 × 10⁻⁷), PRAD (R = 0.161, p = 3.34 × 10⁻⁴), UCEC (R = 0.223, p = 2.67 × 10⁻³), LUSC (R = 0.190, p = 2.19 × 10⁻⁵), THYM (R = 0.182, p = 4.86 × 10⁻²), THCA (R = 0.198, p = 9.64 × 10⁻⁶), and CHOL (R = 0.391, p = 1.83 × 10⁻²). These results suggest that patients with higher ULK3 expression may be more likely to respond to immunotherapy in these tumor types. In contrast, ULK3 expression showed a significant inverse correlation with MSI in DLBC (R = −0.442, p = 1.87 × 10⁻³). This finding suggests that lower ULK3 expression may be associated with a reduced likelihood of immunotherapy benefit in this cancer type (Figure 10B, Supplementary Table S9). For NEO, ULK3 expression showed significant positive correlations in COADREAD (R = 0.125, p = 2.94 × 10⁻²) and UCEC (R = 0.196, p = 1.63 × 10⁻²) (Figure 10C, Supplementary Table S9). These findings indicate that immunotherapy may yield better outcomes in patients with elevated ULK3 expression in these cancers.
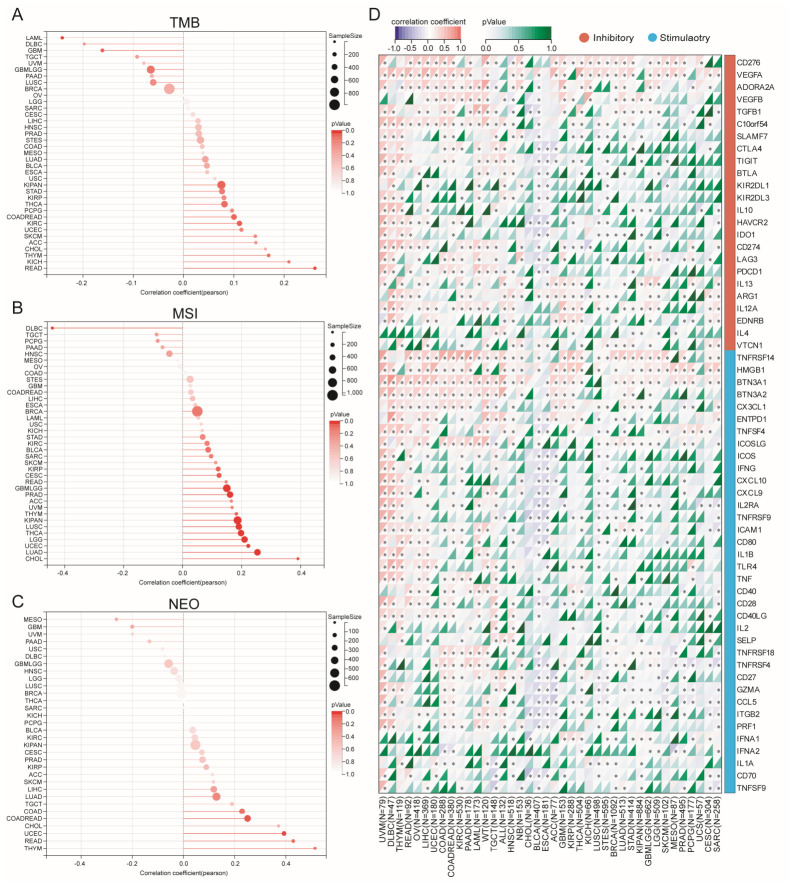
We next investigated the association between ULK3 and immune checkpoint proteins, given their roles as targets of checkpoint blockade therapy. ULK3 showed marked positive associations with most immune checkpoint blockade-related proteins in UVM, DLBC, OV, THYM, and READ. These results suggest that ULK3 may be involved in modulating tumor immune evasion. Therefore, patients with high ULK3 expression may be more likely to benefit from checkpoint inhibitor therapy in these cancers. In contrast, ULK3 showed marked inverse associations with most immune checkpoint proteins in BLCA, ESCA, and CHOL (Figure 10D), suggesting that ULK3 may be associated with more active antitumor immunity in these tumor types.
2.10. Subcellular Localization of ULK3 and Its Cancer-Promoting Function in Prostate Cancer Cells
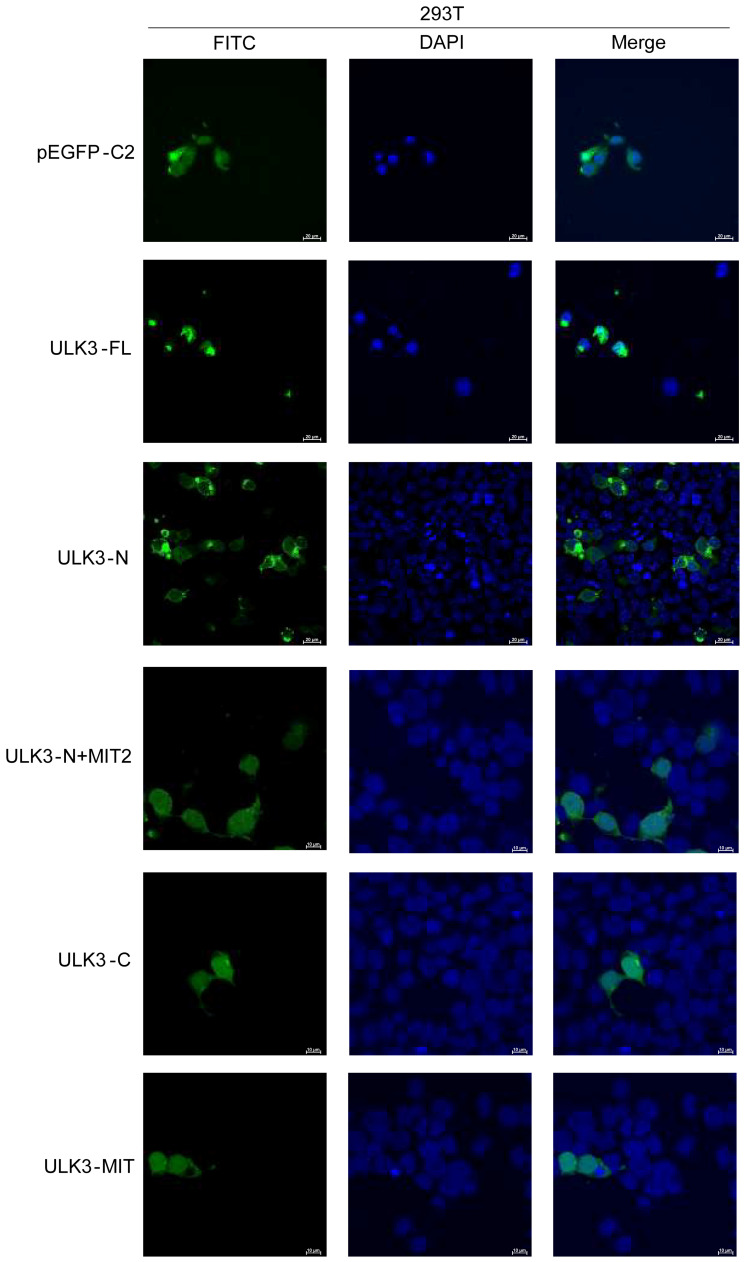
The pEGFP-C2 empty vector, ULK3-FL plasmid, and truncated ULK3 plasmids were transfected into 293T cells. DAPI staining was performed to visualize the nuclei, and green fluorescence was observed to determine the expression and subcellular localization of exogenous ULK3 protein and its domains in eukaryotic cells. The results showed that fluorescence from the pEGFP-C2 empty vector was mainly distributed in the cytoplasm, with partial localization in the nucleus. Full-length ULK3, ULK3-N + MIT2, ULK3-MIT, and ULK3-C were detected in both the nucleus and cytoplasm. ULK3-N was mainly localized in the cytoplasm and was partially detected in the nucleus. These results suggest that different domains of ULK3 may have distinct cellular roles (Figure 11).
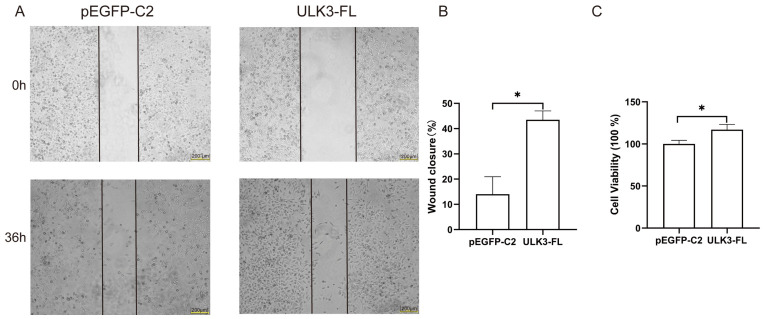
PC-3 cells were transfected with the pEGFP-C2 empty vector or the full-length ULK3-FL plasmid. The effect of ULK3 overexpression on PC-3 cell migration was evaluated by recording wound closure at 0 h and 36 h after scratching. The results showed that the wound-healing capacity of PC-3 cells overexpressing ULK3 was significantly greater than that of control cells (p < 0.05). These findings indicate that ULK3 overexpression promoted the migration of PC-3 cells (Figure 12A,B). PC-3 cells were also transfected with the pEGFP-C2 empty vector or the full-length ULK3-FL plasmid, and cell viability was measured after 48 h. The MTT assay showed that the viability of PC-3 cells overexpressing ULK3 was significantly higher than that of the control group (p < 0.05). These results indicate that ULK3 overexpression promoted the proliferation of PC-3 cells (Figure 12C).
2.11. Discovery of Drugs That Activate ULK3
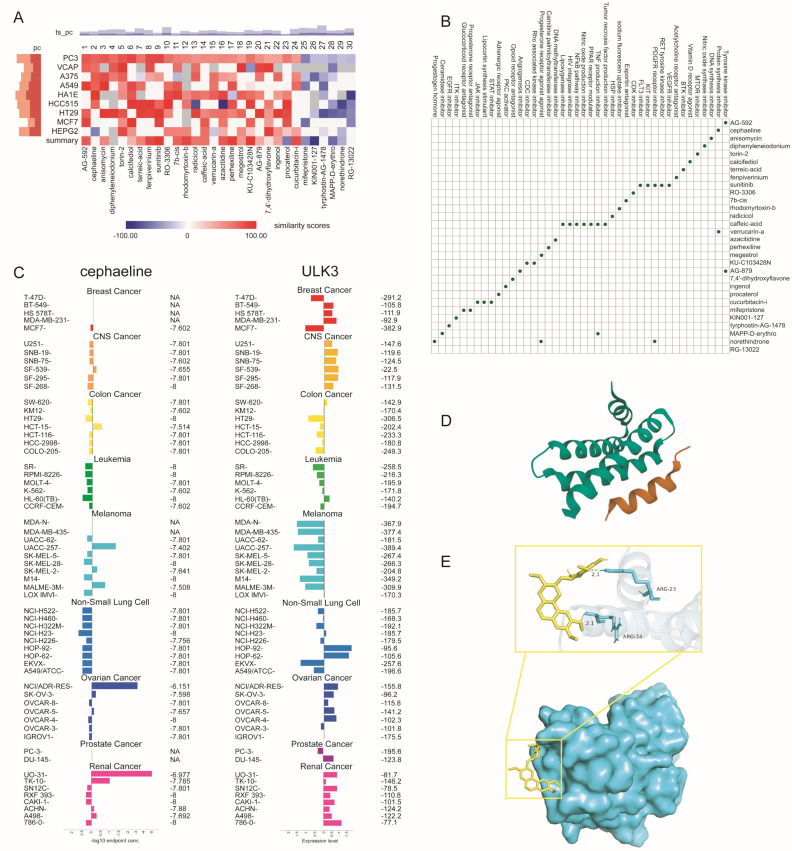
It is important to identify drugs capable of activating ULK3. Using the Connectivity Map (CMap) tool to screen candidate compounds, we identified 30 potential ULK3-stimulatory compounds based on consistent transcriptomic changes across nine cell lines (Figure 13A). These compounds suggested a close association between ULK3 and distinct molecular mechanisms in tumor cells (Figure 13B). In addition, we used the COMPARE method to evaluate GI50 values for these compounds across diverse cancer cell lines. NM-PPI was excluded because of the limited availability of testing data. Cephaeline has not been reported in prostate cancer cells, supporting its novelty as a candidate compound for prostate cancer treatment (Figure 13C). To evaluate the binding potential between ULK3 protein and Cephaeline, molecular docking studies were performed. The results showed that Cephaeline could successfully dock with ULK3 (Figure 13D,E). These findings indicate that Cephaeline may be a promising candidate compound for ULK3 activation.
3. Discussion
Cancer initiation and progression are largely driven by dysregulated molecular programs, including abnormal gene expression. These abnormalities may manifest as altered transcriptional levels, dysregulated post-translational modifications, or epigenetic changes. Such alterations not only promote malignant transformation but also affect patient prognosis by regulating the tumor microenvironment (TME), immune escape, and metabolic reprogramming [ref. 11]. In this study, we integrated TCGA, GTEx, and other public databases to analyze the expression profile, genomic variation, clinical prognostic relevance, immune microenvironment, and potential biological functions of ULK3 across 33 cancer types. Our results showed that ULK3 was dysregulated in most cancer types. Its aberrant expression was significantly associated with various clinicopathological features and poor prognosis. Bioinformatics analyses suggested potential correlations with RNA modification, energy metabolism, and TME remodeling. However, these mechanistic links still require experimental validation. These findings suggest that ULK3 may serve as a broadly relevant tumor biomarker and a potential therapeutic target.
Consistent upregulation of ULK3 mRNA and protein was detected in 13 malignancies, including BLCA, BRCA, COAD, LIHC, LUAD, and LUSC. In contrast, ULK3 expression was decreased only in CHOL and HNSC. This broad dysregulation pattern suggests that ULK3 may show either tumor-promoting or tumor-suppressive correlation patterns in different cancer types. This finding indicates context-dependent functional heterogeneity. Notably, the prognostic significance of ULK3 varied across cancer types. High ULK3 expression was associated with poor survival outcomes in ACC, KIRC, SKCM, and other cancers. Conversely, low ULK3 expression was associated with worse overall survival in 13 cancer types, including BLCA, HNSC, and STAD. These findings indicate that ULK3 may exert differential effects across cancer types. Furthermore, based on survival data from the TCGA database, high ULK3 expression was consistently associated with poor prognosis in ACC, KIRC, SKCM, LAML, and UVM. Low ULK3 expression was also correlated with worse overall survival in BLCA, HNSC, KIRP, STAD, and other cancers. This seemingly paradoxical phenomenon may reflect the functional heterogeneity of ULK3 across different tumor backgrounds. It may also be related to differences in tumor stage, molecular subtype, and microenvironment composition [ref. 8]. For instance, in HNSC, loss of ULK3 may indirectly promote tumor adaptive survival by derepressing certain autophagic processes [ref. 12]. Therefore, the prognostic value of ULK3 should be interpreted in a cancer type-specific context. Its bidirectional characteristics do not diminish its potential value as a biomarker. Instead, they highlight the need for cancer type-specific and individualized analyses in clinical applications [ref. 13].
Our analysis revealed a major genomic basis for ULK3 upregulation. Copy number amplification was the most prevalent form of genetic alteration. As one of the most common genetic alterations in cancer genomes, copy number amplification can increase the copy number of specific genes. This process significantly affects cell growth regulation, repair mechanisms, and therapeutic responses [ref. 14]. Many studies have shown that copy number amplification is not a random event. It is closely associated with specific clinicopathological characteristics, treatment resistance, and patient prognosis [ref. 15]. A strong positive association between copy number gain and mRNA expression was observed in 18 cancers. This finding suggests that the gene dosage effect may be a major mechanism underlying ULK3 upregulation [ref. 16]. In addition, missense mutations were the main mutation type. Among them, the A206V site located in the protein kinase (Pkinase) domain deserves special attention. ULK3 is a serine/threonine protein kinase. Its N-terminal Pkinase domain is the catalytic core responsible for ATP binding and substrate phosphorylation. ULK3 also plays important roles in autophagy, cell division, and Sonic Hedgehog (Shh) signal transduction [ref. 17,ref. 18]. This domain has a typical serine/threonine kinase fold. It contains the activation loop and key catalytic residues, such as Lys-43 [ref. 19]. However, these interpretations remain speculative. Direct functional evidence, such as kinase activity assays or phosphoproteomic profiling, is still lacking to confirm the biological impact of this mutation. The functional significance of the recurrent A206V missense mutation identified in our pan-cancer analysis also remains unclear. Although this mutation is located within the kinase domain and is predicted to affect kinase activity based on structural modeling, no experimental validation has yet been performed. It remains unknown whether A206V affects ULK3 enzymatic activity, substrate phosphorylation, or downstream signaling. Future studies using site-directed mutagenesis combined with kinase activity assays and functional readouts are warranted to clarify the biological consequences of this mutation [ref. 20]. Co-occurrence gene analysis suggested that SCAMP2, CSK, and other genes may be synergistically dysregulated with ULK3 and participate in oncogenic pathways. This synergistic dysregulation may affect transcriptional activity, post-translational modification, or the interaction between ULK3 and its substrates through shared genetic regulatory elements, epigenetic modifications, and overlapping signaling pathways [ref. 21]. These findings provide molecular evidence for understanding the mechanism of ULK3 activation in cancer. They also lay a foundation for developing intervention strategies targeting ULK3 or its interaction network.
An in-depth analysis of genes co-expressed with ULK3 in five representative cancers showed that these genes were highly enriched in RNA splicing and processing, methylation modification, mitochondrial energy metabolism, and oxidative phosphorylation pathways. This functional spectrum has important pathophysiological implications. First, abnormal RNA metabolism, especially dysregulated RNA splicing, has been recognized as an essential hallmark of tumorigenesis. ULK3 co-expressed genes were enriched in the RNA splicing pathway. This finding suggests a potential association between ULK3 and RNA splicing regulation, although functional experiments are still needed for validation. Notably, recent studies have characterized two major alternatively spliced isoforms of ULK3. The full-length transcript ENST00000440863.7 (ULK3-201) encodes a 472-amino-acid protein. The truncated transcript ENST00000569437.5 (ULK3-220) lacks two amino acids, valine and lysine (VK), at the C-terminus of the microtubule-interacting and transport (MIT) domain. This splicing switch is driven by the rs12898397 (T > C) genetic variant in exon 14. This variant weakens the canonical splice donor site and enhances a cryptic splice donor site, resulting in the skipping of six nucleotides [ref. 22]. AlphaFold 3.0 predictions indicate that loss of the VK dipeptide causes substantial structural divergence in the C-terminal region (RMSD = 5.81 Å). The MIT domain is critical for ULK3-mediated regulation of autophagy and Sonic Hedgehog signaling [ref. 16]. Therefore, splicing-induced structural alterations may affect the interaction of ULK3 with downstream effectors, such as SUFU and GLI proteins. These changes may further modulate its tumor-related functions. However, the functional consequences of these splicing events in cancer pathogenesis require further experimental investigation.
Numerous studies have shown that dysregulated RNA splicing can promote tumor cell growth, inhibit apoptosis, and enhance migration and metastasis. It can also affect immune surveillance by generating new antigens. Thus, RNA splicing disorder may drive the onset and progression of malignancies through multiple dimensions [ref. 23]. Second, ULK3 expression was positively correlated with m1A, m5C, and m6A RNA-modifying enzymes. This finding suggests that ULK3 may be involved in epitranscriptomic regulation. Moreover, the enrichment of oxidative phosphorylation and thermogenesis pathways, together with the correlation between ULK3 and stemness indices, suggests that ULK3 may influence mitochondrial metabolic reprogramming and help maintain stemness characteristics [ref. 24].
Analysis of the tumor microenvironment showed that ULK3 levels were significantly negatively correlated with Stromal Score, Immune Score, and ESTIMATE Score in a subset of cancers, including GBM, BRCA, LUAD, PRAD, LUSC, and BLCA. These findings suggest an immunologically “cold” phenotype in these cancer types. However, opposite correlations were observed in other tumor types, such as UVM and LAML. This result indicates that the immune associations of ULK3 are largely cancer type-dependent. Such a microenvironment is often associated with immunotherapy resistance and poor prognosis [ref. 13]. ULK3 was positively associated with the infiltration of M2-type tumor-associated macrophages in eight cancers. It was also negatively correlated with regulatory T cells in six cancers. M2 macrophages are important immunosuppressive cells that promote angiogenesis, tissue remodeling, and immune escape [ref. 25,ref. 26]. ULK3 may induce M2 polarization through the chemokine network, as reflected by its negative correlations with multiple chemokine receptors. This process may contribute to the establishment of an immunosuppressive barrier. However, functional experiments are still needed to validate its mechanistic role. In addition, ULK3 was co-expressed with immune checkpoint molecules, such as CD274 (PD-L1) and CTLA4, in 25 cancers. IFN-γ treatment also downregulated ULK3 expression. These findings suggest that ULK3 may be involved in adaptive immune resistance. They further indicate that ULK3 may serve as a potential target for combination immunotherapy. However, co-targeting ULK3 requires further preclinical investigation.
Tumor mutational burden (TMB) and microsatellite instability (MSI) are key biomarkers for predicting the efficacy of immune checkpoint inhibitors [ref. 27]. Our study found that ULK3 was positively correlated with TMB in KIRC and READ. ULK3 was also positively correlated with MSI in LGG, LUAD, and UCEC. These correlations provide a theoretical rationale for considering ULK3 as a candidate biomarker in immunotherapy. However, direct clinical evidence is currently lacking. It should be noted that the associations between ULK3 expression and TMB/MSI are correlative. These associations do not directly demonstrate that ULK3 can predict immunotherapy efficacy. Although TMB and MSI are established biomarkers for response to immune checkpoint inhibitors, the role of ULK3 in immunotherapy efficacy requires validation in patient cohorts receiving immunotherapy [ref. 27]. However, the association was cancer-specific, as shown by the negative association with MSI in DLBC. This finding again emphasizes the need for individualized analysis. Combined with the positive correlation between ULK3 and multiple immune checkpoint blockade-related proteins, especially in UVM and DLBC, we hypothesize that high ULK3 expression may not only contribute to an immunosuppressive microenvironment but also coexist with a high mutation burden. This pattern may form a paradoxical state of “immune exhaustion with potential responsiveness.” Therefore, ULK3 may serve as a candidate biomarker with potential dual clinical implications. Its high expression is correlated with poor clinical outcomes and may also be associated with immunotherapy sensitivity. However, these hypotheses require validation in prospective clinical cohorts.
The analyses described above are entirely computational and represent the bioinformatics component of this study. To further explore the functional relevance of ULK3 in tumors under experimental conditions, we first performed subcellular localization assays. Cellular localization experiments showed that full-length ULK3 and its different domains were distributed in both the nucleus and cytoplasm. However, the N-terminus was mainly retained in the cytoplasm. This distribution pattern suggests that ULK3 may participate in diverse cellular processes. However, the specific functions of individual domains require further investigation. In prostate cancer PC-3 cells, ULK3 overexpression significantly promoted cell migration and proliferation. These results directly supported its cancer-promoting function in this cellular model. Finally, CMap screening and molecular docking predicted Cephaeline as a potential ULK3-binding compound. This finding suggests possible ULK3-activating activity. Although this prediction is promising, it is based solely on computational simulations and requires pharmacological validation at both cellular and animal levels.
This study has several limitations. First, the public datasets used in this study were derived from multiple independent cohorts, which differed in sample size and algorithmic approach. To mitigate this limitation, we used multiple databases, including TCGA, GTEx, and CPTAC, for cross-validation according to different analytical purposes. Second, the correlation analyses involving immune infiltration, stemness indices, and therapeutic markers reflect only statistical associations. Therefore, all bioinformatics findings should be considered hypothesis-generating rather than conclusive. Third, Cephaeline was preliminarily identified as a potential ULK3-targeting compound through bioinformatics prediction and molecular docking. However, this finding is based solely on computational approaches. The regulatory effects of Cephaeline on ULK3 activity and the underlying mechanisms require further in vitro and in vivo validation. Fourth, the cellular functional experiments were confined to a single cell line, PC-3. This model may not fully reflect tumor heterogeneity or the tissue-specific roles of ULK3. Future studies should include multiple cell lines, animal models, and prospective clinical cohorts to further evaluate the clinical value of ULK3. Fifth, the immune-related correlations of ULK3 were not consistent across cancer types. The observed correlations varied depending on the tumor context. For instance, a recent study reported that ULK3 was significantly negatively correlated with macrophage infiltration in esophageal cancer [ref. 12]. In contrast, our analysis in prostate cancer revealed a positive correlation between ULK3 and M2 macrophage infiltration. Therefore, our findings do not support a universal immunosuppressive role of ULK3. Future studies should investigate the mechanistic basis of this cancer type-specific heterogeneity. Sixth, our findings regarding the potential role of ULK3 as a predictor of immunotherapy response are based solely on correlations with TMB, MSI, and immune checkpoint gene expression. These analyses did not include patient cohorts treated with immune checkpoint inhibitors. Therefore, the clinical value of ULK3 as a predictive biomarker remains speculative. Prospective studies are required to validate its mechanism of action [ref. 12]. Seventh, although our genomic alteration analyses identified recurrent mutations and copy number variations of ULK3, the functional relevance of these alterations has not been experimentally validated. This limitation is particularly relevant to the A206V missense mutation. The predicted structural effects are based on computational modeling and require direct biochemical and cellular assays to confirm their biological significance.
In summary, our multidimensional pan-cancer analysis revealed that ULK3 is overexpressed in most cancers and is driven in part by copy number amplification. ULK3 expression is closely associated with poor prognosis, enhanced tumor stemness, immunosuppressive microenvironment formation, and abnormal RNA metabolism. ULK3 may serve not only as a potential pan-cancer diagnostic and prognostic marker but also as a potential auxiliary indicator for predicting immunotherapy response. In prostate cancer, ULK3 also showed potential value as a therapeutic target. Future intervention strategies targeting ULK3, whether through small-molecule inhibitors or activators, should be analyzed according to the specific cancer context.
4. Materials and Methods
4.1. Analysis of ULK3 Gene and Protein Expression
mRNA expression data were retrieved from TCGA. All analyses were performed using R software (version 4.2.1). Differential expression was evaluated using the edgeR package based on raw RNA-seq counts. The data were transformed as log2(TPM + 1). Differential expression analysis was performed by comparing tumor tissues with matched adjacent normal tissues. Student’s t-test was used, and statistical significance was defined as p < 0.05. Box plots were generated in R using the ggplot2 package. ULK3 mRNA expression differences between tumor samples and paired adjacent non-tumor tissues were also evaluated using the Gene_DE module of TIMER2.0 (Tumor Immune Estimation Resource 2.0) [ref. 28,ref. 29]. ULK3 protein expression levels in tumor tissues and normal tissues were evaluated using the UALCAN website [ref. 30]. Immunohistochemical images of eight tumor types and their corresponding normal tissues were obtained from The Human Protein Atlas (HPA) public database [ref. 31]. These images were used to assess differences in ULK3 protein expression. The images are presented as representative staining patterns. No quantitative statistical test was applied because raw intensity data were not available from the HPA platform.
4.2. Survival and Prognosis Analysis of ULK3
Using the Kaplan–Meier plotter database, we assessed the association between ULK3 expression and patient survival across various cancer types. This study examined the relationship between ULK3 expression levels and three key clinical endpoints: overall survival (OS), disease-specific survival (DSS), and progression-free interval (PFI). For each cancer type, patients were divided into ULK3 high-expression and low-expression groups according to the median ULK3 mRNA expression level. Kaplan–Meier survival curves were used to evaluate the association between ULK3 expression and survival outcomes across different cancer types. A two-sided log-rank test was used for group comparisons. Univariate Cox proportional hazards regression was used to calculate hazard ratios (HRs) and 95% confidence intervals (CIs). To determine whether ULK3 expression served as an independent prognostic factor, multivariate Cox regression analyses were also performed. ULK3 expression and available clinicopathological covariates, including age, tumor stage, pathological grade, and sex, were incorporated into the models for each cancer type in the TCGA database. Statistical significance was defined as a two-sided p-value < 0.05.
4.3. Analysis of Genetic Alterations in ULK3
The cBioPortal online database was used to explore the genetic alteration characteristics of ULK3 [ref. 32]. The “Pan-Cancer Studies” section was selected for query. The “Cancer Types Summary” module was used to obtain the overall alteration frequency of ULK3 across cancer types. The “Mutations” module was used to obtain mutation types, mutation sites, and mutation counts. The “OncoPrint”, “Cancer Types Summary”, and “Mutations” modules were used to explore gene alterations and mutation locations [ref. 33]. The Gene_Mutation module of TIMER2.0 and SangerBox were used to determine the mutation types and mutation frequencies of ULK3 across various tumors. The mRNA expression of ULK3 and the corresponding copy number changes were analyzed using the SangerBox portal. The correlation between ULK3 expression and somatic mutations was obtained from CAMOIP by selecting the “mutation landscape” section.
4.4. Clinical Relevance of ULK3 Alternative Splicing
To evaluate the clinical significance of alternative splicing (AS) events involving ULK3, we interrogated the ClinicalAS OncoSplicing module [ref. 34], which integrates data from the SplAdder and SpliceSeq projects. We employed PanPlot to visualize the percent-spliced-in (PSI) values of ULK3 across tumor samples from The Cancer Genome Atlas (TCGA) and matched normal tissues from the Genotype-Tissue Expression (GTEx) project. PanDiff plots were used to compare PSI values between tumor tissues and their paired adjacent normal tissues—or GTEx-derived normal controls—for AS events recurrently detected in more than three distinct cancer types. Finally, Kaplan–Meier survival analysis was performed to assess the prognostic value of these pan-cancer ULK3 splicing events.
4.5. Enrichment Analysis of ULK3 Co-Expressed Genes
Genes co-expressed with ULK3 and their corresponding Pearson correlation coefficients were obtained from cBioPortal by selecting the “Co-expression” option. Genes with a Pearson correlation coefficient greater than 0.3 and a positive correlation with ULK3 were selected for Gene Ontology (GO) term and Kyoto Encyclopedia of Genes and Genomes (KEGG) pathway enrichment analyses. These analyses were performed using the Database for Annotation, Visualization, and Integrated Discovery (DAVID). To further refine gene selection for heat map visualization, ULK3-positive co-expressed genes were ranked according to their Pearson correlation coefficients. The top 30 genes with the strongest positive correlations with ULK3 across the five cancer types were selected. Each selected gene was required to show consistent positive correlation patterns in at least four of the five cancers to ensure cross-cancer reproducibility. The GO and KEGG gene clustering results were obtained from the corresponding websites. Venn diagrams, GO chord diagrams, and GO/KEGG pathway plots were generated using SRplot (Science and Research Online Plot), a user-friendly online platform that integrates more than 100 commonly used data visualization and plotting functions. The Gene Expression Profiling Interactive Analysis 2 (GEPIA2) database was used to visualize the heat map of ULK3-positive co-expressed genes by selecting the “Multiple Gene Comparison” section.
4.6. Correlation Analysis of ULK3 Stemness Indices
This study assessed the relationships between ULK3 expression and multiple stemness-related indices, including DNAss, EREG-METHss, DMPss, ENHss, RNAss, and EREG-EXPss. Pearson correlation coefficients (Pearson R) between ULK3 and each stemness-related index were obtained from the SangerBox online platform. MicroBioinfo was used to generate lollipop plots for visualization. In addition, SangerBox was used to perform Pearson correlation analysis between ULK3 expression and various RNA modification regulators. A corresponding heat map was generated to visualize these correlations.
4.7. Correlation Analysis of Immune Scores and Immune Cell Infiltration
The correlations between ULK3 expression and Stromal Score, Immune Score, and ESTIMATE Score were assessed using the SangerBox online platform. The CIBERSORT algorithm was used to examine the associations between ULK3 expression and different immune cell types, including B cells, CD4+ T cells, CD8+ T cells, myeloid dendritic cells (MDCs), macrophages, and neutrophils (NE). TIMER2.0 was used to generate scatter plots showing the correlations between ULK3 expression and immune cell infiltration. These analyses included both tumor purity and purity-adjusted correlations of ULK3 with B cells, CD4+ T cells, CD8+ T cells, MDCs, macrophages, and NE in five cancer types, including BRCA, LIHC, LUSC, SARC, and TGCT.
4.8. Investigation of the Immune Effects of ULK3 in the Pan-Cancer Microenvironment
We integrated publicly available datasets from the previous literature to explore the relationship between ULK3 expression and immune checkpoint molecule expression [ref. 35]. Spearman correlation coefficients were calculated between ULK3 and immune checkpoint genes, including CD274, CTLA4, LAG3, PDCD1, TIGIT, HAVCR2, and other related genes. Statistical significance was defined as p < 0.05. In the immune subtype module of the tumor immune microenvironment database, we analyzed the relationship between ULK3 expression and immune subtypes. We also evaluated the relative expression levels of ULK3 among these immune subtypes. Heat maps were generated to examine the correlations between ULK3 expression and diverse immunomodulatory molecules, including chemokines, their corresponding receptors, and immunostimulatory factors within predefined immunomodulator and chemokine gene sets. To assess the effect of cytokine treatment on ULK3 expression, we used the Tumor Immune Syngeneic Mouse (TISMO) online tool [ref. 35]. This tool was used to compare ULK3 gene expression levels in cell lines before and after cytokine treatment.
4.9. Correlation Analysis of ULK3 with Immunotherapy Biomarkers and Treatment Response
The SangerBox online platform was used to calculate Pearson correlation coefficients between ULK3 expression and tumor mutational burden (TMB), microsatellite instability (MSI), and predicted neoantigen (NEO) load. Radar plots were generated using Microsoft Excel. In addition, the correlations between ULK3 expression and immunomodulatory genes, including immunoinhibitory and immunostimulatory genes, were evaluated across different tumors in the TCGA cohort using the SangerBox online platform. Furthermore, the relationships between ULK3 expression and chemokines or major histocompatibility complex (MHC) molecules were assessed using Tumor–Immune System Interactions and DrugBank (TISIDB). TISIDB is a platform that integrates multiple tumor immunology data resources. The “chemokines” and “immunomodulators” sections were selected for analysis. ULK3 expression levels in patients who responded to immunotherapy and in those who did not respond were also obtained from TISIDB by selecting the “immunotherapy” category.
4.10. Cell Culture
Human embryonic kidney HEK 293T cells, human prostate cancer PC-3 cells, DMEM medium, Ham’s F-12 medium, gentamicin, and 0.25% trypsin were obtained from Servicebio Biotechnology Co., Ltd. (Wuhan, China). Fetal bovine serum was obtained from Roya Biotechnology Co., Ltd. (Lanzhou, China).
4.11. Plasmid Construction
The ULK3 coding sequence (CDS) was retrieved from NCBI. According to the restriction sites of the pEGFP-C2 empty vector sequence and the characteristics of the ULK3 CDS, XhoI and BamHI were selected as the upstream and downstream restriction sites, respectively. The primer sequences used for amplifying the full-length ULK3 and its various truncated forms are shown in Table 1.
Table 1: Primer sequences.
| Primer Name | Primer Sequence |
|---|---|
| ULK3-FL-F | AAGTCCGGCCGGACTCAGATCTCGAGTATGGCGGGGCCC |
| ULK3-FL-R | TTATCTAGATCCGGTGGATCCTCACTGAAGGGTGC |
| ULK3-N-R | TTATCTAGATCCGGTGGATCCTCAGATGAGGTAGATATTG |
| ULK3-N + MIT2-R | TTATCTAGATCCGGTGGATCCTCAATGAAGACACGCGCCACCT |
| ULK3-MIT-F | AAGTCCGGCCGGACTCAGATCTCGAGACAGCAATTAGCTAG |
| ULK3-C-F | AAGTCCGGCCGGACTCAGATCTCGAGATGGAGTTTTGCGC |
The PCR reaction system was prepared according to the instructions for DNA polymerase 2 × Flash PCR Master Mix (Dye) (Cowin Biotech Co., Ltd., Jiangsu, China). PCR amplification was performed using a PCR instrument (Bio-Rad Laboratories, California, USA). The PCR program was set as follows: denaturation at 98 °C for 10 s, annealing at 61 °C for 5 s, and extension at 72 °C for 50 s. The samples were then maintained at 4 °C. The amplified products were separated by electrophoresis on a 1% agarose gel. Bands of the expected size were excised and purified to obtain the target DNA fragments.
For restriction enzyme digestion, the pEGFP-C2 (Laboratory storage) empty vector was digested with XhoI (TransGen Biotech, Beijing, China) and BamHI (TransGen Biotech, Beijing, China) at 37 °C for 30 min. The linearized vector was separated by electrophoresis on a 1% agarose gel and recovered after gel excision.
For ligation, the purified DNA fragments and the linearized vector were ligated using homologous recombinase. The ligation system was prepared according to the manufacturer’s instructions for homologous recombinase. The reaction was performed at 37 °C for 30 min and then immediately placed on ice.
For transformation and identification, competent cells (TransGen Biotech, Beijing, China) were thawed on ice. The homologous recombination product was gently added to the competent cells. The tube wall was tapped gently to mix the contents, and the reaction was kept on ice for 30 min. Heat shock was performed at 42 °C for 45 s, followed by immediate cooling on ice for 3 min. Then, 900 μL of liquid LB medium was added, and the cells were shaken at 37 °C for 1 h. After centrifugation at 5000× g for 5 min, the supernatant was removed. The bacterial pellet was resuspended in fresh LB medium and evenly plated onto kanamycin-resistant solid LB agar plates. The bacterial culture was incubated at 37 °C for 12–16 h. Monoclonal colonies were selected and cultured with shaking. Plasmids were extracted and identified by double-enzyme digestion.
4.12. Cell Slide Staining and Laser Confocal Imaging
The pEGFP-C2 empty vector, ULK3-FL plasmid, and each truncated ULK3 plasmid were transfected into 293T cells using Lipofectamine 3000 (Invitrogen, Carlsbad, CA, USA). Because the plasmids carried the EGFP fluorescent tag, fluorescence was observed 24 h after transfection to determine transfection efficiency. Subsequently, the cells were permeabilized with 0.1% Triton X-100 (LABGIC, Hefei, China) for 15 min at room temperature. The nuclei were stained with 100 ng/mL DAPI (Fude Biotechnology Co., Ltd., Hangzhou, China) for 15 min. The cells were then washed three times with PBS (Servicebio Biotechnology Co., Ltd., Wuhan, China). The slides were mounted without an antifade reagent. After air drying, the slides were imaged using laser confocal microscopy (Nikon Corporation, Tokyo, Japan).
4.13. Scratch Test
PC-3 cells in the logarithmic growth phase were cultured in 35-mm cell culture dishes. When the cells reached approximately 70% confluence, they were transfected with the pEGFP-C2 empty vector or the ULK3-FL plasmid. At 24 h after transfection, fluorescence was observed to verify transfection efficiency. Scratch wounds were then created in the cell monolayer using a 200 μL pipette tip. Cells were photographed under a microscope at 0 h and 36 h after scratching. ImageJ (version 1.5.1) was used to measure the migration distance. The wound closure rate was calculated for both the empty vector control group and the ULK3-FL experimental group.
4.14. MTT Assay
PC-3 cells in the logarithmic growth phase were seeded into 96-well plates at a density of 5000 cells per well. The cells were then transfected with either the pEGFP-C2 empty vector or the plasmid expressing full-length ULK3. Fluorescence was observed 24 h after transfection to confirm successful transfection. At 48 h after transfection, MTT reagent (LABGIC, Hefei, China) was added. After incubation at 37 °C for 4 h, DMSO (Sigma-Aldrich, Darmstadt, Germany) was added, and the plate was incubated for 30 min. Absorbance at 490 nm was measured using a microplate reader (BioTek, Vermont, USA).
4.15. Screening of ULK3-Activating Drugs
The “Query” tool in CMap was used to identify potential compounds that stimulate ULK3. The analysis was based on the top 100 most significantly altered genes, including both upregulated and downregulated genes, stratified according to the median expression level of ULK3. After data collection, a heat map was generated for the top 30 compounds. Scatter plots were created using Microsoft Excel to evaluate the potential biological mechanisms of compound activity. Subsequently, ULK3 expression levels and GI50 values, which represent the concentration required to inhibit cell proliferation by 50%, were retrieved from the CellMiner database. Data processing was performed using R with the readxl, impute, and lima packages. Plots were generated using the MicroBioinfo online platform. The three-dimensional structures of ULK3 and the corresponding compounds were obtained from the PDB and PubChem databases, respectively. Docking studies were conducted using AutoDock version 4.2.6. The results were visualized using PyMOL version 3.1.0.
4.16. Statistical Analysis
Statistical analyses were performed using R software version 4.2.1. The unpaired Wilcoxon rank-sum test or Welch’s t-test was used for comparisons between two groups. The Kruskal–Wallis test was used for comparisons among multiple groups. Pearson or Spearman correlation analysis was performed using the corr. test function, with the method set as “pearson” or “spearman”, respectively. Survival analysis was performed using the Kaplan–Meier method and the log-rank test. The R packages survival version 3.3.1 and survminer version 0.4.9 were used for survival analysis. Analyses involving multiple comparisons, including differential expression and correlation analyses, and survival analyses for each cancer endpoint, including OS, DSS, and PFI, were adjusted using the Benjamini–Hochberg false discovery rate (FDR) method. A q-value < 0.05 was considered statistically significant. Asterisks in the figures indicate statistical significance as follows: * p < 0.05, ** p < 0.01, and *** p < 0.001. For multi-platform data integration, we used a strategy combining independent analysis with cross-validation. The same analytical content was processed independently across different platforms, such as TCGA plus GTEx, TIMER2.0, and CPTAC. Each platform used its own standardized algorithm, and the results were presented in independent charts. Data from each platform had been normalized and preprocessed by the corresponding database. Therefore, this study did not perform secondary cross-platform data mixing. Key conclusions were cross-validated by assessing the consistency of results across multiple platforms to reduce the influence of platform-specific bias. Please refer to Supplementary Table S1 for detailed basic information on the public datasets utilized in this research.
5. Conclusions
In summary, ULK3 is upregulated in a range of cancers and is closely associated with poor prognosis, genomic variation, immunosuppressive microenvironment formation, and cancer-promoting functions. ULK3 may serve as a potential prognostic biomarker and therapeutic intervention point, especially in prostate cancer. However, the molecular mechanisms underlying the opposite prognostic trends of ULK3 across different cancer types remain unclear. In some cancers, low ULK3 expression is also associated with poor outcomes. Direct evidence that ULK3 drives tumor progression through RNA modification, metabolic reprogramming, or immune checkpoint regulation remains to be established through combined in vitro and in vivo functional experiments and clinical cohort studies. In addition, the anticancer effect of Cephaeline-mediated ULK3 activation and the underlying pathways in prostate cancer require further validation.
References
- M. Roszkowska. Multilevel Mechanisms of Cancer Drug Resistance. Int. J. Mol. Sci., 2024. [DOI | PubMed]
- X. Qi, X. Fu, H. Wang, L. Fu. Modulating UNC-51-like Kinase 1 (ULK1) to Treat Diseases: A Perspective from Autophagic Initiator to Druggable Target. Biochem. Pharmacol., 2026. [DOI | PubMed]
- B. Wang, G. Pareek, M. Kundu. ULK/Atg1: Phasing in and out of Autophagy. Trends Biochem. Sci., 2024. [DOI | PubMed]
- H. Jeong, J. Lee, J.-Y. Son, J. Lee, M. Kang, S. Cho, J.H. Kim, Y. Jeon, J. Lee, D. Shin. ULK1 Knockout Suppresses Pancreatic Cancer Progression by Inhibiting Autophagy and Enhancing Antitumor Immunity. Exp. Mol. Med., 2025. [DOI | PubMed]
- J.D. Webb, A. Buensuceso, E.J. Tomas, M.J. Borrelli, L. Viola, O. Hovey, Y. Ramos Valdes, B. Singha, S.S.-C. Li, T.G. Shepherd. ULK1 Promotes Metastatic Progression in Experimental Models of Epithelial Ovarian Cancer. Oncogene, 2026. [DOI | PubMed]
- P. Liang, B. Wang. An Autophagy-Independent Role of ULK1/ULK2 in Mechanotransduction and Breast Cancer Cell Migration. Autophagy, 2024. [DOI | PubMed]
- I. Motoo, S. Nanjo, T. Ando, S. Yamashita, T. Ushijima, I. Yasuda. Methylation Silencing of ULK2 via Epithelial-Mesenchymal Transition Causes Transformation to Poorly Differentiated Gastric Cancers. Gastric Cancer, 2022. [DOI | PubMed]
- S. Goruppi, A. Clocchiatti, G. Bottoni, E. Di Cicco, M. Ma, B. Tassone, V. Neel, S. Demehri, C. Simon, G. Paolo Dotto. The ULK3 Kinase Is a Determinant of Keratinocyte Self-Renewal and Tumorigenesis Targeting the Arginine Methylome. Nat. Commun., 2023. [DOI | PubMed]
- L. Quan, X. Luo, C. Meng, J. Liu, J. Ju, Z. Yang, Y. Shuai, T. Wei, J. Meng, P. Yuan. Genetic Associations of Plasma Proteins and Breast Cancer Identify Potential Therapeutic Drug Candidates. Commun. Biol., 2025. [DOI | PubMed]
- Y. Jin, L. Zhao, Y. Zhang, T. Chen, H. Shi, H. Sun, S. Ding, S. Chen, H. Cao, G. Zhang. BIN1 Deficiency Enhances ULK3-Dependent Autophagic Flux and Reduces Dendritic Size in Mouse Hippocampal Neurons. Autophagy, 2025. [DOI | PubMed]
- S. Kiri, T. Ryba. Cancer, Metastasis, and the Epigenome. Mol. Cancer, 2024. [DOI | PubMed]
- D. Patel, A.M. Dabhi, C. Dmello, M. Seervi, K.M. Sneha, P. Agrawal, M.H. Sahani, D. Kanojia. FKBP1A Upregulation Correlates with Poor Prognosis and Increased Metastatic Potential of HNSCC. Cell Biol. Int., 2022. [DOI | PubMed]
- K. Cui, J. He, N. Zhao, R. Ma, Y. Wang. Bioinformatics Analysis Identifies ULK3 as a Novel Prognostic and Immune-Related Biomarker in Esophageal Cancer. Transl. Cancer Res., 2025. [DOI | PubMed]
- Z. Wu, S. Li, X. Tang, Y. Wang, W. Guo, G. Cao, K. Chen, M. Zhang, M. Guan, D. Yang. Copy Number Amplification of DNA Damage Repair Pathways Potentiates Therapeutic Resistance in Cancer. Theranostics, 2020. [DOI | PubMed]
- O. Shoshani, S.F. Brunner, R. Yaeger, P. Ly, Y. Nechemia-Arbely, D.H. Kim, R. Fang, G.A. Castillon, M. Yu, J.S.Z. Li. Chromothripsis Drives the Evolution of Gene Amplification in Cancer. Nature, 2021. [DOI | PubMed]
- R.S.N. Fehrmann, J.M. Karjalainen, M. Krajewska, H.-J. Westra, D. Maloney, A. Simeonov, T.H. Pers, J.N. Hirschhorn, R.C. Jansen, E.A. Schultes. Gene Expression Analysis Identifies Global Gene Dosage Sensitivity in Cancer. Nat. Genet., 2015. [DOI | PubMed]
- L. Kasak, M. Näks, P. Eek, A. Piirsoo, R. Bhadoria, P. Starkov, M. Saarma, S. Kasvandik, M. Piirsoo. Characterization of Protein Kinase ULK3 Regulation by Phosphorylation and Inhibition by Small Molecule SU6668. Biochemistry, 2018. [DOI | PubMed]
- A. Maloverjan, M. Piirsoo. Mammalian Homologues of Drosophila Fused Kinase. Vitamins & Hormones, 2012
- S. Mathea, E. Salah, C. Tallant, D. Chatterjee, B.-T. Berger, R. Konietzny, S. Müller, B.M. Kessler, S. Knapp. Conformational Plasticity of the ULK3 Kinase Domain. Biochem. J., 2021. [DOI | PubMed]
- V. Saez-Jimenez, S. Scrima, M. Lambrughi, E. Papaleo, V. Mapelli, M.K.M. Engqvist, L. Olsson. Directed Evolution of (R)-2-Hydroxyglutarate Dehydrogenase Improves 2-Oxoadipate Reduction by 2 Orders of Magnitude. ACS Synth. Biol., 2022. [DOI | PubMed]
- N. Zhang, Y. Li, J. Sundquist, K. Sundquist, J. Ji. Identifying Actionable Druggable Targets for Breast Cancer: Mendelian Randomization and Population-Based Analyses. eBioMedicine, 2023. [DOI | PubMed]
- C. Liu, R. Joehanes, J. Ma, J. Xie, J. Yang, M. Wang, T. Huan, S.-J. Hwang, J. Wen, Q. Sun. Integrating Whole Genome and Transcriptome Sequencing to Characterize the Genetic Architecture of Isoform Variation. Nat. Commun., 2025. [DOI | PubMed]
- R.K. Bradley, O. Anczuków. RNA Splicing Dysregulation and the Hallmarks of Cancer. Nat. Rev. Cancer, 2023. [DOI | PubMed]
- G. Cheng, M. Hardy, J. Zielonka, K. Weh, M. Zielonka, K.A. Boyle, M. Abu Eid, D. McAllister, B. Bennett, L.A. Kresty. Mitochondria-Targeted Magnolol Inhibits OXPHOS, Proliferation, and Tumor Growth via Modulation of Energetics and Autophagy in Melanoma Cells. Cancer Treat. Res. Commun., 2020. [DOI | PubMed]
- X. Xiang, Z. Zhang, W. Xu, Z. Huang, J. Zhang. Role of Myeloid-Derived Suppressor Cells (MDSCs), Specifically Monocyte-Derived MDSCs, in Type 2 Diabetes-Related Diabetic Retinopathy. Diabetes Metab. Syndr. Obes., 2025. [DOI | PubMed]
- M. Chaib, B.B. Hafeez, H. Mandil, D. Daria, A.K. Pingili, S. Kumari, M. Sikander, V.K. Kashyap, G.-Y. Chen, E. Anning. Reprogramming of Pancreatic Adenocarcinoma Immunosurveillance by a Microbial Probiotic Siderophore. Commun. Biol., 2022. [DOI | PubMed]
- M. Palmeri, J. Mehnert, A.W. Silk, S.K. Jabbour, S. Ganesan, P. Popli, G. Riedlinger, R. Stephenson, A.B. De Meritens, A. Leiser. Real-World Application of Tumor Mutational Burden-High (TMB-High) and Microsatellite Instability (MSI) Confirms Their Utility as Immunotherapy Biomarkers. ESMO Open, 2022. [DOI | PubMed]
- T. Li, J. Fu, Z. Zeng, D. Cohen, J. Li, Q. Chen, B. Li, X.S. Liu. TIMER2.0 for Analysis of Tumor-Infiltrating Immune Cells. Nucleic Acids Res., 2020. [DOI | PubMed]
- B. Li, E. Severson, J.-C. Pignon, H. Zhao, T. Li, J. Novak, P. Jiang, H. Shen, J.C. Aster, S. Rodig. Comprehensive Analyses of Tumor Immunity: Implications for Cancer Immunotherapy. Genome Biol., 2016. [DOI | PubMed]
- D.S. Chandrashekar, S.K. Karthikeyan, P.K. Korla, H. Patel, A.R. Shovon, M. Athar, G.J. Netto, Z.S. Qin, S. Kumar, U. Manne. UALCAN: An Update to the Integrated Cancer Data Analysis Platform. Neoplasia, 2022. [DOI | PubMed]
- M. Uhlén, L. Fagerberg, B.M. Hallström, C. Lindskog, P. Oksvold, A. Mardinoglu, Å. Sivertsson, C. Kampf, E. Sjöstedt, A. Asplund. Tissue-Based Map of the Human Proteome. Science, 2015. [DOI | PubMed]
- E. Cerami, J. Gao, U. Dogrusoz, B.E. Gross, S.O. Sumer, B.A. Aksoy, A. Jacobsen, C.J. Byrne, M.L. Heuer, E. Larsson. The cBio Cancer Genomics Portal: An Open Platform for Exploring Multidimensional Cancer Genomics Data. Cancer Discov., 2012. [DOI | PubMed]
- Y. Zhang, X. Yao, H. Zhou, X. Wu, J. Tian, J. Zeng, L. Yan, C. Duan, H. Liu, H. Li. OncoSplicing: An Updated Database for Clinically Relevant Alternative Splicing in 33 Human Cancers. Nucleic Acids Res., 2022. [DOI | PubMed]
- V. Thorsson, D.L. Gibbs, S.D. Brown, D. Wolf, D.S. Bortone, T.-H. Ou Yang, E. Porta-Pardo, G.F. Gao, C.L. Plaisier, J.A. Eddy. The Immune Landscape of Cancer. Immunity, 2018. [DOI | PubMed]
- B. Ru, C.N. Wong, Y. Tong, J.Y. Zhong, S.S.W. Zhong, W.C. Wu, K.C. Chu, C.Y. Wong, C.Y. Lau, I. Chen. TISIDB: An Integrated Repository Portal for Tumor-Immune System Interactions. Bioinformatics, 2019. [DOI | PubMed]
- J.N. Weinstein, E.A. Collisson, G.B. Mills, K.R.M. Shaw, B.A. Ozenberger, K. Ellrott, I. Shmulevich, C. Sander, J.M. Stuart. The Cancer Genome Atlas Pan-Cancer Analysis Project. Nat. Genet., 2013. [DOI | PubMed]
- L.J. Carithers, H.M. Moore. The Genotype-Tissue Expression (GTEx) Project. Biopreserv. Biobank., 2015. [DOI | PubMed]
- T. Li, J. Fan, B. Wang, N. Traugh, Q. Chen, J.S. Liu, B. Li, X.S. Liu. TIMER: A Web Server for Comprehensive Analysis of Tumor-Infiltrating Immune Cells. Cancer Res., 2017. [DOI | PubMed]
- A. Lánczky, B. Győrffy. Web-Based Survival Analysis Tool Tailored for Medical Research (KMplot): Development and Implementation. J. Med. Internet Res., 2021. [DOI | PubMed]
- D. Chen, L. Xu, H. Xing, W. Shen, Z. Song, H. Li, X. Zhu, X. Li, L. Wu, H. Jiao. Sangerbox 2: Enhanced Functionalities and Update for a Comprehensive Clinical Bioinformatics Data Analysis Platform. iMeta, 2024. [DOI | PubMed]
- Z. Tang, B. Kang, C. Li, T. Chen, Z. Zhang. GEPIA2: An Enhanced Web Server for Large-Scale Expression Profiling and Interactive Analysis. Nucleic Acids Res., 2019. [DOI | PubMed]
- Z. Zeng, C.J. Wong, L. Yang, N. Ouardaoui, D. Li, W. Zhang, S. Gu, Y. Zhang, Y. Liu, X. Wang. TISMO: Syngeneic Mouse Tumor Database to Model Tumor Immunity and Immunotherapy Response. Nucleic Acids Res., 2022. [DOI | PubMed]
- A. Lin, C. Qi, T. Wei, M. Li, Q. Cheng, Z. Liu, P. Luo, J. Zhang. CAMOIP: A Web Server for Comprehensive Analysis on Multi-Omics of Immunotherapy in Pan-Cancer. Brief. Bioinform., 2022. [DOI | PubMed]
- U.T. Shank avaram, S. Varma, D. Kane, M. Sunshine, K.K. Chary, W.C. Reinhold, Y. Pommier, J.N. Weinstein. CellMiner: A Relational Database and Query Tool for the NCI-60 Cancer Cell Lines. BMC Genom., 2009. [DOI | PubMed]