
Proteomic Profiling Reveals Specific Molecular Hallmarks of the Pig Claustrum
Abstract
Supplementary Information:
The online version contains supplementary material available at 10.1007/s12035-023-03347-2.
Article type: Research Article
Keywords: Claustrum, Insula, Pig, Proteomic, Putamen
Affiliations: https://ror.org/03ad39j10grid.5395.a0000 0004 1757 3729Department of Veterinary Sciences, University of Pisa, Pisa, Italy; https://ror.org/03ad39j10grid.5395.a0000 0004 1757 3729Department of Clinical and Experimental Medicine, University of Pisa, Pisa, Italy; grid.412451.70000 0001 2181 4941Department of Medical, Oral and Biotechnological Sciences, University G. D’Annunzio of Chieti-Pescara, Chieti, Italy; Interuniversitary Consortium for Engineering and Medicine, COIIM, Campobasso, Italy; https://ror.org/03ad39j10grid.5395.a0000 0004 1757 3729Department of Translational Research and New Technologies in Medicine and Surgery, University of Pisa, Pisa, Italy; https://ror.org/0005w8d69grid.5602.10000 0000 9745 6549School of Biosciences and Veterinary Medicine, University of Camerino, Camerino, Italy; https://ror.org/03ad39j10grid.5395.a0000 0004 1757 3729Department of Pharmacy, University of Pisa, Pisa, Italy; https://ror.org/0005w8d69grid.5602.10000 0000 9745 6549School of Pharmacy, University of Camerino, Camerino, Italy
License: © The Author(s) 2023, corrected publication 2024 CC BY 4.0 Open AccessThis article is licensed under a Creative Commons Attribution 4.0 International License, which permits use, sharing, adaptation, distribution and reproduction in any medium or format, as long as you give appropriate credit to the original author(s) and the source, provide a link to the Creative Commons licence, and indicate if changes were made. The images or other third party material in this article are included in the article’s Creative Commons licence, unless indicated otherwise in a credit line to the material. If material is not included in the article’s Creative Commons licence and your intended use is not permitted by statutory regulation or exceeds the permitted use, you will need to obtain permission directly from the copyright holder. To view a copy of this licence, visit http://creativecommons.org/licenses/by/4.0/.
Article links: DOI: 10.1007/s12035-023-03347-2 | PubMed: 37095366 | PMC: PMC10293365
Relevance: Moderate: mentioned 3+ times in text
Full text: PDF (4.2 MB)
Introduction
Claustrum (CLA) is a thin sheet of gray matter located in the forebrain between the insula (IN) and the putamen (PU). Although its precise role remains a matter of debate, CLA is thought to be implicated in a variety of functions such as attention [ref. 1–ref. 3], impulsivity [ref. 4], regulation of sleep [ref. 5–ref. 7], and consciousness [ref. 8]. Moreover, a recent new hypothesis indicates CLA as a possible limbic–sensory–motor interface [ref. 9]. The pivotal role of CLA in these functions is supported by its extensive, reciprocal connectivity with the entire neocortex [ref. 10–ref. 13].
Recently, a wealth of data has been accumulated on the role of CLA in different neurological disorders. Changes in CLA morphology are described in Parkinson’s disease (PD), Alzheimer’s disease (AD), autism, schizophrenia, and depressive disorders. However, there is a lack of information regarding the involvement of CLA in these disorders, at molecular level [ref. 14].
CLA origin is another puzzling problem, and morphogenetic and neurochemical similarities led some authors to postulate a common origin for CLA and the insular cortex [ref. 15, ref. 16]; on the other hand, a subcortical origin has also been reported [ref. 17–ref. 19]. Furthermore, according to the hybrid ontogeny theory, CLA is considered as an intermediary between the cortical plate and corpus striatum [ref. 17].
Advances on the knowledge of CLA role in different species have essentially been obtained using immunohistochemical, physiological, and behavioral methods [ref. 1, ref. 3, ref. 10–ref. 13, ref. 20–ref. 23]; a different approach, employing a proteomic analysis, has been used to establish the anatomical definitions of rat CLA [ref. 24]. Recently, a single-cell integrating transcriptomic and circuit-level approach, advanced by Erwin et al. [ref. 25], identified two excitatory CLA neuron subtypes that are molecularly distinguishable from the adjacent cortex.
The position of this structure, encased as it is between the external and extreme capsule, renders measurements, characterizations, and manipulations difficult; this is particularly true for rodent CLA where the extreme capsule is not clearly defined [ref. 26]. Among mammals, the pig brain is an interesting model whose key translational features are its similarities with cortical and subcortical structures of human brain [ref. 27, ref. 28].
Furthermore, the most caudal part of pig CLA is characterized by a wide enlargement which is well delineated and separated from the adjoining structures [ref. 29], and this allows for isolation and sampling of CLA, IN, and PU without mixing tissues from different structures.
Here, we used a proteomic approach to define the protein profile of pig CLA and compare it with those of IN and PU. We then sought to reveal specific molecular hallmarks of pig CLA to better understand its function and origin, as well as possible implications of our findings in relation to human neurological diseases.
Materials and Methods
Animals and Tissue Samples
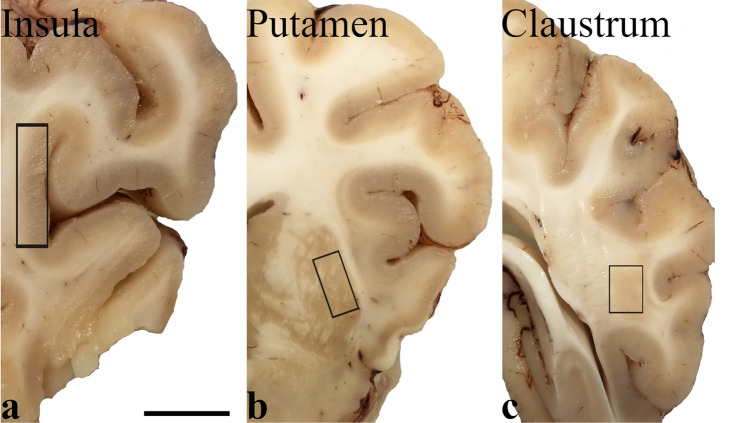
The brains of eight adult pigs (Sus scrofa domesticus) were removed immediately after commercial slaughtering at a local abattoir (Desideri Luciano SPA, Via Abruzzi, 2, 56025 Pontedera PI, Tuscany, Italy). Animals were treated according to the European Regulation (CE1099/2009) concerning animal welfare during the commercial slaughtering process and were constantly monitored under mandatory official veterinary medical care. All the animals were in good body conditions and considered free of pathologies by the veterinary medical officer responsible for the health and hygiene of the slaughterhouse. The brains, extracted within 15 min of death, were cut into transverse blocks (0.5 cm thick) containing CLA, PU, and IN in their rostro-caudal extent. Tissues of the right hemisphere were fixed by immersion in 4% paraformaldehyde in 0.1 M phosphate-buffered saline (PBS) at pH 7.4 and processed for paraffin embedding. From the left hemisphere, specimens of CLA, PU, and IN (Fig. 1) were quickly extracted under a stereomicroscope, snap-frozen in liquid nitrogen, and stored at − 80 °C until use.
Protein Extractions and Proteomic Analysis
Specimens of CLA (n = 3), IN (n = 3), and PU (n = 3) were weighted, minced with scissors, and homogenized in 5 vol (w/V) of rehydration solution (7 M urea, 2 M thiourea, 4% 3-((3-cholamidopropyl) dimethylammonio)-1-propanesulfonate (CHAPS), 60 mM dithiothreitol (DTT) containing protease inhibitors (Merck KGaA, Darmstadt, Germany)) using a Teflon-glass homogenizer (10 strokes). The resulting homogenates were incubated for 1 h at room temperature (RT) with occasional stirring. Thereafter, samples were centrifuged at 17,000 g for 15 min at RT to eliminate insoluble materials. The protein content was measured by the RC/DC assay (Bio-Rad, Hercules, CA, USA) using bovine serum albumin as standard.
Two-dimensional electrophoresis (2-DE) was performed essentially according to Ciregia et al. [ref. 30]. Briefly, isoelectrofocusing (IEF) was carried out using a pH 3–10 nonlinear (NL) gradient. Two hundred μg of proteins was filled up to 400 μL in rehydration solution containing 1% IPG buffer at pH 3–10 NL and 0.8% Pharmalyte. Immobiline DryStrip gels were rehydrated overnight in the sample and then transferred to the Ettan IPGphor II (GE Healthcare Europe, Uppsala, Sweden) apparatus. The second dimension (SDS-PAGE) was carried out by transferring the proteins to 12% polyacrylamide gels, and at the end of the second dimension, gels were stained with 1 μM bathophenanthroline disulfonate-bis(2,2′-bipyridine)[Ru(II)] tetrahydrate (RuBP) (Cyanagen Srl, Bo, Italy) staining [ref. 31]. Images were acquired using ImageQuant LAS 4010 (GE HealthCare) and analyzed by SameSpots (V4.1, TotalLab, Newcastle Upon Tyne, UK) software which generates 2-DE analyses which are robust and accurate. Briefly, the gels were aligned to place all spots in exactly the same location, and then, the spot detection produced a complete data set since all gels contain the same number of spots, each matched to its corresponding spot on all gels. After 2-DE gel alignment and subsequent spot detection, the software calculated background-corrected abundance, by determining the lowest intensity value of the image pixels outside [30, 31].
In-Gel Digestion and Mass Spectrometry
The gel pieces were digested as reported by Giusti et al. [ref. 32]. Samples were analyzed by LC-MS/MS as previously described [ref. 33] using a Proxeon EASY-nLC II (Thermo Fisher Scientific, Milan, Italy) chromatographic system coupled to a maXis HD UHR-TOF (Bruker Daltonics GmbH, Bremen, Germany) mass spectrometer. Briefly, peptides were loaded on the EASY-Column C18 trapping column (2 cm L, 100 μm ID, 5 μm ps; Thermo Fisher Scientific), and then separated on an Acclaim PepMap 100 C18 (25 cm L, 75 μm ID, 5 μm ps; Thermo Fisher Scientific) nanoscale chromatographic column at a flow rate of 300 nL/min and with a standard gradient from 3 to 35% of acetonitrile in 15 min. The mass spectrometer was equipped with a nanoESI spray source and operated in positive ion polarity and auto MS/MS mode (data-dependent acquisition (DDA)), using N2 as collision gas for collision-induced dissociation (CID) fragmentation. In-source reference lock mass (1221.9906 m/z) was acquired online throughout the runs.
Raw data were processed with DataAnalysis v. 4.2 to apply the lock mass calibration and then loaded in PEAKS Studio v7.5 software (Bioinformatic Solutions, Inc., Waterloo, Canada) using the “correct precursor only” option. The mass lists were searched against the NeXtProt database Sus scrofa domesticus (downloaded December 2018 and containing 42,184 entries). Carbamidomethylation of cysteines was selected as fixed modification, and oxidation of methionines, deamidation of asparagine and glutamine, as well as N terminus and lysine acetylation were set as variable modifications. Nonspecific cleavage was allowed to the one end of the peptides, with a maximum of 2 missed cleavages and 2 variable post-translational modifications (PTMs) per peptide; 10 ppm and 0.05 Da were set as the highest error mass tolerances for precursors and fragments, respectively; − 10logP threshold for peptide-spectrum matches (PSMs) was manually set from 15 to 35, in order to obtain a false discovery rate (FDR) value < 0.1% for both PSM and peptide sequences. For protein ID, the FDR value was < 0.1%.
Western Blot Analysis
Aliquots (5 μg of proteins) of protein extracts from different brain regions (CLA, n = 5; IN, n = 5; PU, n = 5) were mixed with Laemmli solution, resolved on 4–16% polyacrylamide gels (Mini-PROTEAN® Precast Gels, Bio-Rad, Hercules, CA, USA) using a Mini-PROTEAN Tetra Cell (Bio-Rad), and transferred onto 0.2-μm nitrocellulose membranes using a Trans-Blot Turbo transfer system (Bio-Rad) (Ciregia et al., 2013). Membranes were blocked in TBST (50 mM Tris [pH 7.5], 150 mM NaCl, and 0.1% Tween 20), supplemented with 3% non-fat dry milk for 1 h at room temperature, and subsequently probed with the following primary antibodies: a mouse monoclonal anti-calcium/calmodulin-dependent protein kinase II-α (CaMKII-α, dilution 1:1000, 6G9; Cell Signaling Technology, Inc., Danvers, MA, USA) and a rabbit monoclonal anti-dihydropyrimidinase like 2 (DPYL2, alias collapsin response mediator protein 2 (CRMP-2), D8L6V, dilution 1:1000; Cell Signaling Technology, Inc., Danvers, MA, USA) in TBST/blocking solution overnight at 4 °C. Membranes were then incubated with the secondary antibody for 1 h at room temperature: HRP-goat anti-rabbit (Enzo Life Sciences, Inc., NY, USA) and HRP-goat anti-mouse (PerkinElmer, Inc., MA, USA) secondary antibodies were used at 1:10,000 dilution. Immunoblots were developed using the enhanced chemiluminescence (ECL) detection system, the chemiluminescent images were acquired using LAS 4010 (GE HealthCare), and the immunoreactive specific bands were quantified using ImageQuant L software. To normalize the optical density (OD) of immunoreactive bands, the OD of whole proteins was measured and, immediately after the electroblot, membranes were stained with 1 μM RuBPS [ref. 34]. Differences of protein expression levels among different samples were assessed using a paired Student’s t test (p < 0.05).
Immunofluorescence
Immunofluorescence was performed on serial 5-μm sections using a mouse monoclonal anti-CaMKII-α (dilution 1:2000, 6G9; Cell Signaling Technology, Inc., Danvers, MA, USA) or a rabbit monoclonal anti-collapsin response mediator protein 2 (DPYL2 alias CRMP-2, dilution 1:200, D8L6V; Cell Signaling Technology, Inc., Danvers, MA, USA). Epitope retrieval was carried out at 120 °C in a pressure cooker for 5 min with a Tris/EDTA buffer, pH 9.0. Sections were blocked for 1 h with 5% normal horse serum (PK-7200, Vector Labs) in PBS and then incubated overnight at 4 °C in a solution of anti-CaMKII-α or anti-CRMP-2 in PBS containing 2% normal horse serum and 0.05% Triton X-100. Sections were then rinsed in PBS (3 × 10 min), incubated for 1 h at room temperature with DyLight 488 anti-mouse IgG (5 μg/mL, DI-2488; Vector Labs., Burlingame, CA, USA) or anti-rabbit IgG (5 μg/mL, DI-1088; Vector Labs., Burlingame, CA, USA). Finally, sections were washed with PBS and coverslipped with Vectashield medium containing 4′,6-diamidino-2-phenylindole (DAPI) (H-1500, Vector Labs). The specificity of immunohistochemical staining was tested using negative control sections, in which the primary or secondary antibody was replaced with PBS or non-immune serum. Under these conditions, nonspecific staining was absent.
Microphotographs were collected under a Nikon Ni-E light microscope (Nikon Instruments, Spa Calenzano, Florence, Italy), fully equipped for fluorescence acquisition, connected to a personal computer via Nikon digital image processing software (Digital Sight DS-U1, NIS-Elements BR 4.51.00 software). CLA and adjoining structures were identified according to a stereotaxic atlas [ref. 35].
Statistical Analysis and Bioinformatics
All experiments were performed at least in triplicate, and resulting values are expressed as mean ± standard error.
In 2-DE experiments, a comparison among the different brain areas was performed, and the significance of the differences of normalized volume for each spot was calculated by the software SameSpots including the analysis of variance (ANOVA) test. Therefore, the protein spots that exhibited ratio ≥ 1.2 or ≤ 0.83, p value ≤ 0.05, and q value ≤ 0.05 were taken into consideration for further identification by nanoLC-MS/MS. Volcano plot and statistical analysis on individual proteins was performed using GraphPad Prism 8 (GraphPad Software, Inc., La Jolla, CA, USA). In western blot analysis, paired Student’s t test was used to compare differences among different brain areas, and differences with a p value < 0.05 were considered statistically significant.
The list of genes obtained from proteins found differentially expressed in different comparisons was analyzed using Metascape [ref. 36]. Metascape utilizes the well-adopted hypergeometric test [ref. 37] and the Benjamini–Hochberg p value correction algorithm [ref. 38] to identify all ontology terms that contain a statistically greater number of genes in common with an input list than expected by chance. Metascape automatically clusters enriched terms into non-redundant groups and chooses the most significant (lowest p value) term within each cluster to represent the cluster in heat map representations. Moreover, given a list of proteins, it automatically extracts a protein interaction network formed by these candidates. Finally, a circos plot showing how genes from the input gene lists overlap among different brain areas was generated.
Proteins found differentially expressed in each comparison were functionally analyzed using the Ingenuity Pathways Analysis (IPA; Qiagen, Redwood City, USA; www.qiagen.com/ingenuity, Build version: 321501M, Content version: 21249400) with the aim to determine the predominant functional relationships among proteins based on known associations in the literature. A comparison of the different analyses was created, and the upstream regulators, molecular functions, and human diseases whose activity appears to change in a significant manner according to the activation z-score value were shown. Heat map was build using NG-CHM GUI 2.20.2 software [ref. 39].
Results
Proteomic Analysis
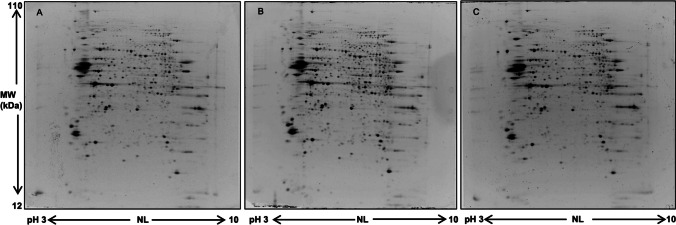
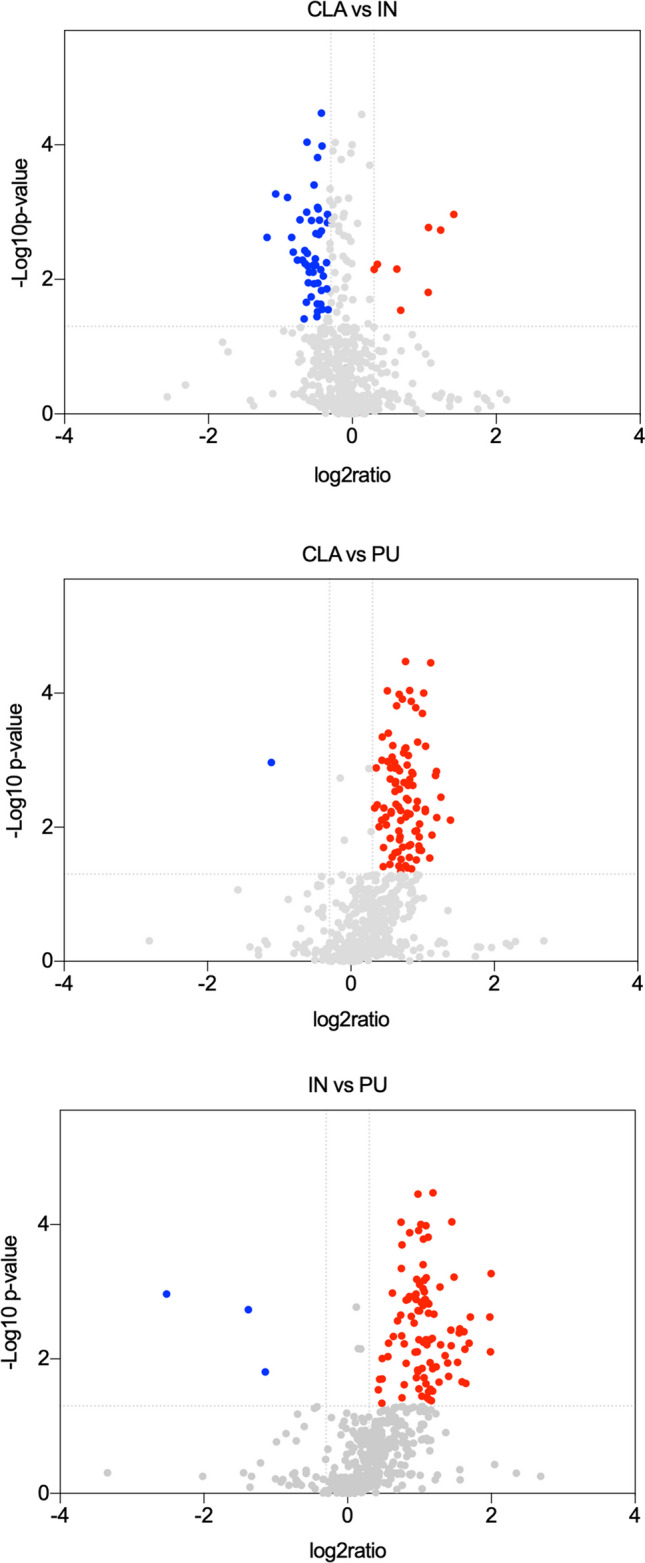
Two-dimensional electrophoresis was carried out to compare protein maps of different brain areas, and representative images of protein profile of CLA, IN, and PU are shown in Fig. 2A–C, respectively. Three different comparisons were performed: CLA vs IN, CLA vs PU, and IN vs PU. A greater difference of protein expression was observed between PU and the other two brain areas; in particular, 88 and 105 differentially expressed protein spots resulted from CLA vs PU and IN vs PU comparisons, respectively. On the contrary, minor significant differences in protein expression were observed in the comparison CLA vs IN. Volcano plots were constructed to graphically represent fold changes of protein expression (Fig. 3).
In Fig. 4, the circos plot shows how genes from the input gene lists obtained from different protein profile comparisons overlapped, and the protein divergence of CLA and IN when compared to PU placed both CLA and IN apart from PU with IN being the farthest. All spots showing an increase or decrease value ≥ 1.2 were subjected to nanoLC-ESI-MS/MS analysis and identified. Tables 1, 2, and 3 show the list of identified proteins together with their MW, pI, peptides and coverage values of MS/MS, ratio, and p values in three different comparisons. Twenty-one protein spots were identified in the CLA vs IN comparison of which only six proteins, Ras-related protein Rab-3A (RAB3A), ATP-citrate synthase (ACLY), methylcrotonyl-CoA carboxylase 1 (MCCC1), vesicle-fusing ATPase (NSF), copine 3 (CPN3), and myelin basic protein (MBP), resulted to be overexpressed in the CLA (Fig. 5).
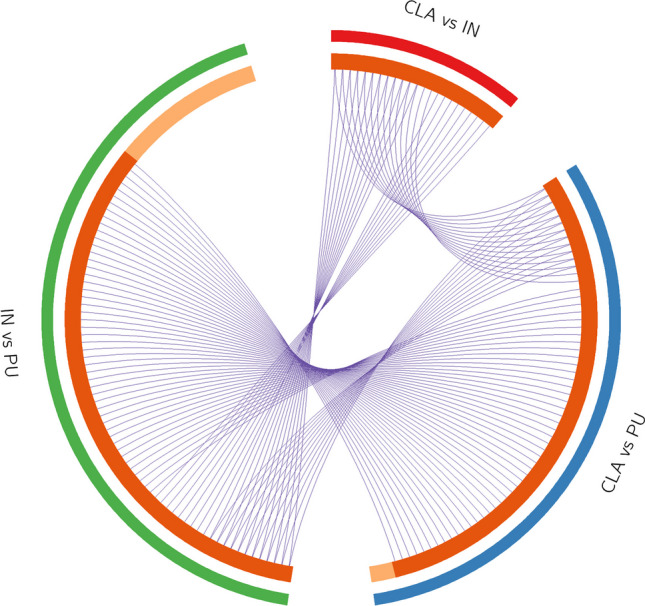
Table 1: List of differentially expressed proteins obtained from the comparison CLA vs PU
| Spot # | ID | Protein name | Gene | Coverage | Peptides | Unic | MW | pI | ANOVA p value | Ratio CLA/PU |
|---|---|---|---|---|---|---|---|---|---|---|
| 364 | F1RST0 | HSPH1 heat shock protein 70 family | HSPH1 | 28 | 25 | 25 | 96,699 | 5.29 | 0.002 | 1.6 |
| 397 | F1SUF2 | Hexokinase | HK1 | 36 | 33 | 24 | 83,569 | 6.96 | 0.016 | 1.4 |
| 407 | F1RWX8 | Ubiquitin-like modifier-activating enzyme 1 | UBA1 | 15 | 16 | 16 | 117,757 | 5.55 | 0.00004 | 1.7 |
| 415 | F1SDW6 | Oxoglutarate dehydrogenase like | OGDHL | 26 | 28 | 21 | 115,227 | 6.39 | 0.026 | 1.7 |
| 471 | F1RRW8 | Dynamin 1 | DNM1 | 39 | 43 | 10 | 97,328 | 7.97 | 0.037 | 1.9 |
| 476 | F1RRW8 | Dynamin 1 | DNM1 | 39 | 38 | 11 | 97,328 | 7.97 | 0.012 | 1.5 |
| 490 | F1SIH8 | Transitional endoplasmic reticulum ATPase | VCP | 46 | 45 | 44 | 89,431 | 5.44 | 0.00004 | 1.4 |
| 505 | F1SFG7 | Dynamin-like GTPase, mitochondrial | OPA1 | 33 | 25 | 25 | 78,120 | 8.07 | 0.034 | 1.9 |
| 637 | F1RRS3 | Vesicle-fusing ATPase | NSF | 7 | 5 | 5 | 83,585 | 6.52 | 0.007 | 1.7 |
| 655 | F1SII4 | Glycyl-tRNA synthetase | GARS | 19 | 18 | 18 | 83,260 | 7.02 | 0.02 | 1.9 |
| 665 | F1RRS3 | Vesicle-fusing ATPase | NSF | 10 | 7 | 7 | 83,500 | 6.52 | 0.004 | 2.3 |
| 665 | I3LT90 | Methylcrotonyl-CoA carboxylase 1 | MCCC1 | 3 | 2 | 2 | 80,400 | 6.34 | 0.004 | 2.3 |
| 673 | F1RRS3 | Vesicle-fusing ATPase | NSF | 16 | 12 | 12 | 85,585 | 6.52 | 0.011 | 2 |
| 681 | I3LJE2 | Dihydropyrimidinase like 2 | DPYSL2 | 20 | 14 | 14 | 73,531 | 5.94 | 0.014 | 1.6 |
| 684 | I3LJE2 | Dihydropyrimidinase like 2 | DPYSL2 | 40 | 25 | 23 | 73,531 | 5.94 | 0.008 | 1.9 |
| 690 | I3LJE2 | Dihydropyrimidinase like 2 | DPYSL2 | 20 | 14 | 14 | 73,531 | 5.94 | 0.004 | 2.5 |
| 751 | C3RZ98 | Protein arginine N-methyltransferase 5 | PRMT5 | 8 | 6 | 6 | 72,614 | 5.88 | 0.005 | 1.8 |
| 765 | F1RS11 | Syntaxin-binding protein 1 | STXBP1 | 30 | 23 | 23 | 68,749 | 6.32 | 0.031 | 1.3 |
| 777 | A8U4R4 | Transketolase | tkt | 24 | 20 | 20 | 67,838 | 7.21 | 0.007 | 1.7 |
| 817 | I3LJE2 | Dihydropyrimidinase like 2 | DPYSL2 | 37 | 27 | 26 | 73,531 | 5.94 | 0.003 | 1.7 |
| 819 | F1RS11 | Syntaxin-binding protein 1 | STXBP1 | 31 | 24 | 24 | 68,749 | 6.32 | 0.026 | 1.5 |
| 820 | I3LBY0 | Coatomer subunit delta | ARCN1 | 14 | 7 | 7 | 57,250 | 5.69 | 0.008 | 1.6 |
| 824 | I3LNG8 | Stress-induced phosphoprotein 1 | STIP1 | 25 | 17 | 17 | 47,879 | 6.36 | 0.00053 | 1.6 |
| 824 | I3LJE2 | Dihydropyrimidinase like 2 | DPYSL2 | 9 | 6 | 6 | 73,531 | 5.94 | 0.00053 | 1.6 |
| 826 | I3LJE2 | Dihydropyrimidinase like 2 | DPYSL2 | 37 | 30 | 23 | 73,531 | 5.94 | 0.01 | 1.5 |
| 827 | I3LJE2 | Dihydropyrimidinase like 2 | DPYSL2 | 45 | 27 | 23 | 73,531 | 5.94 | 0.04 | 1.8 |
| 831 | I3LJE2 | Dihydropyrimidinase like 2 | DPYSL2 | 44 | 57 | 53 | 73,531 | 5.94 | 0.00005 | 1.9 |
| 858 | I3LJE2 | Dihydropyrimidinase like 2 | DPYSL2 | 11 | 4 | 3 | 73,531 | 5.94 | 0.007 | 1.9 |
| 878 | I3LN38 | Collapsin response mediator protein 1 | CRMP-1 | 26 | 13 | 11 | 58,144 | 6.47 | 0.025 | 1.6 |
| 878 | F1RGA9 | Coronin | CORO1C | 12 | 6 | 6 | 58,929 | 6.48 | 0.025 | 1.6 |
| 884 | I3LR32 | CCT-epsilon | CCT5 | 33 | 23 | 23 | 54,518 | 5.57 | 0.002 | 1.4 |
| 901 | I3LDA5 | EH domain containing 4 | EHD4 | 11 | 7 | 3 | 42,252 | 6.32 | 0.002 | 2.4 |
| 918 | F1RXD5 | Copine 3 | CPNE3 | 9 | 5 | 5 | 59,644 | 5.57 | 0.00011 | 1.7 |
| 933 | F6QA08 | Protein disulfide-isomerase | PDIA3 | 45 | 28 | 28 | 56,859 | 5.93 | 0.00031 | 1.4 |
| 940 | I3LR17 | Coronin 1A | CORO1A | 27 | 16 | 16 | 43,411 | 6.12 | 0.008 | 2.3 |
| 964 | F1RR02 | Glial fibrillary acidic protein | GFAP | 47 | 26 | 26 | 49,437 | 5.65 | 0.00001 | 1.8 |
| 964 | F1RMZ8 | ATPase H+ transporting V1 subunit B2 | ATP6V1B2 | 17 | 9 | 9 | 56,613 | 5.57 | 0.00001 | 1.8 |
| 971 | I3LGA1 | WD repeat domain 37 | WDR37 | 11 | 5 | 5 | 54,116 | 6.95 | 0.032 | 1.8 |
| 1007 | D0G0C8 | Chaperonin containing TCP1, subunit 2 (beta) | CCT2 | 27 | 16 | 16 | 57,444 | 6.09 | 0.036 | 1.8 |
| 1012 | F1ST01 | Selenium-binding protein 1 | SELENBP1 | 29 | 17 | 17 | 52,534 | 6.54 | 0.016 | 1.9 |
| 1012 | I3LKF3 | Fascin | FSCN1 | 26 | 14 | 14 | 53,234 | 8.19 | 0.016 | 1.9 |
| 1015 | I3LKF3 | Fascin | FSCN1 | 34 | 16 | 16 | 53,234 | 8.19 | 0.016 | 1.7 |
| 1015 | F1ST01 | Selenium-binding protein 1 | SELENBP1 | 9 | 3 | 3 | 52,534 | 6.54 | 0.016 | 1.7 |
| 1017 | F1ST01 | Selenium-binding protein 1 | SELENBP1 | 10 | 5 | 5 | 52,534 | 6.54 | 0.021 | 1.9 |
| 1057 | F1RR02 | Glial fibrillary acidic protein | GFAP | 55 | 37 | 36 | 49,437 | 5.65 | 0.00008 | 2.2 |
| 1062 | F1RR02 | Glial fibrillary acidic protein | GFAP | 55 | 34 | 33 | 49,437 | 5.65 | 0.00029 | 2 |
| 1077 | F1SEN2 | Glutamate dehydrogenase 1, mitochondrial | GLUD1 | 19 | 10 | 10 | 61,308 | 8.02 | 0.014 | 1.5 |
| 1131 | I3LNG5 | Calcium/calmodulin-dependent protein kinase | CAMK2A | 17 | 10 | 9 | 42,639 | 6.61 | 0.01 | 1.5 |
| 1135 | I3LNG5 | Calcium/calmodulin-dependent protein kinase | CAMK2A | 17 | 10 | 10 | 42,639 | 6.61 | 0.01 | 1.7 |
| 1137 | I3LNG5 | Calcium/calmodulin-dependent protein kinase | CAMK2A | 19 | 11 | 2 | 42,639 | 6.61 | 0.001 | 1.9 |
| 1146 | I3LNG5 | Calcium/calmodulin-dependent protein kinase | CAMK2A | 19 | 11 | 2 | 42,639 | 6.61 | 0.026 | 1.8 |
| 1146 | I3LK59 | 2-Phospho-d-glycerate hydro-lyase | ENO1 | 9 | 4 | 4 | 38,082 | 0.026 | 1.8 | |
| 1153 | I3LNG5 | Calcium/calmodulin-dependent protein kinase | CAMK2A | 23 | 12 | 2 | 42,639 | 6.61 | 0.013 | 1.5 |
| 1170 | F1RUK8 | Rab GDP dissociation inhibitor | GDI2 | 52 | 24 | 21 | 50,327 | 5.78 | 0.009 | 1.5 |
| 1187 | F1RR48 | SH3 domain containing GRB2 like, endophilin B2 | SH3GLB2 | 13 | 6 | 6 | 43,489 | 5.73 | 0.00039 | 1.6 |
| 1194 | Q29387 | Elongation factor 1-gamma | EEF1G | 31 | 21 | 21 | 49,624 | 6.16 | 0.019 | 2 |
| 1195 | A6M928 | Eukaryotic translation initiation factor 4A isoform 1 | EIF4A1 | 22 | 9 | 3 | 46,154 | 5.32 | 0.002 | 2.8 |
| 1195 | A6M930 | Eukaryotic translation initiation factor 4A isoform 2 | EIF4A2 | 21 | 9 | 3 | 46,502 | 5.33 | 0.002 | 2.8 |
| 1276 | F1RK10 | Succinate-CoA ligase (ADP-forming) subunit beta, mitochondrial | SUCLA2 | 31 | 18 | 18 | 50,304 | 5.86 | 0.029 | 1.3 |
| 1315 | F1SNE5 | SH3 domain containing GRB2 like 2, endophilin A1 | SH3GL2 | 37 | 17 | 17 | 37,614 | 5.26 | 0.00048 | 2.3 |
| 1336 | K7GM43 | Septin 5 | SEPT5 | 26 | 13 | 13 | 43,787 | 6.55 | 0.006 | 1.8 |
| 1363 | P46410 | Glutamine synthetase | GLUL | 9 | 5 | 5 | 42,030 | 6.28 | 0.001 | 1.7 |
| 1376 | F1RZB5 | Tropomodulin 2 | TMOD2 | 24 | 12 | 12 | 39,693 | 5.17 | 0.009 | 1.6 |
| 1414 | F1RJ25 | Fructose-bisphosphate aldolase | ALDOC | 47 | 25 | 25 | 39,377 | 6.21 | 0.02 | 1.6 |
| 1421 | F1RL02 | Mitogen-activated protein kinase | MAPK1 | 39 | 15 | 14 | 37,974 | 6.56 | 0.042 | 1.6 |
| 1455 | F1RF18 | G protein subunit alpha o1 | GNAO1 | 13 | 6 | 4 | 40,078 | 5.10 | 0.00037 | 1.4 |
| 1457 | P00506 | Aspartate aminotransferase, mitochondrial | GOT2 | 10 | 6 | 6 | 47,436 | 9.14 | 0.002 | 2.1 |
| 1464 | Q6QAQ1 | Actin, cytoplasmic 1 | ACTB | 11 | 6 | 6 | 41,737 | 5.29 | 0.02 | 1.5 |
| 1479 | Q9TV69 | Trans-1,2-dihydrobenzene-1,2-diol dehydrogenase | DHDH | 27 | 10 | 10 | 36,527 | 6.34 | 0.003 | 1.6 |
| 1508 | I3L8A1 | NAD-dependent protein deacetylase | SIRT2 | 20 | 10 | 9 | 35,964 | 7.47 | 0.001 | 2.1 |
| 1520 | F1RIK3 | Acyl-CoA thioesterase 7 | ACOT7 | 8 | 4 | 4 | 40,189 | 8.06 | 0.003 | 1.6 |
| 1524 | F1SEX0 | Dimethylarginine dimethylaminohydrolase 1 | DDAH1 | 25 | 5 | 5 | 20,779 | 5.36 | 0.002 | 1.8 |
| 1524 | F1SUE3 | Pyrophosphatase (inorganic) 1 | PPA1 | 10 | 3 | 3 | 32,790 | 5.44 | 0.002 | 1.8 |
| 1542 | F1RPC8 | Crystallin mu | CRYM | 44 | 23 | 23 | 33,508 | 5.16 | 0.004 | 1.8 |
| 1580 | P00336 | l-Lactate dehydrogenase B chain | LDHB | 37 | 18 | 18 | 36,612 | 5.57 | 0.00026 | 1.5 |
| 1592 | F2Z4Z8 | G protein subunit beta 2 | GNB2 | 23 | 8 | 7 | 33,758 | 5.60 | 0.00082 | 1.4 |
| 1627 | I3LSK5 | G protein subunit beta 1 | GNB1 | 35 | 13 | 13 | 37,331 | 5.60 | 0.00038 | 2 |
| 1654 | F1RM45 | Apolipoprotein E | APOE | 20 | 7 | 7 | 36,665 | 5.92 | 0.006 | 2.1 |
| 1655 | F1RM45 | Apolipoprotein E | APOE | 12 | 4 | 4 | 36,665 | 5.92 | 0.002 | 1.6 |
| 1660 | F1SGH5 | Pyruvate dehydrogenase E1 component subunit beta | PDHB | 52 | 17 | 17 | 39,273 | 6.20 | 0.002 | 1.5 |
| 1660 | F1RM45 | Apolipoprotein E | APOE | 22 | 6 | 6 | 36,665 | 5.92 | 0.002 | 1.5 |
| 1757 | Q06A94 | Heterogeneous nuclear ribonucleoprotein A1 | HNRNPA1L2 | 28 | 8 | 8 | 34,196 | 9.27 | 0.003 | 2.2 |
| 1826 | P62258 | 14-3-3 protein epsilon | YWHAE | 69 | 38 | 38 | 29,174 | 4.63 | 0.007 | 1.4 |
| 2013 | Q45FY6 | Hypoxanthine-guanine phosphoribosyltransferase | HPRT1 | 57 | 14 | 14 | 24,555 | 6.30 | 0.014 | 2.6 |
| 2029 | Q6SEG5 | Ubiquitin carboxyl-terminal hydrolase isozyme L1 | UCHL1 | 66 | 38 | 37 | 24,859 | 5.22 | 0.00053 | 1.5 |
| 2100 | Q06AU3 | Ras-related protein Rab-3A | RAB3A | 15 | 3 | 3 | 24,970 | 4.85 | 0.006 | 0.45 |
| 2165 | Q6SEG5 | Ubiquitin carboxyl-terminal hydrolase isozyme L1 | UCHL1 | 65 | 38 | 7 | 24,859 | 5.22 | 0.011 | 1.6 |
| 2165 | Q5E946 | Protein DJ-1 | PARK7 | 56 | 16 | 16 | 20,035 | 6.84 | 0.011 | 1.6 |
| 2402 | A8QW48 | Beta-synuclein | SNCB | 25 | 5 | 4 | 14,115 | 4.46 | 0.002 | 1.6 |
| 2467 | Q3I5G7 | Alpha-synuclein | SNCA | 53 | 8 | 8 | 14,520 | 4.62 | 0.002 | 1.7 |
| 2497 | Q8WNW3 | Junction plakoglobin | Jup | 27 | 20 | 20 | 81,850 | 5.75 | 0.0003 | 2.4 |
Table 2: List of differentially expressed proteins obtained from the comparison CLA vs IN
| Spot # | ID | Protein name | Gene | Coverage | Peptides | Unic | MW | pI | ANOVA p value | Ratio CLA/IN |
|---|---|---|---|---|---|---|---|---|---|---|
| 345 | F1S0N2 | ATP-citrate synthase | ACLY | 21 | 11 | 11 | 57,558 | 7.12 | 0.025 | 2.1 |
| 397 | F1SUF2 | Hexokinase | HK1 | 36 | 33 | 24 | 83,569 | 6.96 | 0.01 | 0.69 |
| 546 | F1SCS1 | DEAD-box helicase 1 | DDX1 | 14 | 10 | 10 | 77,025 | 6.80 | 0.013 | 0.588 |
| 665 | F1RRS3 | Vesicle-fusing ATPase | NSF | 10 | 7 | 7 | 83,500 | 6.52 | 0.005 | 2.1 |
| 665 | I3LT90 | Methylcrotonyl-CoA carboxylase 1 | MCCC1 | 3 | 2 | 2 | 80,400 | 6.34 | 0.005 | 2.1 |
| 918 | F1RXD5 | Copine 3 | CPNE3 | 9 | 5 | 5 | 59,644 | 5.57 | 0.03 | 1.5 |
| 959 | I3L7D3 | Synapsin II | SYN2 | 31 | 18 | 16 | 51,020 | 8.84 | 0.004 | 0.625 |
| 959 | Q19PY3 | tRNA-splicing ligase RtcB homolog | RTCB | 31 | 17 | 17 | 55,238 | 6.77 | 0.004 | 0.625 |
| 959 | I3LK72 | Acyl-CoA synthetase family member 3 | ACSF3 | 27 | 13 | 13 | 48,212 | 8.71 | 0.004 | 0.625 |
| 959 | F1SLF6 | Chaperonin containing TCP1, subunit 7 (Eta) | CCT7 | 24 | 14 | 14 | 59,471 | 6.74 | 0.004 | 0.625 |
| 960 | I3L7D3 | Synapsin II | SYN2 | 12 | 6 | 6 | 51,020 | 8.84 | 0.045 | 0.625 |
| 960 | F1SD97 | Phenylalanyl-tRNA synthetase alpha subunit | FARSA | 18 | 10 | 10 | 57,628 | 7.85 | 0.045 | 0.625 |
| 1131 | I3LNG5 | Calcium/calmodulin-dependent protein kinase | CAMK2A | 17 | 10 | 9 | 42,639 | 6.61 | 0.015 | 0.526 |
| 1137 | I3LNG5 | Calcium/calmodulin-dependent protein kinase | CAMK2A | 19 | 11 | 2 | 42,639 | 6.61 | 0.021 | 0.476 |
| 1143 | I3LK59 | 2-Phospho-d-glycerate hydro-lyase | ENO1 | 34 | 13 | 10 | 38,082 | 6.43 | 0.029 | 0.435 |
| 1143 | I3LNG5 | Calcium/calmodulin-dependent protein kinase | CAMK2A | 21 | 12 | 3 | 42,639 | 6.61 | 0.029 | 0.435 |
| 1154 | I3LNG5 | Calcium/calmodulin-dependent protein kinase | CAMK2A | 29 | 15 | 4 | 42,639 | 6.61 | 0.008 | 0.664 |
| 1187 | F1RR48 | SH3 domain containing GRB2 like, endophilin B2 | SH3GLB2 | 13 | 6 | 6 | 43,489 | 5.73 | 0.023 | 0.714 |
| 1464 | Q6QAQ1 | Actin, cytoplasmic 1 | ACTB | 11 | 6 | 6 | 41,737 | 5.29 | 0.034 | 0.714 |
| 1542 | F1RPC8 | Crystallin mu | CRYM | 44 | 23 | 23 | 33,508 | 5.16 | 0.003 | 0.667 |
| 1592 | F2Z4Z8 | G protein subunit beta 2 | GNB2 | 23 | 8 | 7 | 33,758 | 5.60 | 0.042 | 0.833 |
| 1815 | Q9GZU5 | Nyctalopin | NYX | 2 | 2 | 2 | 52,000 | 9.10 | 0.026 | 0.588 |
| 1826 | P62258 | 14-3-3 protein epsilon | YWHAE | 69 | 38 | 38 | 29,174 | 4.63 | 0.044 | 0.833 |
| 2100 | Q06AU3 | Ras-related protein Rab-3A | RAB3A | 15 | 3 | 3 | 24,970 | 4.85 | 0.018 | 2.7 |
| 2402 | A8QW48 | Beta-synuclein | SNCB | 25 | 5 | 4 | 14,115 | 4.46 | 0.02 | 0.769 |
| 2467 | Q3I5G7 | Alpha-synuclein | SNCA | 53 | 8 | 8 | 14,520 | 4.62 | 0.013 | 0.769 |
| 2487 | P81558 | Myelin basic protein | MBP | 27 | 4 | 4 | 18,486 | 11.28 | 0.00061 | 2.3 |
Table 3: List of differentially expressed proteins obtained from the comparison IN vs PU
| Spot # | ID | Protein name | Gene | Coverage | Peptides | Unic | MW | pI | ANOVA p value | Ratio IN/PU |
|---|---|---|---|---|---|---|---|---|---|---|
| 332 | F1SCV1 | Gamma-tubulin complex component | TUBGCP2 | 1 | 2 | 1 | 102,582 | 6.26 | 0.031 | 2.1 |
| 345 | F1S0N2 | ATP-citrate synthase | ACLY | 21 | 11 | 11 | 57,558 | 7.12 | 0.034 | 0.45 |
| 355 | I3L8X6 | Amphiphysin | AMPH | 19 | 15 | 15 | 71,840 | 4.56 | 0.006 | 2.2 |
| 364 | F1RST0 | Heat shock 110 kDa protein | HSPH1 | 28 | 25 | 25 | 96,699 | 5.29 | 0.005 | 2 |
| 365 | F1RST0 | Heat shock 110 kDa protein | HSPH1 | 17 | 15 | 15 | 96,699 | 5.29 | 0.001 | 2 |
| 394 | F1SML4 | Staphylococcal nuclease and Tudor domain containing 1 | SND1 | 8 | 5 | 4 | 66,087 | 6.72 | 0.038 | 2 |
| 397 | F1SUF2 | Hexokinase | HK1 | 36 | 33 | 24 | 83,569 | 6.96 | 0.00085 | 2.1 |
| 407 | F1RWX8 | Ubiquitin-like modifier-activating enzyme 1 | UBA1 | 15 | 16 | 16 | 117,757 | 5.55 | 0.003 | 2.4 |
| 415 | F1SDW6 | Oxoglutarate dehydrogenase like | OGDHL | 26 | 28 | 21 | 115,227 | 6.39 | 0.032 | 2.2 |
| 455 | F1RI39 | Actinin alpha 4 | ACTN4 | 27 | 20 | 20 | 101,837 | 5.23 | 0.002 | 2.5 |
| 471 | F1RRW8 | Dynamin 1 | DNM1 | 39 | 43 | 10 | 97,328 | 7.97 | 0.011 | 2.6 |
| 476 | F1RRW8 | Dynamin 1 | DNM1 | 39 | 38 | 11 | 97,328 | 7.97 | 0.001 | 2.1 |
| 490 | F1SIH8 | Transitional endoplasmic reticulum ATPase | VCP | 46 | 45 | 44 | 89,431 | 5.44 | 0.02 | 1.5 |
| 505 | F1SFG7 | OPA1, mitochondrial dynamin-like GTPase | OPA1 | 33 | 25 | 25 | 78,120 | 8.07 | 0.01 | 2.9 |
| 546 | F1SCS1 | DEAD-box helicase 1 | DDX1 | 14 | 10 | 10 | 77,025 | 6.80 | 0.00034 | 2.1 |
| 630 | I3L8C5 | Heat shock protein family A (Hsp70) member 12A | HSPA12A | 20 | 14 | 14 | 74,809 | 6.18 | 0.01 | 2 |
| 637 | F1RRS3 | Vesicle-fusing ATPase | NSF | 7 | 5 | 5 | 83,585 | 6.52 | 0.007 | 2.7 |
| 655 | F1SII4 | Glycyl-tRNA synthetase | GARS | 19 | 18 | 18 | 83,260 | 7.02 | 0.012 | 2.6 |
| 681 | I3LJE2 | Dihydropyrimidinase like 2 | DPYSL2 | 20 | 14 | 14 | 73,531 | 5.94 | 0.005 | 2.3 |
| 684 | I3LJE2 | Dihydropyrimidinase like 2 | DPYSL2 | 40 | 25 | 23 | 73,531 | 5.94 | 0.007 | 2.9 |
| 690 | I3LJE2 | Dihydropyrimidinase like 2 | DPYSL2 | 20 | 14 | 14 | 73,531 | 5.94 | 0.002 | 4.4 |
| 720 | F1RPU0 | Glycerol-3-phosphate dehydrogenase | GPD2 | 38 | 34 | 34 | 80,921 | 6.54 | 0.022 | 2.1 |
| 724 | P28491 | Calreticulin | CALR | 36 | 23 | 23 | 48,288 | 4.32 | 0.01 | 1.5 |
| 751 | C3RZ98 | Protein arginine N-methyltransferase 5 | PRMT5 | 8 | 6 | 6 | 72,614 | 5.88 | 0.01 | 1.5 |
| 765 | F1RS11 | Syntaxin-binding protein 1 | STXBP1 | 30 | 23 | 23 | 68,749 | 6.32 | 0.002 | 1.4 |
| 799 | O75083 | WD repeat-containing protein 1 | WDR1 | 16 | 11 | 2 | 66,194 | 6.17 | 0.001 | 1.7 |
| 817 | I3LJE2 | Dihydropyrimidinase like 2 | DPYSL2 | 37 | 27 | 26 | 73,531 | 5.94 | 0.002 | 1.9 |
| 819 | F1RS11 | Syntaxin-binding protein 1 | STXBP1 | 31 | 24 | 24 | 68,749 | 6.32 | 0.002 | 1.9 |
| 820 | I3LBY0 | Coatomer subunit delta | ARCN1 | 14 | 7 | 7 | 57,250 | 5.69 | 0.028 | 2.1 |
| 825 | I3LNG8 | Stress-induced phosphoprotein 1 | STIP1 | 35 | 21 | 21 | 47,879 | 6.36 | 0.038 | 2.1 |
| 825 | I3LJE2 | Dihydropyrimidinase like 2 | DPYSL2 | 3 | 2 | 2 | 73,531 | 5.94 | 0.038 | 2.1 |
| 826 | I3LJE2 | Dihydropyrimidinase like 2 | DPYSL2 | 37 | 30 | 23 | 73,531 | 5.94 | 0.029 | 1.7 |
| 827 | I3LJE2 | Dihydropyrimidinase like 2 | DPYSL2 | 45 | 27 | 23 | 73,531 | 5.94 | 0.012 | 2.7 |
| 831 | I3LJE2 | Dihydropyrimidinase like 2 | DPYSL2 | 44 | 57 | 53 | 73,531 | 5.94 | 0.001 | 2.1 |
| 858 | I3LJE2 | Dihydropyrimidinase like 2 | DPYSL2 | 11 | 4 | 3 | 73,531 | 5.94 | 0.014 | 2 |
| 878 | I3LN38 | Collapsin response mediator protein 1 | CRMP-1 | 26 | 13 | 11 | 58,144 | 6.47 | 0.01 | 2.2 |
| 878 | F1RGA9 | Coronin | CORO1C | 12 | 6 | 6 | 58,929 | 6.48 | 0.01 | 2.2 |
| 884 | I3LR32 | CCT-epsilon | CCT5 | 33 | 23 | 23 | 54,518 | 5.57 | 0.004 | 1.5 |
| 901 | I3LDA5 | EH domain containing 4 | EHD4 | 11 | 7 | 3 | 42,252 | 6.32 | 0.007 | 3 |
| 933 | E1CAJ5 | Protein disulfide-isomerase | PDIA3 | 45 | 28 | 28 | 56,859 | 5.93 | 0.049 | 1.4 |
| 940 | I3LR17 | Coronin 1A | CORO1A | 27 | 16 | 16 | 43,411 | 6.12 | 0.01 | 3.1 |
| 959 | I3L7D3 | Synapsin II | SYN2 | 31 | 18 | 16 | 51,020 | 8.84 | 0.002 | 2.1 |
| 959 | Q19PY3 | tRNA-splicing ligase RtcB homolog | RTCB | 31 | 17 | 17 | 55,238 | 6.77 | 0.002 | 2.1 |
| 959 | I3LK72 | Acyl-CoA synthetase family member 3 | ACSF3 | 27 | 13 | 13 | 48,212 | 8.71 | 0.002 | 2.1 |
| 959 | F1SLF6 | Chaperonin containing TCP1, subunit 7 (Eta) | CCT7 | 24 | 14 | 14 | 59,471 | 6.74 | 0.002 | 2.1 |
| 960 | I3L7D3 | Synapsin II | SYN2 | 12 | 6 | 6 | 51,020 | 8.84 | 0.046 | 2 |
| 960 | F1SD97 | Phenylalanyl-tRNA synthetase alpha subunit | FARSA | 18 | 10 | 10 | 57,628 | 7.85 | 0.046 | 2 |
| 964 | F1RR02 | Glial fibrillary acidic protein | GFAP | 47 | 26 | 26 | 49,437 | 5.65 | 0.001 | 1.8 |
| 964 | F1RMZ8 | ATPase H+ transporting V1 subunit B2 | ATP6V1B2 | 17 | 9 | 9 | 56,613 | 5.57 | 0.001 | 1.8 |
| 971 | I3LGA1 | WD repeat domain 37 | WDR37 | 11 | 5 | 5 | 54,116 | 6.95 | 0.033 | 2.2 |
| 1007 | D0G0C8 | Chaperonin containing TCP1, subunit 2 (beta) OS = Sus scrofa | CCT2 | 27 | 16 | 16 | 57,444 | 6.09 | 0.036 | 2.2 |
| 1012 | F1ST01 | Selenium-binding protein 1 OS | SELENBP1 | 29 | 17 | 17 | 52,534 | 6.54 | 0.034 | 2.1 |
| 1012 | I3LKF3 | Fascin | FSCN1 | 26 | 14 | 14 | 53,234 | 8.19 | 0.034 | 2.1 |
| 1015 | I3LKF3 | Fascin | FSCN1 | 34 | 16 | 16 | 53,234 | 8.19 | 0.024 | 1.9 |
| 1015 | F1ST01 | Selenium-binding protein 1 | SELENBP1 | 9 | 3 | 3 | 52,534 | 6.54 | 0.024 | 1.9 |
| 1017 | F1ST01 | Selenium-binding protein 1 | SELENBP1 | 10 | 5 | 5 | 52,534 | 6.54 | 0.012 | 2.3 |
| 1049 | F1RR02 | Glial fibrillary acidic protein | GFAP | 43 | 23 | 23 | 49,437 | 5.65 | 0.003 | 2 |
| 1057 | F1RR02 | Glial fibrillary acidic protein | GFAP | 55 | 37 | 36 | 49,437 | 5.65 | 0.00049 | 2 |
| 1062 | F1RR02 | Glial fibrillary acidic protein | GFAP | 55 | 34 | 33 | 49,437 | 5.65 | 0.002 | 1.7 |
| 1064 | F1SEN2 | Glutamate dehydrogenase 1, mitochondrial | GLUD1 | 26 | 16 | 16 | 61,608 | 8.02 | 0.012 | 2.2 |
| 1064 | F1RUE3 | Succinate-semialdehyde dehydrogenase | ALDH5A1 | 11 | 6 | 6 | 57,784 | 8.61 | 0.012 | 2.2 |
| 1064 | D2KPI8 | Adenylosuccinate lyase | ADSL | 7 | 4 | 4 | 55,092 | 6.45 | 0.012 | 2.2 |
| 1077 | F1SEN2 | Glutamate dehydrogenase 1, mitochondrial | GLUD1 | 19 | 10 | 10 | 61,308 | 8.02 | 0.001 | 1.8 |
| 1131 | I3LNG5 | Calcium/calmodulin-dependent protein kinase | CAMK2A | 17 | 10 | 9 | 42,639 | 6.61 | 0.002 | 2.8 |
| 1137 | I3LNG5 | Calcium/calmodulin-dependent protein kinase | CAMK2A | 19 | 11 | 2 | 42,639 | 6.61 | 0.002 | 4 |
| 1143 | I3LK59 | 2-Phospho-d-glycerate hydro-lyase | ENO1 | 34 | 13 | 10 | 38,082 | 6.43 | 0.002 | 3.9 |
| 1143 | I3LNG5 | Calcium/calmodulin-dependent protein kinase | CAMK2A | 21 | 12 | 3 | 42,639 | 6.61 | 0.002 | 3.9 |
| 1146 | I3LNG5 | Calcium/calmodulin-dependent protein kinase | CAMK2A | 19 | 11 | 2 | 42,639 | 6.61 | 0.002 | 3.3 |
| 1146 | I3LK59 | 2-Phospho-d-glycerate hydro-lyase | ENO1 | 9 | 4 | 4 | 38,082 | 0.002 | 3.3 | |
| 1153 | I3LNG5 | Calcium/calmodulin-dependent protein kinase | CAMK2A | 23 | 12 | 2 | 42,639 | 6.61 | 0.001 | 1.9 |
| 1154 | I3LNG5 | Calcium/calmodulin-dependent protein kinase | CAMK2A | 29 | 15 | 4 | 42,639 | 6.61 | 0.003 | 1.8 |
| 1170 | F1RUK8 | Rab GDP dissociation inhibitor | GDI2 | 52 | 24 | 21 | 50,327 | 5.78 | 0.013 | 1.5 |
| 1187 | F1RR48 | SH3 domain containing GRB2 like, endophilin B2 | SH3GLB2 | 13 | 6 | 6 | 43,489 | 5.73 | 0.00074 | 2.2 |
| 1194 | Q29387 | Elongation factor 1-gamma | EEF1G | 31 | 21 | 21 | 49,624 | 6.16 | 0.024 | 2.4 |
| 1195 | A6M928 | Eukaryotic translation initiation factor 4A isoform 1 | EIF4A1 | 22 | 9 | 3 | 46,154 | 5.32 | 0.004 | 2.1 |
| 1195 | A6M930 | Eukaryotic translation initiation factor 4A isoform 2 | EIF4A2 | 21 | 9 | 3 | 46,502 | 5.33 | 0.004 | 2.1 |
| 1244 | F2Z5G5 | ARP1 actin-related protein 1 homolog A | ACTR1A | 32 | 15 | 15 | 42,614 | 6.19 | 0.016 | 2.3 |
| 1244 | F1RFI1 | Elongation factor Tu | TUFM | 18 | 9 | 8 | 49,451 | 6.72 | 0.016 | 2.3 |
| 1276 | F1RK10 | Succinate-CoA ligase (ADP-forming) subunit beta, mitochondrial | SUCLA2 | 31 | 18 | 18 | 50,304 | 5.86 | 0.007 | 1.6 |
| 1288 | F1RHA0 | 2-Oxoisovalerate dehydrogenase subunit alpha | TMEM91 | 16 | 6 | 6 | 47,020 | 6.87 | 0.019 | 2 |
| 1315 | F1SNE5 | SH3 domain containing GRB2 like 2, endophilin A1 | SH3GL2 | 37 | 17 | 17 | 37,614 | 5.26 | 0.008 | 2.2 |
| 1336 | K7GM43 | Septin 5 | SEPT5 | 26 | 13 | 13 | 43,787 | 6.55 | 0.012 | 2.7 |
| 1363 | P46410 | Glutamine synthetase | GLUL | 9 | 5 | 5 | 42,030 | 6.28 | 0.006 | 2.3 |
| 1376 | F1RZB5 | Tropomodulin 2 | TMOD2 | 24 | 12 | 12 | 39,693 | 5.17 | 0.019 | 2 |
| 1409 | F1SNE5 | SH3 domain containing GRB2 like 2, endophilin A1 | SH3GL2 | 19 | 11 | 11 | 37,614 | 5.26 | 0.00036 | 2.2 |
| 1413 | F1S0R4 | V-type proton ATPase subunit C | ATP6V1C1 | 27 | 14 | 14 | 44,033 | 7.62 | 0.002 | 2.1 |
| 1414 | F1RJ25 | Fructose-bisphosphate aldolase | ALDOC | 47 | 25 | 25 | 39,377 | 6.21 | 0.00001 | 1.9 |
| 1421 | F1RL02 | Mitogen-activated protein kinase | MAPK1 | 39 | 15 | 14 | 37,974 | 6.56 | 0.00001 | 1.9 |
| 1464 | Q6QAQ1 | Actin, cytoplasmic 1 | ACTB | 11 | 6 | 6 | 41,737 | 5.29 | 0.0007 | 2.1 |
| 1469 | F1RF18 | G protein subunit alpha o1 | GNAO1 | 8 | 5 | 5 | 40,078 | 5.10 | 0.00065 | 2 |
| 1479 | Q9TV69 | Trans-1,2-dihydrobenzene-1,2-diol dehydrogenase | DHDH | 27 | 10 | 10 | 36,527 | 6.34 | 0.021 | 2.1 |
| 1487 | F2Z5H6 | V-type proton ATPase subunit | ATP6V0D1 | 23 | 10 | 10 | 40,329 | 4.89 | 0.003 | 2.2 |
| 1520 | F1RIK3 | Acyl-CoA thioesterase 7 | ACOT7 | 8 | 4 | 4 | 40,189 | 8.06 | 0.011 | 2.1 |
| 1524 | F1SEX0 | Dimethylarginine dimethylaminohydrolase 1 | DDAH1 | 25 | 5 | 5 | 20,779 | 5.36 | 0.005 | 1.8 |
| 1524 | F1SUE3 | Pyrophosphatase (inorganic) 1 | PPA1 | 10 | 3 | 3 | 32,790 | 5.44 | 0.005 | 1.8 |
| 1542 | F1RPC8 | Crystallin mu | CRYM | 44 | 23 | 23 | 33,508 | 5.16 | 0.00056 | 2.7 |
| 1569 | F1RMB1 | Phytanoyl-CoA 2-hydroxylase-interacting protein | PHYHIP | 9 | 4 | 4 | 38,539 | 6.70 | 0.001 | 2 |
| 1580 | P00336 | l-Lactate dehydrogenase B chain | LDHB | 37 | 18 | 18 | 36,612 | 5.57 | 0.005 | 1.8 |
| 1592 | F2Z4Z8 | G protein subunit beta 2 | GNB2 | 23 | 8 | 7 | 33,758 | 5.60 | 0.00032 | 1.7 |
| 1614 | K7GNZ3 | NAC-A/B domain-containing protein | NACA | 9 | 2 | 2 | 23,384 | 4.52 | 0.003 | 2 |
| 1627 | I3LSK5 | G protein subunit beta 1 | GNB1 | 35 | 13 | 13 | 37,331 | 5.60 | 0.00007 | 2 |
| 1645 | C5H0C6 | Ubiquitin thioesterase | OTUB1 | 10 | 4 | 4 | 31,284 | 4.85 | 2.1 | |
| 1654 | F1RM45 | Apolipoprotein E | APOE | 20 | 7 | 7 | 36,665 | 5.92 | 0.009 | 2.1 |
| 1655 | F1RM45 | Apolipoprotein E | APOE | 12 | 4 | 4 | 36,665 | 5.92 | 0.006 | 1.6 |
| 1660 | F1SGH5 | Pyruvate dehydrogenase E1 component subunit beta | PDHB | 52 | 17 | 17 | 39,273 | 6.20 | 0.007 | 1.7 |
| 1660 | F1RM45 | Apolipoprotein E | APOE | 22 | 6 | 6 | 36,665 | 5.92 | 0.007 | 1.7 |
| 1732 | I3LRS8 | Phosphatidylinositol transfer protein alpha | PITPNA | 50 | 19 | 19 | 31,820 | 6.71 | 0.019 | 3 |
| 1757 | Q06A94 | Heterogeneous nuclear ribonucleoprotein A1 | HNRNPA1L2 | 28 | 8 | 8 | 34,196 | 9.27 | 0.032 | 2.3 |
| 1815 | Q9GZU5 | NYX_HUMAN nyctalopin | NYX | 2 | 2 | 2 | 52,000 | 9.10 | 0.008 | 2.1 |
| 1826 | P62258 | 14-3-3 protein epsilon | YWHAE | 69 | 38 | 38 | 29,174 | 4.63 | 0.00034 | 1.7 |
| 1939 | F1S8Y5 | Phosphoglycerate mutase | PGAM1 | 19 | 5 | 5 | 29,301 | 6.41 | 0.006 | 3.1 |
| 2013 | Q45FY6 | Hypoxanthine-guanine phosphoribosyltransferase | HPRT1 | 57 | 14 | 14 | 24,555 | 6.30 | 0.007 | 4 |
| 2029 | Q6SEG5 | Ubiquitin carboxyl-terminal hydrolase isozyme L1 | UCHL1 | 66 | 38 | 37 | 24,859 | 5.22 | 0.012 | 1.7 |
| 2087 | I3L9H4 | PITH domain containing 1 | PITHD1 | 27 | 5 | 5 | 24,265 | 5.47 | 0.006 | 2 |
| 2100 | Q06AU3 | Ras-related protein Rab-3A | RAB3A | 15 | 3 | 3 | 24,970 | 4.85 | 0.004 | 0.175 |
| 2165 | Q6SEG5 | Ubiquitin carboxyl-terminal hydrolase isozyme L1 | UCHL1 | 65 | 38 | 7 | 24,859 | 5.22 | 0.044 | 1.7 |
| 2165 | Q5E946 | Protein/nucleic acid deglycase DJ-1 | PARK7 | 56 | 16 | 16 | 20,035 | 6.84 | 0.044 | 1.7 |
| 2402 | A8QW48 | Beta-synuclein | SNCB | 25 | 5 | 4 | 14,115 | 4.46 | 0.00041 | 2.1 |
| 2467 | Q3I5G7 | Alpha-synuclein | SNCA | 53 | 8 | 8 | 14,520 | 4.62 | 0.00003 | 2.3 |
| 2479 | Q6DUB7 | Stathmin | STMN1 | 46 | 8 | 8 | 17,302 | 5.75 | 0.011 | 3.2 |
| 2487 | P81558 | Myelin basic protein | MBP | 27 | 4 | 4 | 18,486 | 11.28 | 0.006 | 0.38 |
| 2497 | Q8WNW3 | Junction plakoglobin | Jup | 27 | 20 | 20 | 81,850 | 5.75 | 0.00076 | 3.2 |
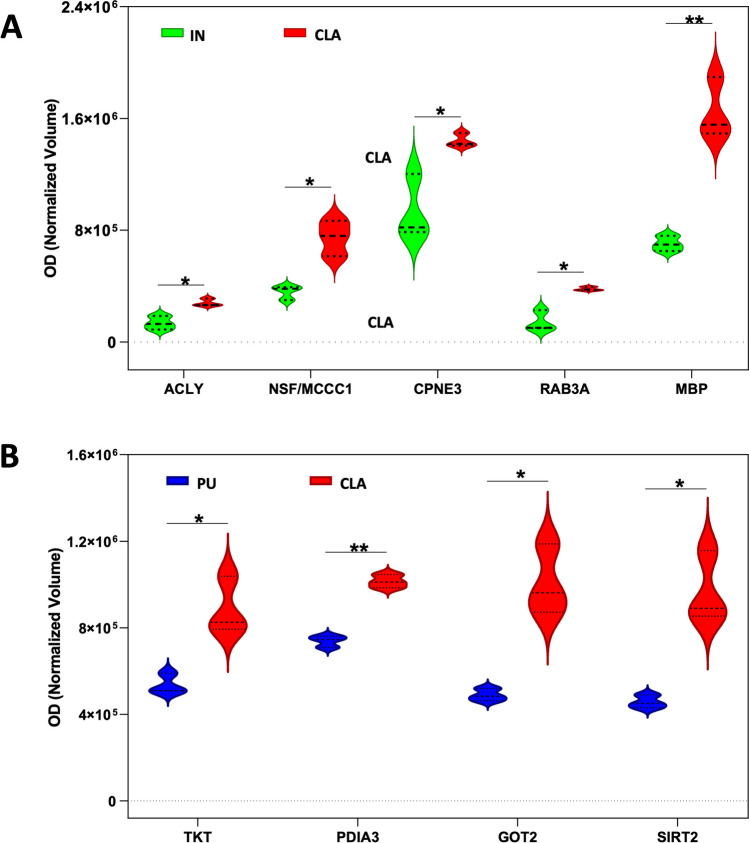
On the contrary, in CLA vs PU comparison, an increase of expression was observed for whole differentially expressed proteins except RAB3A, which showed a higher expression level in PU compared to CLA and IN (Fig. 5B).
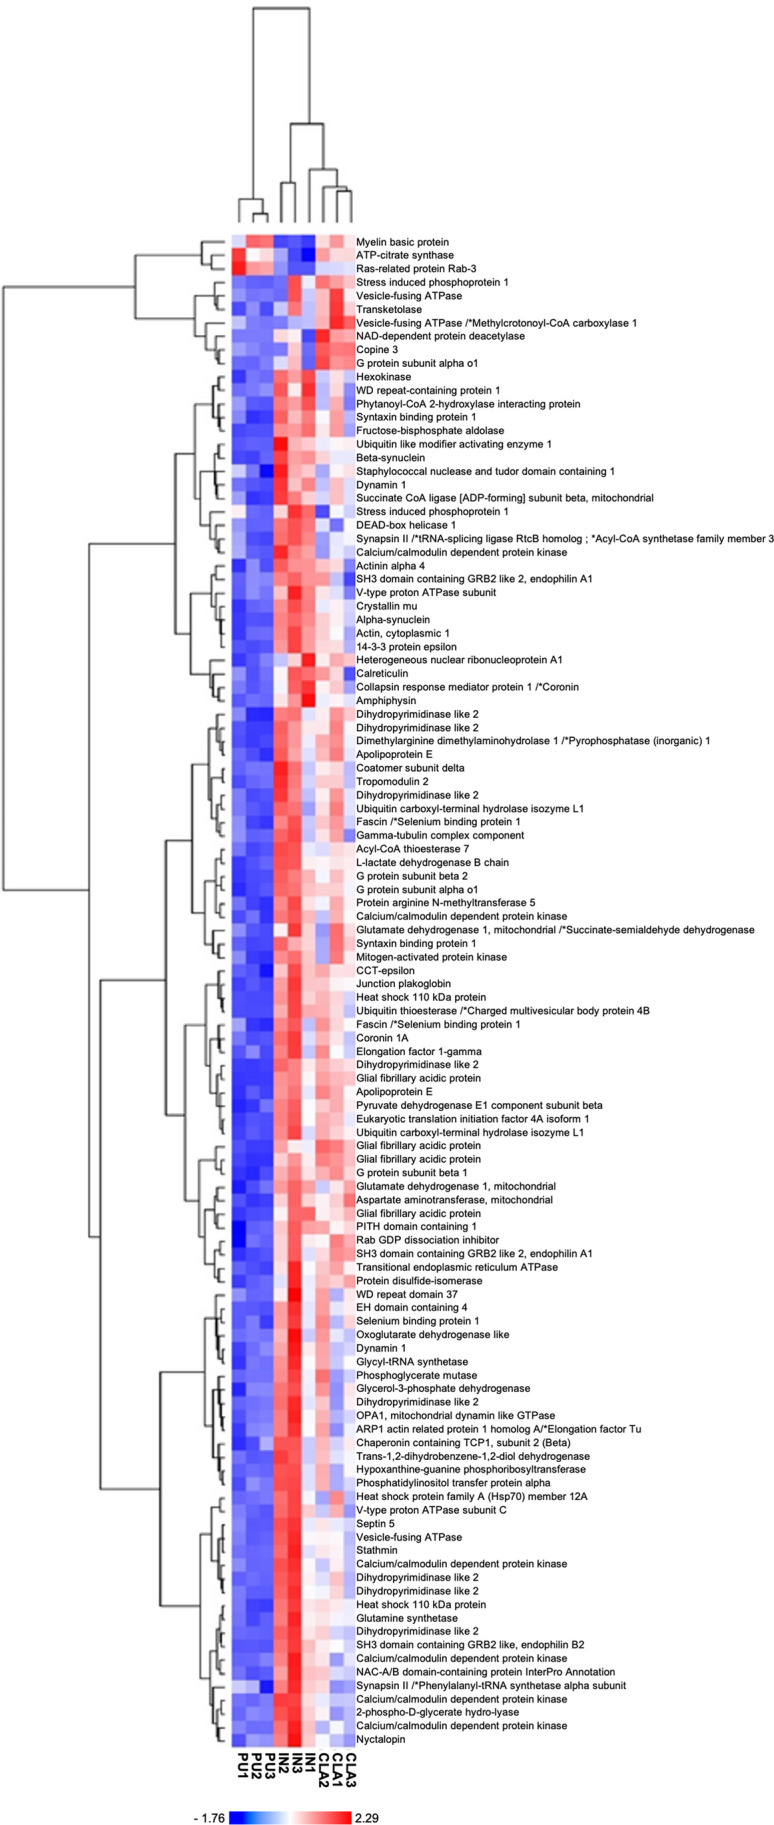
An exclusive expression difference was observed for sirtuin 2 (SIRT2), protein disulfide-isomerase (PDIA3), transketolase (TKT), and aspartate aminotransferase, mitochondrial (GOT2) in CLA vs PU but not in IN vs PU (Fig. 5B). Normalized mean values of optical density of identified differentially expressed spots were analyzed using next-generation clustered heat map to generate a clustered heat map (Fig. 6) where we can appreciate the highest consistence of protein expression increases as red color in IN followed by CLA and then PU.
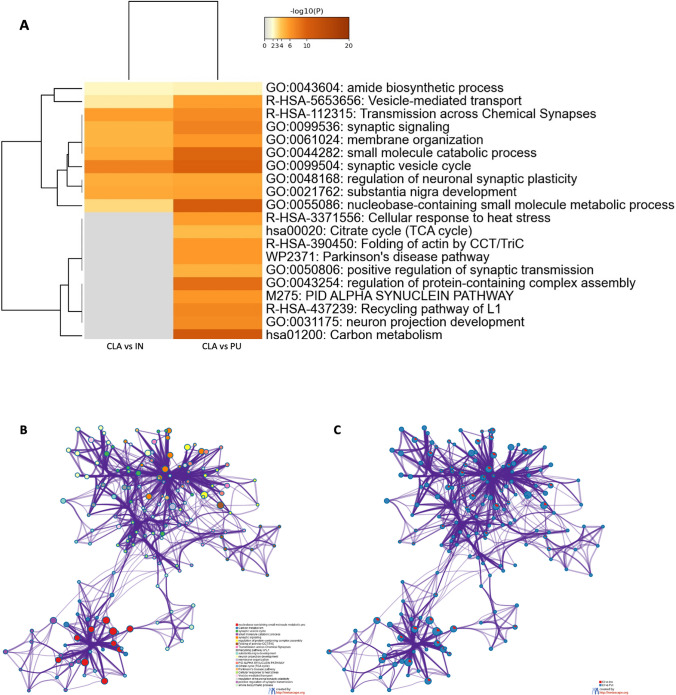
The biological meaning of the differentially quantified proteins in two different comparisons (CLA vs PU and CLA vs IN) was investigated by a general overview using Metascape [ref. 36] which depicts top enriched clusters and their enrichment patterns across multiple gene lists as a clustered heat map (Fig. 7A). The heat map is complemented by an enrichment network (Fig. 7B) where each network node represents a category of biological processes and/or pathways. In Fig. 7C, each network node is represented by a pie chart, where the sector size is proportional to the number of genes originated from each gene list. Some categories such as PD pathway (WP2371) and α-synuclein pathway (M275) were enriched exclusively in CLA vs PU comparison and likely represent processes associated with proteins differentially expressed between these areas. The network also shows that processes such as synaptic vesicle cycle, regulation of neuronal synaptic plasticity, and substantia nigra development were shared between both lists.
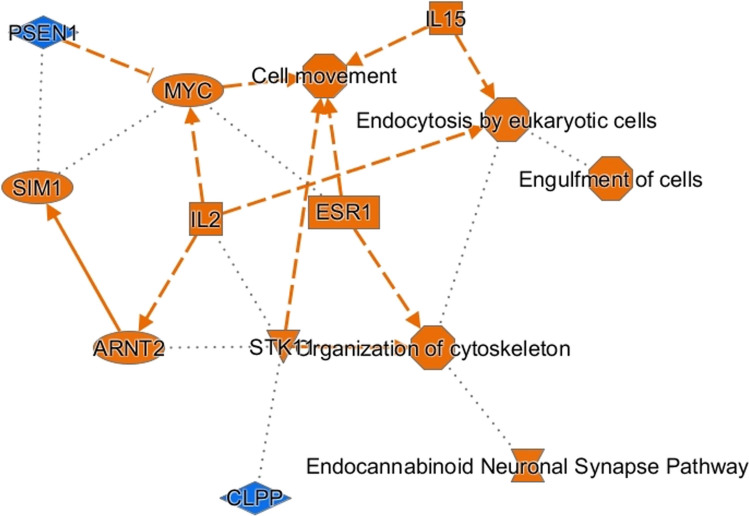
Proteins found differentially expressed in each different comparison were analyzed by IPA to discover the most enriched canonical pathways, possible upstream regulators, and downstream effects. Similarities between IN and CLA were evidenced by IPA results derived by comparing IN and CLA data with those of PU. In fact, the same most significant canonical pathways such as Parkinson’s signaling, synaptogenesis signaling, and insulin secretion signaling were generated. Figure 8 shows a coherent and comprehensible synopsis of IPA core analysis of CLA vs PU protein data set, so to obtain a quick overview of major biological themes and their relationships, the graphical summary includes a subset of the most significant canonical pathways, upstream regulators, diseases, and biological functions predicted by the analysis. Among the most significant regulators, inhibition of PSEN1 upstream regulator deserves to be underlined while activation of endocannabinoid neuronal synapse pathway is also worthy of attention.
Western Blot Analysis
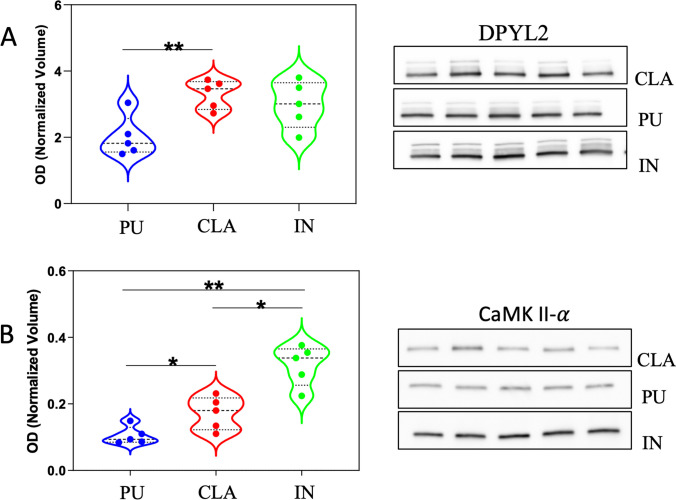
The difference of protein expression observed by 2-DE among three different brain areas was validated in other 5 additional samples by western blot analysis. The expression level of two more representative proteins, CAMK2 and DPYL2/CRMP-2, was detected using specific antibodies. A single immunoreactive band at 48 kDa was detected for CAMK2 whereas a main band at molecular weight of 65 kDa and two minor bands at 70 kDa and 75 kDa were detected for DPYL2 in agreement with different isoforms of this protein in Sus scrofa. Probably, the isoform with the highest apparent molecular weight represents the neuronal isoform with a ubiquitous localization in dendrites, axons, and cellular bodies [ref. 40]. Immunoreactive bands were analyzed, and normalized values of OD were represented in violin plots (Fig. 9A, B). The violin plot of DPYL2 shows the sum of all three immunoreactive band ODs. The expression differences observed by western blot analysis confirmed the results obtained by 2-DE according to which CLA expressed half levels of both proteins compared to IN (the highest level) and PU.
Immunofluorescence
Immunofluorescent staining in pig CLA, PU, and IN revealed the presence of both CaMKII-α and DPYL2/CRMP-2 (Fig. 10). In the IN, CaMKII-α was mainly localized in neuron somas while DPYL2 labeling was mostly associated with neuropil surrounding negative cell bodies. A similar immunostaining pattern was observed in CLA where few DPYL2-positive somas were also found.
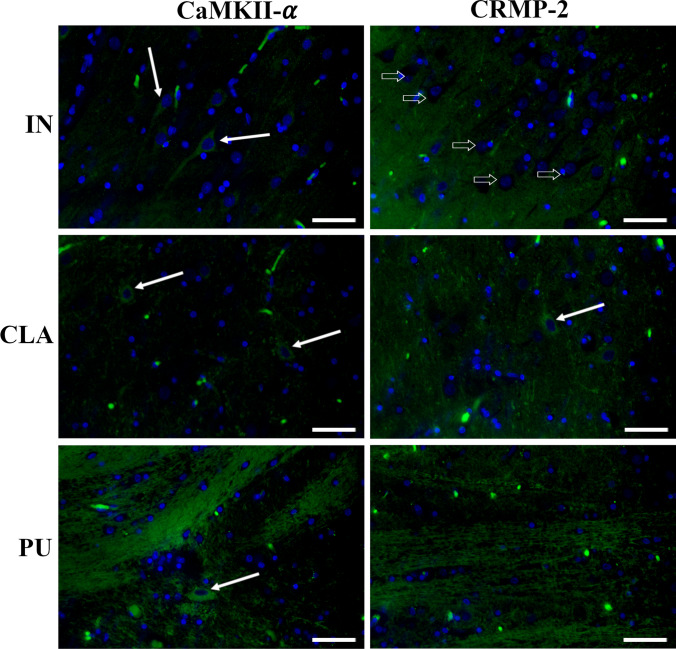
On the contrary, in PU, positivity to both CaMKII-α and DPYL2/CRMP-2 was localized in fibers while rare immunolabeled cell bodies were only seen for CaMKII-α.
Discussion
Over the past decades, because of its considerable resemblance to human anatomy and physiology, pig brain has been widely employed as a valuable model in biomedical studies [ref. 28]. Recently, the generation of genetically modified pig models of neurodegenerative disorders has been discussed [ref. 41]. In the present study, we carried out a comparative proteomic analysis of pig CLA, IN, and PU to reveal specific molecular hallmarks of CLA to clarify its role, origin, and possible implication in human neurological disorders.
Although the three areas showed superimposable 2-DE protein maps, a considerable divergence in protein expression level was observed between CLA and IN when compared to PU; in this context, the circos plot showed that CLA assumed an intermediate position with respect to both IN and PU.
The ontology of the claustro-insular complex is still subject to debate [ref. 15, ref. 42], and homologies reaching birds and even reptiles have been put forward [ref. 43, ref. 44]. According to Bruguier et al. [ref. 18], the claustral neuronal population is born first starting from the lateral pallium, then insular cells migrate radially through the CLA, occupying progressively more superficial positions; thus, IN development is linked to CLA. In line with this hypothesis, the minor differences of protein expression observed between CLA and IN seem to support their common origin in agreement with described morphogenetic and neurochemical similarities of these structures [ref. 15, ref. 16].
In general, we found PU to show a lower level of differentially expressed proteins except for Rab3A that showed a very significant high level of expression. Traditionally, PU is involved in different functions such as learning and motor control, reward, cognitive functioning, and addiction [ref. 45–ref. 49]; moreover, it appears to be correlated with a broad spectrum of movement disorders including PD, and Huntington’s disease (HD) as well as psychiatric diseases such as schizophrenia or obsessive–compulsive disorder (OCD) [ref. 50–ref. 55]. Rab proteins are small GTPases involved in all stages of vesicular transport and membrane fusion in mammalian cells, and Rab3 isoforms (Rab3A, Rab3B, Rab3C, and Rab3D) are expressed almost exclusively in neurons and secretory cells and are mainly located at synaptic membranes regulating Ca2+-dependent neurotransmitter release [ref. 56]. Rab3A has been indicated as one of physiological substrates of leucine-rich repeat kinase 2 (LRRK2) whose increased activity is related to PD pathogenesis [ref. 57]. In light of the functions ascribed to Rab3A, the high expression of Rab3A in pig PU adds molecular evidence in support of the potential role of this brain area in PD pathogenesis as prompted by different approaches such as shape analysis [ref. 58], and it is worth noting that Rab3A expression was also elevated in CLA with a value significantly higher than in IN, suggesting a possible common role of PU and CLA in neurological disorders.
Exclusive expression differences were observed for SIRT2, PDIA3, TKT, and GOT2 in CLA vs PU. SIRT2 belongs to mammalian sirtuin family that consists of seven members (SIRT1–SIRT7) with diverse functions depending upon substrates, distinct subcellular localization, and expression patterns [ref. 59]. SIRT2 is localized in the cytoplasm of both neurons and oligodendrocytes [ref. 60], and the well-known substrate of SIRT2 is α-tubulin, an important component of microtubule cytoskeleton whose acetylation by SIRT2 is linked to brain aging and neurological disorders [ref. 61] such as AD [ref. 62, ref. 63] and PD [ref. 64, ref. 65]. Similarly, PDIA3 is indicated as potentially involved in neurodegeneration processes. The protein disulfide-isomerases (PDIs) are generally localized to the endoplasmic reticulum (ER) where they mediate thiol–disulfide interchanges, which is a critical process during post-translational protein folding [ref. 66], and PDIA3 is markedly upregulated in most common neurodegenerative diseases, highlighting ER as an emerging driver of neurodegeneration [ref. 67, ref. 68]. Also, TKT, a multifunctional protein in the non-oxidative branch of the pentose phosphate pathway, seems to be related to some neurological disorders such as AD, PD, and Wernicke-Korsakoff syndrome, and reduced levels of TKT have been found in the substantia nigra of PD patients [ref. 69].
CLA neurodegeneration and dysfunction are described in patients affected by AD or PD [ref. 70, ref. 71]. Aggregation of misfolded proteins is a determinant in many neurodegenerative diseases such as frontotemporal dementia (FTD), amyotrophic lateral sclerosis (ALS), PD, AD, and HD [ref. 72], and amyloid β (Aβ) deposits and neurofibrillary tangles have been described in the CLA of AD patients [ref. 73, ref. 74]. In addition, α-synuclein and Aβ lesions have been also found in the CLA of cases affected by PD or dementia with Lewy bodies (DLB) [ref. 75] while claustral degeneration has been reported in familial Alzheimer’s disease [ref. 71]. In the present study, Metascape analysis of CLA vs PU suggested the activation of α-synuclein and PD pathways, corroborating the implication of these structures in the abovementioned diseases. Two other interesting pathways evidenced by Metascape analysis were the neuron projection development pathway and L1 recycling pathway; the first is involved in axonal growth while the second plays a role in clathrin-coated vesicle trafficking. The endocytic recycling pathway seems to be implicated in the aggregation, toxicity, and secretion of α-synuclein, whose misfolding is common in several neurodegenerative diseases [ref. 76]. Among CLA differentially expressed proteins involved in these pathways (Supplementary Table 1), we also found DPYSL2 and CAMK2, and the expression of both proteins was validated by western blot analysis while immunofluorescence revealed their distribution and cellular localization in the three cerebral structures. CAMK2 plays a key role in the redistribution of α-synuclein during neurotransmitter release [ref. 77] and can interact and potentially alter α-synuclein conformation [ref. 78] whereas DPYSL2 has a function in neuronal development and polarity, in cell migration and endocytosis, and is implicated in neurological disorders like CAMK2 [ref. 79].
Another interesting protein overexpressed in CLA compared to PU is aspartate aminotransferase 2 (GOT2), a pyridoxal 5′-phosphate (PLP)-dependent enzyme that exists as cytosolic (GOT1) and intramitochondrial (GOT2). GOT2 deficiency is a mitochondriopathy that is reported to be implicated in treatable metabolic epilepsies [ref. 80]. In both humans and rodents, CLA seems to be a potential locus for generating epileptiform activity during kindling [ref. 81], and GOT2 overexpression found in pig CLA strengthens the assumption that depicts this structure as involved in seizure generation.
Our findings revealed that copine 3 (CPNE3) and MBP were overexpressed in CLA compared to IN. Copines are calcium-dependent phospholipid-binding proteins involved in membrane-trafficking phenomena and protein–protein interactions [ref. 82]. A recent study reported that CPNE3 interacts with anxiety to affect working memory (WM) [ref. 83]. WM is a cognitive ability that allows one to hold and manipulate information and is foundational to the organization of goal-directed behavior [ref. 84]. Goll et al. [ref. 2] have proposed that CLA has the capacity to focus attention, an essential function for goal-direct behavior; besides, White et al. [ref. 3] have provided data describing CLA as an anatomical and functional substrate that may underlie functions, such as executive attention or WM. Thus, such reported findings support our data regarding CPNE3 and, taken together, may indicate the CLA as a possible site of mutual influences between anxiety and working memory.
In psychiatric disorders such as schizophrenia and attention deficit hyperactivity disorder, WM impairment is reported [ref. 83], and in this context, our data showing an overexpression of MBP in CLA are quite interesting. MBP is important in maintaining the structure of the myelin sheath [ref. 85]. Myelin dysfunction produces abnormal connectivity of neural networks and is considered one of the main factors implicated in schizophrenia pathogenesis [ref. 86, ref. 87]. Different studies have shown structural differences in the CLA of schizophrenic patients experiencing delusions [ref. 88, ref. 89].
Last but not the least, protein data set analysis of CLA vs PU comparison by IPA produced an intriguing result highlighting the activation of endocannabinoid neuronal synapse pathway. The endocannabinoid system (ECS) is a widespread neuromodulator network involved in central nervous system development and plays a major role in tuning many cognitive and physiological processes [ref. 90]. The activation of endocannabinoid neuronal synapse pathway revealed by IPA analysis supports previous immunohistochemical studies demonstrating the presence of cannabinoid receptor 1 (CB1) and two endogenous cannabinoid-degrading enzymes (MGL and FAAH) in pig and dog CLA [ref. 91, ref. 92]. Taken together, the whole findings provide a neuroanatomical support for a possible neuromodulator role of endocannabinoids within CLA circuitry and may reinforce the postulate depicting CLA and ECS as involved in neurodegenerative diseases [ref. 70, 93].
Conclusion
In conclusion, the comparative study of the proteomic profile of pig CLA highlighted the overexpression of specific proteins deeply implicated in both neurodegenerative (e.g., PD, AD, and HD) and psychiatric disorders in humans, pointing out the translational significance of the investigation. In this context, the present findings may contribute to better understand the molecular involvement of CLA in the pathogenetic mechanisms of these diseases. Furthermore, the minor differences of protein expression observed between CLA and IN strengthen the hypothesis of their common origin.
Supplementary Materials
References
- G Atlan, A Terem, N Peretz-Rivlin. The claustrum supports resilience to distraction. Curr Biol, 2018. [DOI | PubMed]
- Y Goll, G Atlan, A Citri. Attention: the claustrum. Trends Neurosci, 2015. [DOI | PubMed]
- MG White, M Panicker, C Mu, AM Carter, BM Roberts, PA Dharmasri, BN Mathur. Anterior cingulate cortex input to the claustrum is required for top-down action control. Cell Rep, 2018. [DOI | PubMed]
- J Liu, R Wu, B Johnson, J Vu, C Bass, JX Li. The claustrum-prefrontal cortex pathway regulates impulsive-like behavior. J Neurosci, 2019. [DOI | PubMed]
- K Narikiyo, R Mizuguchi, A Ajima, M Shiozaki, H Hamanaka, JP Johansen, K Mori, Y Yoshihara. The claustrum coordinates cortical slow-wave activity. Nat Neurosci, 2020. [DOI | PubMed]
- H Norimoto, LA Fenk, HH Li. A claustrum in reptiles and its role in slow-wave sleep. Nature, 2020. [DOI | PubMed]
- L Renouard, F Billwiller, K Ogawa. The supramammillary nucleus and the claustrum activate the cortex during REM sleep. Sci Adv, 2015. [DOI | PubMed]
- FC Crick, C Koch. What is the function of the claustrum?. Philos Trans R Soc London Ser B, 2005. [DOI | PubMed]
- JB Smith, AK Lee, J Jackson. The claustrum. Curr Biol, 2020. [DOI | PubMed]
- DH Reser, P Majka, S Snell, JM Chan, K Watkins, K Worthy, MD Quiroga, MG Rosa. Topography of claustrum and insula projections to medial prefrontal and anterior cingulate cortices of the common marmoset (Callithrix jacchus). J Comp Neuro, 2017. [DOI]
- MG White, BN Mathur. Claustrum circuit components for top-down input processing and cortical broadcast. Brain Struct Funct, 2018. [DOI | PubMed]
- SR Krimmel, MG White, MH Panicker, FS Barrett, BN Mathur, DA Seminowicz. Resting state functional connectivity and cognitive task-related activation of the human claustrum. Neuroimage, 2019. [DOI | PubMed]
- J Jackson, JB Smith, AK Lee. The anatomy and physiology of claustrum-cortex interactions. Annu Rev Neurosci, 2020. [DOI | PubMed]
- VN Nikolenko, NA Rizaeva, NM Beeraka, MV Oganesyan, VA Kudryashova, AA Dubovets, ID Borminskaya, KV Bulygin, MY Sinelnikov, G Aliev. The mystery of claustral neural circuits and recent updates on its role in neurodegenerative pathology. Behav Brain Funct, 2021. [DOI | PubMed]
- A Pirone, B Cozzi, L Edelstein, A Peruffo, C Lenzi, F Quilici, R Antonini, M Castagna. Topography of Gng2- and NetrinG2-expression suggests an insular origin of the human claustrum. PLoS One, 2012. [DOI | PubMed]
- L Puelles. Development and evolution of the claustrum. The claustrum: structural, functional, and clinical neuroscience, 2014
- LR Edelstein, FJ Denaro. The claustrum: a historical review of its anatomy, physiology, cytochemistry and functional significance. Cell Mol Biol (Noisy-le-grand), 2004. [PubMed]
- H Bruguier, R Suarez, P Manger. In search of common developmental and evolutionary origin of the claustrum and subplate. J Comp Neurol, 2020. [DOI | PubMed]
- C Ibrahim, B Le Foll, L French. Transcriptomic characterization of the human insular cortex and claustrum. Front Neuroanat, 2019. [DOI | PubMed]
- A Pirone, JM Graïc, E Grisan, B Cozzi. The claustrum of the sheep and its connections to the visual cortex. J Anat, 2021. [DOI | PubMed]
- A Pirone, V Miragliotta, B Cozzi, A Granato. The claustrum of the pig: an immunohistochemical and a quantitative Golgi study. Anat Rec (Hoboken), 2019. [DOI | PubMed]
- A Pirone, V Miragliotta, F Ciregia, E Giannessi, B Cozzi. The catecholaminergic innervation of the claustrum of the pig. J Anat, 2018. [DOI | PubMed]
- A Terem, BJ Gonzales, N Peretz-Rivlin, R Ashwal-Fluss, N Bleistein, MDM Reus-Garcia, D Mukherjee, M Groysman, A Citri. Claustral neurons projecting to frontal cortex mediate contextual association of reward. Curr Biol, 2020. [DOI | PubMed]
- BN Mathur, RM Caprioli, AY Deutch. Proteomic analysis illuminates a novel structural definition of the claustrum and insula. Cereb Cortex, 2009. [DOI | PubMed]
- SR Erwin, BN Bristow, KE Sullivan, RM Kendrick, B Marriott, L Wang, J Clements, AL Lemire, J Jackson, MS Cembrowski. Spatially patterned excitatory neuron subtypes and projections of the claustrum. Elife, 2021. [DOI | PubMed]
- BN Mathur. The claustrum in review. Front Syst Neurosci, 2014. [DOI | PubMed]
- J Jelsing, A Hay-Schmidt, T Dyrby, R Hemmingsen, HB Uylings, B Pakkenberg. The prefrontal cortex in the Göttingen minipig brain defined by neural projection criteria and cytoarchitecture. Brain Res Bull, 2006. [DOI | PubMed]
- NM Lind, A Moustgaard, J Jelsing, G Vajta, P Cumming, AK Hansen. The use of pigs in neuroscience: modeling brain disorders. Neurosci Biobehav Rev, 2007. [DOI | PubMed]
- JI Johnson, BA Fenske, AS Jaswa, JA Morris. Exploitation of puddles for breakthroughs in CL research. Front Syst Neurosci, 2014. [DOI | PubMed]
- F Ciregia, L Giusti, Y Da Valle. A multidisciplinary approach to study a couple of monozygotic twins discordant for the chronic fatigue syndrome: a focus on potential salivary biomarkers. J Transl Med, 2013. [DOI | PubMed]
- S Lacerenza, F Ciregia, L Giusti. Putative biomarkers for malignant pleural mesothelioma suggested by proteomic analysis of cell secretome. Cancer Genom Proteomics, 2020. [DOI]
- L Giusti, C Angeloni, MC Barbalace. A proteomic approach to uncover neuroprotective mechanisms of oleocanthal against oxidative stress. Int J Mol Sci, 2018. [DOI | PubMed]
- F Ciregia, L Giusti, M Ronci, M Bugliani, I Piga, L Pieroni, C Rossi, P Marchetti, A Urbani, A Lucacchini. Glucagon-like peptide 1 protects INS-1E mitochondria against palmitate-mediated beta-cell dysfunction: a proteomic study. Mol Biosyst, 2015. [DOI | PubMed]
- F Ciregia, M Bugliani, M Ronci. Palmitate-induced lipotoxicity alters acetylation of multiple proteins in clonal β cells and human pancreatic islets. Sci Rep, 2017. [DOI | PubMed]
- B Félix, ME Léger, D Albe-Fessard, JC Marcilloux, O Rampin, JP Laplace. Stereotaxic atlas of the pig brain. Brain Res Bull, 1999. [DOI | PubMed]
- Y Zhou, B Zhou, L Pache, M Chang, AH Khodabakhshi, O Tanaseichuk, C Benner, SK Chanda. Metascape provides a biologist-oriented resource for the analysis of systems-level datasets. Nat Commun, 2019. [DOI | PubMed]
- JH Zar. Biostatistical analysis, 1999
- Y Hochberg, Y Benjamini. More powerful procedures for multiple significance testing. Stat Med, 1990. [DOI | PubMed]
- 39.Ryan MC, Stucky M, Wakefield C, Melott JM, Akbani R, Weinstein JN, Broom BM (2019) Interactive clustered heat map builder: an easy web-based tool for creating sophisticated clustered heat maps.. F1000Res, 8:ISCB doi: 10.12688/f1000research.20590.2
- M Noura, K Morita, H Kiyose, H Matsuo, Y Nishinaka-Arai, M Kurokawa, Y Kamikubo, S Adachi. Pivotal role of DPYSL2A in KLF4-mediated monocytic differentiation of acute myeloid leukemia cells. Sci Rep, 2020. [DOI | PubMed]
- IE Holm, AK Alstrup, Y Luo. Genetically modified pig models for neurodegenerative disorders. J Pathol, 2016. [DOI | PubMed]
- AB Butler, A Reiner, HJ Karten. Evolution of the amniote pallium and the origins of mammalian neocortex. Ann N Y Acad Sci, 2011. [DOI | PubMed]
- L Puelles, A Ayad, JE Sandoval, A Alonso, L Medina, JL Ferran. Selective early expression of the orphan nuclear receptor Nr4a2 identifies the claustrum homolog in the avian mesopallium: impact on sauropsidian/mammalian pallium comparisons. J Comp Neurol, 2016. [DOI | PubMed]
- C Watson, L Puelles. Developmental gene expression in the mouse clarifies the organization of the claustrum and related endopiriform nuclei. J Comp Neurol, 2017. [DOI | PubMed]
- AM Graybiel, T Aosaki, AW Flaherty, M Kimura. The basal ganglia and adaptive motor control. Science, 1994. [DOI | PubMed]
- O Hikosaka, Y Takikawa, R Kawagoe. Role of the basal ganglia in the control of purposive saccadic eye movements. Physiol Rev, 2000. [DOI | PubMed]
- SM Nicola. The nucleus accumbens as part of a basal ganglia action selection circuit. Psychopharmacology (Berl.), 2007. [DOI | PubMed]
- MG Packard, BJ Knowlton. Learning and memory functions of the basal ganglia. Annu Rev Neurosci, 2002. [DOI | PubMed]
- HH Yin, BJ Knowlton. The role of the basal ganglia in habit formation. Nat Rev Neurosci, 2006. [DOI | PubMed]
- RL Albin, AB Young, JB Penney. The functional anatomy of basal ganglia disorders. Trends Neurosci, 1989. [DOI | PubMed]
- MR DeLong. Primate models of movement disorders of basal ganglia origin. Trends Neurosci, 1990. [DOI | PubMed]
- MR DeLong, T Wichmann. Circuits and circuit disorders of the basal ganglia. Arch Neurol, 2007. [DOI | PubMed]
- AM Graybiel, SL Rauch. Toward a neurobiology of obsessive-compulsive disorder. Neuron, 2000. [DOI | PubMed]
- AM Graybiel. The basal ganglia. Curr Biol, 2000. [DOI | PubMed]
- B Aouizerate, D Guehl, E Cuny, A Rougier, B Bioulac, J Tignol, P Burbaud. Pathophysiology of obsessive-compulsive disorder: a necessary link between phenomenology, neuropsychology, imagery and physiology. Prog Neurobiol, 2004. [DOI | PubMed]
- M Tanaka, J Miyoshi, H Ishizaki. Role of Rab3 GDP/GTP exchange protein in synaptic vesicle trafficking at the mouse neuromuscular junction. Mol Biol Cell, 2001. [DOI | PubMed]
- W Seol, D Nam, I Son. Rab GTPases as physiological substrates of LRRK2 kinase. Exp Neurobiol, 2019. [DOI | PubMed]
- D Sigirli, ST Ozdemir, S Erer, I Sahin, I Ercan, R Ozpar, MO Orun, B Hakyemez. Statistical shape analysis of putamen in early-onset Parkinson’s disease. Clin Neurol Neurosurg, 2021. [DOI | PubMed]
- MC Haigis, DA Sinclair. Mammalian sirtuins: biological insights and disease relevance. Annu Rev Pathol, 2010. [DOI | PubMed]
- K Harting, B Knöll. SIRT2-mediated protein deacetylation: an emerging key regulator in brain physiology and pathology. Eur J Cell Biol, 2010. [DOI | PubMed]
- W Li, B Zhang, J Tang, Q Cao, Y Wu, C Wu, J Guo, EA Ling, F Liang. Sirtuin2, a mammalian homolog of yeast silent information regulator-2 longevity regulator, is an oligodendroglial protein that decelerates cell differentiation through deacetylating alpha-tubulin. J Neurosci, 2007. [DOI | PubMed]
- R Cacabelos, JC Carril, N Cacabelos. Sirtuins in Alzheimer’s disease: SIRT2-related genophenotypes and implications for pharmacoepigenetics. Int J Mol Sci, 2019. [DOI | PubMed]
- Y Shen, L Chen, S Zhang, L Xie. Correlation between SIRT2 3’UTR gene polymorphism and the susceptibility to Alzheimer’s disease. J Mol Neurosci, 2020. [DOI | PubMed]
- Y Wang, Y Cai, H Huang, X Chen. miR-486-3p influences the neurotoxicity of a-synuclein by targeting the SIRT2 gene and the polymorphisms at target sites contributing to Parkinson’s disease. Cell Physiol Biochem, 2018. [DOI | PubMed]
- X Chen, H Mai, X Chen. Rs2015 polymorphism in miRNA target site of sirtuin2 gene is associated with the risk of Parkinson’s disease in Chinese Han population. Biomed Res Int, 2019. [PubMed]
- JJ Galligan, DR Petersen. The human protein disulfide isomerase gene family. Human Genomics, 2012. [DOI | PubMed]
- V Castillo, M Oñate, U Woehlbier. Functional role of the disulfide isomerase ERp57 in axonal regeneration. PLoS One, 2015. [DOI | PubMed]
- YH Shin, H Cho, BY Choi, J Kim, J Ha, SW Suh, SB Park. Phenotypic discovery of neuroprotective agents by regulation of tau proteostasis via stress-responsive activation of PERK signaling. Angew Chem Int Ed Engl, 2021. [DOI | PubMed]
- H Kim, H Kang, Y Lee, CH Park, A Jo, R Khang, JH Shin. Identification of transketolase as a target of PARIS in substantia nigra. Biochem Biophys Res Commun, 2017. [DOI | PubMed]
- JR Smythies, LR Edelstein, VS Ramachandran. The claustrum: structural, functional, and clinical neuroscience, 2014
- L Gustafson, A Brun, E Englund, O Hagnell, K Nilsson, M Stensmyr, AK Ohlin, M Abrahamson. A 50-year perspective of a family with chromosome-14-linked Alzheimer’s disease. Hum Genet, 1998. [DOI | PubMed]
- A Hettinghouse, R Liu, CJ Liu. Multifunctional molecule ERp57: from cancer to neurodegenerative diseases. Pharmacol Ther, 2018. [DOI | PubMed]
- K Ogomori, T Kitamoto, J Tateishi, Y Sato, M Suetsugu, M Abe. Beta-protein amyloid is widely distributed in the central nervous system of patients with Alzheimer’s disease. Am J Pathol, 1989. [PubMed]
- A Serrano-Pozo, MP Frosch, E Masliah, BT Hyman. Neuropathological alterations in Alzheimer disease. Cold Spring Harb Perspect Med, 2011. [DOI | PubMed]
- ME Kalaitzakis, RK Pearce, SM Gentleman. Clinical correlates of pathology in the claustrum in Parkinson’s disease and dementia with Lewy bodies. Neurosci Lett, 2009. [DOI | PubMed]
- SA Gonçalves, D Macedo, H Raquel, PD Simões, F Giorgini, JS Ramalho, DC Barral, L Ferreira Moita, TF Outeiro. shRNA-based screen identifies endocytic recycling pathway components that act as genetic modifiers of alpha-synuclein aggregation, secretion and toxicity. PLoS Genet, 2016. [DOI | PubMed]
- S Liu, M Fa, I Ninan, F Trinchese, W Dauer, O Arancio. Alpha-synuclein involvement in hippocampal synaptic plasticity: role of NO, cGMP, cGK and CaMKII. Eur J Neurosci, 2007. [DOI | PubMed]
- J Martinez, I Moeller, H Erdjument-Bromage, P Tempst, B Lauring. Parkinson’s disease-associated alpha-synuclein is a calmodulin substrate. J Biol Chem, 2003. [DOI | PubMed]
- X Wang, C Dong, L Sun, L Zhu, C Sun, R Ma, K Ning, B Lu, J Zhang, J Xu. Quantitative proteomic analysis of age-related subventricular zone proteins associated with neurodegenerative disease. Sci Rep, 2016. [DOI | PubMed]
- CDM van Karnebeek, RJ Ramos, XY Wen. Bi-allelic GOT2 mutations cause a treatable malate-aspartate shuttle-related encephalopathy. Am J Hum Genet, 2019. [DOI | PubMed]
- X Zhang, DK Hannesson, DM Saucier, AE Wallace, J Howland, ME Corcoran. Susceptibility to kindling and neuronal connections of the anterior claustrum. J Neurosci, 2001. [DOI | PubMed]
- JL Tomsig, CE Creutz. Copines: a ubiquitous family of Ca(2+)-dependent phospholipid-binding proteins. Cell Mol Life Sci, 2002. [DOI | PubMed]
- C Chen, Z Wang, C Chen, G Xue, S Lu, H Liu, Q Dong, M Zhang. CPNE3 moderates the association between anxiety and working memory. Sci Rep, 2021. [DOI | PubMed]
- EK Miller, M Lundqvist, AM Bastos. Working memory 2.0. Neuron, 2018. [DOI | PubMed]
- AT Campagnoni, RP Skoff. The pathobiology of myelin mutants reveals novel biological functions of the MBP and PLP genes. Brain Pathol, 2001. [DOI | PubMed]
- R Zhang, J He, S Zhu. Myelination deficit in a phencyclidine-induced neurodevelopmental model of schizophrenia. Brain Res, 2012. [DOI | PubMed]
- J He, Q Zu, C Wen, Q Liu, P You, X Li, W Wang. Quetiapine attenuates schizophrenia-like behaviors and demyelination in a MK-801-induced mouse model of schizophrenia. Front Psychiatry, 2020. [DOI | PubMed]
- NG Cascella, A Sawa. The claustrum in schizophrenia. The claustrum, 2014
- MC Patru, DH Reser. A new perspective on delusional states – evidence for claustrum involvement. Front Psychiatry, 2015. [DOI | PubMed]
- HC Lu, K Mackie. Review of the endocannabinoid system. Biol Psychiatry Cogn Neurosci Neuroimaging, 2021. [PubMed]
- A Pirone, C Cantile, V Miragliotta, C Lenzi, E Giannessi, B Cozzi. Immunohistochemical distribution of the cannabinoid receptor 1 and fatty acid amide hydrolase in the dog claustrum. J Chem Neuroanat, 2016. [DOI | PubMed]
- A Pirone, G Lazzarini, C Lenzi, E Giannessi, V Miragliotta. Immunolocalization of cannabinoid receptor 1 (CB1), monoglyceride lipase (MGL) and fatty-acid amide hydrolase 1 (FAAH) in the pig claustrum. J Chem Neuroanat, 2020. [DOI | PubMed]
- V Di Marzo, N Stella, A Zimmer. Endocannabinoid signalling and the deteriorating brain. Nat Rev Neurosci, 2015. [DOI | PubMed]