DJExpress: An Integrated Application for Differential Splicing Analysis and Visualization
Abstract
RNA-seq analysis of alternative pre-mRNA splicing has facilitated an unprecedented understanding of transcriptome complexity in health and disease. However, despite the availability of countless bioinformatic pipelines for transcriptome-wide splicing analysis, the use of these tools is often limited to expert bioinformaticians. The need for high computational power, combined with computational outputs that are complicated to visualize and interpret present obstacles to the broader research community. Here we introduce DJExpress, an R package for differential expression analysis of transcriptomic features and expression-trait associations. To determine gene-level differential junction usage as well as associations between junction expression and molecular/clinical features, DJExpress uses raw splice junction counts as input data. Importantly, DJExpress runs on an average laptop computer and provides a set of interactive and intuitive visualization formats. In contrast to most existing pipelines, DJExpress can handle both annotated and de novo identified splice junctions, thereby allowing the quantification of novel splice events. Moreover, DJExpress offers a web-compatible graphical interface allowing the analysis of user-provided data as well as the visualization of splice events within our custom database of differential junction expression in cancer (DJEC DB). DJEC DB includes not only healthy and tumor tissue junction expression data from TCGA and GTEx repositories but also cancer cell line data from the DepMap project. The integration of DepMap functional genomics data sets allows association of junction expression with molecular features such as gene dependencies and drug response profiles. This facilitates identification of cancer cell models for specific splicing alterations that can then be used for functional characterization in the lab. Thus, DJExpress represents a powerful and user-friendly tool for exploration of alternative splicing alterations in RNA-seq data, including multi-level data integration of alternative splicing signatures in healthy tissue, tumors and cancer cell lines.
Article type: Research Article
Keywords: alternative splicing, splicing aberrations, differential splicing analysis, cancer splicing, The Cancer Genome Atlas Program (TCGA), GTEx database
License: Copyright © 2022 Gallego-Paez and Mauer. CC BY 4.0 This is an open-access article distributed under the terms of the Creative Commons Attribution License (CC BY). The use, distribution or reproduction in other forums is permitted, provided the original author(s) and the copyright owner(s) are credited and that the original publication in this journal is cited, in accordance with accepted academic practice. No use, distribution or reproduction is permitted which does not comply with these terms.
Article links: DOI: 10.3389/fbinf.2022.786898 | PubMed: 36304260 | PMC: PMC9580925
Relevance: Moderate: mentioned 3+ times in text
Full text: PDF (3.9 MB)
Introduction
Splicing of pre-mRNA is a crucial process in eukaryotic gene expression regulation. In addition to canonical splicing, which leads to the inclusion of constitutive exons into the mature mRNA, the transcriptome is subjected to alternative splicing. Alternative splicing can give rise to multiple protein-coding isoforms from a single pre-mRNA and thus represents a major determinant for proteome diversity. Approximately 92%–94% of human genes generate alternatively spliced transcripts, often with tissue-specific regulation (ref. Wang et al., 2008; ref. Barbosa-Morais et al., 2012). Alternative splicing is involved in a variety of cellular processes, such as cell proliferation, differentiation, migration and survival (ref. Paronetto et al., 2016; ref. Gallego-Paez et al., 2017). Emerging data indicate that alternative splicing plays a critical role in the pathogenesis of many diseases, including several molecular subtypes of cancer (ref. Oltean and Bates, 2014; ref. Scotti and Swanson, 2016; ref. Jiang and Chen, 2021). Interrogating such splicing abnormalities can facilitate identification of disease drivers, drug resistance mechanisms, and molecules capable of regulating pathological splicing events. Thus, exploration of alternative and aberrant splicing phenotypes promises to shed light on novel aspects of health and disease.
The recent release of transcriptome-wide RNA sequencing (RNA-seq) data repositories such as The Cancer Genome Atlas (TCGA) (ref. Tomczak et al., 2015) and the Genotype-Tissue Expression (GTEx) project (ref. Lonsdale et al., 2013) have lifted alternative splicing analysis opportunities to an unprecedented level. However, a unified and accessible analysis strategy for this data has largely been missing.
The gradual development of RNA-seq technologies and cost-effective alternative splicing studies at the transcriptome level has allowed the parallel evolution of bioinformatic tools for splicing quantification and visualization. Most of these tools rely on two main computational approaches: 1) quantification of the Percent Spliced-In (PSI) metric, which uses the ratio between exon-exon junction spanning sequencing reads that provide evidence for the inclusion or exclusion of an alternatively spliced region [e.g., rMATS (ref. Shen et al., 2014), MISO (ref. Katz et al., 2010), SUPPA (ref. Alamancos et al., 2015), SplAdder (ref. Kahles et al., 2016), psichomics (ref. Saravia-Agostinho and Barbosa-Morais, 2019), AltAnalyze (ref. Emig et al., 2010), SpliceSeq (ref. Ryan et al., 2012), VAST-TOOLS (ref. Irimia et al., 2014), MAJIQ (ref. Vaquero-Garcia et al., 2016), LeafCutter (ref. Li et al., 2018) and Whippet (ref. Sterne-Weiler et al., 2018)], and 2) quantification and de-convolution of the entire set of reads aligned to the gene to estimate transcript isoform abundance (e.g., Cufflinks (ref. Trapnell et al., 2010), RSEM (ref. Li and Dewey, 2011), Sailfish (ref. Patro et al., 2014), Salmon (ref. Patro et al., 2017) and Kallisto (ref. Bray et al., 2016)) (see Table 1 for a comparison of these tools). Although these bioinformatic tools have propelled transcriptome-wide alternative splicing analysis forward, they suffer from significant limitations. These include the need for high computational resources and bash-based operation, restrictions of input file formats, incomplete transcriptome annotation and consequently inaccurate transcript/PSI quantification. Furthermore, these tools suffer from complex static graphical outputs that are complicated to visualize and interpret or lack the option for association of splicing phenotypes to clinical or molecular data. These caveats are obstacles for a straight-forward interpretation of the biological and physiological relevance of alternative splicing in disease. Thus, despite the large variety of available tools, there is still a high demand for easy-to-use alternative splicing analysis strategies that can incorporate comprehensive data visualization and integration with external sample traits.
TABLE 1: Feature comparison between DJExpress and other existing splicing analysis tools.
| Tool | GUI | User-selected alignment method | Non-annotated junctions supported | Splicing pattern visualization | Downstream trait association |
|---|---|---|---|---|---|
| DJExpress | Yes | Yes | Yes | Yes | Yes |
| MAJIQ | Yes | Yes | Yes | Yes | No |
| Psichomics | Yes | Yes | No | Yes | Yes |
| AltAnalize | Yes | Yes | No | Yes | Yes |
| LeafCutter | Yes | No | Yes | Yes | Yes |
| SplAdder | No | Yes | Yes | Yes | No |
| rMATS | No | Yes | Yes | No | No |
| SpliceSeq | Yes | No | No | Yes | No |
| Whippet | No | No | Yes | Yes | No |
| JunctionSeq | No | No | Yes | Yes | No |
| MISO | No | No | No | Yes | No |
| SUPPA | No | Yes | No | No | No |
| Cufflinks | No | No | Yes | No | No |
| Salmon | No | Yes | No | No | No |
| RSEM | No | Yes | No | No | No |
| Sailfish | No | No | No | No | No |
| VAST-TOOLS | No | No | No | No | No |
| Kallisto | No | No | No | No | No |
Here we introduce a novel differential junction expression analysis pipeline, DJExpress, which is an R package for analysis of transcriptomic features and expression-trait associations. DJExpress runs on an average laptop computer (Supplementary Figure S1) and provides a set of interactive and intuitive visualization formats. DJExpress uses raw splice junction counts—derived from STAR aligner (ref. Dobin et al., 2013) or other junction quantification algorithms—as input data to determine gene-level differential junction usage. The statistical approaches implemented by DJExpress include empirical Bayesian procedures to assess differential junction expression between experimental conditions and junction-level t-statistics tests to determine differences between each junction and all other junctions within the same gene.
In contrast to the majority of existing pipelines, DJExpress can handle both annotated and de novo identified splice junctions, thereby allowing the characterization of novel splice events. Moreover, through gene-level differential junction usage calculation, DJExpress identifies associations between junction expression and molecular/clinical features using large matrix operations. An additional more advanced feature of DJExpress involves weighted junction co-expression network analysis (JCNA). JCNA-derived junction expression modules can be correlated with phenotypes of interest, thereby allowing differential splicing analysis on a systemic scale. For downstream processing, JCNA outputs can be exported in a format compatible with network visualization tools such as VisANT and Cytoscape (ref. Shannon et al., 2003; ref. Hu et al., 2004).
In addition to these locally accessible features, DJExpress offers a web-compatible graphical interface for the analysis of user-provided data as well as the visualization of DJEC DB, a custom database of cancer-specific splicing profiles and their association to external traits from tumor samples and cancer cell lines. DJEC DB includes not only TCGA and GTEx data, but also cancer cell line data from the Cancer Dependency Map (DepMap1) project. The integration of DepMap data allows association of junction expression with functional genomics features such as gene dependencies and drug response profiles. This facilitates identification of cancer cell models for specific splicing alterations that can then be used for functional characterization in the lab.
Taken together, DJExpress represents a novel and versatile tool to analyze and explore alternative splicing phenotypes in health and disease.
Methods
Differential Junction Expression Module
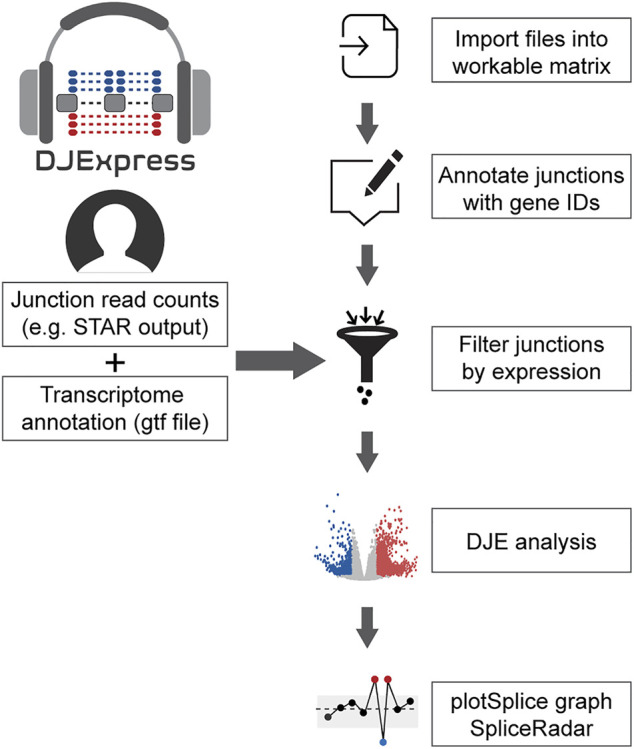
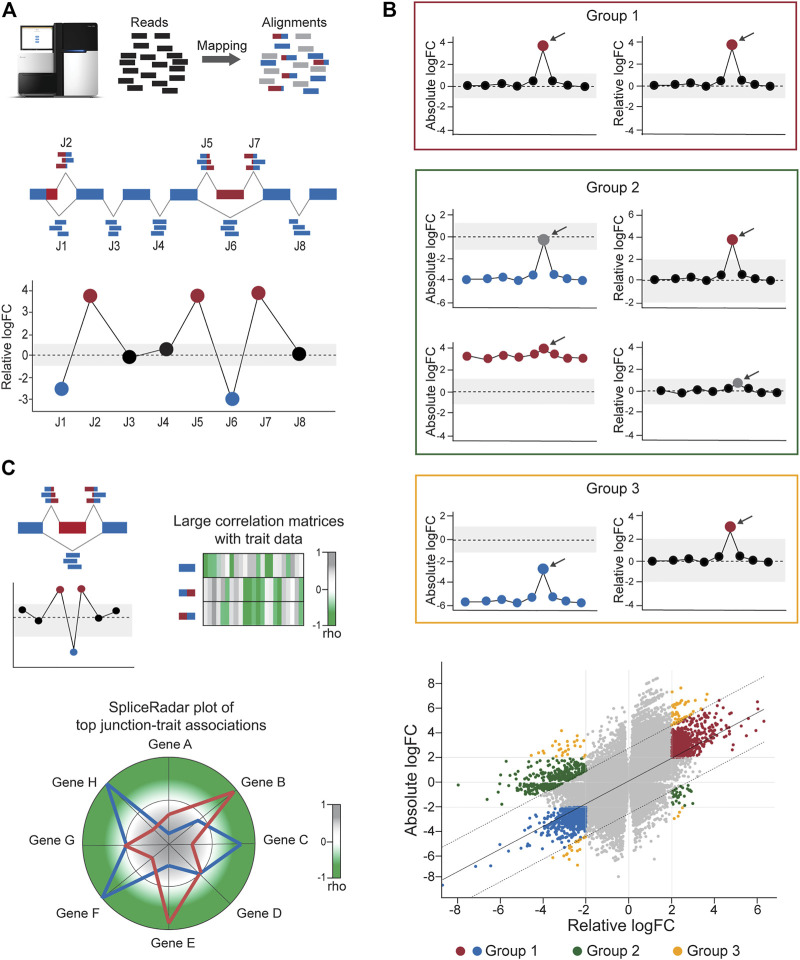
The data analysis workflow in the DJE module is depicted in Figure 1. For differential junction expression (DJE) and junction co-expression network analysis (JCNA), DJExpress uses quantified raw reads aligned to exon-exon junction loci and the transcriptome annotation as the primary input. Mapped and quantified junction reads are typically generated from FASTQ or BAM files using common RNA-seq alignment/quantification tools [e.g., STAR (ref. Dobin et al., 2013), TopHat (ref. Trapnell et al., 2009), MapSplice (ref. Wang et al., 2010), Rsubread (ref. Liao et al., 2019)] (Figure 2A). Following the statistical principles in limma Bioconductor package (ref. Law et al., 2014; ref. Ritchie et al., 2015), DJExpress first tests for differential expression of genomic features (here splice junction regions) using an initial input matrix of read count values as rows and sample ids as columns. Count data is then transformed to log2-counts per million (logCPM), and observation-level weights based on mean-variance relationship are computed (using the voom function from limma). Users can decide at this point whether to keep the default expression threshold for filtering junctions prior to hypothesis testing (10 minimum of read count mean per junction) or to adjust the threshold based on the mean-variance trend. A linear model is then fit per junction using a provided experimental design, and empirical Bayes moderated t-statistics are implemented to assess the significance level of the observed expression changes.
The linear model framework of limma is also used in parallel to calculate differential junction usage, where significant differences in log-fold changes in the fit model between junctions from the same gene are tested (using the diffSplice function from limma). DJExpress thereby identifies alternatively spliced regions in transcripts based on two main features of splice junction expression: 1) Quantitative changes in the abundance of individual junctions between experimental groups, and 2) Differences in their expression levels compared to the average expression of other junctions in the gene.
Following these criteria, splice junctions are classified based on their absolute log-fold change (e.g., experimental condition A vs B) and their relative log-fold change (target junction vs all other junctions in the gene) in one of the following expression groups (Figure 2B):
- Group 0: Junctions without differential expression or differential usage.
- Group 1: Junctions with equal levels of differential expression and differential usage, reflecting changes in splicing patterns between experimental conditions (in this case, both absolute and relative log-fold change values are similar, if not the same).
- Group 2: Junctions with differential expression but no differential usage or vice versa, implying the occurrence of generalized changes in expression across the gene, rather than the presence of a differentially spliced region (in this case, either the absolute or relative log-fold change value is not significant).
- Group 3: Junctions with divergent levels of differential expression and differential usage, indicating concomitant changes in splicing and total gene expression (in this case, the absolute and relative log-fold change values can substantially vary from each other).
One of the main features of DJE module’s approach is the incorporation of an interactive gene-wise junction representation (Figure 2A). This approach facilitates straight-forward visual inspection of differential splicing across the gene and exploration of supplementary information about each junction’s expression. This includes the above-mentioned classification based on absolute and relative log-fold change patterns, basic statistics on expression levels (e.g., mean and median expression in each experimental condition, number of samples expressing the junction, etc.) as well as the identification of non-annotated and condition-specific junctions. The latter are also called “neojunctions” in the DJExpress pipeline, referring to junctions detected in the tested condition but are not found in the control condition.
Junction-Trait Association Module
Further exploration of the potential physiological relevance of alternative splicing is possible through the association of junction expression to external sample traits (e.g., clinical or molecular data). Significant junction-trait linkages are determined by large matrix operations including correlation analysis, ANOVA test or linear regression models [using cor and bicor from WGCNA (ref. Langfelder and Horvath, 2008) and Matrix_eQTL_engine from MatrixEQTL (ref. Shabalin, 2012)]. The top significant association can be visualized though heatmap plots or alternatively, using the SpliceRadar plot format (Figure 2C), where the coefficient of top-ranked correlations is used to map each junction-trait association within a radar chart. This graphical concept allows the users to simultaneously visualize relevant associations between the expression of selected junctions (e.g., the top most differentially expressed junctions or a subset of junctions within a target gene) and external traits, as well as to elucidate expression-trait patterns shared among junctions of interest with potential biological relevance.
Junction Co-Expression Network Analysis Module
A widely used approach for describing correlation networks in systems biology is the weighted gene co-expression network analysis (WGCNA, ref. Langfelder and Horvath, 2008). WGCNA is a screening method based on pairwise correlations between features in gene expression data. This approach allows the identification of clusters (or modules) of highly correlated genes, intramodular hub genes and representative module eigengenes (MEs). These can be used in the estimation of module membership values for each gene as well as in association analyses between modules and to external sample traits. This technique has been frequently implemented for the assessment of gene-network signatures and for the identification of functional pathways and candidate molecular biomarkers, integrating gene expression and clinical/molecular data from physiological and disease conditions (ref. Oldham et al., 2008; ref. Presson et al., 2008; ref. Ma et al., 2017; ref. Vieira et al., 2019).
The weighted junction co-expression network analysis module (JCNA) in DJExpress provides an implementation of WGCNA algorithms (version 1.70.3, ref. Langfelder and Horvath, 2008) in the context of splice junction expression when sufficient sample size is provided (≥15 samples within single experimental conditions as suggested in the WGCNA guidelines) (Figure 3A). JCNA initiates with a data pre-processing step where outlier samples (clustered using the average linkage method) and lowly expressed junctions are removed to ensure high confidence network construction. Correlation matrices (e.g., using Pearson, Spearman or the default biweight midcorrelation) (ref. Wilcox, 2012) are then built for all pair-wise junctions. The full network is subsequently specified by a weighted adjacency matrix calculated with an appropriate soft threshold power (ref. Zhang and Horvath, 2005). Summary plots of a network topology analysis are produced by JCNA (following WGCNA guidelines) to aid users in the selection of the soft-thresholding power around which scale-free topology in the junction network is achieved.
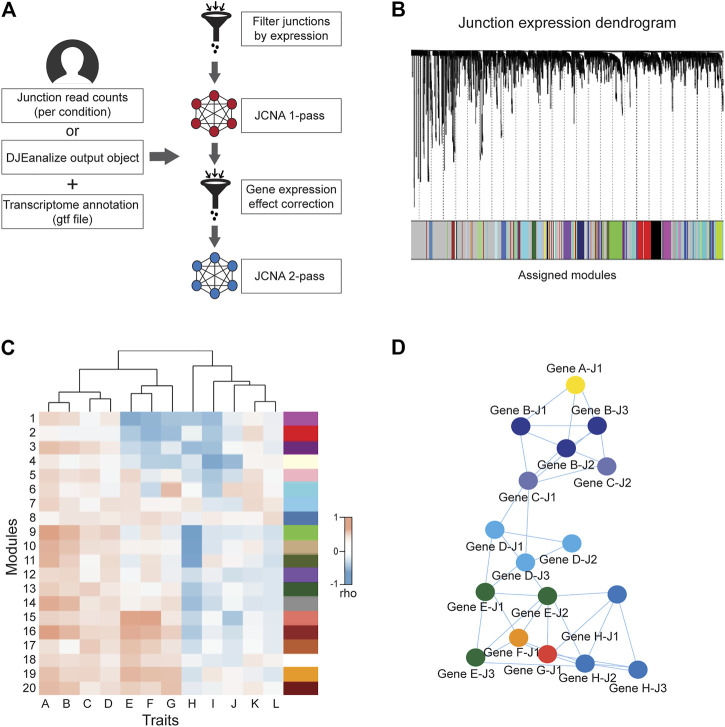
Additional parameters such as minimum module size, module detection sensitivity or cut height of the hierarchical clustering dendrogram for module definition can be introduced for junction module identification (Figure 3B). Calculation of MEs is also possible, where expression patterns of all junctions in a module are summarized into a single expression profile. This measure is then used in the correlation analysis with sample traits. Notably, ME calculation reduces the computational burden of multiple testing, which otherwise can be exceedingly high since junction quantification datasets usually comprise millions of expression features.
Users can either keep the output of a 1-pass JCNA or can continue into a second round of network construction. During this 2-pass JCNA, the gene expression-specific effect within junction modules is subtracted. This is particularly relevant in the context of junction-trait associations, since a considerable number of co-expressing junctions are expected to cluster into single modules as a result of intrinsic associations at the gene expression level. Here, 2-pass JCNA improves the identification of true co-splicing signatures, since junctions from the same gene or from highly correlated genes tend to cluster without any specific association to splicing.
For 2-pass JCNA, gene expression-based networks including correlations with a user-selected sample trait are calculated (Figure 3C). The absolute value of junction significance, which represents the correlation coefficient between a given junction and the selected trait is plotted as a function of the corresponding gene significance. Junctions outside of the distribution by ≥ 2 standard deviations (showing no correlation between junction and gene significance for trait) are kept for network re-construction. Thus, 2-pass JCNA strategy allows the user to further explore associations between molecular/clinical traits and modules of co-expressed splicing events that can be defined once gene expression-related junction co-expression is identified and removed from the network.
Furthermore, as in the case of WGCNA pipeline, the resulting junction modules from JCNA can be also exported to network graphical tools such as Cytoscape or VisANT for further visual exploration and customization (Figure 3D).
Run Time and Memory Benchmarks
For run time and memory consumption benchmarks of function within the DJE module (DJEimport, DJEannotate, DJEprepare and DJEanalyze), we used STAR-derived junction quantification files from the TCGA COADREAD tumor sample cohort. DJExpress pipeline was applied 10 times on two cores of a macOS X 11.6.1 system with 2.3 GHz Quad-Core Intel Core i5 processor and 16 GB of memory, RStudio Desktop 1.4. 1106 and R 4.0.5. Each run was performed on datasets with increasing number of samples (e.g., 10, 20, 40, 60, 80, 100, 200, 400,600, 800, 1000) and 100,000 randomly retrieved splice junctions. For the differential junction expression analysis using DJEanalyze, samples were randomly divided into two groups using Bernoulli distributed values with a 50% probability of success (Supplementary Figure S1).
Data Collection for Differential Junction Expression in Cancer Database
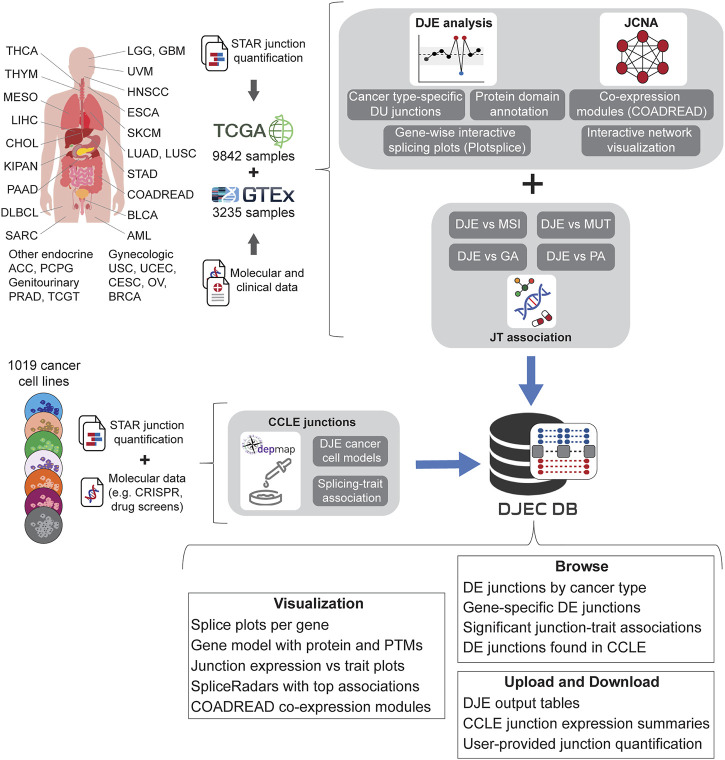
Using the pipelines described for the DJE and JCNA modules, we generated DJEC DB, a custom database of cancer-specific splicing profiles and their association to external traits from tumor samples and cancer cell lines (Figure 4). DJEC DB can be accessed through a graphical interface based on the shiny package (version 1.6.0) and includes healthy and tumor tissue data for 9,842 human samples across 32 different tumor types from TCGA, 3,235 normal post-mortem tissue samples from GTEx and 1,019 cancer cell lines from the DepMap Project.
Alignment of GTEx and TCGA RNA-seq data sets to the GRCh37 reference genome and subsequent splice junction quantification, as well as removal of low-quality tissue samples was previously done (ref. Kahles et al., 2018) using the STAR aligner tool with the following arguments:
STAR –genomeDir GENOME –readFilesIn READ1 READ2 –runThreadN 4 –outFilterMultimapScoreRange 1 –outFilterMultimapNmax 20 –outFilterMismatchNmax 10 –alignIntronMax 500000 –alignMatesGapMax 1000000 –sjdbScore 2 –alignSJDBoverhangMin 1 –genomeLoad NoSharedMemory –limitBAMsortRAM 70000000000 –readFilesCommand cat –outFilterMatchNminOverLread 0.33 –outFilterScoreMinOverLread 0.33 –sjdbOverhang 100 –outSAMstrandField intronMotif –outSAMattributes NH HI NM MD AS XS –sjdbGTFfile GENCODE_ANNOTATION –limitSjdbInsertNsj 2000000 –outSAMunmapped None –outSAMtype BAM SortedByCoordinate –outSAMheaderHD @HD VN:1.4 –outSAMattrRGline ID::<ID> –twopassMode Basic –outSAMmultNmax 1
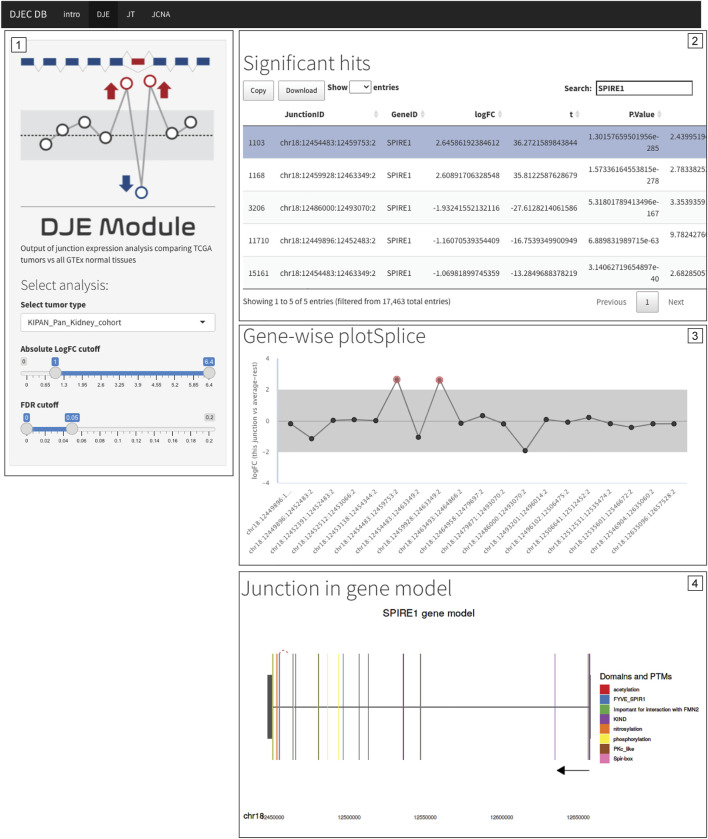
We used the raw junction counts from this study as the basis for DJEC DB. For this, differential junction expression analysis was implemented comparing junction abundance between each TCGA cancer type and all GTEx normal tissues. Cancer-specific changes in junction expression can be accessed through the DJE Module section in the DJEC DB web application (Supplementary Figure S2). Here, users can select target junctions to visually explore interactive splice plots and differentially expressed junctions in the context of protein domain and post-translational modifications annotated within the Prot2HG database of protein domains mapped to the human genome (ref. Stanek et al., 2020).
In addition to RNA-seq data, the TCGA repository contains an extensive molecular and clinical annotation for tumor samples, including additional omics data (genotyping, DNA methylation, etc.) as well as multiple tumor classifications and clinical records of the patient. This data collection allows comprehensive correlation analyses between junction expression and tumor/patient traits. The junction-trait (JT) module section of DJEC DB (Supplementary Figure S3) contains significant linkages found between differentially expressed junctions and microsatellite instability (MSI) or altered oncogenic signaling pathways based on mutations, copy-number changes (CNV), mRNA expression, gene fusions and DNA methylation (ref. Sanchez-Vega et al., 2018). This approach is an adaptation of the Matrix eQTL method (ref. Shabalin, 2012), which uses large matrix operations of linear and ANOVA models containing covariates to account for external factors such as tumor grade or age of the patient.
Moreover, an exemplary co-expression network analysis can be also found within the JCNA section, where users can interactively explore junction expression modules as well as the results of junction-traits associations in TCGA colorectal (COADREAD) tumors (Supplementary Figure S4). This implementation of WGCNA algorithms included the removal of junctions with excessive missing values and sample outliers after sample hierarchical clustering using the goodSamplesGenes function (ref. Langfelder and Horvath, 2008). The subsequent soft-thresholding procedure ensures a scale-free network, which emphasizes strong correlations between junctions and penalizes weak correlations. The scale-free network was constructed using the blockwiseModules function which converts the correlation matrix into a strengthened adjacency matrix that summarizes the association between all junctions.
Gene-trait correlation matrices were also calculated and used to identify and remove junctions whose correlation to external traits was gene expression-dependent. Junction co-expression modules were identified by dividing the junction expression dendrogram into branches using a dynamic tree cutting algorithm with medium sensitivity for cluster splitting (deepSplit = 2). Different colors were then assigned to the modules for subsequent visualization. MEs significance values and correlations between MEs and clinical traits were also calculated. The same was done for individual junction-to-trait correlations.
To implement cancer cell line junction expression data into DJEC DB, we downloaded fastq files from CCLE (available through the Sequence Read Archive (SRA) under accession number PRJNA523380) and carried out alignment and junction quantification with the same strategy that was previously used for TCGA and GTEx data (ref. Kahles et al., 2018). This data was then integrated with DepMap functional genomics data in the CCLE DJE and CCLE SpliceRadar sections of DJEC DB (Supplementary Figure S5). CCLE DJE comprises the results of DJE analysis in cancer cell lines within the same tissue of origin versus fibroblasts used as “healthy” control cell lines. Significant correlations between differentially expressed junctions and gene expression, CRISPR gene effect or drug response values (ref. DepMap 21Q3 Public, 2021) are found within CCLE SpliceRadar. Here, users can plot SpliceRadar charts with selected junction-trait associations. These database components aim to facilitate the identification of cancer cell models for specific splicing alterations and junction-trait associations that can be further studied for functional characterization in the lab.
Results
The DJExpress toolbox incorporates both an R package (containing DJE and JCNA modules) and a user-friendly Shiny-based web application for a visual exploration of DJEC DB as well as custom DJE analysis for user-provided junction quantification data. Input files can either be STAR aligner-derived “SJ.out.tab” files (containing splice junction counts per sample in tab-delimited format) or any other junction quantification files as long as they contain junction IDs as first columns, following the format chr:start:end:strand (e.g., chr1:123:456:1, where positive or negative strand are coded as 1 and 2, respectively). In the following paragraphs, we describe the use of DJExpress and DJEC DB in detail and use case studies to demonstrate how DJExpress and DJEC DB can be utilized to identify and computationally explore alternative splice events across cell lines and patient samples.
Differential Junction Expression and Junction-Trait Association Analyses in Cancer Cell Lines
To demonstrate the workflow of DJExpress, we analyzed cancer cell lines from the DepMap repository, comprising 13 tissue types that contain ≥30 individual cell lines per tissue (brain, breast, colon/colorectal, gastric, head and neck, kidney, leukemia, lung, lymphoma, myeloma, ovarian, pancreatic and skin cancer). Table 2 summarizes the results of DJE analysis module per tissue, using junction expression in fibroblasts as normal control condition. Users can explore this data in the DJE-CCLE section of DJEC DB.
TABLE 2: Summary of DJE module junction statistics in CCLE.
| CCLE tissue | Quantified junctions | DE junctions | DE junctions in Group 1 | DE junctions in Group 2 | DE junctions in Group 3 | Novel junctions | Neojunctions |
|---|---|---|---|---|---|---|---|
| Brain | 120,611 | 846 | 74 | 73 | 14 | 3,456 | 110 |
| Breast | 123,349 | 2,153 | 499 | 431 | 247 | 3,426 | 255 |
| Colon | 122,639 | 3,363 | 663 | 722 | 409 | 3,400 | 336 |
| Gastric | 126,487 | 2,335 | 540 | 486 | 293 | 3,806 | 320 |
| Head-Neck | 119,194 | 2,398 | 440 | 391 | 144 | 3,573 | 316 |
| Kidney | 117,989 | 1,231 | 185 | 143 | 119 | 3,574 | 164 |
| Leukemia | 123,295 | 3,668 | 631 | 1,060 | 511 | 3,563 | 514 |
| Lung | 130,297 | 2,327 | 386 | 549 | 154 | 3,403 | 368 |
| Lymphoma | 122,911 | 3,795 | 689 | 1,012 | 524 | 3,772 | 354 |
| Myeloma | 119,528 | 3,307 | 727 | 678 | 420 | 3,734 | 398 |
| Ovarian | 122,251 | 1,603 | 295 | 283 | 238 | 3,512 | 241 |
| Pancreatic | 121,817 | 2,528 | 448 | 418 | 308 | 3,614 | 220 |
| Skin | 120,200 | 2,036 | 186 | 357 | 247 | 3,498 | 197 |
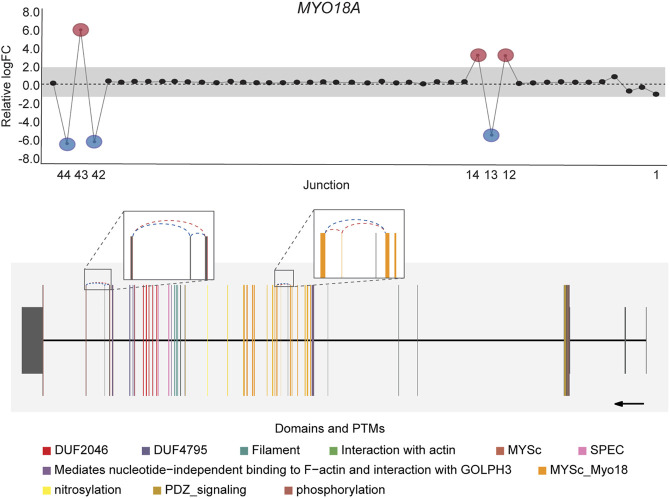
DJExpress identified on average of 1,918 differentially used junctions (FDR < 0.05 and |logFC| > 1), including previously described alternative splicing events in cancer, such as the downregulation of ACTN1 exon 19b (ref. Gardina et al., 2006; ref. Thorsen et al., 2008; ref. Bielli et al., 2018), VCL exon 19 (ref. Gardina et al., 2006; ref. Thorsen et al., 2008), the upregulation of NUMB exon 12 (ref. Misquitta-Ali et al., 2011; ref. Bechara et al., 2013; ref. Zhang et al., 2014; ref. Zong et al., 2014), MAP3K7 exon 12 (ref. Munkley et al., 2019; ref. Qiu et al., 2020; ref. Oh et al., 2021), CTNND1 exon 20 (ref. Yanagisawa et al., 2008; ref. Sebestyen et al., 2015; ref. Wang et al., 2020), and EXOC1 exon 11 (ref. Ray et al., 2020; ref. Zhang et al., 2020), as well as of exons contained within the variant domain in CD44 (ref. Shirure et al., 2015; ref. Chen et al., 2018; ref. Wang et al., 2018; ref. Chen et al., 2020) (Figure 5; Supplementary Figure S6). Moreover, the gene-wise visualization of differential junction expression allowed the identification of complex alternative splicing patterns and isoform switches in cancer, such as the case of the co-regulated inclusion of exon 11 and exclusion of exon 40 in MYO18A in lymphoma and myeloma, the complex local event involving exons 15–18 in MARK3 in leukemia, lymphoma, myeloma, breast, colon, gastric, lung and pancreatic cancer, or the isoform switches in RGS3 in breast, colon, gastric, lung, ovarian and pancreatic cancers, and INPP5B in pancreatic cancer cell lines (Figure 6; Supplementary Figures S7, S8). These data demonstrate that DJExpress can not only reliably identify previously described alternative splicing events but can also facilitate the discovery and visualization of complex splice events within annotated splice regions.
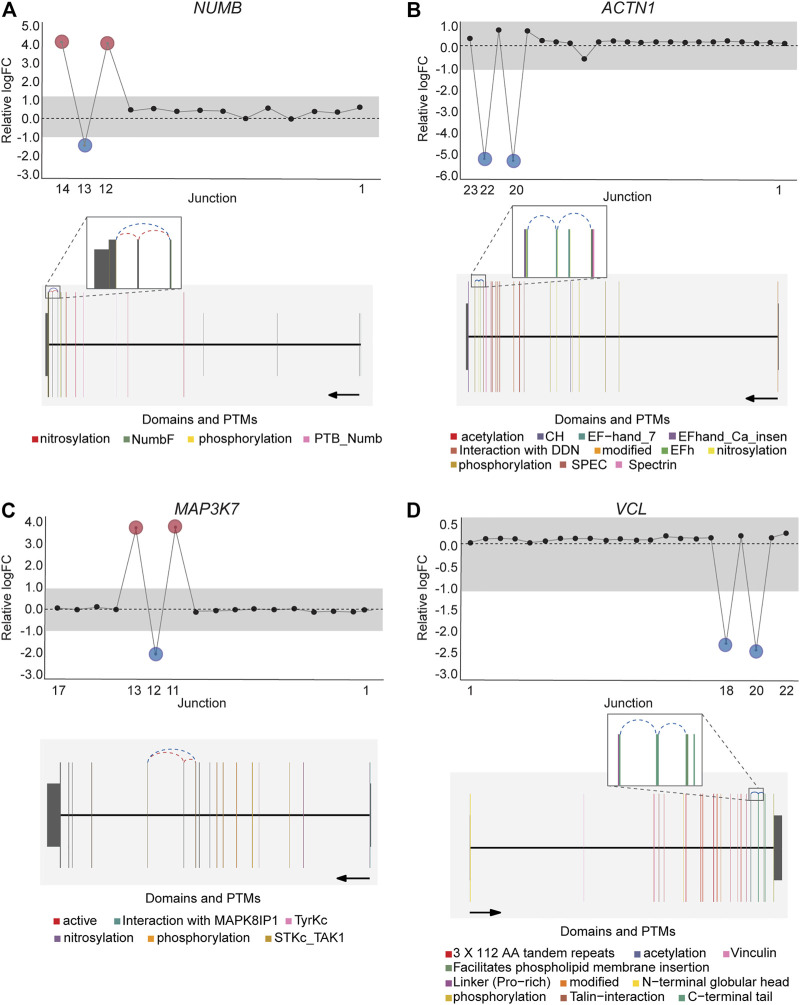
Notably, an average of 3,563 non-annotated splice junctions per tissue and 292 neojunctions (defined as junctions not detected in control fibroblast cell lines) were also discovered by the DJE analysis module (Table 2). Here, the visualization of non-annotated junctions within the gene-wise DJE plots allowed us to identify the presence of previously unknown splicing events, including exon skipping, alternative 3′ splice sites, alternative 5′ splice sites and alternative first and last exons (Supplementary Figure S9). Moreover, DJE plots also revealed the presence of novel splice junctions with genomic coordinates that suggest the presence of exons so far not described in the human transcriptome annotation (Figure 7; Supplementary Figure S10). These newly identified splicing events are potentially linked to cancer physiology and their functional characterization could be subject of future studies. Nevertheless, to further illustrate the capabilities of DJExpress and DJEC DB, we next focused on a well-described alternative splicing switch in NUMB mRNA.
Case Study 1: SpliceRadar-Based Identification of NUMB Alternative Splicing Regulators
NUMB encodes for a key determinant of cell fate that regulates the trafficking of surface proteins such as Notch, integrins and E-cadherin and can undergo alternative splicing (ref. Nishimura and Kaibuchi, 2007; ref. McGill et al., 2009; ref. Teckchandani et al., 2009; ref. Wang et al., 2009). Inclusion of NUMB exon 12 is frequently observed in different types of cancer, leading to a 48 amino acid extension of the proline-rich region (PRR) of the NUMB protein (ref. Chen et al., 2009; ref. Zhang et al., 2014; ref. Lu et al., 2015; ref. Rajendran et al., 2016). This longer NUMB isoform (Numb-L) was found to promote proliferation, whereas the shorter isoform (Numb-S) promotes differentiation of cancer cells (ref. Verdi et al., 1999). In lung cancer, the splicing factor QKI represses the inclusion of NUMB alternative exon through competing with a core splicing factor SF1, thereby inhibiting proliferation and Notch signaling (ref. Zong et al., 2014).
This well-documented NUMB isoform switch was also detected with DJExpress, which showed a ∼16-fold (log2 ∼4-fold) upregulation of NUMB exon 12 inclusion junctions in breast cancer cell lines compared to fibroblasts (Figure 5A). A similar NUMB splice pattern was observed across other cancer types (data not shown). Furthermore, by using DJExpress JT module, we corroborated the positive correlation between QKI gene expression and NUMB exon 12 exclusion (Figure 8A). Moreover, SpliceRadar-based visualization identified additional positively and negatively correlated splicing regulators, including SRPK2 and RBFOX2, which have both previously been implicated in the regulation of NUMB alternative splicing (ref. Lu et al., 2015). Thus, our data suggests that the control of NUMB alternative splicing in cancer may involve a more complex regulatory network than previously thought. These data demonstrate that DJExpress can not only validate known associations with splice events but can also, through functionality of the SpliceRadar tool, identify additional regulatory networks that may be altered in cancer.
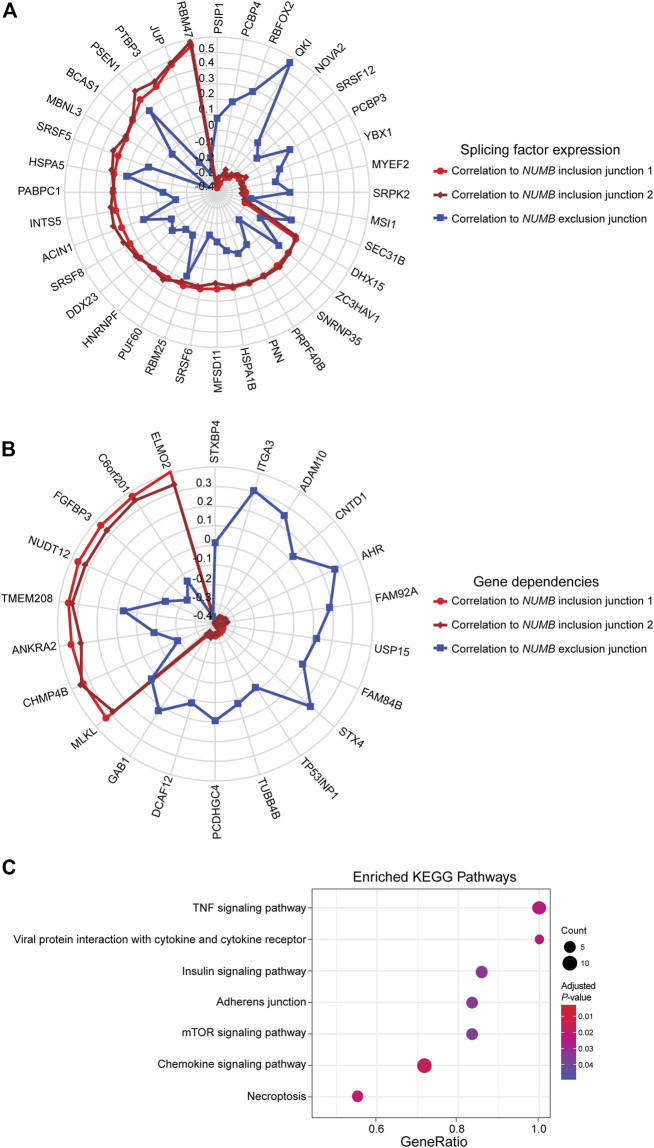
DJEC DB incorporates gene dependencies and drug response data from the DepMap repository. We thus expanded the landscape of phenotypic associations to NUMB alternative splicing in lung cancer cell lines (Figure 8B). Pathway enrichment analysis of significantly associated gene dependencies revealed enrichment of components within the mTOR and insulin signaling pathways. This is consistent with previous studies, which suggested that activated ERK signaling is a common mechanism that regulates NUMB isoform expression in breast and lung cancer cells (ref. Rajendran et al., 2016) (Figure 8C). Similarly, SpliceRadar plots using top correlations with drug response values also revealed associations between the expression of exon-inclusion junctions in NUMB and cell survival rates after treatment with several compounds targeting PI3K/mTOR and ERK MAPK signaling (Supplementary Figure S11). These data reinforce the notion of a functional connection between NUMB exon 12 inclusion and pro-inflammatory signaling cascades.
Taken together, these results illustrate the potential of the DJExpress pipeline to identify bona fide differentially expressed splice junctions and reveal physiologically relevant associations between junction expression and various external traits. Thus, DJExpress can be used to support and generate hypotheses regarding the potential molecular mechanisms involved in the regulation and physiological consequences of alternative splicing.
DJEC DB Data Summary
TCGA project is a large-scale oncology study that has allowed the comprehensive characterization of multiple cancer types using a catalogue of clinical and molecular data, including RNA sequencing from thousands of patients across multiple tumor types. This resource harbors an excellent opportunity for cancer researchers and clinicians to explore and define tumor-specific transcriptomic signatures, and to integrate them with additional external traits such as mutations, copy number variations (CNV) or microsatellite instability (MSI). These features of TCGA can facilitate identification of novel therapeutic or diagnostic biomarkers. However, TCGA alternative splicing analyses, particularly the association of splice events with clinical and molecular traits, is currently not available in an accessible way.
To fill this gap, we generated DJEC DB, a platform that provides an integration of differential junction expression analysis with TCGA molecular and clinical data. For this, we used splice junction quantification from a recently published study (ref. Kahles et al., 2018) where TCGA and GTEx RNA-seq samples were re-analyzed using 2-pass STAR alignment, thereby allowing identification of annotated and de novo splice events. Additionally, we quantified junction expression in cancer cell lines from CCLE fastq files and integrated this data with functional genomics data sets from the DepMap repository.
DJEC DB comprises four main sections: 1) Differential Junction Expression (DJE) in TCGA vs GTEx tissue, 2) Junction-Trait (JT) associations using external clinical and molecular sample data, 3) Junction Co-expression Network Analysis (JCNA) using junction expression in colorectal (COADREAD) tissue samples as example dataset, and 4) Differential Junction Expression in cancer cell lines and association with DepMap functional genomics data (DJE-CCLE).
The DJE section comprises summary statistics and visualization options for an average of 6,345 differentially expressed junctions across the 32 tumor tissue types analyzed (FDR <0.05 and |logFC| > 2, Table 3). In the JT section, an average of 674 statistically significant associations are shown between differentially expressed junctions and altered oncogenic signaling pathways determined by the presence of mutations, CNVs, altered gene expression, gene fusions, DNA methylation and MSI (in the case of COADREAD tumors).
TABLE 3: Summary of DJE and JT junction statistics in DJEC DB.
| TCGA tissue cohort | Sample size | Quantified junctions | DE junctions | Associations to genomic alterations | Associations to mutations | Associations to pathway alterations |
|---|---|---|---|---|---|---|
| ACC | 79 | 13,827,029 | 2,335 | 1 | 2 | — |
| BLCA | 408 | 14,369,479 | 2,935 | 215 | 274 | — |
| BRCA | 1,083 | 15,445,200 | 3,740 | 334 | 306 | 15 |
| CESC | 304 | 14,260,819 | 4,808 | 14 | 20 | — |
| CHOL | 36 | 13,786,637 | 8,446 | 10 | 10 | — |
| COADREAD | 372 | 14,315,224 | 5,534 | 49 | 44 | — |
| DLBC | 48 | 13,822,896 | 6,150 | 9 | 5 | — |
| GBM | 165 | 13,995,214 | 12,781 | 2 | 4 | — |
| HNSC | 500 | 14,592,967 | 5,745 | 49 | 117 | 2 |
| KIPAN | 738 | 14,965,143 | 2,836 | 92 | 93 | 1 |
| LGG | 526 | 14,536,867 | 6,771 | 6,708 | 6,061 | 404 |
| LIHC | 372 | 855,905 | 4,996 | 97 | 99 | — |
| LUAD | 516 | 14,681,817 | 3,931 | 153 | 149 | — |
| LUSC | 500 | 14,804,638 | 4,721 | 107 | 114 | 10 |
| MESO | 82 | 13,866,293 | 4,078 | — | — | — |
| OV | 199 | 16,204,728 | 8,509 | 9 | 10 | — |
| PAAD | 178 | 13,981,645 | 4,942 | 26 | 26 | — |
| PCPG | 183 | 14,428,362 | 8,973 | 228 | 228 | — |
| PRAD | 497 | 1,166,561 | 4,097 | 85 | 94 | — |
| SARC | 257 | 14,106,882 | 1,810 | 12 | 50 | — |
| SKCM | 471 | 14,106,882 | 3,436 | 16 | 11 | — |
| STES | 535 | 18,214,111 | 7,155 | 418 | 330 | — |
| TGCT | 156 | 14,050,087 | 9,684 | 14 | 14 | — |
| THCA | 500 | 14,437,693 | 4,885 | 699 | 714 | 37 |
| THYM | 118 | 13,939,486 | 3,860 | 30 | 31 | — |
| UCEC | 179 | 14,038,958 | 9,241 | 114 | 99 | — |
| UCS | 56 | 13,829,412 | 9,091 | 6 | 5 | — |
| UVM | 80 | 13,809,902 | 9,285 | — | — | — |
To exemplify the use of the JCNA approach, we selected the 372 samples from the TCGA COADREAD tumor cohort to construct a junction co-expression network (see methods for details). For this, we used a minimum module size of 20 junctions and an unsigned network type, meaning that the weight of connection between nodes (junctions) is calculated irrespectively of the direction of the association, so modules can contain both, positively and negatively correlated junctions (Supplementary Figure S4).
From a total of 7,404 junctions filtered by their gene expression-independent association to sample traits, 36 expression modules were found for this tumor type, with an average of 206 junctions per module. Module-trait associations were also determined throughout the correlation between ME expression values and tumor stage, MSI, mutations in TP53, EGFR, KRAS and BRAF genes, as well as expression across six splicing factor gene modules previously calculated from gene expression data.
Finally, the DJE-CCLE section contains the results of the differential junction expression analysis of normal fibroblast cells vs cancer cell lines clustered by tissue of origin, as described above. Significant correlations between junction expression and functional genomics data obtained from the DepMap repository are displayed in a summary table and selected association patterns can be visualized using SpliceRadar plots.
Search and Browse DJEC DB
Within the DJE section, users can first define the target tumor tissue type as well as the logFC and FDR cutoffs for the significance in differential expression (Supplementary Figure S2). A table with the summary statistics is displayed and specific target genes or junctions can be selected by the users in order to display gene-wise splice plots as well as a zoomable gene model plots with exon-to-protein domain annotation. In addition, junction-trait associations in TCGA can be explored within the JT section following user-defined tumor tissue type and external molecular trait options (Supplementary Figure S3).
For the JCNA section using the TCGA COADREAD sample cohort, a junction dendrogram with expression module assignment, as well as a module-trait association heatmap are displayed (Supplementary Figure S4). For intramodular analysis, users can select specific modules and traits to visualize module-to-trait significance plots, as well as module networks in interactive format. Both are helpful in identifying centrally located intramodular hub junctions with high module membership as well as high significance for selected traits. This allows the user to generate testable hypotheses about junction module expression, regulation and association to cancer phenotypes that can be implemented in validation experiments.
Similar interactive visualization can be also found within the DJE-CCLE section. Here, users can select the tissue of origin, the significance cutoff for differential expression, as well as target genes/junctions and junction-trait associations to be displayed in gene-wise splice and SpliceRadar plots (Supplementary Figure S5).
Case Study 2: Cancer Cell Line DJE Signature Is Recapitulated by Tumor Tissue Analysis in DJEC DB
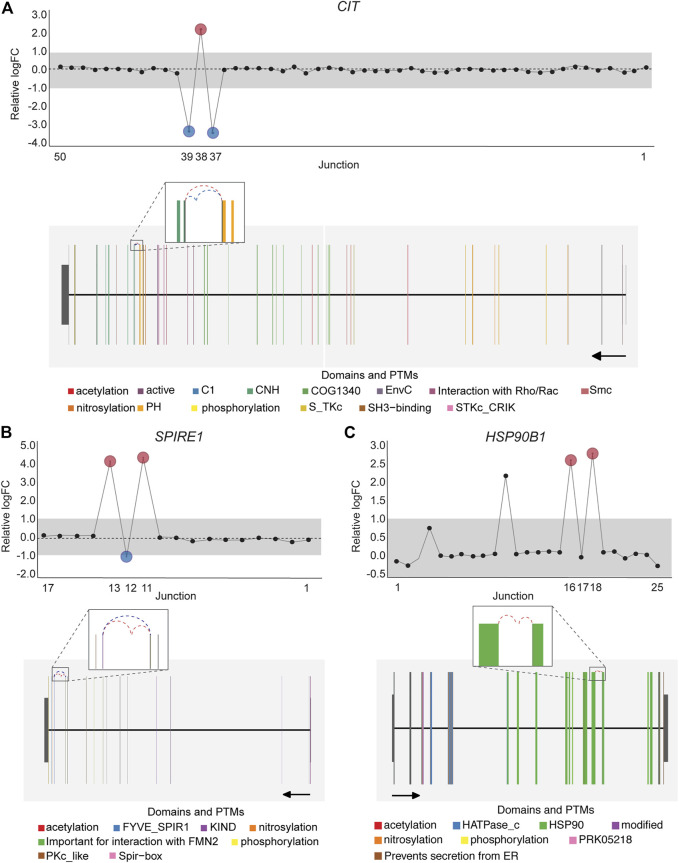
One of the central features of DJEC DB is the possibility to interrogate the presence of alternative splicing patterns observed in cancer cell lines in the context of tumor tissues. NUMB, VCL, MAP3K7 and EXOC1 exon skipping events are examples of known splicing events that can be also observed in tumor tissue (Supplementary Figures S12–S15). Notably, the presence of a differentially expressed non-annotated exon between exon 12 and 13 in SPIRE1, which we detected in cancer cell lines (Figure 7B), was also identified in BRCA, LUAD, KIPAN, PRAD, and THCA cohorts by DJEC DB data using gene-wise splicing visualization (Figure 9). This suggests that the alternative inclusion of this previously unknown region in SPIRE1 transcript may be a common feature across different cancer types in vitro and in vivo. These data demonstrate the applicability of DJEC DB in identifying and cross-validating potentially oncogenic alternative splicing patterns both in cancer cell lines and tumor tissue.
The JT module in DJEC DB provides a workflow to associate junction expression with user-provided molecular or clinical traits. In the case of CTNND1 splicing event, we found significant associations between the expression of exon 20 inclusion junctions and TP53 mutation status in BRCA, as well as with amplification of CCND1 gene and epigenetic silencing of CDKN2A in STES (Supplementary Figure S16). This is consistent with previous studies indicating that CCND1 isoforms expression regulates cell proliferation and cell cycle progression by controlling the levels of cyclin proteins in cancer cells (ref. Chartier et al., 2007; ref. Jiang et al., 2012; ref. Liu et al., 2014).
Taken together, these data corroborate DJEC DB as a valuable bioinformatics resource for the exploration and visualization of differential junction expression, as well as for the interrogation of physiologically relevant junction-trait associations in the context of global splicing analysis in cancer cell lines and tumor tissue.
Discussion
With the increasing availability of NGS data sets, the possibility to perform transcriptome-wide alternative splicing analysis has become a commonality rather than an exception in disease research. Nevertheless, computational analysis pipelines that allow the broad research community to effortlessly interrogate alternative splicing phenotypes are largely missing.
Our custom pipeline, DJExpress, aims to address this issue. With DJExpress, we have incorporated multiple existing algorithms in a novel computational approach for differential splicing analysis, which is suitable for analysis of small-scale as well as large-scale splice junction datasets. Moreover, DJExpress allows the analysis of millions of exon-exon boundaries per sample, using limma’s statistical framework. Limma’s algorithm has been shown to be highly accurate for gene expression analysis (ref. Law et al., 2014; ref. Corchete et al., 2020; ref. Gerard, 2020), although a comprehesive analysis of accuracy for splicing is beyond the scope of this work and remains as a future direction. Nevertheless, the implication of limma methodology proved to be highly flexible. This is not only the case in terms of model specification (any contrast in a linear model including the use of continuous as well as categorical predictors can be related to differential junction expression) but also for the various parameters introduced into the fit model, including posterior variance estimators, observation weights and variance modelling. These features, together with limma’s additional data pre-processing methods such as variance stabilization, all help to improve inference of differential junction expression.
Importantly and similar to gene expression studies (ref. Peixoto et al., 2015), removing or accounting for both known and unknown confounding factors (e.g., technical biases such as batch effects, or population structure such as molecular or clinical subtypes) is crucial when analyzing alternative splicing phenotypes in RNA-Seq data sets (ref. Slaff et al., 2021). Confounding factors can greatly increase the numbers of false positives and negatives, which ultimately will affect interpretation of potential biological relationships. Thus users should test for potential known confounder effects in their data, for example by using PCA or UMAP plots, and use dedicated tools to correct for confounders such as limma, ComBat, RUV, SVA and MOCCASIN (ref. Leek, 2014; ref. Risso et al., 2014; ref. Zhang et al., 2020; ref. Slaff et al., 2021).
Apart from these statistical aspects, DJExpress provides a comprehensive framework to graphically summarize differential splicing. The adapted limma-based visualization approach allows inspection of alternative splicing not only at the level of individual junction loci, but also in the presence of more complex splicing patterns. These can involve simultaneous changes in the expression of multiple junctions across the entire gene. This is particularly advantageous, considering that existing splicing analysis tools are either focused on the definition of local alternative splicing events which can be both simple (exon skipping, alternative 3′ or 5′ splice sites, etc.) or complex (simultaneous occurrence of multiple splice events in a given mRNA), or only allow detection of known transcript isoforms. Thus, most previous tools disregard the simultaneous visual representation of the full spectrum of up- and down-regulated splicing patterns in a gene that is retrieved through junction quantification. Broadly used exceptions are LeafCutter (ref. Li et al., 2018) and MAJIQ (ref. Vaquero-Garcia et al., 2016), which can both also represent complex splicing changes across the entire mRNA.
Notably, the differential junction usage analysis by DJExpress does not allow a direct assessment of intron retention events, which require intron and intron-exon junction read counts for their quantification. Nevertheless, dedicated tools such as MAJIQ (ref. Vaquero-Garcia et al., 2016), IRFinder (ref. Middleton et al., 2017), iREAD (ref. Li et al., 2020) or S-IRFinder (ref. Broseus and Ritchie, 2020) are specifically designed for quantification of intron retention events and are thus well-suited for this specific type of analysis.
Recently, RNA-seq data from TCGA and GTEx was integrated within a large transcriptomic profiling workflow, including splicing quantification of more than 20,000 human normal and tumor tissue samples (ref. Kahles et al., 2018). Although this study provided unified splicing data across healthy and tumor tissue, the analysis is based on the construction of complex splicing graphs across thousands of samples and genes which are difficult to access and interpret. Furthermore, approaches to explore the data in a graphically visualized format were not the scope of this previous study. This limited the availability and accessibility of this data for the general research community as well as the feasibility of splicing-trait association analyses using genomic, epigenetic, and clinical records available within the TCGA repository. These points are addressed by DJExpress and DJEC DB which facilitate easy access, analysis and visualization of cancer splicing data. Moreover, by providing a simple analysis workflow for custom data sets, our pipeline is not restricted to cancer researchers but can be used to pursue a broad variety of alternative splicing-related scientific questions.
In conjunction with the usability of the DJExpress for differential splicing analysis and visualization using custom RNA-Seq data, the multidimensional integration of cancer data within DJEC DB represents a comprehensive resource of cancer-specific splicing signatures and junction-trait associations. We demonstrated that our pipeline has the potential to unveil novel splicing-related molecular signatures, which may contribute to improved patient stratification and more effective cancer treatment strategies. Moreover, the integration of DepMap data allows association of junction expression with molecular features such as gene dependencies and drug response profiles. This will help researchers to identify cancer cell models for specific splicing alterations that can then be used for functional characterization in the lab.
Another recently established cancer splicing repository, RJunBase (ref. Li et al., 2021), follows a similar splicing analysis strategy as DJEC DB. While focusing on back-splice and fusion junctions, RJunBase provides splicing patterns at junction level and median junction expression information in GTEx and TCGA samples. However, it lacks differential junction expression analyses between cancer and healthy tissue and does not include association of splice events with molecular or clinical data. Thus, compared to RJunBase, DJEC DB not only includes differential junction expression analyses but also provides functional associations of splicing changes with phenotypic traits. These features make DJEC DB a comprehensive data base that can facilitate the discovery of novel cancer-related aberrant splicing patterns with potential phenotypic consequences.
Taken together, DJExpress provides researchers with a comprehensive toolbox for exploration of alternative splicing phenotypes in health and disease, and, with DJEC DB, includes multi-level data of alternative splicing signatures in healthy tissue, tumors and cancer cell lines.
References
- G. P. Alamancos, A. Pagès, J. L. Trincado, N. Bellora, E. Eyras. Leveraging Transcript Quantification for Fast Computation of Alternative Splicing Profiles.. RNA, 2015. [DOI | PubMed]
- N. L. Barbosa-Morais, M. Irimia, Q. Pan, H. Y. Xiong, S. Gueroussov, L. J. Lee. The Evolutionary Landscape of Alternative Splicing in Vertebrate Species.. Science, 2012. [DOI | PubMed]
- E. G. Bechara, E. Sebestyén, I. Bernardis, E. Eyras, J. Valcárcel. RBM5, 6, and 10 Differentially Regulate NUMB Alternative Splicing to Control Cancer Cell Proliferation.. Mol. Cel, 2013. [DOI]
- P. Bielli, V. Panzeri, R. Lattanzio, S. Mutascio, M. Pieraccioli, E. Volpe. The Splicing Factor PTBP1 Promotes Expression of Oncogenic Splice Variants and Predicts Poor Prognosis in Patients with Non-muscle-invasive Bladder Cancer.. Clin. Cancer Res., 2018. [DOI | PubMed]
- N. L. Bray, H. Pimentel, P. Melsted, L. Pachter. Erratum: Near-Optimal Probabilistic RNA-Seq Quantification.. Nat. Biotechnol., 2016. [DOI]
- L. Broseus, W. Ritchie. S-IRFindeR: Stable and Accurate Measurement of Intron Retention.. bioRxiv, 20202020. [DOI]
- N. T. Chartier, C. I. Oddou, M. G. Lainé, B. Ducarouge, C. A. Marie, M. R. Block. Cyclin-dependent Kinase 2/cyclin E Complex Is Involved in P120 Catenin (P120ctn)-dependent Cell Growth Control: A New Role for P120ctn in Cancer.. Cancer Res., 2007. [DOI | PubMed]
- C. Chen, S. Zhao, A. Karnad, J. W. Freeman. The Biology and Role of CD44 in Cancer Progression: Therapeutic Implications.. J. Hematol. Oncol., 2018. [DOI | PubMed]
- H. Chen, X. Chen, F. Ye, W. Lu, X. Xie. Symmetric Division and Expression of its Regulatory Gene Numb in Human Cervical Squamous Carcinoma Cells.. Pathobiology, 2009. [DOI | PubMed]
- K. L. Chen, D. Li, T. X. Lu, S. W. Chang. Structural Characterization of the CD44 Stem Region for Standard and Cancer-Associated Isoforms.. Int. J. Mol. Sci., 2020. [DOI]
- L. A. Corchete, E. A. Rojas, D. Alonso-López, J. De Las Rivas, N. C. Gutiérrez, F. J. Burguillo. Systematic Comparison and Assessment of RNA-Seq Procedures for Gene Expression Quantitative Analysis.. Sci. Rep., 2020. [DOI | PubMed]
- DepMap 21Q3 Public. DepMap 21Q3 Public.. 2021
- A. Dobin, C. A. Davis, F. Schlesinger, J. Drenkow, C. Zaleski, S. Jha. STAR: Ultrafast Universal RNA-Seq Aligner.. Bioinformatics, 2013. [DOI | PubMed]
- D. Emig, N. Salomonis, J. Baumbach, T. Lengauer, B. R. Conklin, M. Albrecht. AltAnalyze and DomainGraph: Analyzing and Visualizing Exon Expression Data.. Nucleic Acids Res., 2010. [DOI | PubMed]
- L. M. Gallego-Paez, M. C. Bordone, A. C. Leote, N. Saraiva-Agostinho, M. Ascensão-Ferreira, N. L. Barbosa-Morais. Alternative Splicing: the Pledge, the Turn, and the Prestige : The Key Role of Alternative Splicing in Human Biological Systems.. Hum. Genet., 2017. [DOI | PubMed]
- P. J. Gardina, T. A. Clark, B. Shimada, M. K. Staples, Q. Yang, J. Veitch. Alternative Splicing and Differential Gene Expression in Colon Cancer Detected by a Whole Genome Exon Array.. BMC Genomics, 2006. [DOI | PubMed]
- D. Gerard. Data-based RNA-Seq Simulations by Binomial Thinning.. BMC Bioinformatics, 2020. [DOI | PubMed]
- Z. Hu, J. Mellor, J. Wu, C. DeLisi. VisANT: An Online Visualization and Analysis Tool for Biological Interaction Data.. BMC Bioinformatics, 2004. [DOI | PubMed]
- M. Irimia, R. J. Weatheritt, J. D. Ellis, N. N. Parikshak, T. Gonatopoulos-Pournatzis, M. Babor. A Highly Conserved Program of Neuronal Microexons Is Misregulated in Autistic Brains.. Cell, 2014. [DOI | PubMed]
- G. Jiang, Y. Wang, S. Dai, Y. Liu, M. Stoecker, E. Wang. P120-catenin Isoforms 1 and 3 Regulate Proliferation and Cell Cycle of Lung Cancer Cells via β-catenin and Kaiso Respectively.. PLoS One, 2012. [DOI | PubMed]
- W. Jiang, L. Chen. Alternative Splicing: Human Disease and Quantitative Analysis from High-Throughput Sequencing.. Comput. Struct. Biotechnol. J., 2021. [DOI | PubMed]
- A. Kahles, K. V. Lehmann, N. C. Toussaint, M. Hüser, S. G. Stark, T. Sachsenberg. Comprehensive Analysis of Alternative Splicing across Tumors from 8,705 Patients.. Cancer Cell, 2018. [DOI | PubMed]
- A. Kahles, C. S. Ong, Y. Zhong, G. Rätsch. SplAdder: Identification, Quantification and Testing of Alternative Splicing Events from RNA-Seq Data.. Bioinformatics, 2016. [DOI | PubMed]
- Y. Katz, E. T. Wang, E. M. Airoldi, C. B. Burge. Analysis and Design of RNA Sequencing Experiments for Identifying Isoform Regulation.. Nat. Methods, 2010. [DOI | PubMed]
- P. Langfelder, S. Horvath. WGCNA: An R Package for Weighted Correlation Network Analysis.. BMC Bioinformatics, 2008. [DOI | PubMed]
- C. W. Law, Y. Chen, W. Shi, G. K. Smyth. Voom: Precision Weights Unlock Linear Model Analysis Tools for RNA-Seq Read Counts.. Genome Biol., 2014. [DOI | PubMed]
- J. T. Leek. Svaseq: Removing Batch Effects and Other Unwanted Noise from Sequencing Data.. Nucleic Acids Res., 2014. [DOI]
- B. Li, C. N. Dewey. RSEM: Accurate Transcript Quantification from RNA-Seq Data with or without a Reference Genome.. BMC Bioinformatics, 2011. [DOI | PubMed]
- H. D. Li, C. C. Funk, N. D. Price. IREAD: A Tool for Intron Retention Detection from RNA-Seq Data.. BMC Genomics, 2020. [DOI | PubMed]
- Q. Li, H. Lai, Y. Li, B. Chen, S. Chen, Y. Li. RJunBase: A Database of RNA Splice Junctions in Human normal and Cancerous Tissues.. Nucleic Acids Res., 2021. [DOI | PubMed]
- Y. I. Li, D. A. Knowles, J. Humphrey, A. N. Barbeira, S. P. Dickinson, H. K. Im. Annotation-free Quantification of RNA Splicing Using LeafCutter.. Nat. Genet., 2018. [DOI | PubMed]
- Y. Liao, G. K. Smyth, W. Shi. The R Package Rsubread Is Easier, Faster, Cheaper and Better for Alignment and Quantification of RNA Sequencing Reads.. Nucleic Acids Res., 2019. [DOI | PubMed]
- X. Liu, T. C. Caffrey, M. M. Steele, A. Mohr, P. K. Singh, P. Radhakrishnan. MUC1 Regulates Cyclin D1 Gene Expression through P120 Catenin and β-catenin.. Oncogenesis, 20142014. [DOI]
- J. Lonsdale, J. Thomas, M. Salvatore, R. Phillips, E. Lo, S. Shad. The Genotype-Tissue Expression (GTEx) Project.. Nat. Genet., 2013. [DOI | PubMed]
- Y. Lu, W. Xu, J. Ji, D. Feng, C. Sourbier, Y. Yang. Alternative Splicing of the Cell Fate Determinant Numb in Hepatocellular Carcinoma.. Hepatology, 2015. [DOI | PubMed]
- C. Ma, Q. Lv, S. Teng, Y. Yu, K. Niu, C. Yi. Identifying Key Genes in Rheumatoid Arthritis by Weighted Gene Co-expression Network Analysis.. Int. J. Rheum. Dis., 2017. [DOI | PubMed]
- M. A. McGill, S. E. Dho, G. Weinmaster, C. J. McGlade. Numb Regulates post-endocytic Trafficking and Degradation of Notch1.. J. Biol. Chem., 2009. [DOI | PubMed]
- R. Middleton, D. Gao, A. Thomas, B. Singh, A. Au, J. J. Wong. IRFinder: Assessing the Impact of Intron Retention on Mammalian Gene Expression.. Genome Biol., 2017. [DOI | PubMed]
- C. M. Misquitta-Ali, E. Cheng, D. O’Hanlon, N. Liu, C. J. McGlade, M. S. Tsao. Global Profiling and Molecular Characterization of Alternative Splicing Events Misregulated in Lung Cancer.. Mol. Cel. Biol., 2011. [DOI]
- J. Munkley, L. Li, S. R. G. Krishnan, G. Hysenaj, E. Scott, C. Dalgliesh. Androgen-regulated Transcription of ESRP2 Drives Alternative Splicing Patterns in Prostate Cancer.. Elife, 2019. [DOI]
- T. Nishimura, K. Kaibuchi. Numb Controls Integrin Endocytosis for Directional Cell Migration with aPKC and PAR-3.. Dev. Cel, 2007. [DOI]
- J. Oh, D. Pradella, Y. Kim, C. Shao, H. Li, N. Choi. Global Alternative Splicing Defects in Human Breast Cancer Cells.. Cancers (Basel), 2021. [DOI | PubMed]
- M. C. Oldham, G. Konopka, K. Iwamoto, P. Langfelder, T. Kato, S. Horvath. Functional Organization of the Transcriptome in Human Brain.. Nat. Neurosci., 2008. [DOI | PubMed]
- S. Oltean, D. O. Bates. Hallmarks of Alternative Splicing in Cancer.. Oncogene, 2014. [DOI | PubMed]
- M. P. Paronetto, I. Passacantilli, C. Sette. Alternative Splicing and Cell Survival: From Tissue Homeostasis to Disease.. Cell Death Differ, 2016. [DOI | PubMed]
- R. Patro, G. Duggal, M. I. Love, R. A. Irizarry, C. Kingsford. Salmon Provides Fast and Bias-Aware Quantification of Transcript Expression.. Nat. Methods, 2017. [DOI | PubMed]
- R. Patro, S. M. Mount, C. Kingsford. Sailfish Enables Alignment-free Isoform Quantification from RNA-Seq Reads Using Lightweight Algorithms.. Nat. Biotechnol., 2014. [DOI | PubMed]
- L. Peixoto, D. Risso, S. G. Poplawski, M. E. Wimmer, T. P. Speed, M. A. Wood. How Data Analysis Affects Power, Reproducibility and Biological Insight of RNA-seq Studies in Complex Datasets.. Nucleic Acids Res., 2015. [DOI | PubMed]
- A. P. Presson, E. M. Sobel, J. C. Papp, C. J. Suarez, T. Whistler, M. S. Rajeevan. Integrated Weighted Gene Co-expression Network Analysis with an Application to Chronic Fatigue Syndrome.. BMC Syst. Biol., 2008. [DOI | PubMed]
- Y. Qiu, J. Lyu, M. Dunlap, S. E. Harvey, C. Cheng. A Combinatorially Regulated RNA Splicing Signature Predicts Breast Cancer EMT States and Patient Survival.. RNA, 2020. [DOI | PubMed]
- D. Rajendran, Y. Zhang, D. M. Berry, C. J. McGlade. Regulation of Numb Isoform Expression by Activated ERK Signaling.. Oncogene, 2016. [DOI | PubMed]
- D. Ray, Y. C. Yun, M. Idris, S. Cheng, A. Boot, T. B. H. Iain. A Tumor-Associated Splice-Isoform of MAP2K7 Drives Dedifferentiation in MBNL1-Low Cancers via JNK Activation.. Proc. Natl. Acad. Sci. U. S. A., 2020. [DOI | PubMed]
- D. Risso, J. Ngai, T. P. Speed, S. Dudoit. Normalization of RNA-Seq Data Using Factor Analysis of Control Genes or Samples.. Nat. Biotechnol., 2014. [DOI | PubMed]
- M. E. Ritchie, B. Phipson, D. Wu, Y. Hu, C. W. Law, W. Shi. Limma powers Differential Expression Analyses for RNA-Sequencing and Microarray Studies.. Nucleic Acids Res., 2015. [DOI | PubMed]
- M. C. Ryan, J. Cleland, R. Kim, W. C. Wong, J. N. Weinstein. SpliceSeq: A Resource for Analysis and Visualization of RNA-Seq Data on Alternative Splicing and its Functional Impacts.. Bioinformatics, 2012. [DOI | PubMed]
- F. Sanchez-Vega, M. Mina, J. Armenia, W. K. Chatila, A. Luna, K. C. La. Oncogenic Signaling Pathways in the Cancer Genome Atlas.. Cell, 2018. [DOI | PubMed]
- N. Saraiva-Agostinho, N. L. Barbosa-Morais. Psichomics: Graphical Application for Alternative Splicing Quantification and Analysis.. Nucleic Acids Res., 2019. [DOI | PubMed]
- M. M. Scotti, M. S. Swanson. RNA Mis-Splicing in Disease.. Nat. Rev. Genet., 2016. [DOI | PubMed]
- E. Sebestyen, M. Zawisza, E. Eyras. Detection of Recurrent Alternative Splicing Switches in Tumor Samples Reveals Novel Signatures of Cancer.. Nucleic Acids Res., 2015
- A. A. Shabalin. Matrix eQTL: Ultra Fast eQTL Analysis via Large Matrix Operations.. Bioinformatics, 2012. [DOI | PubMed]
- P. Shannon, A. Markiel, O. Ozier, N. S. Baliga, J. T. Wang, D. Ramage. Cytoscape: A Software Environment for Integrated Models of Biomolecular Interaction Networks.. Genome Res., 2003. [DOI | PubMed]
- S. Shen, J. W. Park, Z. X. Lu, L. Lin, M. D. Henry, Y. N. Wu. rMATS: Robust and Flexible Detection of Differential Alternative Splicing from Replicate RNA-Seq Data.. Proc. Natl. Acad. Sci. U. S. A., 2014. [DOI | PubMed]
- V. S. Shirure, T. Liu, L. F. Delgadillo, C. M. Cuckler, D. F. Tees, F. Benencia. CD44 Variant Isoforms Expressed by Breast Cancer Cells Are Functional E-Selectin Ligands under Flow Conditions.. Am. J. Physiol. Cel Physiol, 2015. [DOI]
- B. Slaff, C. M. Radens, P. Jewell, A. Jha, N. F. Lahens, G. R. Grant. MOCCASIN: a Method for Correcting for Known and Unknown Confounders in RNA Splicing Analysis.. Nat. Commun., 2021. [DOI | PubMed]
- D. Stanek, D. M. Bis-Brewer, C. Saghira, M. C. Danzi, P. Seeman, P. Lassuthova. Prot2HG: A Database of Protein Domains Mapped to the Human Genome.. Database (Oxford), 2020. [DOI]
- T. Sterne-Weiler, R. J. Weatheritt, A. J. Best, K. C. H. Ha, B. J. Blencowe. Efficient and Accurate Quantitative Profiling of Alternative Splicing Patterns of Any Complexity on a Laptop.. Mol. Cel, 2018. [DOI]
- A. Teckchandani, N. Toida, J. Goodchild, C. Henderson, J. Watts, B. Wollscheid. Quantitative Proteomics Identifies a Dab2/integrin Module Regulating Cell Migration.. J. Cel Biol., 2009. [DOI]
- K. Thorsen, K. D. Sørensen, A. S. Brems-Eskildsen, C. Modin, M. Gaustadnes, A. M. Hein. Alternative Splicing in colon, Bladder, and Prostate Cancer Identified by Exon Array Analysis.. Mol. Cel. Proteomics, 2008. [DOI]
- K. Tomczak, P. Czerwińska, M. Wiznerowicz. The Cancer Genome Atlas (TCGA): An Immeasurable Source of Knowledge.. Contemp. Oncol. (Pozn), 2015. [DOI | PubMed]
- C. Trapnell, L. Pachter, S. L. Salzberg. TopHat: Discovering Splice Junctions with RNA-Seq.. Bioinformatics, 2009. [DOI | PubMed]
- C. Trapnell, B. A. Williams, G. Pertea, A. Mortazavi, G. Kwan, M. J. Van Baren. Transcript Assembly and Quantification by RNA-Seq Reveals Unannotated Transcripts and Isoform Switching during Cell Differentiation.. Nat. Biotechnol., 2010. [DOI | PubMed]
- J. Vaquero-Garcia, A. Barrera, M. R. Gazzara, J. González-Vallinas, N. F. Lahens, J. B. Hogenesch. A New View of Transcriptome Complexity and Regulation through the Lens of Local Splicing Variations.. Elife, 2016. [DOI | PubMed]
- J. M. Verdi, A. Bashirullah, D. E. Goldhawk, C. J. Kubu, M. Jamali, S. O. Meakin. Distinct Human NUMB Isoforms Regulate Differentiation vs. Proliferation in the Neuronal Lineage.. Proc. Natl. Acad. Sci. U. S. A., 1999. [DOI | PubMed]
- S. E. Vieira, S. Y. Bando, M. De Paulis, D. B. L. Oliveira, L. M. Thomazelli, E. L. Durigon. Distinct Transcriptional Modules in the Peripheral Blood Mononuclear Cells Response to Human Respiratory Syncytial Virus or to Human Rhinovirus in Hospitalized Infants with Bronchiolitis.. PLoS One, 2019. [DOI | PubMed]
- E. T. Wang, R. Sandberg, S. Luo, I. Khrebtukova, L. Zhang, C. Mayr. Alternative Isoform Regulation in Human Tissue Transcriptomes.. Nature, 2008. [DOI | PubMed]
- K. Wang, D. Singh, Z. Zeng, S. J. Coleman, Y. Huang, G. L. Savich. MapSplice: Accurate Mapping of RNA-Seq Reads for Splice junction Discovery.. Nucleic Acids Res., 2010. [DOI | PubMed]
- Y. Wang, S. X. Chen, X. Rao, Y. Liu. Modulator-Dependent RBPs Changes Alternative Splicing Outcomes in Kidney Cancer.. Front. Genet., 2020. [DOI | PubMed]
- Z. Wang, S. Sandiford, C. Wu, S. S. Li. Numb Regulates Cell-Cell Adhesion and Polarity in Response to Tyrosine Kinase Signalling.. EMBO J., 2009. [DOI | PubMed]
- Z. Wang, K. Zhao, T. Hackert, M. Zöller. CD44/CD44v6 a Reliable Companion in Cancer-Initiating Cell Maintenance and Tumor Progression.. Front. Cel Dev. Biol., 2018. [DOI]
- R. R. Wilcox. Introduction to Robust Estimation and Hypothesis Testing., 2012. [DOI]
- M. Yanagisawa, D. Huveldt, P. Kreinest, C. M. Lohse, J. C. Cheville, A. S. Parker. A P120 Catenin Isoform Switch Affects Rho Activity, Induces Tumor Cell Invasion, and Predicts Metastatic Disease.. J. Biol. Chem., 2008. [DOI | PubMed]
- B. Zhang, S. Horvath. A General Framework for Weighted Gene Co-expression Network Analysis.. Stat. Appl. Genet. Mol. Biol., 2005. [DOI | PubMed]
- S. Zhang, Y. Bao, X. Shen, Y. Pan, Y. Sun, M. Xiao. RNA Binding Motif Protein 10 Suppresses Lung Cancer Progression by Controlling Alternative Splicing of Eukaryotic Translation Initiation Factor 4H.. EBioMedicine, 2020a. [DOI | PubMed]
- S. Zhang, Y. Liu, Z. Liu, C. Zhang, H. Cao, Y. Ye. Transcriptome Profiling of a Multiple Recurrent Muscle-Invasive Urothelial Carcinoma of the Bladder by Deep Sequencing.. PLoS One, 2014. [DOI | PubMed]
- Y. Zhang, G. Parmigiani, W. E. Johnson. ComBat-seq: Batch Effect Adjustment for RNA-Seq Count Data.. NAR Genom Bioinform, 2020b. [DOI | PubMed]
- F. Y. Zong, X. Fu, W. J. Wei, Y. G. Luo, M. Heiner, L. J. Cao. The RNA-Binding Protein QKI Suppresses Cancer-Associated Aberrant Splicing.. Plos Genet., 2014. [DOI | PubMed]