A novel four‐gene signature predicts immunotherapy response of patients with different cancers
Abstract
Background:
Immune checkpoint blockade (ICB) therapy has demonstrated favorable clinical efficacy, particularly for advanced or difficult‐to‐treat cancer types. However, this therapy is ineffective for many patients displaying lack of immune response or resistance to ICB. This study aimed to establish a novel four‐gene signature (CD8A, CD8B, TCF7, and LEF1) to provide a prognostic immunotherapy biomarker for different cancers.
Methods:
Transcriptome profiles and clinical data were obtained from The Cancer Genome Atlas database. Multivariate Cox regression analysis was used to establish a four‐gene signature. The R package estimate was used to obtain the immune score for every patient.
Results:
Risk scores of the novel four‐gene signature could effectively divided all patients into high‐ and low‐risk groups, with distinct outcomes. The immune score calculated via the estimate package demonstrated that the four‐gene signature was significantly associated with the immune infiltration level. Furthermore, the four‐gene signature could predict the response to atezolizumab immunotherapy in patients with metastatic urothelial cancer.
Conclusions:
The novel four‐gene signature developed in this study is a good prognostic biomarker, as it could identify many kinds of patients with cancer who are likely to respond to and benefit from immunotherapy.
Article type: Research Article
Keywords: cancer, immune checkpoint‐blockade
Affiliations: Department of Biochemistry and Molecular Biology, School of Basic Medical Sciences Anhui Medical University Hefei China; Department of Dermatology Anhui Provincial Hospital Affiliated to Anhui Medical University Hefei China; Department of Clinical Medicine (5+3 Programme) Anhui Medical University Hefei China
License: © 2022 The Authors. Journal of Clinical Laboratory Analysis published by Wiley Periodicals LLC. CC BY 4.0 This is an open access article under the terms of the http://creativecommons.org/licenses/by/4.0/ License, which permits use, distribution and reproduction in any medium, provided the original work is properly cited.
Article links: DOI: 10.1002/jcla.24494 | PubMed: 35588138 | PMC: PMC9279975
Relevance: Moderate: mentioned 3+ times in text
Full text: PDF (6.6 MB)
INTRODUCTION
Cancer immunotherapy using immune checkpoint blockade (ICB) drugs that target programmed cell death 1 (PD1), programmed cell death 1 ligand 1 (PD‐L1), and cytotoxic T‐lymphocyte‐associated protein 4 (CTLA‐4) is a promising treatment strategy that can produce a durable response, especially for patients with metastatic cancers. Nevertheless, many patients with cancer fail to respond to immunotherapy or achieve durable remission. The objective response rate of ICB is maintained at 13%–27.3% in many tumors, such as non‐small‐cell lung cancer (NSCLC),ref. jcla24494-bib-0001, ref. jcla24494-bib-0002, ref. jcla24494-bib-0003, ref. jcla24494-bib-0004, ref. jcla24494-bib-0005 urothelial carcinoma,ref. jcla24494-bib-0006 renal cell carcinoma (RCC),ref. jcla24494-bib-0007, ref. jcla24494-bib-0008, ref. jcla24494-bib-0009, ref. jcla24494-bib-0010 triple‐negative breast cancer (TNBC),ref. jcla24494-bib-0011 liver hepatocellular carcinoma (LIHC),ref. jcla24494-bib-0012, ref. jcla24494-bib-0013 thyroid carcinoma (THCA),ref. jcla24494-bib-0014 adrenocortical carcinoma (ACC), and uveal melanoma (UVM).ref. jcla24494-bib-0015 A small percentage of patients receiving anti‐CTLA‐4/B7 or anti‐PD1/PD‐L1 therapy experienced prolonged survival. Thus, the combination of anti‐CTLA‐4/B7 with anti‐PD1/PD‐L1 therapy may have promising clinical efficacy.ref. jcla24494-bib-0016 To apply immunotherapy to many types of cancers, it is pivotal to predict the immune responses and clinical outcomes of patients with metastatic cancer prior to treatment, and to enhance the response to immunotherapy of recalcitrant patients, whose cancer cells may be more resistant to ICB agents.
Previous studies have reported that PD‐L1 expression in tumor cells can be used to predict clinical responses to ICB therapy.ref. jcla24494-bib-0005, ref. jcla24494-bib-0017, ref. jcla24494-bib-0018 However, some patients with PD‐L1‐negative melanoma can also derive durable clinical benefits from PD‐1 blockade.ref. jcla24494-bib-0019 Notably, T cells play a crucial role in immune defense against cancer.ref. jcla24494-bib-0020, ref. jcla24494-bib-0021, ref. jcla24494-bib-0022, ref. jcla24494-bib-0023 In particular, the level of tumor‐infiltrating CD8+ T lymphocytes is often a predictor of patient survival and response to immunotherapy,ref. jcla24494-bib-0024, ref. jcla24494-bib-0025, ref. jcla24494-bib-0026, ref. jcla24494-bib-0027, ref. jcla24494-bib-0028, ref. jcla24494-bib-0029, ref. jcla24494-bib-0030, ref. jcla24494-bib-0031 and both anti‐CTLA‐4 and anti‐PD‐1 treatments can induce CD8+ T‐cell expansion. However, not all CD8+ T‐cell subsets exhibit this behavior.ref. jcla24494-bib-0032
Some memory CD8+ T cells in human lymph nodes are highly similar to a subset of mouse CD8+ T cells, identified in chronic infection models, that respond to checkpoint blockade immunotherapy. These cells exhibit a distinct transcriptional signature, including the expression of lymphoid enhancer binding factor 1 (LEF1) and T‐cell‐specific transcription factor 7 (TCF7).ref. jcla24494-bib-0033 TCF7 and LEF1 are historically known as effector transcription factors acting downstream of the WNT signaling pathway, and are essential for early T‐cell development.ref. jcla24494-bib-0034, ref. jcla24494-bib-0035 A group of CD8+ T cells displaying hallmarks of exhausted cells and central memory cells was identified; notably, TCF7 expression was required for the generation of this CD8+ T‐cell subset, which exhibited a proliferative burst after PD1 blockade.ref. jcla24494-bib-0034, ref. jcla24494-bib-0036, ref. jcla24494-bib-0037 The “progenitor” or “stem‐like” exhausted cells were a subset of exhausted CD8+ tumor‐infiltrating lymphocytes that persisted long term and retained polyfunctionality. Moreover, melanoma patients displaying a higher percentage of progenitor exhausted cells experienced more durable response to checkpoint blockade therapy.ref. jcla24494-bib-0038 Stem‐like CD8+ T cells in human tumors have been confirmed to be stem‐like CD8+ T cells expressing TCF7, which divide into terminally differentiated cells that express effector molecules. Additionally, initiation of effector differentiation is critical for the infiltration of many T cells into the tumor.ref. jcla24494-bib-0039
TCF7 and LEF1, belonging to the high‐mobility group (HMG) family owing to their conserved HMG DNA‐binding domains, are well‐known stem cell‐associated transcription factors that are usually expressed in CD8+ T cells,ref. jcla24494-bib-0040, ref. jcla24494-bib-0041 and play critical roles in establishing CD8+ T‐cell identity through their intrinsic histone deacetylase activity.ref. jcla24494-bib-0042, ref. jcla24494-bib-0043 These proteins also play vital roles in the regulation of CD8+ T‐cell function and differentiation.
The CD8 antigen, acting as a co‐receptor of T lymphocytes, is composed of the isoforms CD8 alpha chain and CD8 beta chain, which are encoded by CD8A and CD8B, respectively. Granzyme A (GZMA) and granzyme B (GZMB) are T cell‐ and natural killer cell‐specific serine proteases, which may function as common components necessary for the lysis of target cells by cytotoxic T lymphocytes (CTLs) and natural killer cells. Perforin 1 (PRF1) forms membrane pores that allow the release of granzymes and the subsequent cytolysis of target cells. Previous studies have shown that the average expression levels of CD8A, CD8B, GZMA, GZMB, and PRF1 can be used to estimate CTL levels in a tumor.ref. jcla24494-bib-0044 Therefore, CD8A, CD8B, TCF7, and LEF1 expression may reveal the presence of stem‐like CD8+ T cells and may be thus used as a reliable immunotherapy biomarker to predict ICB outcomes. In the current study, we established an immune‐related four‐gene signature (CD8A, CD8B, TCF7, and LEF1) based on multivariable Cox regression analysis of transcriptome profiles downloaded from The Cancer Genome Atlas (TCGA) database, and assessed whether the four‐gene signature could predict the clinical responses and treatment benefits of patients with various types of cancer before the beginning of immunotherapy.
MATERIALS AND METHODS
Patient cohorts
Transcriptome profiles (RNA‐seq profiles) and clinical information were obtained from the TCGA database (https://cancergenome.nih.gov/). Reads per kilobase per million (RPKM) indicates the gene expression levels in different cancer patients. Ten types of cancers were included in this study: Breast cancer (BRCA), skin cutaneous melanoma (SKCM), lower‐grade glioma (LGG), kidney renal papillary cell carcinoma (KIRP), rectum adenocarcinoma (READ), kidney renal clear cell carcinoma (KIRC), THCA, LIHC, ACC, and UVM (Table S1). Data from patients with metastatic urothelial cancer (mUC) treated with atezolizumab (an anti‐PD‐L1 agent) were obtained from the R package IMvigor210CoreBiologies (version 1.0.0).ref. jcla24494-bib-0045
Statistical analysis
All statistical and bioinformatics analyses were performed in R (version 4.0.1).
Identification of Differentially Expressed Genes (DEGs)
Differential expression analysis for the four genes CD8A, CD8B, TCF7, and LEF1 between tumor and normal tissues was performed using edge R (version 3.30.3).
Functional and pathway enrichment analyses
Gene Ontology (GO) and Kyoto Encyclopedia of Genes and Genomes (KEGG) analyses were performed using the R package clusterProfiler (version 3.16.0) to investigate the functional and pathway enrichment associated to the four genes CD8A, CD8B, TCF7, and LEF1. The terms were sorted by their p value.
Cox proportional hazards regression model and risk score
The four‐gene signature (CD8A, CD8B, TCF7, and LEF1) was created as a prognostic model that was used to calculate the risk score of each patient based on multivariable Cox regression analysis. The mean risk score value was used as a threshold, according to which the patients were divided into high‐ and low‐risk groups. The C‐index was used to evaluate the validation of the four‐gene signature prognostic model. Time‐dependent receiver operating characteristic (ROC) curves were used to assess the sensitivity and specificity of the four‐gene signature. Multivariate Cox regression analysis was performed using the R package survival (version 3.2–3).
Survival curve analysis
Survival results were expressed as Kaplan–Meier (KM) curves, and statistical significance was assessed using the log‐rank test. Receiver operating characteristic (ROC) curve analysis was performed using the R package survival ROC (version 1.0.3). Statistical significance was set at p < 0.05.
Immune infiltration analysis
Immune scores, which represent the immune infiltration levels of patients, were calculated with the R package estimate (version 1.0.13)ref. jcla24494-bib-0046 based on the TCGA RNA‐seq database.
RESULTS
Prognosis prediction for BRCA
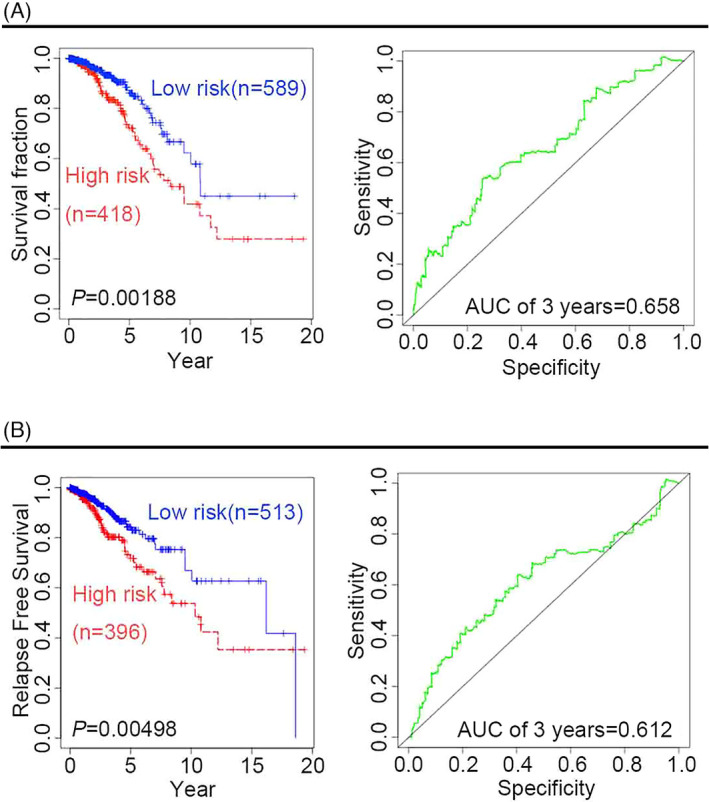
To assess the predictive ability of the four‐gene signature (CD8A, CD8B, TCF7, and LEF1), multivariate analysis was performed using Cox proportional hazard regression for patients with BRCA. The resulting KM survival curves and log‐rank tests pointed at significant differences in both clinical survival outcomes (Figure 1A) and relapse‐free survival (RFS) outcomes (Figure 1B) between high‐risk and low‐risk patients (p < 0.01), confirming the robustness of the four‐gene signature predictive capacity. The analysis of time‐dependent ROC curves revealed that the 3‐year overall survival (OS) and RFS of the area under the curve (AUC) were 0.658 and 0.612, respectively.
To further confirm the predictive ability of the four‐gene signature, we performed survival analysis in different BRCA pathological subtypes. There are four pathological subtypes of human BRCA: estrogen receptor (ER)‐positive BRCA, progesterone receptor (PR)‐positive BRCA, human epidermal growth factor receptor 2 (HER2)‐positive BRCA, and TNBC. Compared with low‐risk patients with BRCA, high‐risk patients have poor outcomes, suggesting that the predictive capacity of the four‐gene signature is independent of the pathological subtype of BRCA, the time‐dependent ROC curves for the 3‐year OS of patients with ER‐positive, PR‐positive, HER2‐positive, and TNBC BRCA were 0.748, 0.803, 0.85, and 0.651, respectively (Figure 2A–D).Given that age and tumor stage may be unfavorable factors for survival outcomes, it is necessary to further examine the predictive value of the four‐gene signature to predict survival outcomes for cancer patients in different age groups or at different tumor stages. Two age groups of patients with BRCA were selected in this study: an older group (age >60 years) and a younger group (age ≤60 years). KM curves and log‐rank test suggested that the four‐gene signature might be more suitable for predicting survival outcomes in the older group than in the younger group. In fact, the ROC for the 3‐year OS in the older group was 0.625, whereas the ROC for the 5‐year OS in the younger group was 0.706 (Figure 3A,B). Considering the different stages of BRCA from the American Joint Committee on Cancer (AJCC), the four‐gene signature was used to predict the survival outcomes of patients with cancer at different stages, namely stages 1, 2, 3, and 4. KM curves and log‐rank tests indicated that the four‐gene signature might be more robust for patients with BRCA at stages 2, 3, and 4 than for those at stage 1. The ROC for the 5‐year OS of stage 2 patients was 0.656, while that for the 5‐year OS of stage 3 and 4 patients was 0.807 (Figure 3C,D). Both univariate and multivariate Cox regression analyses were performed to assess whether the four‐gene prognostic signature could serve as an independent prognostic factor. In addition to the risk score, covariates included clinical risk factors, such as age and tumor stage. Univariate Cox regression analysis showed that the risk score (hazard ratio [HR]: 1.955; 95% confidence interval [CI]: 1.467–2.605; p = 0.00000476), age (HR: 1.031; 95% CI: 1.015–1.048; p = 0:000148), and tumor stage (HR: 1.834; 95% CI: 1.410–2.384; p = 0.00000605) were significantly associated with OS in patients with BRCA. Multivariate Cox regression analysis confirmed that the risk score (HR: 1.893; 95% CI: 1.393–2.574; p = 0.0000463) was independent of age (HR: 1.03; 95% CI: 1.013–1.046; p = 0.000385) and tumor stage (HR: 1.788; 95% CI: 1.386–2.307; p = 0.00000767) (Table 1).
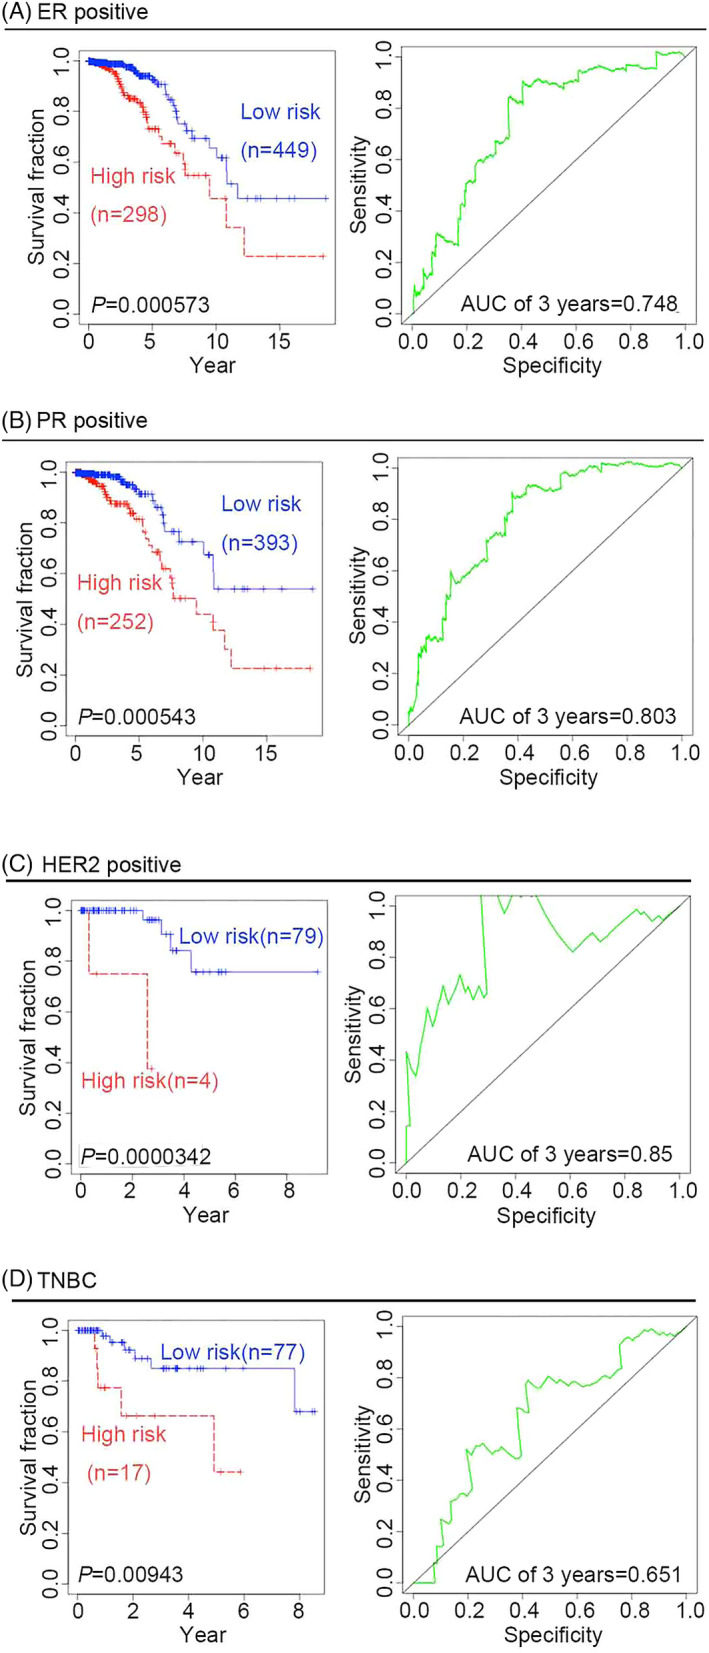
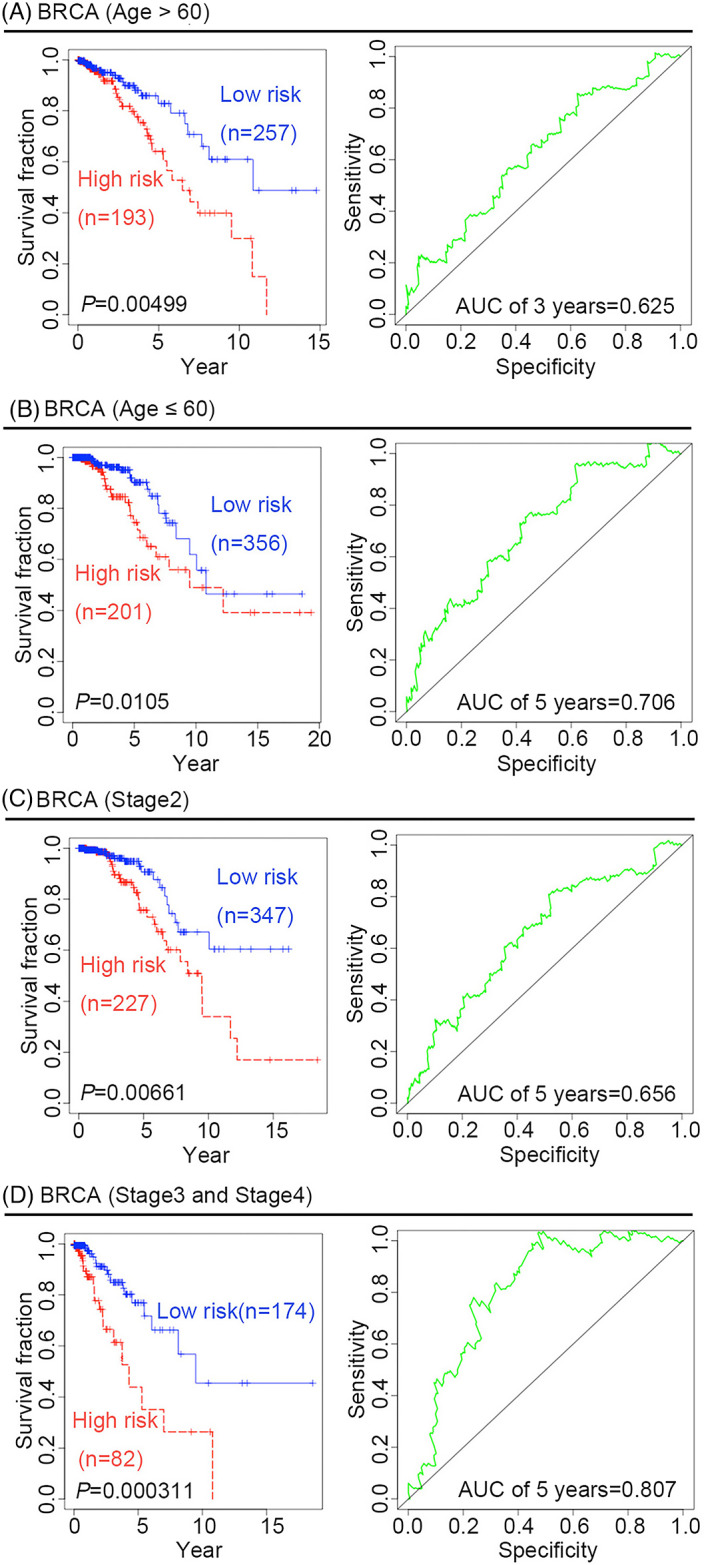
TABLE 1: Univariable and multivariable Cox regression analyses for BRCA
| Variables | Univariable model | Multivariable model | ||||
|---|---|---|---|---|---|---|
| HR | 95% CI | p Value | HR | 95% CI | p Value | |
| Risk score | 1.955 | 1.467–2.605 | 4.76E‐06 | 1.893 | 1.393–2.574 | 4.63E‐05 |
| Age | 1.031 | 1.015–1.048 | 1.48E‐04 | 1.030 | 1.013–1.046 | 3.85E‐04 |
| Stage event | 1.834 | 1.410–2.384 | 6.05E‐06 | 1.788 | 1.386–2.307 | 7.67E‐06 |
Abbreviations: CI, confifidence interval; HR, hazard ratio.
Prognostic prediction for other cancers
To determine whether the four‐gene signature could predict the survival outcome of other tumors, Cox proportional hazard regression analysis was performed for nine types of cancers, namely THCA, LIHC, SKCM, LGG, KIRP, READ, ACC, KIRC, and UVM. As shown in (Figure 4A–I), both KM curves and log‐rank tests showed that the four‐gene signature was significantly associated with improved clinical outcomes of these cancers, and might be thus used as a powerful prognostic biomarker to predict survival outcomes of patients with these cancer types. The AUCs for the 5‐year OS of patients with THCA, SKCM, KIRC, and ACC were 0.827, 0.679, 0.573, and 0.754, respectively. The AUCs for the 3‐year OS of patients with READ, LIHC, KIRP, UVM, and LGG were 0.834, 0.682, 0.726, 0.805, and 0.71, respectively. Additionally, there were significant differences in the RFS outcomes of patients with THCA, LIHC, SKCM, LGG, KIRP, ACC, KIRC, and UVM, but not in those of patients with READ (p = 0.053) (Table 2). Furthermore, we investigated whether the four‐gene signature could serve as an independent prognostic factor for the outcome of other cancers, namely THCA, LIHC, SKCM, LGG, KIRP, READ, and KIRC. Covariates besides the risk score included clinical risk factors, such as sex, age, and AJCC tumor grade. Patients were divided into older (age >60 years) and younger (age ≤60 years) groups. Cancer stage events included stages 1, 2, 3, and 4. For LGG, LIHC, and SKCM patients, KM survival curves, log‐rank tests, univariable Cox regression analysis, and multivariate Cox regression analysis showed that the four‐gene signature has predictive value for different ages, stage events, or sexes, and thus could serve as an independent prognostic factor in these patients (Table 3 and Table 4; Figure S1, Figure S2, Figure S3 and Figure S4). However, the four‐gene signature exhibited poor predictive value for different ages, stage events, and sexes in patients with KIRC, KIRP, THCA, and READ, and thus could not serve as an independent prognostic factor for these cancer types (Table 5 and Table 6). Owing to the small sample size of patients with ACC or UVM, neither univariate nor multivariate Cox regression analyses were performed in this study.
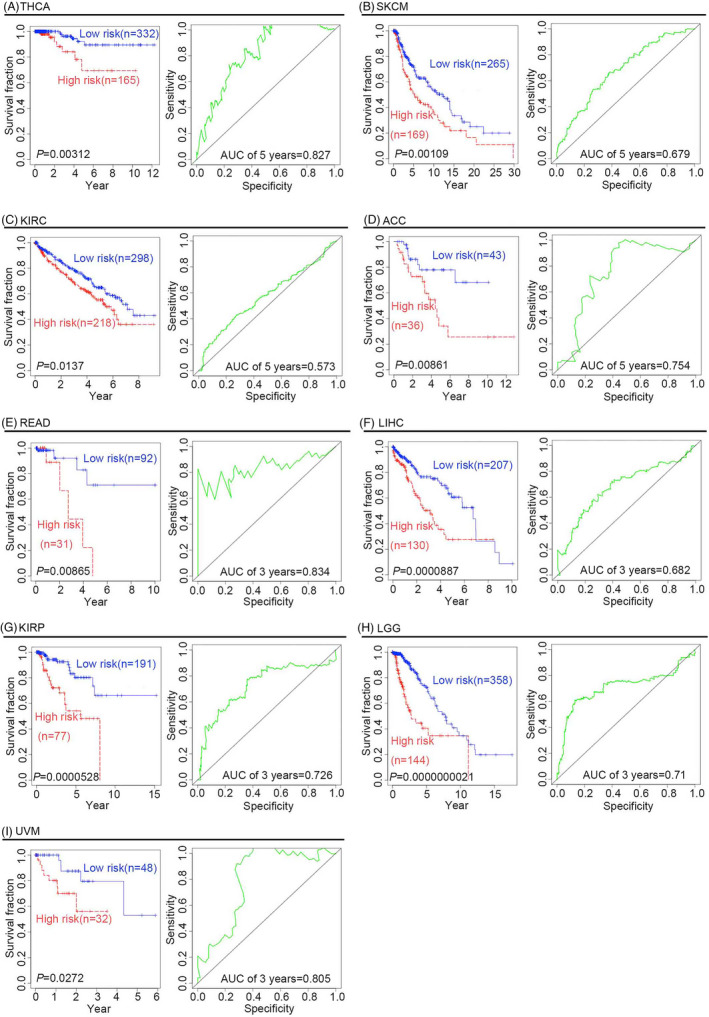
TABLE 2: Log‐rank test analyses for RFS in cancers
| Cancer types | p Value | ROC curves (AUC of 3 years) |
|---|---|---|
| ACC | 4.03E‐03 | 0.618 |
| BRCA | 4.98E‐03 | 0.612 |
| UVM | 1.95E‐02 | 0.713 |
| KIRC | 1.81E‐04 | 0.590 |
| KIRP | 2.63E‐05 | 0.765 |
| LGG | 7.39E‐07 | 0.635 |
| LIHC | 1.95E‐03 | 0.650 |
| SKCM | 2.26E‐06 | 0.645 |
| THCA | 4.44E‐02 | 0.654 |
| READ | 5.53E‐02 | ND |
Abbreviation: ND, not detectable.
TABLE 3: Log‐rank test analyses for LGG, LIHC, and SKCM
| Cancer type | Different groups | p Value (Log‐rank test) | ROC curves (AUC of 3 years) |
|---|---|---|---|
| LGG | Older group (age >60) | 8.94E‐03 | 7.79E‐01jcla24494-note-0003 |
| Younger group (age ≤60) | 4.43E‐05 | 7.21E‐01 | |
| Male | 7.91E‐05 | 7.12E‐01 | |
| Female | 6.11E‐06 | 7.29E‐01 | |
| Neoplasm histologic grade 2 | 1.88E‐02 | 5.69E‐01 | |
| Neoplasm histologic grade 3 | 3.22E‐05 | 7.27E‐01 | |
| RFS | 7.39E‐07 | 6.35E‐01 | |
| LIHC | Older group (age >60) | 2.35E‐02 | 5.89E‐01 |
| Younger group (age ≤60) | 2.64E‐04 | 7.72E‐01 | |
| Male | 4.18E‐05 | 7.17E‐01 | |
| Female | 1.80E‐03 | 6.67E‐01 | |
| Stage event 1 | 1.39E‐02 | 6.72E‐01 | |
| Stage event 2 | 1.78E‐03 | 7.64E‐01 | |
| Stage event 3, 4 | 2.99E‐02 | 6.77E‐01 | |
| RFS | 1.95E‐03 | 6.50E‐01 | |
| SKCM | Older group (age >60) | 7.87E‐03 | 6.56E‐01 |
| Younger group (age ≤60) | 4.25E‐02 | 7.35E‐01 | |
| Male | 8.41E‐04 | 6.80E‐01 | |
| Female | 2.77E‐02 | 6.70E‐01 | |
| Stage event 1, 2 | 1.74E‐03 | 6.88E‐01 | |
| Stage event 3, 4 | 5.48E‐03 | 6.92E‐01 | |
| RFS | 2.26E‐06 | 6.45E‐01 |
AUC of 2 years.
TABLE 4: Univariable and multivariable Cox regression analyses for LGG, LIHC, and SKCM
| Cancer type | Variables | Univariable model | Multivariable model | ||||
|---|---|---|---|---|---|---|---|
| HR | 95% CI | p Value | HR | 95% CI | p Value | ||
| LGG | Risk score | 1.562 | 1.382–1.766 | 1.05E‐12 | 1.424 | 1.225–1.656 | 4.37E‐06 |
| Sex | 1.127 | 0.735–1.726 | 5.84E‐01 | 0.922 | 0.590–1.442 | 7.23E‐01 | |
| Age | 1.070 | 1.052–1.089 | 2.65E‐14 | 1.068 | 1.048–1.088 | 4.34E‐12 | |
| Neoplasm histologic grade | 3.624 | 2.241–5.862 | 1.53E‐07 | 2.400 | 1.426–4.039 | 9.75E‐04 | |
| LIHC | Risk score | 2.131 | 1.493–3.042 | 3.07E‐05 | 2.118 | 1.467–3.056 | 6.12E‐05 |
| Sex | 1.507 | 0.928–2.446 | 9.74E‐02 | 1.241 | 0.747–2.060 | 4.04E‐01 | |
| Age | 1.028 | 1.007–1.050 | 9.17E‐03 | 1.024 | 1.003–1.045 | 2.47E‐02 | |
| Stage event | 1.217 | 0.926–1.598 | 1.59E‐01 | 1.151 | 0.877–1.511 | 3.11E‐01 | |
| SKCM | Risk score | 2.401 | 1.699–3.394 | 7.02E‐07 | 2.387 | 1.683–3.385 | 1.06E‐06 |
| Sex | 1.033 | 0.708–1.507 | 8.65E‐01 | 1.044 | 0.714–1.527 | 8.24E‐01 | |
| Age | 1.025 | 1.012–1.038 | 9.26E‐05 | 1.022 | 1.009–1.035 | 9.71E‐04 | |
| Stage event | 1.381 | 1.122–1.700 | 2.33E‐03 | 1.417 | 1.136–1.768 | 2.00E‐03 | |
Abbreviations: CI, confifidence interval; HR, hazard ratio.
TABLE 5: Univariable and multivariable Cox regression analyses for KIRC, KIRP, THCA, and READ
| Cancer type | Variables | Univariable model | Multivariable model | ||||
|---|---|---|---|---|---|---|---|
| HR | 95% CI | p Value | HR | 95% CI | p Value | ||
| KIRC | Risk score | 2.565 | 1.512–4.352 | 4.79E‐04 | 1.600 | 0.954–2.683 | 7.49E‐02 |
| Sex | 1.075 | 0.762–1.516 | 6.82E‐01 | 1.118 | 0.789–1.586 | 5.31E‐01 | |
| Age | 1.032 | 1.017–1.047 | 1.64E‐05 | 1.037 | 1.021–1.054 | 7.26E‐06 | |
| Stage event | 1.955 | 1.689–2.263 | 2.56E‐19 | 1.934 | 1.660–2.252 | 2.31E‐17 | |
| KIRP | Risk score | 1.619 | 1.332–1.968 | 1.33E‐06 | 1.849 | 1.406–2.431 | 1.09E‐05 |
| Sex | 1.302 | 0.546–3.103 | 5.52E‐01 | 0.897 | 0.364–2.210 | 8.13E‐01 | |
| Age | 0.996 | 0.960–1.034 | 8.42E‐01 | 1.016 | 0.979–1.055 | 4.02E‐01 | |
| Stage event | 2.505 | 1.740–3.607 | 7.76E‐07 | 2.583 | 1.748–3.815 | 1.87E‐06 | |
| THCA | Risk score | 1.460 | 1.181–1.806 | 4.76E‐04 | 1.091 | 0.831–1.432 | 5.32E‐01 |
| Sex | 0.281 | 0.070–1.128 | 7.35E‐02 | 0.307 | 0.059–1.600 | 1.61E‐01 | |
| Age | 1.135 | 1.059–1.216 | 3.42E‐04 | 1.101 | 1.010–1.199 | 2.79E‐02 | |
| Stage event | 3.420 | 1.656–7.063 | 8.93E‐04 | 2.259 | 0.820–6.227 | 1.15E‐01 | |
| READ | Risk score | 1.166 | 0.915–1.487 | 2.15E‐01 | 1.230 | 0.859–1.761 | 2.58E‐01 |
| Age | 1.009 | 0.893–1.139 | 8.87E‐01 | 1.046 | 0.901–1.214 | 5.57E‐01 | |
| Stage event | 1.963 | 0.442–8.710 | 3.75E‐01 | 1.855 | 0.453–7.602 | 3.91E‐01 | |
Abbreviations: CI, confifidence interval; HR, hazard ratio.
TABLE 6: Log‐rank test analyses for KIRC, KIRP, THCA, and READ
| Cancer types | Different groups | p value (Log‐rank test) | ROC curves (AUC of 3 years) |
|---|---|---|---|
| KIRC | Older group (age >60) | 2.11E‐03 | 5.84E‐01 |
| Younger group (age ≤ 0) | 2.65E‐01 | ND | |
| Male | 3.70E‐02 | 5.97E‐01 | |
| Female | 9.95E‐02 | ND | |
| Stage event 1, 2 | 4.54E‐01 | ND | |
| Stage event 3, 4 | 4.23E‐02 | 5.63E‐01 | |
| RFS | 1.81E‐04 | 5.90E‐01 | |
| KIRP | Older group (age >60) | 3.27E‐01 | ND |
| Younger group (age ≤60) | 1.39E‐06 | 7.66E‐01 | |
| Male | 1.88E‐02 | 6.64E‐01 | |
| Female | 1.98E‐06 | 9.52E‐01 | |
| Stage event 1, 2 | 1.68E‐01 | ND | |
| Stage event 3, 4 | 6.84E‐03 | 7.15E‐01 | |
| RFS | 2.63E‐05 | 7.65E‐01 | |
| THCA | Older group (age >60) | 3.01E‐01 | ND |
| Younger group (age ≤60) | 6.82E‐07 | 9.88E‐01 | |
| Male | 1.06E‐01 | ND | |
| Female | 1.37E‐02 | 8.15E‐01 | |
| Stage event 1, 2 | 4.08E‐01 | ND | |
| Stage event 3, 4 | 5.11E‐03 | 8.64E‐01 | |
| RFS | 4.44E‐02 | 6.54E‐01 | |
| READ | Older group (age >60) | 3.12E‐02 | 7.79E‐01 |
| Younger group (age ≤60) | 1.00E+00 | ND | |
| Male | ND | ND | |
| Female | ND | ND | |
| Stage event 1, 2 | ND | ND | |
| Stage event 3, 4 | ND | ND | |
| RFS | 5.53E‐02 | ND |
Abbreviation: ND, not detectable.
Expression profile analysis for the four genes in different cancers
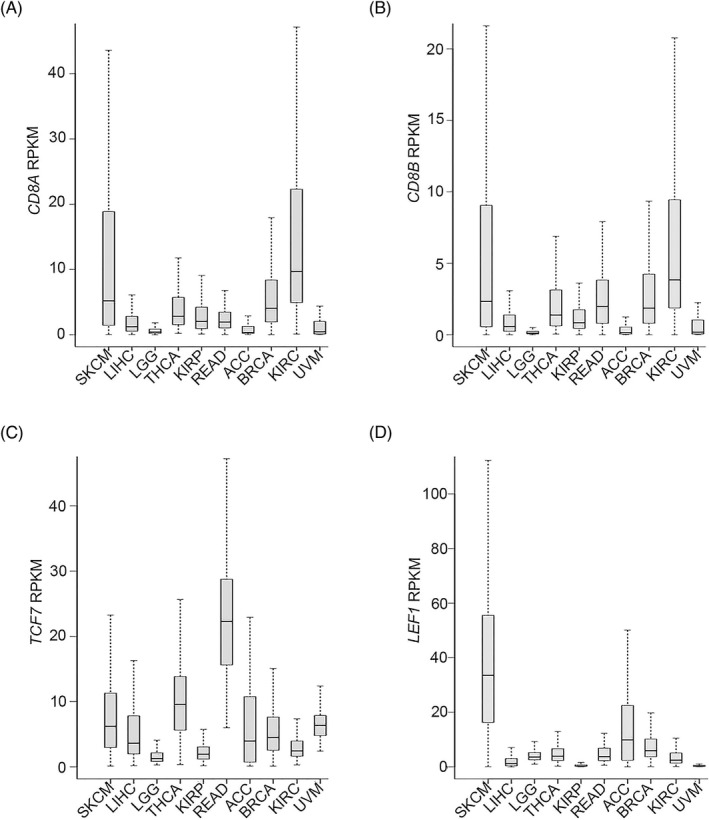
We further examined the expression patterns of the four signature genes in the 10 types of cancers under investigation based on RPKM analysis. The 25th, 50th, and 75th percentiles are shown in (Figure 5A–D). Taking the median values as an example, TCF7 was expressed in the range of 1.28–22.27 RPKM, LEF1 in the range of 0.31–33.53 RPKM, CD8A in the range of 0.32–9.68 RPKM, and CD8B in the range of 0.10–3.84 RPKM. Therefore, the expression profiles of the four genes were consistent in the different cancers.
To detect the logarithm fold change (logFC) in the expression of the four genes TCF7, LEF1, CD8A, and CD8B in different cancers, we investigated the transcriptomic profiles retrieved from the TCGA database. Compared with that in normal tissues, TCF7 expression in READ, KIRC, and LIHC tissues was higher, while being lower in BRCA tissues; in addition, LEF1 was highly expressed in BRCA, READ, KIRC, and LIHC tissues, but was expressed at lower levels in KIRP tissues; finally, both CD8A and CD8B were expressed at higher levels in BRCA, KIRC, and KIRP tissues, while CD8A was expressed at lower levels in THCA and READ tissues (Table 7).
TABLE 7: Expression foldchanges in different cancers
| Gene | Cancer | logFC | p‐Value | FDR |
|---|---|---|---|---|
| TCF7 | BRCA | −0.736 | 9.52E‐13 | 2.25E‐12 |
| KIRP | 0.356 | 9.47E‐02 | 1.27E‐01 | |
| READ | 2.227 | 6.74E‐17 | 1.69E‐15 | |
| LIHC | 0.945 | 9.39E‐06 | 2.28E‐05 | |
| KIRC | 0.976 | 1.08E‐11 | 2.62E‐11 | |
| THCA | 0.091 | 5.06E‐01 | 5.56E‐01 | |
| LEF1 | BRCA | 2.033 | 4.69E‐48 | 4.31E‐47 |
| KIRP | −1.266 | 1.02E‐06 | 3.13E‐06 | |
| READ | 2.110 | 7.66E‐07 | 4.42E‐06 | |
| LIHC | 3.012 | 2.30E‐21 | 3.89E‐20 | |
| KIRC | 1.157 | 4.15E‐09 | 8.60E‐09 | |
| THCA | 0.287 | 5.75E‐02 | 7.71E‐02 | |
| CD8A | BRCA | 0.620 | 2.45E‐05 | 3.81E‐05 |
| KIRP | 1.756 | 2.42E‐06 | 7.02E‐06 | |
| READ | −0.820 | 2.83E‐02 | 5.20E‐02 | |
| LIHC | −0.208 | 4.02E‐01 | 4.53E‐01 | |
| KIRC | 3.636 | 1.16E‐46 | 1.49E‐45 | |
| THCA | −0.950 | 5.48E‐08 | 1.63E‐07 | |
| CD8B | BRCA | 0.654 | 6.57E‐05 | 9.91E‐05 |
| KIRP | 2.015 | 2.71E‐06 | 7.80E‐06 | |
| READ | 0.051 | 8.98E‐01 | 9.25E‐01 | |
| LIHC | 0.214 | 4.48E‐01 | 4.98E‐01 | |
| KIRC | 3.446 | 7.15E‐41 | 7.05E‐40 | |
| THCA | −0.435 | 6.55E‐02 | 8.70E‐02 |
GO and KEGG pathway enrichment analyses
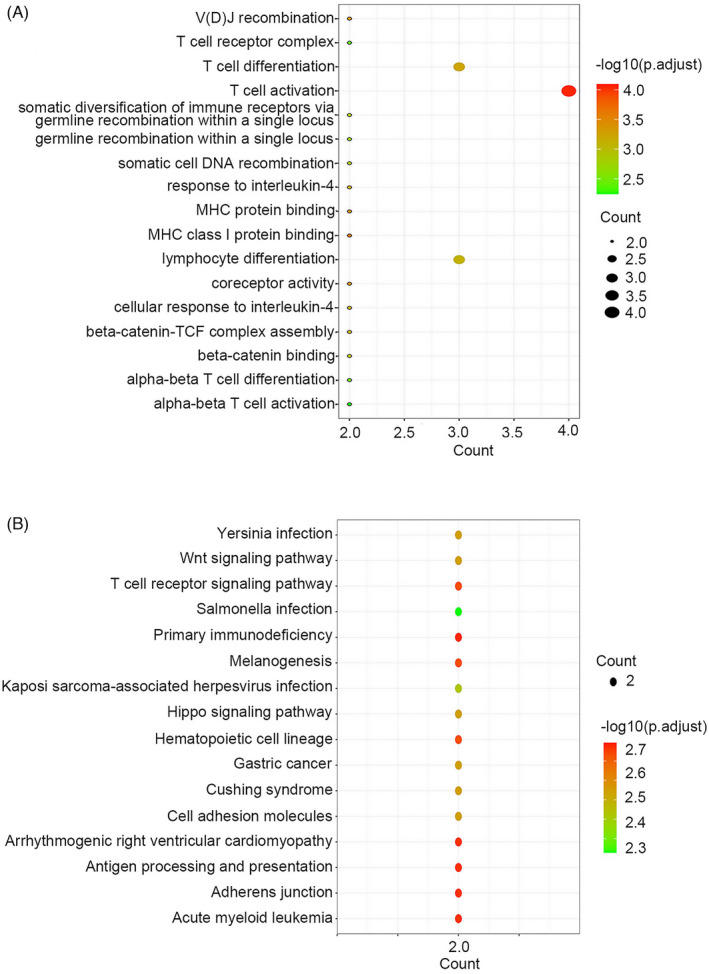
To confirm the functions of TCF7, LEF1, CD8A, and CD8B, GO and KEGG enrichment analyses were performed. GO enrichment analysis showed that CD8A, CD8B, TCF7, and LEF1 are involved in T‐cell activation, T‐cell differentiation, lymphocyte differentiation, V(D) J recombination, MHC class I protein binding, MHC protein binding, and coreceptor activity (Figure 6A). KEGG enrichment analysis further indicated that these four genes were mainly associated with the following KEGG terms: T‐cell receptor signaling pathway, primary immunodeficiency, melanogenesis, hematopoietic cell lineage, arrhythmogenic right ventricular cardiomyopathy, adherent junction, acute myeloid leukemia, antigen processing, and presentation (Figure 6B).
The four‐gene signature as an immune‐associated prognostic signature for cancers
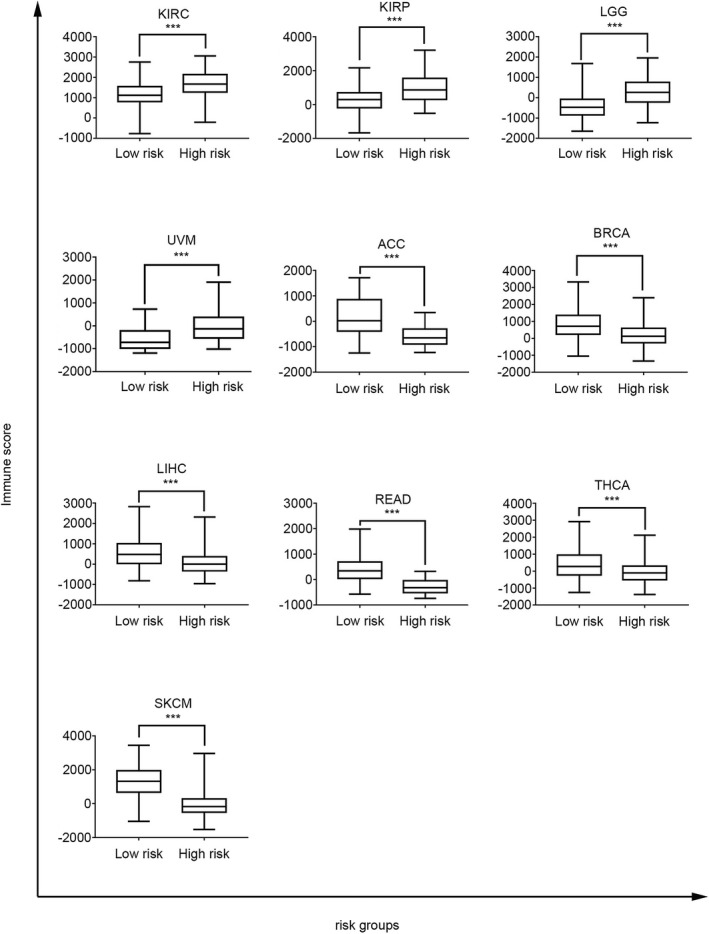
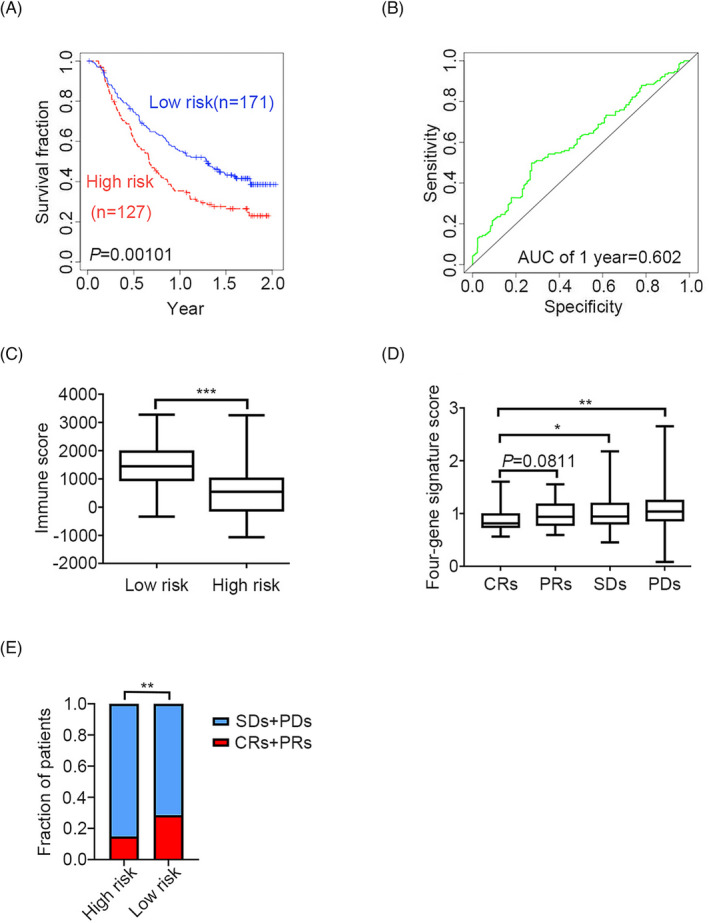
To investigate the immune‐related risk stratification of the four‐gene signature, the immune score, which represents the immune infiltration level, was obtained using the R package estimate. When comparing high‐ to low‐risk groups of cancer patients, the four‐gene signature was found to be significantly associated with the immune infiltration level in patients with 10 types of cancer (Figure 7). For example, in patients with mUC, the KM survival curves and log‐rank test revealed significant differences in survival outcomes (Figure 8A, B). Moreover, immune infiltration levels differed significantly between the high‐ and low‐risk groups in patients with mUC (p < 0.0001. Figure 8C). The four‐gene signature score was lower in the complete response subgroups (CRs) than in the stable disease subgroups (SDs, p = 0.0475) or partial disease subgroups (PDs, p = 0.0017) (Figure 8D). The four‐gene signature was positively associated with complete response to atezolizumab treatment, an anti‐PD‐L1 immunotherapy (Figure 8E. p = 0.0054). Collectively, our results suggest that the four‐gene signature can be used to predict the efficacy of immunotherapy and identify patients that could benefit from immunotherapy.
DISCUSSION
In many cancers, the presence of tumor‐infiltrating CD8+ T lymphocytes can be used to predict patient survival and response to immunotherapy.ref. jcla24494-bib-0024, ref. jcla24494-bib-0025, ref. jcla24494-bib-0026, ref. jcla24494-bib-0027, ref. jcla24494-bib-0028, ref. jcla24494-bib-0029, ref. jcla24494-bib-0030, ref. jcla24494-bib-0031 The presence of tumor‐infiltrating lymphocytes, particularly CD8+ T cells, is a positive prognostic marker in multiple solid tumors, but these cells fail to effectively eliminate cancer cells. This is because not all CD8+ T‐cell subsets expand following ICB.ref. jcla24494-bib-0032 Stem‐like CD8+ T cells, a subpopulation of CD8+ T cells that can express effector molecules, play critical roles in maintaining CD8+ T‐cell responses in human cancers.ref. jcla24494-bib-0047 In fact, the proliferative burst derives almost exclusively from these “stem‐like” CD8+ T cells after ICB. Moreover, melanoma patients with a higher percentage of progenitor exhausted cells benefit from a more durable response to ICB therapy.ref. jcla24494-bib-0034, ref. jcla24494-bib-0036, ref. jcla24494-bib-0037, ref. jcla24494-bib-0038, ref. jcla24494-bib-0039 In the current study, based on the transcriptomic profiles from the TCGA database, a multivariable Cox regression analysis was conducted to establish a novel four‐gene signature (CD8A, CD8B, TCF7, and LEF1), which serves as a biomarker of stem‐like CD8+ T cells and predicts the immune responses and clinical outcomes of patients with metastatic cancer prior to treatment.
First, KM survival curves and log‐rank tests were used to examine the predictive capacity of the four‐gene signature for patients with BRCA. The results revealed significant differences in both clinical survival outcomes and RFS outcomes between high‐risk and low‐risk patients, indicating that the four‐gene signature has a robust predictive capacity for breast cancers. The cross‐tumor predictive value of the four‐gene signature was assessed in other nine cancers, namely THCA, LIHC, SKCM, LGG, KIRP, READ, ACC, KIRC, and UVM. Both the KM curves and log‐rank tests proved that the four‐gene signature has prognostic value for these cancers. Therefore, the four‐gene signature can be used to predict clinical immune responses in a wide variety of cancers.
Both univariate and multivariate Cox regression analyses were performed to determine whether the four‐gene prognostic signature could serve as an independent prognostic factor. The results demonstrated that the four‐gene signature has predictive value for different ages, stage events, or sexes, which could serve as independent prognostic factors for patients with BRCA, LGG, LIHC, or SKCM. However, the four‐gene signature could not serve as an independent prognostic factor in patients with KIRC, KIRP, THCA, or READ in the current study. Regarding KIRC, KIRP, THCA, and READ, previous studies have shown that age and sex are closely associated with OS.ref. jcla24494-bib-0048, ref. jcla24494-bib-0049, ref. jcla24494-bib-0050, ref. jcla24494-bib-0051 Except for READ patients, the four‐gene signature was significantly associated with improved RFS for patients with all considered cancer types. Additionally, neither univariate Cox regression analysis nor multivariate Cox regression analysis was performed in the current study for patients with ACC and UVM, owing to their small sample size.
Interestingly, CD8A, CD8B, TCF7, and LEF1 cannot serve as therapeutic targets for these cancers because of their different expression profiles. GO enrichment analysis showed that CD8A, CD8B, TCF7, and LEF1 are involved in T‐cell activation, T‐cell differentiation, lymphocyte differentiation, V(D) J recombination, MHC class I protein binding, MHC protein binding, and coreceptor activation. Furthermore, KEGG enrichment analysis indicated that the four genes were mainly associated with the following KEGG terms: T‐cell receptor signaling pathway, primary immunodeficiency, melanogenesis, hematopoietic cell lineage, arrhythmogenic right ventricular cardiomyopathy, adherent junction, acute myeloid leukemia, antigen processing, and presentation. In fact, CD8A and CD8B might be involved in directing the cell fate of immature double‐positive (CD4+CD8+) thymocytes towards two subsets of T cells: MHC class II‐restricted CD4+ helper T cells and MHC class I‐restricted CD8+ cytotoxic T cells.ref. jcla24494-bib-0052 TCF7 and LEF1 are HMG transcription factors required for the early stages of thymocyte maturation.ref. jcla24494-bib-0053, ref. jcla24494-bib-0054, ref. jcla24494-bib-0055, ref. jcla24494-bib-0056 Importantly, TCF7 and LEF1 play critical roles in the establishment of CD8+ T‐cell identity, as they are directly involved in genetic and epigenetic regulation resulting in an appropriate gene expression pattern for CD8+ T cells. Such regulatory functions mainly depend on their intrinsic histone deacetylase activity.ref. jcla24494-bib-0043 Therefore, both TCF7 and LEF1 have versatile functions in regulating T‐cell development and differentiation, and are involved in CD8+ T‐cell maturation.ref. jcla24494-bib-0057, ref. jcla24494-bib-0058
We further investigated whether the immune‐related risk stratification of the four‐gene signature correlated with the immune infiltration level in patients with 10 types of cancer, namely THCA, LIHC, SKCM, LGG, KIRP, READ, ACC, KIRC, BRCA, and mUC. The results revealed significant differences in immune infiltration levels between the high‐ and low‐risk groups of patients. Based on the efficacy and safety data of atezolizumab in mUC patients from the phase II IMvigor210 study, KM survival curve analysis and log‐rank tests were performed; the results demonstrated that the four‐gene signature had prognostic value for survival outcomes in mUC patients. Compared with those of the CRs groups, there were significant differences in the four‐gene signature risk scores of the SDs and PDs groups. These results demonstrated that the four‐gene signature could serve as a prognostic immunotherapy biomarker to predict the immune response in patients with cancer.
In summary, the novel four‐gene signature (CD8A, CD8B, TCF7, and LEF1) could serve as a predictive biomarker of the immune responses to ICB and clinical outcomes of patients with different cancers, including BRCA, THCA, LIHC, SKCM, LGG, KIRP, READ, ACC, KIRC, and UVM. The four‐gene signature could be widely used to optimize biomarkers of ICB responses, guide ICB therapy, and identify new immunotherapy targets for restoring immune responses. However, in the current study, the four‐gene signature was established based only on transcriptome analysis, and its combination with other biomarkers may yield a more promising tool for the prediction of immune responses to checkpoint blockades in multiple cancers in the future.
AUTHOR CONTRIBUTIONS
(I) Conception and design: HZ, SZ, and YL; (II) Administrative support: HZ and SZ; (III) Provision of study materials or patients: YL, MN, and LL; (IV) Collection and assembly of data: MN, LL, JW, and ZT; (V) Data analysis and interpretation: YL, MN, SZ, and HZ; (VI) Manuscript writing: All authors; (VII) Final approval of manuscript: All authors.
CONFLICT OF INTEREST
The authors declare that they have no competing interest.
Supplementary Materials
References
- Overall survival and Long‐term safety of nivolumab (anti‐programmed death 1 antibody, BMS‐936558, ONO‐4538) in patients with previously treated advanced non‐small‐cell lung cancer.. J Clin Oncol., 2015. [PubMed]
- Pembrolizumab versus docetaxel for previously treated, PD‐L1‐positive, advanced non‐small‐cell lung cancer (KEYNOTE‐010): a randomised controlled trial.. Lancet., 2016. [PubMed]
- Activity and safety of nivolumab, an anti‐PD‐1 immune checkpoint inhibitor, for patients with advanced, refractory squamous non‐small‐cell lung cancer (CheckMate 063): a phase 2, single‐arm trial.. Lancet Oncol., 2015. [PubMed]
- Nivolumab versus docetaxel in advanced nonsquamous non‐small‐cell lung cancer.. N Engl J Med., 2015. [PubMed]
- Pembrolizumab for the treatment of non‐small‐cell lung cancer.. N Engl J Med., 2015. [PubMed]
- Atezolizumab in patients with locally advanced and metastatic urothelial carcinoma who have progressed following treatment with platinum‐based chemotherapy: a single‐arm, multicentre, phase 2 trial.. Lancet., 2016. [PubMed]
- Atezolizumab, an anti‐programmed death‐ligand 1 antibody, in metastatic renal cell carcinoma: Long‐term safety, clinical activity, and immune correlates from a phase Ia study.. J Clin Oncol., 2016. [PubMed]
- Nivolumab for metastatic renal cell carcinoma: results of a randomized phase II trial.. J Clin Oncol., 2015. [PubMed]
- Nivolumab versus Everolimus in advanced renal‐cell carcinoma.. N Engl J Med., 2015. [PubMed]
- Survival, durable response, and Long‐term safety in patients with previously treated advanced renal cell carcinoma receiving nivolumab.. J Clin Oncol., 2015. [PubMed]
- Long‐term clinical outcomes and biomarker analyses of Atezolizumab therapy for patients with metastatic triple‐negative breast cancer.. JAMA Oncol., 2019. [PubMed]
- A clinical trial of CTLA‐4 blockade with tremelimumab in patients with hepatocellular carcinoma and chronic hepatitis C.. J Hepatol., 2013. [PubMed]
- Atezolizumab plus Bevacizumab ‐ A landmark in liver.. Cancer., 2020
- PD‐1 blockade in anaplastic thyroid carcinoma.. J Clin Oncol., 2020. [PubMed]
- PD‐1 blockade in advanced adrenocortical.. Carcinoma., 2020
- Immune checkpoint modulation for non‐small cell lung cancer.. Clin Cancer Res., 2015. [PubMed]
- Safety, activity, and immune correlates of anti‐PD‐1 antibody in cancer.. N Engl J Med., 2012. [PubMed]
- Pembrolizumab versus chemotherapy for PD‐L1‐positive non‐small‐cell lung cancer.. N Engl J Med., 2016. [PubMed]
- Programmed death‐ligand 1 expression and response to the anti‐programmed death 1 antibody pembrolizumab in melanoma.. J Clin Oncol., 2016. [PubMed]
- CD28/B7 system of T cell costimulation.. Annu Rev Immunol., 1996. [PubMed]
- CTLA‐4 and PD‐1/PD‐L1 blockade: new immunotherapeutic modalities with durable clinical benefit in melanoma patients.. Clin Cancer Res., 2013. [PubMed]
- Personalized tumor response assessment in the era of molecular medicine: cancer‐specific and therapy‐specific response criteria to complement pitfalls of RECIST.. AJR Am J Roentgenol., 2012. [PubMed]
- Cancer immunotherapy and immune‐related response assessment: the role of radiologists in the new arena of cancer treatment.. Eur J Radiol., 2015. [PubMed]
- Type, density, and location of immune cells within human colorectal tumors predict clinical outcome.. Science., 2006. [PubMed]
- Effector memory T cells, early metastasis, and survival in colorectal cancer.. N Engl J Med., 2005. [PubMed]
- Macrophages impede CD8 T cells from reaching tumor cells and limit the efficacy of anti‐PD‐1 treatment.. Proc Natl Acad Sci USA., 2018. [PubMed]
- Tumor‐infiltrating lymphocyte grade is an independent predictor of sentinel lymph node status and survival in patients with cutaneous melanoma.. J Clin Oncol., 2012. [PubMed]
- Single‐cell profiling of breast cancer T cells reveals a tissue‐resident memory subset associated with improved prognosis.. Nat Med., 2018. [PubMed]
- Predictive correlates of response to the anti‐PD‐L1 antibody MPDL3280A in cancer patients.. Nature., 2014. [PubMed]
- PD‐1 blockade induces responses by inhibiting adaptive immune resistance.. Nature., 2014. [PubMed]
- High response rate to PD‐1 blockade in desmoplastic melanomas.. Nature., 2018. [PubMed]
- Distinct cellular mechanisms underlie anti‐CTLA‐4 and anti‐PD‐1 checkpoint blockade.. Cell., 2017. [PubMed]
- Human lymph nodes maintain TCF‐1hi memory T cells with high functional potential and clonal diversity throughout life.. J Immunol., 2018. [PubMed]
- T cell factor 1‐expressing memory‐like CD8(+) T cells sustain the immune response to chronic viral infections.. Immunity., 2016. [PubMed]
- The coincidence of increased risk of atrial fibrillation in randomized control trials of omega‐3 fatty acids: a meta‐analysis.. Expert Rev Clin Pharmacol., 2021. [PubMed]
- Intratumoral Tcf1+PD‐1+CD8+ T cells with stem‐like properties promote tumor control in response to vaccination and checkpoint blockade immunotherapy.. Immunity., 2019. [PubMed]
- Defining CD8+ T cells that provide the proliferative burst after PD‐1 therapy.. Nature., 2016. [PubMed]
- Subsets of exhausted CD8+ T cells differentially mediate tumor control and respond to checkpoint blockade.. Nat Immunol., 2019. [PubMed]
- An intra‐tumoral niche maintains and differentiates stem‐like CD8 T cells.. Nature., 2019. [PubMed]
- The canonical Wnt signaling pathway plays an important role in lymphopoiesis and hematopoiesis.. Eur J Immunol., 2008. [PubMed]
- Regulation of mature T cell responses by the Wnt signaling pathway.. Ann N Y Acad Sci., 2012. [PubMed]
- TCF‐1 and LEF‐1 act upstream of Th‐POK to promote the CD4+ T cell fate and interact with Runx3 to silence Cd4 in CD8+ T cells.. Nat Immunol., 2014. [PubMed]
- Tcf1 and Lef1 transcription factors establish CD8+ T cell identity through intrinsic HDAC activity.. Nat Immunol., 2016. [PubMed]
- Molecular and genetic properties of tumors associated with local immune cytolytic activity.. Cell., 2015. [PubMed]
- TGFbeta attenuates tumour response to PD‐L1 blockade by contributing to exclusion of T cells.. Nature., 2018. [PubMed]
- Inferring tumour purity and stromal and immune cell admixture from expression data.. Nat Commun., 2013. [PubMed]
- Stem‐like CD8 T cells mediate response of adoptive cell immunotherapy against human cancer.. Science., 2020. [PubMed]
- Oncologic outcomes in young adults with kidney cancer treated during the targeted therapy era.. Clin Genitourin Cancer., 2020. [PubMed]
- Prognostic value of age and distant metastasis in differentiated thyroid carcinoma undergoing salvage surgery.. Anticancer Res., 2020. [PubMed]
- Markoski BJTojotATA.. The importance of age over radioiodine avidity as a prognostic factor in differentiated thyroid carcinoma with distant metastases., 2009
- Sex disparities in colorectal cancer incidence by anatomic subsite, race and age.. Int J Cancer., 2011. [PubMed]
- Chromatin and CD4, CD8A and CD8B gene expression during thymic differentiation.. Nat Rev Immunol., 2002. [PubMed]
- An HMG‐Box‐containing T‐cell factor required for thymocyte differentiation.. Nature., 1995. [PubMed]
- From inception to output, Tcf1 and Lef1 safeguard development of T cells and innate immune cells.. Immunol Res., 2014. [PubMed]
- WNT signalling in the immune system: WNT is spreading its wings.. Nat Rev Immunol., 2008. [PubMed]
- Redundant regulation of T cell differentiation and TCRalpha gene expression by the transcription factors LEF‐1 and.. TCF‐1., 1998
- Tcf1 and Lef1 are required for the immunosuppressive function of regulatory T cells.. J Exp Med., 2019. [PubMed]
- Tcf1 and Lef1 pack their own HDAC.. Nat Immunol., 2016. [PubMed]