
Driving Performance and Cannabis Users’ Perception of Safety
Abstract
This randomized clinical trial studies the magnitude and time course of effects of cannabis on driving, effect of cannabis with different tetrahydrocannabinol amounts, possible tolerance effects, and accuracy of self-perception of impairment.
Affiliations: Department of Psychiatry, University of California San Diego, San Diego; Department of Pathology, University of California San Diego, San Diego; Department of Pathology and Laboratory Medicine, Santa Clara Valley Medical Center, San Jose, California; LetsGetChecked Labs, Monrovia, California; Vividion Therapeutics, San Diego, California; Department of Pathology and Laboratory Medicine, Dartmouth-Hitchcock Medical Center, Lebanon, New Hampshire; Brainbaseline, Iowa City, Iowa; Institute for Emerging Health Professions, Thomas Jefferson University, Philadelphia, Pennsylvania
License: Copyright 2022 Marcotte TD et al. JAMA Psychiatry. CC BY 4.0 This is an open access article distributed under the terms of the CC-BY License.
Article links: DOI: 10.1001/jamapsychiatry.2021.4037 | PubMed: 35080588 | PMC: PMC8792796
Relevance: Moderate: mentioned 3+ times in text
Full text: PDF (16 KB)
Introduction
As jurisdictions legalize cannabis for medicinal and recreational use, there are growing concerns regarding a potential increased prevalence of cannabis-impaired drivers.1,2 Acute consumption of Δ9-tetrahydrocannabinol (THC) negatively affects cognitive functioning3 and reduces driving performance, particularly in lane position control (standard deviation of lateral position)4,5,6,7,8,9 and ability to adjust to lead car speed changes (car following10). However, epidemiologic data regarding the effect of legalization on crash risk are not consisent.11,12,13,14 The varied findings partially reflect challenges in accessing robust prelegalization and postlegalization data and determining acute intoxication1 but also show a disconnect between impairing effects observed in controlled studies and expectations regarding crash rates.
Questions remain regarding the magnitude and time course of the effects of cannabis on those most likely to be on the road (regular users smoking to a desired level of intoxication) as well as the effect of different product THC amounts. While seminal studies examined these questions, most used small sample sizes (eg, <25 participants), low–THC content product within a crossover design, and structured dosing protocols, with some exceptions, for example using an ad libitum approach.5 Such studies provide critical data regarding THC dose effects but do not reflect real-world use. This is particularly important given concerns that the increasing THC content of products may result in greater impairment. Small sample sizes may also limit generalizability, while crossover designs using psychoactive substances present blinding challenges.15
The appropriate waiting period before driving after cannabis smoking is also a significant public safety concern, with some suggesting 3 to 5 hours16,17,18 and others recommending longer.19 Because this decision may be self-determined based on feeling impaired, it is important to understand the accuracy of these self-evaluations. In addition, while frequency of cannabis use is associated with increased behavioral tolerance,20 the relationship to driving remains poorly understood because individuals may counteract tolerance by consuming greater amounts to achieve desired psychoactive effects. Recent systematic reviews concluded that major limitations in cannabis-related driving research include a lack of studies examining regular users over a 4- to 6-hour postsmoking time frame21 as well as small sample sizes.22
Within a sample of nearly 200 regular cannabis users instructed to smoke cannabis as they do at home to achieve a usual level of intoxication, the aims of this study were to determine, with respect to driving outcomes, the (1) magnitude and time course of effects, (2) effect of cannabis with different THC amounts, (3) possible tolerance effects, and (4) accuracy of self-perception of impairment.
Methods
The study was approved by the Human Research Protections Program at the University of California, San Diego; the US Food and Drug Administration; and the Research Advisory Panel of California. The study was conducted in accordance with the Declaration of Helsinki.23 Consolidated Standards of Reporting Trials (CONSORT) reporting guideline were followed.
Participants
Participants were recruited in San Diego, California, via fliers, community outreach, and ClinicalTrials.gov from February 2017 to June 2019. Inclusion criteria were age 21 to 55 years, using cannabis 4 or more times in the past month, holding a valid driver’s license, driving at least 1000 miles in the past year, and willing to abstain from cannabis for 2 days prior to the training and experimental study days.
Exclusion criteria were history of traumatic brain injury; significant cardiovascular, hepatic, or kidney disease; uncontrolled hypertension; chronic pulmonary disease; positive pregnancy test; positive urine screen for cocaine, amphetamines, opiates, and phencyclidine; current (past-year) substance use disorder (no participant met criteria for cannabis use disorder); history of schizophrenia, bipolar depression with mania, and/or current suicidal ideation; unwilling to refrain from driving after consuming study medication; and oral fluid THC more than >5 ng/mL on the testing day. Participants provided written informed consent. Data on race and ethnicity were self-reported.
Study Design
The trial protocol is available in Supplement 1. This was a double-blind, placebo-controlled, parallel clinical trial in which participants were randomized using permuted blocks stratified by prior cannabis exposure (using ≥4 times per week or <4 times per week in the past month, based on stratifications that previously differentiated among users9,24) to smoke a cannabis cigarette with either 13.4%, 5.9%, or 0.02% THC (placebo) content. Participants were instructed to abstain from cannabis for 48 hours prior to the training and experimental days and underwent a 1-hour simulator training session prior to the testing day. The training session exposed participants to all of the individual components of the drive, culminating in a 25-minute drive similar to what they would encounter on the testing day. On the experimental day, they completed a urine drug screen and breathalyzer for alcohol and drugs and oral fluid sample for THC presence (Draeger 5000). If the oral fluid was positive (>5-ng/mL THC), suggesting relatively recent use, the assessment was canceled. Oral fluid samples were also quantified by liquid chromatography/tandem mass spectrometry as the final indicator of possible recent use, with participants having oral fluid with more than 5-ng/mL THC excluded from analyses. Participants completed driving simulations and blood collections prior to and following cannabis smoking (detailed toxicology findings reported elsewhere25,26). The primary outcome was the Composite Drive Score (CDS), a measure composed of key driving simulator variables.
Driving Simulations
Driving simulations, approximately 25 minutes in length, were presented on a STISIM M300WS-Console Driving Simulator System (Systems Technology, Inc) consisting of 3-screen, wide field-of-view monitors, steering wheel, and accelerator and brake pedals, and programmed using STISIM Drive version 3.14.27 The simulations emulated city and country driving, including common traffic challenges (eg, freeway merging), as well as scenarios providing outcomes similar to those widely used in drug-impaired driving studies.5,7,8,28 At a specified distance, participants completed a modification of the Surrogate Reference Task,29 which required participants to maintain their lane position and speed in a straight roadway, while responding to a divided attention task on an iPad to the side of the dashboard. Key variables included standard deviation of lateral position or swerving, standard deviation (variability) of speed, and number of correct divided attention stimuli identified while driving. At another distance, car following required participants to adjust their speed to a lead car that speeds up and slows down according to a sinusoidal wave. The key variable is coherence between the participant and lead car (a correlation ranging from 0-1). CDS, comprising the key variables described above, normalized to a common metric (z scores derived from the presmoking drive of all participants), was calculated to globally represent driving performance and, by not being dependent on a single outcome variable, provided a more stable indicator of driving performance (eAppendix in Supplement 2). A higher score indicated worse performance. Similar approaches have been used elsewhere30,31 and address concerns regarding the use of multiple dependent outcomes in cannabis and driving research.22 Postsmoking driving simulations occurred approximately 30 minutes, 1 hour 30 minutes, 3 hours 30 minutes, and 4 hours 30 minutes after smoking.
Study Drug and Administration
Bulk cannabis plant material containing 5.9% THC, 13.4% THC, or placebo was acquired from the National Institute on Drug Abuse Drug Supply Program and hand rolled into 700-mg cigarettes. An ad libitum regimen was used within a negative pressure room, with participants instructed to “smoke the cigarette the way you do at home to get high. You may take up to 10 minutes.” A minimum of 4 puffs was required. Venous blood was collected from an indwelling intravenous arm catheter (eAppendix in Supplement 2).
Perceptions of Impairment
After smoking, but prior to each driving session, participants were asked “how high are you?”, “how impaired are you to drive?” (both ratings from 0 [not at all] to 100 [extremely]), and “would you drive in your current state?” (yes/no). After each postsmoking driving session, participants were asked “how much did the study drug affect your driving?” (0 [not at all] to 100 [extremely]) as well as “how well did you drive?” (0 [not at all well] to 100 [extremely well]).
Statistical Analysis
Generalized least squares models were used for numeric outcomes with covariance structure selected by minimum Akaike information criterion. Poisson and logistic regression models with generalized estimating equation method were used for discrete and binary outcomes, respectively. Time was treated as a factor to accommodate nonlinear changes in the outcomes. Treatment was first considered as a 3-level variable (placebo, 5.9% THC, and 13.4% THC) and then as a 2-level treatment variable (placebo and THC) where the 5.9% and 13.4% groups were combined. For all models, 3 terms were included: treatment, time (5 time points), and treatment-time interaction. For effect sizes estimating differences at multiple time points, correction for multiple comparisons was applied using false discovery rate method (subscore and secondary analyses only).
Cannabis use intensity, estimated as total THC exposure, was based on self-reported frequency and quantity of use in the past 6 months using a timeline follow-back approach and split into 3 groups (lowest quartile, 2 middle quartiles combined, and highest quartile; eAppendix in Supplement 2). Two-sided P values were statistically significant at .05. Analysis were conducted between April 2020 and September 2021.
Results
Of 261 individuals screened for eligibility, 199 were randomized to 1 of 3 arms: placebo (63 [33.0%]), 5.9% THC (66 [34.6%]), or 13.4% THC (62 [32.5%]) (Figure 1). Seven were subsequently excluded owing to presmoking elevated oral fluid THC levels and 1 withdrew immediately postsmoking. The final sample was 191 participants (118 men [61.8%]; mean [SD] age, 29.9 [8.3] years) who used cannabis a mean (SD) of 16.7 (9.8) days in the past 30 days, approximately 1 cigarette (0.5 g) when using, with 98 (51.3%) using less than 4 times per week. There were no significant group differences on key background variables (Table 1).
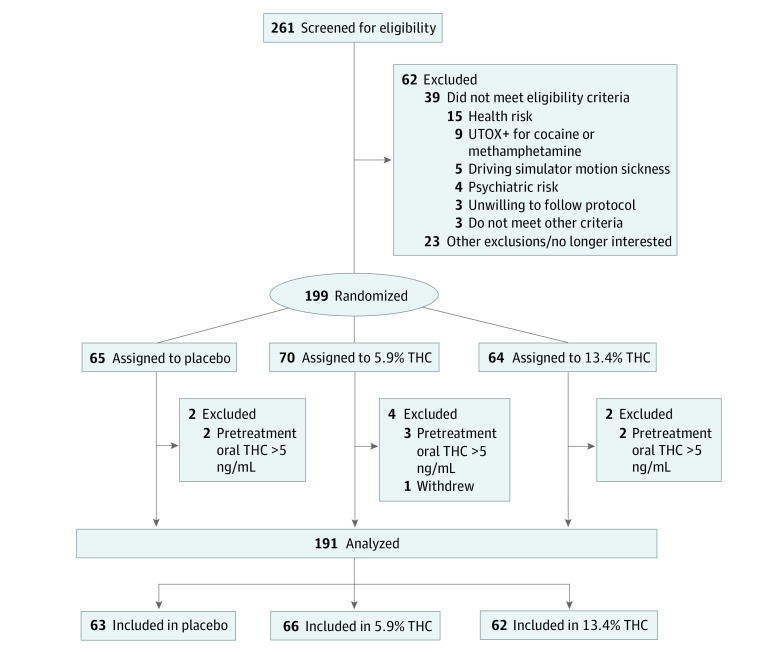
Table 1. : Demographic Characteristics of Study Participants by Treatment Group
| Characteristic | Placebo (n = 63) | 5.9% THC (n = 66) | 13.4% THC (n = 62) | P value |
|---|---|---|---|---|
| Age, mean (SD), y | 28.1 (7.3) | 30.7 (8.8) | 30.9 (8.6) | .11 |
| Male, No. (%) | 32 (50.8) | 47 (71.2) | 39 (62.9) | .057 |
| Female, No. (%) | 31 (49.2) | 19 (28.8) | 23 (37.1) | |
| Education, mean (SD), y | 15.0 (1.9) | 14.9 (2.0) | 15.3 (2.0) | .44 |
| Race and ethnicity, No. (%) | ||||
| African American | 8 (12.7) | 6 (9.1) | 4 (6.5) | .62 |
| Asian | 5 (7.9) | 8 (12.1) | 4 (6.5) | |
| Hispanic | 15 (23.8) | 19 (28.8) | 22 (35.5) | |
| Indigenous | 5 (7.9) | 2 (3.0) | 1 (1.6) | |
| Multiracial | 2 (3.2) | 3 (4.5) | 2 (3.2) | |
| Non-Hispanic White | 28 (44.4) | 28 (42.4) | 27 (43.5) | |
| Unknown | 0 | 0 | 2 (3.2) | |
| Miles driven past year, median (IQR) | 8730 (5420-12 825) | 9300 (5298-12 665) | 8280 (5040-13 320) | .97 |
| Cannabis | ||||
| Current cannabis use <4 times/wk, No. (%) | 34 (54.0) | 33 (50.0) | 31 (50.0) | .88 |
| Days used, mean (SD), last 30 d | 16.9 (9.7) | 16.0 (9.6) | 17.3 (10.2) | .77 |
| Grams/d when using, median (IQR), last 30 d | 0.55 (0.25-1) | 0.55 (0.30-1) | 0.50 (0.25-1) | .62 |
Abbreviation: THC, tetrahydrocannabinol.
Smoking Topography and Blinding
There were no significant group differences in grams of cannabis/placebo material used during the session (estimated from the weight returned) (mean [SD]: placebo, 0.47 [0.17]; 5.9% THC, 0.44 [0.17], 13.4% THC, 0.43 [0.15]; P = .42). At approximately 15 minutes after smoking initiation, there was a significant difference (P < .001) in blood THC concentrations between all 3 groups (mean [SD]: placebo, 1.3 [1.9] ng/mL; 5.9 THC%, 50.6 [40.8] ng/mL; 13.4% THC, 32.7 [29.3] ng/mL), with the 5.9% THC group reaching the highest concentration.32 A total of 117 individuals (92%) in the THC group correctly guessed their treatment assignment. There was no difference between the 5.9% THC and 13.4% THC groups (62 [94%] vs 55 [90%]; P = .61]); 30 (48.3%) in the placebo group believed they received active THC.
Primary Outcomes
Crashes
There were no significant differences between the 3 groups on the number of crashes at any time point (odds ratio range, 0.78-1.57; P > .75).
CDS
Compared with placebo, the THC groups had a significant decline in CDS performance; there were no differences between the 2 THC groups in change over time (likelihood ratio χ24 = 3.83; P = .43; Figure 2A). Thus, the 2 groups were combined for subsequent analyses (eFigure in Supplement 2).
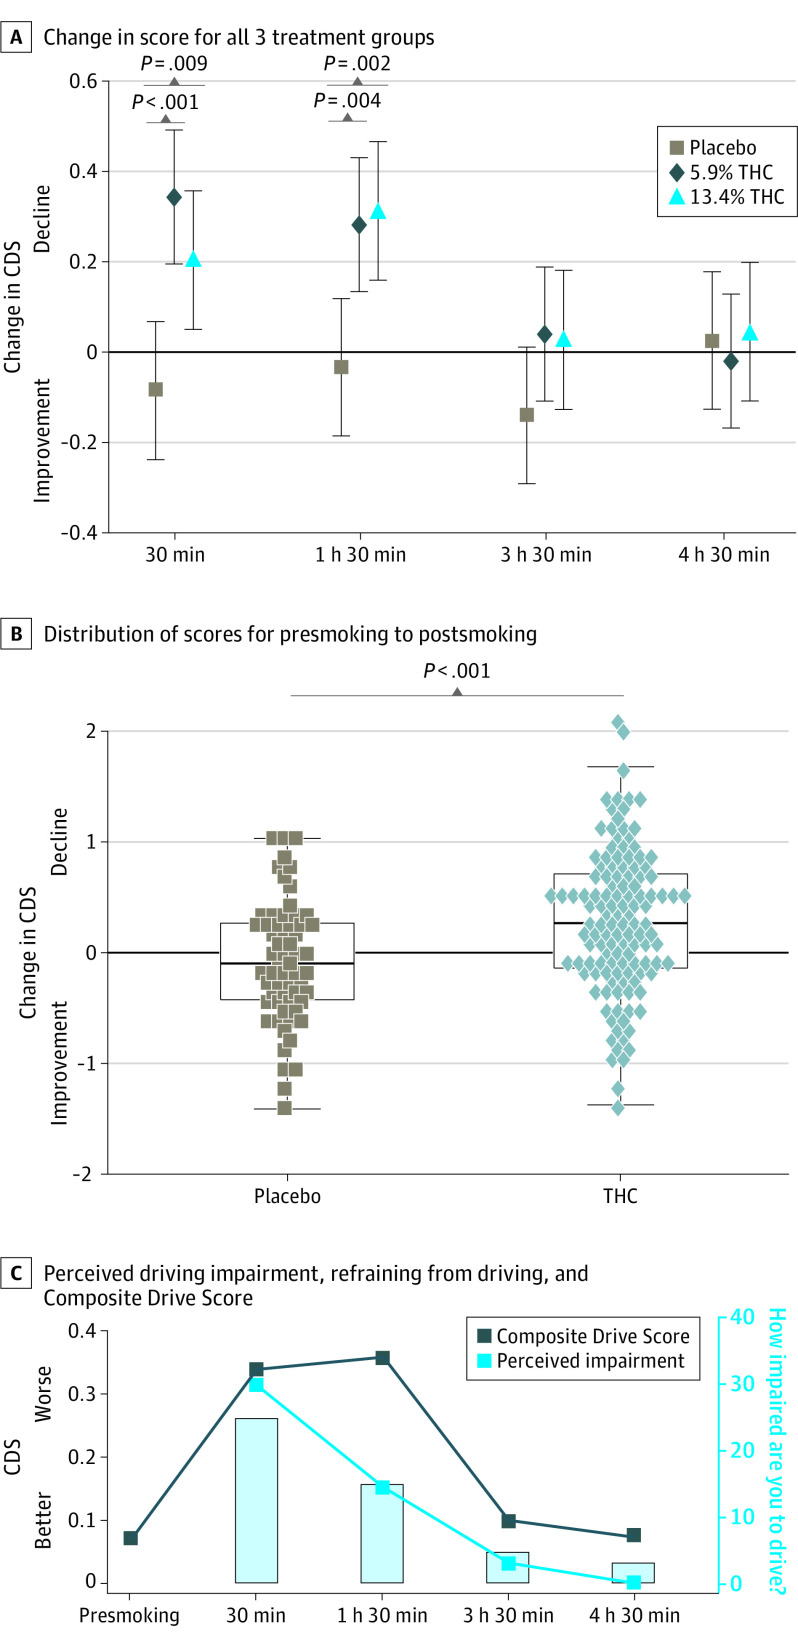
Table 2 summarizes the CDS results, with change from presmoking score as the primary outcome. Compared with changes in the placebo group, the THC group had significantly greater declines at 30 minutes and 1 hour 30 minutes. The differences were no longer statistically significant at 3 hours 30 minutes (Cohen d = 0.29 [95% CI, –0.02 to 0.60]; P = .07) or 4 hours 30 minutes (Cohen d = –0.03 [95% CI, –0.33 to 0.28]; P = .87). The CDS did not differ by sex (Cohen d = 0.18 [95% CI, –0.04 to 0.41]; P = .11) and controlling for sex (because THC/placebo groups differed: 86 [67.2%] vs 32 [50.8%] were male, respectively; P = .049) did not change results. There were no significant practice effects in the placebo group (Table 2).
Table 2. : Composite Drive Score for the Placebo and THC Groups at Each Time Point
| Time point | Composite Drive Score | Change in mean Composite Drive Score from time 1yoi210082t2n1 | ||||||
|---|---|---|---|---|---|---|---|---|
| Mean (SD) | Placeboyoi210082t2n2 | THCyoi210082t2n3 | Difference (THC vs placebo)yoi210082t2n4 | |||||
| Placebo group | THC group | Cohen d (95% CI) | P value | Cohen d (95% CI) | P value | Cohen d (95% CI) | P value | |
| 1 (Presmoke) | –0.09 (0.64) | 0.06 (0.55) | NA | NA | NA | NA | NA | NA |
| 2 (30 min) | –0.17 (0.61) | 0.34 (0.61) | –0.14 (–0.39 to 0.11) | .27 | 0.45 (0.28 to 0.63) | <.001 | 0.59 (0.28 to 0.90) | <.001 |
| 3 (1 h 30 min) | –0.13 (0.61) | 0.36 (0.62) | –0.06 (–0.31 to 0.19) | .64 | 0.49 (0.31 to 0.67) | <.001 | 0.55 (0.24 to 0.86) | <.001 |
| 4 (3 h 30 min) | –0.23 (0.59) | 0.10 (0.61) | –0.24 (–0.49 to 0.02) | .07 | 0.05 (–0.13 to 0.23) | .56 | 0.29 (–0.02 to 0.60) | .07 |
| 5 (4 h 30 min) | –0.07 (0.66) | 0.07 (0.57) | 0.04 (–0.21 to 0.29) | .76 | 0.01 (–0.16 to 0.19) | .88 | –0.03 (–0.33 to 0.28) | .87 |
The test for the overall significance in differences of changes between the THC and the placebo was statistically significant (P < .001).
Each placebo time point score compared with the placebo presmoking score.
Each THC time point score compared with the THC presmoking score.
Comparison of change from baseline between placebo and THC groups.
Abbreviations: NA, not applicable; THC, tetrahydrocannabinol.
The THC group performed significantly worse than the placebo group at 30 minutes, although some participants performed similarly to those in the placebo group (Figure 2B). Based on a 15th percentile cut point in the distribution of CDS change scores from the placebo group, 57 of 125 individuals (45.6%) in the THC group would be classified as impaired at 30 minutes (eAppendix in Supplement 2).
Drive Subscores
The changes in performance for the individual driving variables comprising the CDS (collected at the specified distances) were generally consistent with the CDS, showing significant changes at 30 minutes and at 1 hour 30 minutes (eTable 1 in Supplement 2). Differences in changes on the divided attention task were only seen at 30 minutes. In addition, time driving out of lane during the modified Surrogate Reference Task was significantly different at 1 hour 30 minutes.
Perception of Effects and Performance
After smoking, but prior to driving, the THC group reported being significantly more impaired to drive at all time points, with the rating dropping at each time point (eTable 2A in Supplement 2). At 30 minutes, 57 of 120 (47.5%) in the THC group would drive in their current state; this number increased to 81 (68.6%) at 1 hour 30 minutes, 107 (90%) at 3 hours 30 minutes, and 110 (93.2%) at 4 hours 30 minutes (eTable 2B in Supplement 2; Figure 2C).
After driving, the THC group rated cannabis as affecting their performance more than the placebo group at all time points. However, their rating of how well they drove was worse than the placebo group only at 30 minutes (eTables 3A and B in Supplement 2).
Driving Performance and THC Blood Concentrations
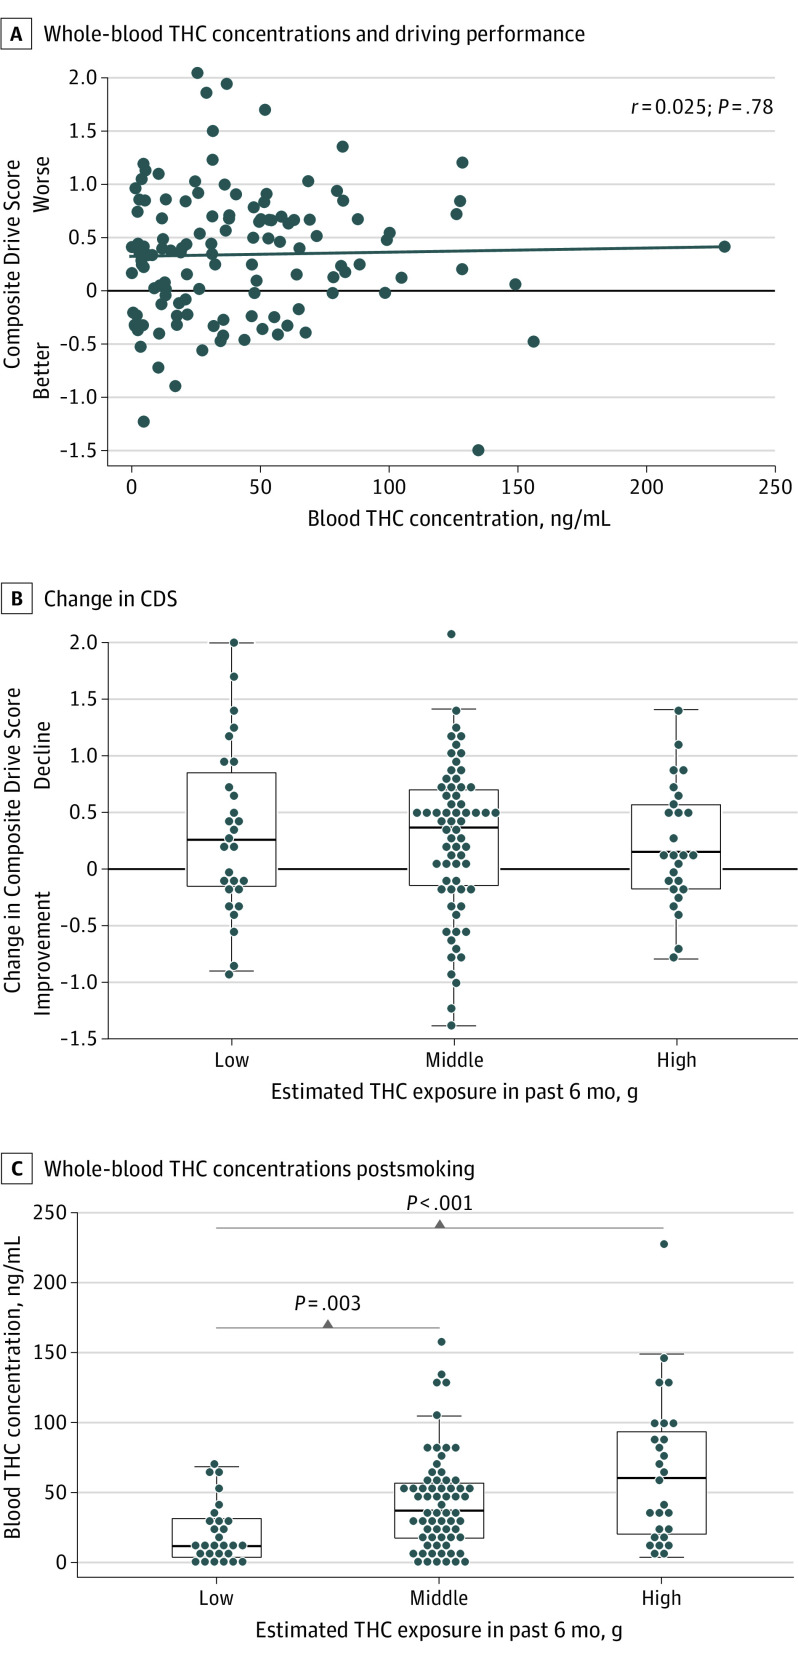
Within the THC group, there was no relationship between blood THC concentrations at 30 minutes and the CDS (r = .025, P = .78; Figure 3A) or any of the subsequent time points (eTable 4 in Supplement 2).
Cannabis Use History (Intensity) and Driving Performance
Within the THC group, after smoking there were no differences between the subgroups with the highest, middle, or lowest intensity of use (in the past 6 months) in how high they felt (F2,112 = 1.75; P = .18), nor the CDS changes at 30 minutes (F2,117 = 0.243; P = .79; Figure 3B) or across all time periods (F8,581 = 1.08; P = .38). However, postsmoking blood THC concentrations significantly differed across all 3 groups (Kruskal-Wallis χ22 = 16.3; P < .001), with the lowest-intensity group having the lowest concentrations (median [IQR], 11.8 [3.8-31.4] ng/mL; P = .003 vs middle, P < .001 vs high) and the highest-intensity group having the highest concentrations (median [IQR], 60.5 [20.4-93.5] ng/mL; P = .08; middle: median [IQR], 37.2 [17.5-56.4] ng/mL) (Figure 3C).
Discussion
In this study of 191 regular cannabis users randomized to smoke THC or placebo cigarettes ad libitum, we found worse performance in the THC group on a measure of overall driving simulator performance as well as specific driving challenges, including a divided attention task, adding to a growing literature that THC negatively impacts driving ability.5,33,34 The magnitude of the effect was in the medium range (Cohen d of approximately 0.5035), suggesting a nontrivial difference.
When instructed to “smoke as you would at home to get high,” we found no significant differences in driving performance or THC blood concentrations,32 based on the THC content of the cannabis, supporting the importance of smoking topography (deepness of inhalation, period of holding, etc).5,36,37,38 There is concern that the increasing THC content in products will result in significantly greater road safety risks. However, the current study suggests that some users may smoke such products in a manner that results in no greater impairment than lower-THC products. These findings do not necessarily translate to other methods of administration, such as dabbing, vaping, and oral consumption where self-titration is more difficult, although a recent study suggests concentrate users may self-titrate.39
While the THC group generally reported feeling impaired and hesitant to drive at 30 minutes, at 1 hour 30 minutes participants increasingly rated themselves as safe to drive, whereas simulator data indicated ongoing reduced driving performance (Figure 2C), including being more likely to leave their lane. These first few hours may constitute a period of greatest risk because users who are self-evaluating whether it is safe to drive may be less likely to refrain from driving or to attempt to compensate for reduced functioning. This is an important topic for public safety messaging, since a goal is to keep impaired drivers off of the road prior to becoming a danger.
The effect size seen at 3.5 hours (Cohen d = 0.29) suggests lingering impairment in some participants, although the THC group’s driving was no longer statistically different from controls (P = .07). THC-associated driving reductions were resolved by 4.5 hours in most participants. This is generally consistent with the time frame noted in studies using lower–THC content materials.5,6,7,40,41,42 It is possible that impairments in other, unmeasured abilities may persist43 or become apparent over longer drives, although a recent 60-minute on-road study concluded that no negative THC effects were seen 4 to 5 hours after use.6
There was no correlation between blood THC concentrations collected 15 minutes after smoking and simulator performance at 30 minutes or any other time point even under our highly controlled conditions. In the real world, the time from consumption to a law enforcement stop and subsequent blood collections is highly variable, and the current results reinforce that per se laws based on blood THC concentrations are not supported.34,44
Greater intensity of cannabis use in the past 6 months was associated with reaching higher blood THC concentrations following smoking but not self-reported greater levels of highness nor worse driving performance than lower-intensity groups, consistent with development of behavioral tolerance.20 However, the current findings also suggest that when instructed to achieve a self-determined level of highness, users with a history of greater use intensity adapted to tolerance by increasing THC exposure, resulting in performance decrements similar to users with lower-intensity use and that they may not be less of a driving risk. Behavioral tolerance benefits may be more apparent in medicinal users who target specific symptoms (eg, pain) and maintain a consistent dosing level.
Lastly, based on the distribution of the placebo group, approximately half of the THC group would be categorized as impaired, suggesting that identifying those at greatest risk for impairment is not as straightforward as detecting recent use and remains an important public safety challenge. It is worth noting that alcohol exhibits a more consistent linear effect between blood (alcohol) levels and driving impairment, although even in that case there is significant variability between studies (and individuals) in the relationship between levels of ingestion and reductions in driving performance.45
Limitations
This study has a number of limitations. With the aim of maximizing ecological validity, we had individuals smoke to the level of highness they desire and thus did not address participants reaching particularly elevated highness levels, nor the effects of controlled dosing. However, it should be noted that studies using controlled smoking methods also find substantial variability in blood THC concentrations, suggesting an influence of smoking topography.46 The study may not be generalizable to infrequent or naive users, vulnerable populations (eg, older persons, individuals with medical conditions), or other routes of administration for which self-titration is difficult (eg, edibles) and thus may underestimate the effects of THC on driving in the broader, general public. Because the study did not include a nonuser control group, the study only addresses how regular users exposed to THC perform on the CDS compared with regular users receiving placebo. There is evidence that acute cannabis use can impair visual function (and driving); we cannot determine the specific correlates of reduced driving (cognitive, visual) because these were not comprehensively assessed.30 Classification of individuals as impaired on experimental driving simulator scenarios is dependent on the size/composition of the reference group and may differ with other samples. Because no measurements were made between 1 hour 30 minutes and 3 hours 30 minutes, we cannot comment on the timing of the maximum decline in driving score, nor the recovery trajectory during his period. The potential cumulative effects of serial smoking were not addressed. Lastly, while the simulations captured a reasonable sampling of driving behavior, we were unable to address whether performance over longer driving periods might show impairment.
Conclusions
In a placebo-controlled parallel study of regular cannabis users smoking cannabis with different THC content ad libitum, there was statistically significant worsening on driving simulator performance in the THC group compared with the placebo group. The THC content of the cannabis and intensity of prior cannabis use were not associated with driving outcomes; participants self-titrated in a manner that yielded similar reductions in driving performance, despite achieving different THC blood concentrations. A lack of insight regarding driving impairments, particularly at 90 minutes, is of concern, given that users will likely self-evaluate when they feel safe to drive. Although performance was improving at 3.5 hours, recovery was not fully seen until 4.5 hours postsmoking. The fact that not all participants consuming THC met the criteria for impairment underscores the interindividual variability seen with the impairing effects of cannabis.47 The lack of relationship between blood THC concentration and driving performance raises questions about the validity of per se laws. When users control their own intake, one cannot infer the level of impairment based on the THC content of the product, the level of behavioral tolerance in the individual, or the blood THC concentration. Future research should address factors such as individual biologic differences, personal experience with cannabis, and cannabis administration methods in relation to driving impairment.
References
- Driving under the influence of cannabis: an increasing public health concern.. JAMA., 2018. [DOI | PubMed]
- Cannabis-impaired driving: a public health and safety concern.. Clin Chem., 2015. [DOI | PubMed]
- Acute and chronic effects of cannabinoids on human cognition: a systematic review.. Biol Psychiatry., 2016. [DOI | PubMed]
- The effects of cannabis and alcohol on simulated arterial driving: influences of driving experience and task demand.. Accid Anal Prev., 2010. [DOI | PubMed]
- Cannabis effects on driving lateral control with and without alcohol.. Drug Alcohol Depend., 2015. [DOI | PubMed]
- Effect of cannabidiol and δ9-tetrahydrocannabinol on driving performance: a randomized clinical trial.. JAMA., 2020. [DOI | PubMed]
- Marijuana, alcohol and actual driving performance.. Hum Psychopharmacol., 2000. [DOI | PubMed]
- Medicinal Δ(9) -tetrahydrocannabinol (dronabinol) impairs on-the-road driving performance of occasional and heavy cannabis users but is not detected in Standard Field Sobriety Tests.. Addiction., 2012. [DOI | PubMed]
- EEG biomarkers acquired during a short, straight-line simulated drive to predict impairment from cannabis intoxication.. Traffic Inj Prev., 2020. [DOI | PubMed]
- Cannabis effects on driving longitudinal control with and without alcohol.. J Appl Toxicol., 2016. [DOI | PubMed]
- 11Tefft BC, Arnold LS. Cannabis use among drivers in fatal crashes in Washington State before and after legalization. AAA Foundation for Traffic Safety; 2020. Published January 2020. Accessed December 14, 2021. https://aaafoundation.org/cannabis-use-among-drivers-in-fatal-crashes-in-washington-state-before-and-after-legalization/
- Recreational marijuana and collision claim frequencies.. Bulletin., 2018
- An examination of relationships between cannabis legalization and fatal motor vehicle and pedestrian-involved crashes.. Traffic Inj Prev., 2020. [DOI | PubMed]
- Crash fatality rates after recreational marijuana legalization in Washington and Colorado.. Am J Public Health., 2017. [DOI | PubMed]
- Maintenance of blinding in clinical trials and the implications for studying analgesia using cannabinoids.. Cannabis Cannabinoid Res., 2016. [DOI | PubMed]
- Cannabis and psychomotor performance: a rational review of the evidence and implications for public policy.. Drug Test Anal., 2013. [DOI | PubMed]
- Lower Risk Cannabis use Guidelines for Canada (LRCUG): a narrative review of evidence and recommendations.. Can J Public Health., 2011. [DOI | PubMed]
- The effect of cannabis compared with alcohol on driving.. Am J Addict., 2009. [DOI | PubMed]
- Medical marijuana and driving: a review.. J Med Toxicol., 2014. [DOI | PubMed]
- Cannabis use and the development of tolerance: a systematic review of human evidence.. Neurosci Biobehav Rev., 2018. [DOI | PubMed]
- Determining the magnitude and duration of acute Δ9-tetrahydrocannabinol (Δ9-THC)-induced driving and cognitive impairment: a systematic and meta-analytic review.. Neurosci Biobehav Rev., 2021. [DOI | PubMed]
- Young and under the influence: a systematic literature review of the impact of cannabis on the driving performance of youth.. Accid Anal Prev., 2021. [DOI | PubMed]
- World Medical Association Declaration of Helsinki: ethical principles for medical research involving human subjects.. JAMA., 2013. [DOI | PubMed]
- Smoked cannabis’ psychomotor and neurocognitive effects in occasional and frequent smokers.. J Anal Toxicol., 2015. [DOI | PubMed]
- Blood and oral fluid cannabinoid profiles of frequent and occasional cannabis smokers.. J Anal Toxicol., 2021. [DOI | PubMed]
- Biomarkers of recent cannabis use in blood, oral fluid and breath.. J Anal Toxicol., 2021. [DOI | PubMed]
- 27Rosenthal TJ. STISIM Drive. Systems Technology, Inc; 2017.
- Cannabidiol (CBD) content in vaporized cannabis does not prevent tetrahydrocannabinol (THC)-induced impairment of driving and cognition.. Psychopharmacology (Berl)., 2019. [DOI | PubMed]
- 29ISO. ISO/TS 14198:2012: road vehicles: ergonomic aspects of transport information and control systems: calibration tasks for methods which assess driver demand due to the use of in-vehicle systems. Published November 2012. Accessed December 20, 2021. https://www.iso.org/standard/54496.html
- Effects of smoking cannabis on visual function and driving performance. a driving-simulator based study.. Int J Environ Res Public Health., 2020. [DOI | PubMed]
- Age and visual impairment decrease driving performance as measured on a closed-road circuit.. Hum Factors., 2002. [DOI | PubMed]
- Blood and oral fluid cannabinoid profiles of frequent and occasional cannabis smokers.. J Anal Toxicol., 2021. [DOI | PubMed]
- 33Capler R, Bilsker D, Van Pelt K, MacPherson D. Cannabis use and driving: evidence review. Canadian Drug Policy Coalition; 2017. Accessed December 14, 2021. https://drugpolicy.ca/wp-content/uploads/2017/02/CDPC_Cannabis-and-Driving_Evidence-Review_FINALV2_March27-2017.pdf
- 34Compton R. Marijuana-impaired driving: a report to Congress. National Highway Traffic Safety Administration; 2017. Accessed December 14, 2021. https://www.nhtsa.gov/sites/nhtsa.gov/files/documents/812440-marijuana-impaired-driving-report-to-congress.pdf
- 35Cohen J. Statistical Power Analysis for the Behavioral Sciences. 2nd ed. Lawrence Erlbaum Associates; 1988.
- Acute pharmacokinetic profile of smoked and vaporized cannabis in human blood and oral fluid.. J Anal Toxicol., 2019. [DOI | PubMed]
- Controlled cannabis vaporizer administration: blood and plasma cannabinoids with and without alcohol.. Clin Chem., 2015. [DOI | PubMed]
- Phase I and II cannabinoid disposition in blood and plasma of occasional and frequent smokers following controlled smoked cannabis.. Clin Chem., 2014. [DOI | PubMed]
- Association of naturalistic administration of cannabis flower and concentrates with intoxication and impairment.. JAMA Psychiatry., 2020. [DOI | PubMed]
- Marijuana’s impairing effects on driving are moderate when taken alone but severe when combined with alcohol.. Hum Psychopharmacol., 1998. [DOI]
- Dose related risk of motor vehicle crashes after cannabis use.. Drug Alcohol Depend., 2004. [DOI | PubMed]
- Cannabis use and driving-related performance in young recreational users: a within-subject randomized clinical trial.. CMAJ Open., 2018. [DOI | PubMed]
- Cannabis effects on driving skills.. Clin Chem., 2013. [DOI | PubMed]
- 44Logan B, Kacinko SL, Beirness DJ. An evaluation of data from drivers arrested for driving under the influence in relation to per se limits for cannabis. AAA Foundation for Traffic Safety; 2016. Accessed December 14, 2021. https://aaafoundation.org/evaluation-data-drivers-arrested-driving-influence-relation-per-se-limits-cannabis/
- Effects of acute alcohol consumption on measures of simulated driving: a systematic review and meta-analysis.. Accid Anal Prev., 2017. [DOI | PubMed]
- Strengths and limitations of two cannabis-impaired driving detection methods: a review of the literature.. Am J Drug Alcohol Abuse., 2019. [DOI | PubMed]
- The why behind the high: determinants of neurocognition during acute cannabis exposure.. Nat Rev Neurosci., 2021. [DOI | PubMed]