
CD96 marks a phenotypically distinct checkpoint-associated HCV-specific CD8+ T-cell subset featuring memory-associated states
Abstract
Introduction:
Hepatitis C virus (HCV) infection frequently progresses to chronicity, where persistent antigen exposure drives differentiation of virus-specific CD8+ T cells toward an exhausted phenotype. This state is defined by progressive upregulation of inhibitory receptors and functional impairment of antigen-specific T cells. Because patients span distinct clinical stages from acute infection to spontaneous resolution or therapy induced sustained virological response, HCV provides a unique model to study how T-cell exhaustion is established, maintained, and potentially reversed. While PD1 and TIGIT are well established in this context, CD96 (TACTILE) is a less-characterized receptor that shares its ligand CD155 with TIGIT and DNAM-1 and may modulate CD8+ T-cell differentiation and function.
Methods:
To evaluate the role of CD96 across infection stages, we used HCV-specific MHC class I tetramers combined with high-dimensional flow cytometry to phenotypically profile virus-specific CD8+ T-cells ex vivo in 32 patients spanning acute, subacute, chronic, spontaneously resolved infection, and post-treatment sustained virological response. We assessed CD96 co-expression with PD1/TIGIT, transcription factors (TCF1, TOX, IRF4, T-bet, NR2F6), and relevant differentiation and exhaustion markers.
Results:
CD96+ HCV-specific CD8+ T cells consistently increased relative to bulk across all stages of HCV infection, with approximately four-fold higher frequencies than bulk CD96+ CD8+ T cells (p<0.0001), and highest frequencies of 51,13% observed in the chronic group. Because CD96 expression was predominantly distributed continuously rather than strictly bimodal, we also report CD96 MFI as a continuous measurement alongside CD96+ frequencies. Phenotypically, HCV-specific and bulk CD96+ CD8+ T cells were enriched for IRF4+, TOX+ and TCF1+ subsets, suggesting possible reduced effector features and increased memory-associated characteristics. Notably, the CD96+ PD1+ TIGIT+ subset was about five times higher in HCV-specific than in bulk CD8+ T-cell populations (p<0.0001). In cross-sectional comparison, frequencies of CD96+ PD1+ TIGIT+ HCV-specific CD8+ T cells decreased, while the CD96- PD1- TIGIT- counterparts expanded.
Discussion:
These findings identify CD96 as a marker of a phenotypically distinct checkpoint-associated HCV-specific CD8+ T-cell subset featuring memory-associated rather than terminally exhausted states. Whether this phenotypic association has functional or therapeutic significance for combination immune therapy will require future studies, including direct functional assays of sorted CD96+ versus CD96- HCV-specific CD8+ T cells.
Article type: Research Article
Keywords: CD8+ T cells, CD96 (TACTILE), hepatitis C virus (HCV), immune checkpoint, T-cell exhaustion
Affiliations: Infectious Diseases Unit, I. Department of Medicine, University Medical Center Hamburg-Eppendorf, Hamburg, Germany; University of Cologne, Faculty of Medicine and University Hospital Cologne, Clinic III for Internal Medicine, Cologne, Germany; Institute of Hematopathology Hamburg HpH, Hamburg, Germany; German Center for Infection Research (DZIF), Partner Site Hamburg-Lübeck-Borstel-Riems, Hamburg, Germany; PROVIREX Genome Editing Therapies GmbH, Hamburg, Germany; Department of Internal Medicine IV & Division of Infectious Disease and Tropical Medicine, University Hospital Heidelberg, Heidelberg, Germany; German Center for Infection Research (DZIF), Partner Site Heidelberg, Heidelberg, Germany; Department of Oncology, Hematology and Bone Marrow Transplantation with Division of Pneumology, University Medical Center Eppendorf, Hamburg, Germany; Institute of Transfusion Medicine, University Medical Center Hamburg-Eppendorf, Hamburg, Germany; Division of Medical Oncology, University Hospital Basel, Basel, Switzerland; Laboratory of Translational Immuno-Oncology, Department of Biomedicine, University and University Hospital Basel, Basel, Switzerland; European Reference Network for Hepatological Diseases (ERN RARE-LIVER), Hamburg, Germany; Institute of Virology, Medical Faculty, University Hospital Düsseldorf, Heinrich-Heine-Universität, Düsseldorf, Germany
License: Copyright © 2026 Knapp, Ackermann, Wittner, Beisel, Cords, Westphal, Lam, Kummer, Woost, Peine, Pischke, Schultheiß, Lohse, Walker, Timm, Binder and Schulze zur Wiesch. CC BY 4.0 This is an open-access article distributed under the terms of the Creative Commons Attribution License (CC BY). The use, distribution or reproduction in other forums is permitted, provided the original author(s) and the copyright owner(s) are credited and that the original publication in this journal is cited, in accordance with accepted academic practice. No use, distribution or reproduction is permitted which does not comply with these terms.
Article links: DOI: 10.3389/fimmu.2026.1883007 | PubMed: 42516367 | PMC: PMC13402549
Relevance: Moderate: mentioned 3+ times in text
Full text: PDF (7.4 MB)
Introduction
With approximately 50 million affected people and 1 million new infections each year, hepatitis C virus (HCV) infection remains a global health burden with relevant health and economic effects (ref. 1, ref. 2). 30% of patients spontaneously clear the infection, while 70% of patients progress to chronicity (ref. 1, ref. 3). Today, direct-acting antivirals (DAAs) cure over 90% of cases (ref. 4–ref. 6). Due to its well-defined and stage-dependent clinical course, encompassing acute, chronic, and resolved phases as well as treatment-induced viral clearance, HCV infection provides a valuable model to study T-cell exhaustion driven by persistent antigen exposure (ref. 7, ref. 8). This framework enables for the analysis of dynamic changes in T-cell function and phenotype across different infection stages and after viral eradication.
Exhausted T cells represent a phenotype with diminished immune functions. These cells exhibit impaired function due to upregulation of immune-checkpoint molecules that send negative signals, thereby restricting T-cell activation and effector responses (ref. 9–ref. 11). The discovery of “programmed cell death protein 1” (PD1) (ref. 12–ref. 15) and “cytotoxic T-lymphocyte-associated protein 4” (CTLA4) (ref. 15–ref. 17) marks a milestone in translational immunology. Subsequently, treatment with checkpoint-blocking antibodies has transformed cancer therapy (ref. 18–ref. 20). “T cell activation, increased late expression” (TACTILE, CD96) represents an emerging immune checkpoint with unique properties compared to well-studied inhibitory receptors. First described in 1992 as a novel surface antigen on various immune cells (ref. 21), mucosal-associated invariant (MAIT) and CD8+ T cells exhibit the highest CD96 expression among T-cell subsets, while γδ T cells and regulatory T cells (Tregs) display lower levels (ref. 22). Comparing different effector subsets of CD4+ and CD8+ T cells, CD96 expression is highest in memory CD4+ and CD8+ T cells, especially enriched in Th1 CD4+ cells with a proinflammatory phenotype (ref. 23, ref. 24).
The CD96 molecule binds to its ligands “nectin-like protein 5” (NECL-5, CD155) (ref. 25–ref. 27) and “poliovirus receptor-related 1” (PVRL-1, CD111) (ref. 27, ref. 28). Unlike other well-established checkpoints, CD96 competes with the co-stimulatory receptor “DNAX accessory molecule-1” (DNAM-1) (ref. 29) and the co-inhibitory receptor “T-cell immune receptor with Ig and ITIM domains” (TIGIT) (ref. 30). Both of which also bind CD155 (ref. 25, ref. 31–ref. 35), positioning it as a critical regulatory node that may shift the balance between T-cell activation and inhibition. Multiple tumor models demonstrate enhanced tumor control, increased IFNγ production, or improved response to anti-PD1 therapy by blocking or genetically deleting CD96 (ref. 36–ref. 43). Dual TIGIT/CD96 blockade using bispecific antibodies like BMS-986442 (AGEN1777) achieves superior tumor control compared to single-agent TIGIT blockade (ref. 44) suggesting that CD96 is a candidate component of combination checkpoint strategies.
Despite emerging relevance in chronic viral infection and tumour immunity, CD96 remains substantially less well characterized on human virus-specific CD8+ T cells than PD1 or TIGIT, providing a clear rationale for its phenotypic characterisation in the well-defined human HCV setting. This study examined CD96 expression on HCV-specific CD8+ T cells at all stages of HCV infection, assessing its co-expression with PD1 and TIGIT along with key markers of activation and differentiation. The goal was to provide a detailed phenotypic, rather than functional or mechanistic, characterization of the CD96+ HCV-specific CD8+ T-cell subset. Given the low frequency of HCV-specific CD8+ T cells often below conventional detection limits, we conducted comprehensive MHC class I tetramer-based ex vivo phenotyping (ref. 45) which can detect virus-specific CD8+ T cells at extremely low frequencies (ref. 46, ref. 47) to identify distinct CD96-associated cellular states. We hypothesized that CD96 is enriched on HCV-specific CD8+ T and characterizes a specific subset of antigen-specific T cells with a unique phenotypic profile co-expressed with inhibitory receptors.
Material and methods
Ethic statement
Written informed consent was given by all study participants. The study was performed in accordance with the declaration of Helsinki and was reviewed by the local ethics board of the Ärztekammer Hamburg (WF14-09, PV4780, PV4081).
Patient cohort
Cryopreserved peripheral blood mononuclear cells (PBMC) from patients with confirmed hepatitis C virus infection at various disease stages were used for HCV-specific MHC class I tetramer staining and enrichment. All samples were collected at the Infectious Diseases Unit of the University Medical Center Hamburg-Eppendorf. Infection status was classified into acute (aHCV, n=7), subacute (sHCV, n=4), chronic (cHCV, n=12), spontaneously resolved (rHCV, n=7) and post treatment (tHCV, n=8) based on clinical records, serology, liver enzymes, symptoms and estimated infection duration derived from peripheral blood mononuclear cells (PBMC) Chronic HCV infection was defined as failure to clear the virus six months after infection (ref. 1, ref. 48). Cases lacking definitive clinical or immunological features of acute or chronic infection were classified as subacute (HCV RNA positive, > 12 weeks post-infection but < 6 months). These cases reflect intermediate clinical reality, in which not all infections can be definitively classified as acute or chronic. Patients post-treatment (tHCV) achieved a sustained virologic response (SVR), defined as the persistent absence of detectable HCV RNA in plasma ≥ 12 weeks after completion of antiviral therapy or, for patients with a shorter follow-up, at the last available timepoint post-therapy. Supplementary Table 1 provides demographic, clinical and virologic information for each HCV-infected patient.
HLA typing
High-definition molecular HLA class I and II typing by polymerase chain reaction specific sequence oligonucleotide (PCR-SSO) using the kit SSO LabType (One Lambda, Canoga Park, CA, USA) was done at the Institute of Transfusion Medicine at the University Medical Center Hamburg-Eppendorf based on the manufacturer’s instructions.
Sequencing of HCV isolates
Sequencing procedure of patient isolates was done as previously described at the Institute of Virology of the University Hospital Düsseldorf (ref. 49–ref. 51). Briefly, according to the manufacturer’s instruction the QIAamp Viral RNA Kit (Qiagen, Hilden, Germany) was used to extract RNA. Reverse transcription was carried out using SuperScript III (Invitrogen™, Thermo Fisher, Germany) and the reverse primer Oligo d(A) (ref. 52). A two-step nested PCR using GoTaq Polymerase (Promega, Walldorf, Germany) and genotype-specific primers were used to generate HCV amplicons. PCR conditions consisted of an initial denaturation step at 94 °C for 120 s, followed by 35 cycles of 30 s at 94 °C, 30 s at 55 °C, and 160 s at 72 °C, with a final extension at 72 °C for 10 min. Geneious version 10.2.6 (Biomatters, Auckland, New Zealand) was then used to directly evaluate PCR products.
MHC class I tetramer staining and enrichment
MHC class I tetramer-associated magnetic bead enrichment was conducted as previously described (ref. 30, ref. 45, ref. 49). The used HCV-specific MHC class I tetramers with HLA types and corresponding amino acid sequences can be found in T1. In brief, cryopreserved PBMC were thawed up and incubated with PE-labeled HLA class I tetramers matching the patients` HLA type. The enrichment of the MHC class I tetramer-positive HCV-specific cells was performed using anti-PE microbeads with LS columns for Magnetic Activated Cell Sorting (MACS) technology (Miltenyi Biotec, Bergisch Gladbach, Germany) according to the manufacturer’s protocol. The pre-enriched, depleted, and enriched fractions were used for surface and intracellular staining and for multicolor flow cytometry. Representative tetramer enrichment and total number of HCV-specific CD8+ T cells of each patient is shown in Supplementary Figure 1; Supplementary Table 3. The frequencies of HCV-specific MHC class I tetramer+ CD8+ T cells were calculated as previously described (ref. 53).
Table 1: Used tetramers for identification of HCV-specific CD8+ T cells.
| HLA-A molecule | Target protein | Amino acid position | Sequence |
|---|---|---|---|
| HLA-A*01:01 | NS3 | 1436 – 1444 | ATDALMTGY |
| HLA-A*02:01 | NS3 | 1406 – 1415 | KLVALGINAV |
| HLA-A*02:01 | NS3 | 1073 – 1081 | CINGVCWTV |
| HLA-A*24:02 | E2 | 717 – 725 | EYVLLLFLL |
The table shows the HLA-A molecules used for our tetramer stainings with corresponding target proteins, amino acid position and sequence of the epitopes.
Multicolor flow cytometry
PBMC were used for multiparametric flow cytometry after MHC class I tetramer staining and enrichment. To exclude death cells from the following analysis, LIVE/DEAD™ Fixable Near-IR dye (Invitrogen™, Thermo Fisher, Germany) was used as specified by the manufacturer. Surface staining was performed using an indirect staining with purified anti-CD352 (clone: W19035D, catalog-number: 332302, BioLegend) and BUV563 anti-ratIgG1/IgG2 (clone: G28-5, catalog-number: 748690, BD), as well as with fluorochrome-conjugated surface antibodies, including BUV805 anti-CD8 (clone: SK1, catalog-number: 612889, BD), BUV737 anti-CD73 (clone: AD2, catalog-number: 612812, BD), BUV661 anti-PD1 (clone: EH12.1, catalog-number: 750260, BD), BUV615 anti-CD38 (clone: HIT2, catalog-number: 751138, BD), BUV496 anti-CD28 (clone: CD28.2, catalog-number: 741168, BD), BUV395 anti-CD62L (clone: SK11, catalog-number: 565219, BD), BV785 anti-CD127 (clone: A019D5, catalog-number: 351330, BioLegend), BV650 anti-CD4 (clone: RPA-T4, catalog-number: 300536, BioLegend), BV605 anti-TIGIT (clone: A15153G, catalog-number: 372712, BioLegend), BV510 anti-CD39 (clone: A1, catalog-number: 328220, BioLegend), PerCP-Cy5.5 anti-CD69 (clone: FN50, catalog-number: 310926, BioLegend), PE-Dazzle anti-CD96 (clone: NK92.39, catalog-number: 338414, BioLegend), APC-Cy7 anti-CD14 (clone: 63D3, catalog-number: 367108, BioLegend), APC-Cy7 anti-CD19 (clone: HIB19, catalog-number: 302236, BioLegend), and AF700 anti-CD3 (clone: UCHT1, catalog-number: 300424, BioLegend). After surface staining, cells were fixed and permeabilized using the eBioscience™ Foxp3/transcription factor staining buffer set (Invitrogen™, Thermo Fisher, Germany). For intracellular staining, BV711 anti-T-bet (clone: 4B10, catalog-number: 644819, BioLegend), BV421 anti-TCF1 (clone: S33-966, catalog-number: 566692, BD), FITC anti-NR2F6 (polyclonal, catalog-number: orb222499, biorbyt), PE-Cy7 anti-IRF4 (clone: 3E4, catalog-number: 25-9858-82, Thermo Fisher) and APC anti-TOX (clone: REA473, catalog-number: 130-118-335, Miltenyi Biotec) fluorochrome-conjugated antibodies were used. The flow cytometry panel is provided in Supplementary Table 2. Measurements were performed using a BD FACSymphony™ A3 machine and FACSDiva version 8 for Windows (BD Bioscience, San Jose, USA). Because CD96 expression on human CD8+ T cells was predominantly continuously distributed rather than strictly bimodal, CD96 was analyzed both as a frequency and as a continuous variable (mean fluorescence intensity, MFI). Samples were included in subset-level analyses only if at least 20 tetramer+ HCV-specific CD8+ T-cell events were recorded after enrichment. Representative enrichment and per-sample tetramer+ event counts are shown in Supplementary Figure 1; Supplementary Table 3.
Statistical analysis
FlowJo™ version 10.9.0 software (BD Bioscience, San Jose, USA) was used for the analysis of all flow cytometric data. The basic gating strategy for identification of CD8+ HCV-specific T cells can be found in Supplementary Figure 2. Statistical analysis was performed using GraphPad Prism version 10 (GraphPad software, San Diego, CA). For comparison of individual non-paired samples, the Mann-Whitney test was used. Paired analyses were performed using Wilcoxon matched-pairs signed rank test. Results with a p-value smaller than 0.05 were considered significant, where *, **, ***, and **** indicate p-values between 0.01 and 0.05, 0.001 and 0.01, 0.0001 and 0.001, and < 0.0001, respectively. Box-plots or individual values with or without mean and standard deviation were used for data expression. All frequencies mentioned in the text have been mathematically rounded to two decimal places. The exact values were used for the statistical analysis.
Results
Study cohort, demographics and clinical characteristics
The study cohort included 32 clinically characterized patients with hepatitis C virus infection (Supplementary Table 1), categorized by HCV infection status: acute (aHCV, n=7), subacute (sHCV, n=4), chronic (cHCV, n=12) and spontaneously resolved HCV infection (rHCV, n=7), as well as patients post treatment (tHCV, n=8). HCV-specific CD8+ T cells were analyzed and phenotyped via HCV-specific HLA class I tetramers and 20-parameter flow cytometry as previously described (ref. 30, ref. 45, ref. 49). To capture dynamics of the immunological status, six patients were assessed at two distinct stages of infection (T1 and T2, aHCV or sHCV and rHCV or tHCV). Except for the post-treatment group, all patients were treatment-naive at the time of sample collection. Detailed demographic and clinical characteristics for all patients are available in T2; Supplementary Table 1. The summarized demographic and clinical data for each patient group based on clinically documented infection status are presented in T3. After establishing this cohort, we next aimed to characterize the expression patterns of CD96 on HCV-specific CD8+ T cells across these clinical stages.
Table 2: Short demographics and clinical characteristics from all patients of the study cohort.
| Patient | Status | HLA-A | Age | Sex | AST [U/L] | ALT [U/L] | Viral load [IU/mL] | Genotype | Therapy |
|---|---|---|---|---|---|---|---|---|---|
| HCV01 | aHCV | *02:01, *03:01 | 51 | ♀ | n/a | n/a | n/a | 1a | – |
| HCV02 | rHCV | *02:01, *11:01 | 49 | ♂ | 12 | 19 | < | n/a | – |
| HCV03 | tHCV | *02:01, – | 48 | ♂ | 8 | 18 | < | 1a | IIb study IFN vs. IFN + Ribavirin |
| HCV04 | cHCV | *02:01, *03:01 | 41 | ♂ | 42 | 48 | n/a | 3a | IFN + Ribavirin |
| HCV05 | cHCV | *24:02, *31:01 | 31 | ♀ | 47 | 40 | 400,000 | 3a | – |
| HCV06 | sHCVtHCV | *02:01, – | 3233 | ♂ | 15956 | 36456 | n/a< | n/a | IFN |
| HCV07 | sHCV | *01:01, *30:01 | 29 | ♂ | 39 | 58 | 40,000,000 | 1a | Ribavirin + NS3/4A-I + nnRNAP-I |
| HCV08 | cHCV | *01:01, *33:01 | 47 | ♂ | n/a | n/a | 3,000,000 | 3a | – |
| HCV09 | cHCV | *02:01, – | 65 | ♂ | 36 | 36 | 20,000,000 | 2b | IFN + Ribavirin |
| HCV10 | aHCVrHCV | *01:01, *23:01 | 54 | ♀ | 48511 | 112611 | 30,000,000< | 3a | – |
| HCV11 | rHCV | *01:01, *24:02 | 47 | ♀ | 34 | 35 | < | n/a | – |
| HCV12 | sHCVtHCV | *02:01, *11:01 | 2223 | ♀ | 16713 | 2658 | 400,000< | 1a | IFN + Ribavirin |
| HCV13 | rHCV | *02:01, *03:01 | 50 | ♂ | n/a | n/a | < | n/a | – |
| HCV14 | aHCVtHCV | *02:01, *32:01 | 3638 | ♂ | 2220 | 3634 | 300,000< | 1a | IFN + Ribavirin |
| HCV15 | rHCV | *02:01, *68:01 | 61 | ♂ | 23 | 26 | < | n/a | – |
| HCV16 | tHCV | *03:01, *24:02 | 44 | ♂ | 21 | 19 | < | 1b | Ombitasvir + Paritaprevir + Ritonavir + Dasabuvir |
| HCV17 | sHCV | *01:01, *02:01 | 33 | ♀ | 87 | 212 | 41,200 | 1a | Sofosbuvir + Ledispavir |
| HCV18 | cHCV | *02:01, *11:01 | 55 | ♂ | 88 | 179 | 757,000 | 1a | Sofosbuvir + Ledispavir |
| HCV19 | aHCVrHCV | *01:01, *03:01 | 5253 | ♂ | 55829 | 95758 | 41,400< | 3 | – |
| HCV20 | tHCV | *02:01, *03:01 | 42 | ♂ | 17 | 27 | < | 1a | Glecaprevir + Pibrentasvir |
| HCV 21 | rHCV | *01:01, *02:01 | 48 | ♀ | 20 | 20 | < | n/a | – |
| HCV22 | aHCVtHCV | *02:01, *24:02 | 42 | ♂ | 90018 | 1,48819 | 11,900,000< | 3 | Sofosbuvir + Ledispavir |
| HCV23 | tHCV | *01:01, *02:01 | 60 | ♂ | n/a | n/a | n/a | 1a | Sofosbuvir + Ledispavir |
| HCV24 | cHCV | *01:01, – | 77 | ♀ | 69 | 74 | 272,000 | 1a | Glecaprevir + Pibrentasvir |
| HCV25 | cHCV | *02:01, *03:01 | 49 | ♂ | 22 | 61 | 1,860,000 | 4 | Grazoprevir |
| HCV26 | cHCV | *02:01, *29:02 | 69 | ♂ | 61 | 70 | 1,060,000 | 3 | – |
| HCV27 | cHCV | *02:01, *03:01 | 51 | ♂ | 24 | 40 | 13,000,000 | 1a | – |
| HCV28 | aHCV | *02:01, *24:02 | 30 | ♂ | 690 | 2155 | 4,590,000 | 3 | – |
| HCV29 | cHCV | *24:02, *25:01 | 20 | ♂ | 62 | 202 | 552,000 | 3 | – |
| HCV30 | cHCV | *02:01, *03:01 | 72 | ♀ | 39 | 53 | 920,000 | 1b | – |
| HCV31 | cHCV | *01:01, *02:01 | 46 | ♂ | 90 | 126 | 1,480,000 | 3 | Glecaprevir + Pibrentasvir |
| HCV32 | aHCV | *02:01, *31:01 | 40 | ♂ | 85 | 465 | 128,000 | 1b | Glecaprevir + Pibrentasvir |
The table shows patient ID, infection state, HLA-A, age at sample collection, sex, aspartate aminotransferase (AST), alanine aminotransferase (ALT), viral load, HCV genotype and therapy. All laboratory parameters are measured at date of sample collection.Bold values indicate the patients HLA types matching the used tetramers.
Table 3: Summarized demographic and clinical data for each group based on clinically documented infection status.
| Status | n | Sex | Age[years] | Viral load[IU/mL] | Albumin[g/L] | Bilirubin[mg/dL] | AST[U/L] | ALT[U/L] | GGT[U/L] | AP[U/L] | CRP[mg/L] | Quick[INR] |
|---|---|---|---|---|---|---|---|---|---|---|---|---|
| aHCV | 7 | ♀ 2♂ 5 | 44[36 – 54] | 7,826,567[41,400 – 30,000,000]n/a n=1 | 38,1[43 – 34,6]n/a n=1 | 2,15[0,7 – 6,4]n/a n=1 | 457[22 – 900]n/a n=1 | 1034[36 – 2155]n/a n=1 | 645[261 – 1396]n/a n=1 | 160[60 – 318]n/a n=2 | 12,5 [11 – 14]<5 n=3n/a n=2 | 0,99[0,97 – 1]n/a n=4 |
| sHCV | 4 | ♀ 2♂ 2 | 29[22 – 33] | 13,480,400[41,200 – 40,000,000]n/a n=1 | 41,5[39,4 – 43]n/a n=1 | 0,5[0,4 – 0,7]n/a n=0 | 113[39 – 167]n/a n=0 | 225[58 – 364]n/a n=0 | 93[29 – 209]n/a n=0 | 60[52 – 74]n/a n=0 | <5 n=1n/a n=3 | 0,96[0,9 – 1,05]n/a n=1 |
| cHCV | 12 | ♀ 3♂ 9 | 52[20 – 77] | 3,936,455[40,000 – 20,000,000]n/a n=1 | 40,8[34,3 – 47,2]n/a n=3 | 0,56[0,4 – 0,9]n/a n=3 | 53[22 – 90]n/a n=1 | 85[36 – 202]n/a n=1 | 122[21 – 645]n/a n=1 | 82[47 – 167]n/a n=1 | <5 n=8n/a n=4 | 1,13[1 – 1,3]n/a n=9 |
| rHCV | 7 | ♀ 4♂ 3 | 52[47 – 61] | viral load of allsamples is belowdetection limit | 41,6[39 – 44]n/a n=3 | 0,38[0,2 – 0,5]n/a n=3 | 22[11 – 34]n/a n=1 | 28[11 – 58]n/a n=1 | 52[16 – 173]n/a n=1 | 80[59 – 139]n/a n=1 | <5 n=1n/a n=6 | 1,02[1 – 1,04]n/a n=5 |
| tHCV | 8 | ♀ 1♂ 7 | 41[23 – 60] | viral load is below detection limit n=7n/a n=1 | 42[40 – 47]n/a n=2 | 0,55[0,4 – 0,7]n/a n=6 | 22[8 – 56]n/a n=1 | 26[8 – 56]n/a n=1 | 39[19 – 94]n/a n=2 | 44[36 – 61]n/a n=3 | 8 n=1<5 n=4n/a n=3 | 1,02[0,94 – 1,14]n/a n=5 |
| all | 38 | ♀ 12♂ 26 | 46[20 – 77] | 6,535,080[41,200 – 40,000,000]below detection limit n=14n/a n= 4 | 41[40 – 47,2]n/a n=10 | 0,9[0,2 – 6,4]n/a n=13 | 119[8 – 900]n/a n=4 | 247[8 – 2155]n/a n=4 | 186[16 – 1396]n/a n=5 | 85[36 – 318]n/a n=7 | 11[8 – 14]<5 n=17n/a n=18 | 1,02[0,9 – 1,3]n/a n=24 |
The table shows sex, age, viral load, albumin, bilirubin, aspartate aminotransferase (AST), alanine aminotransferase (ALT), gamma-glutamyl transferase (GGT), alkaline phosphatase (AP), C-reactive protein (CRP) and international normalized ratio (INR) for the different HCV subgroups. The values are calculated as arithmetic mean. If values were not available (mentioned as n/a), arithmetic mean was calculated out of the known samples.
HCV-specific CD8+ T cells show elevated CD96 expression across all stages of disease with highest frequency and MFI in chronic infection
PD1 is a well-characterized immune checkpoint in chronic viral infections, including HCV, where its upregulation on virus-specific CD8+ T cells is associated with impaired effector function (ref. 14, ref. 54–ref. 57). Furthermore, blocking the PD1 signaling pathway can restore CD8+ T-cell function in chronic HCV infection (ref. 13) and may also impact HCV viremia (ref. 58). Similarly, TIGIT, which shares the ligand of CD96 (ref. 25–ref. 27, ref. 31–ref. 34), is also upregulated on HCV-specific T cells (ref. 30), and exerts inhibitory effects on immune function (ref. 59–ref. 61). Therefore, the aim was to compare the frequencies of PD1+, TIGIT+, and CD96+ cells (f1) in bulk and HCV-specific CD8+ T-cell subsets As expected, HCV-specific CD8+ T cells exhibited significantly higher frequencies of PD1+ (46,58% vs. 23,03%, p<0,0001) and TIGIT+ (57,09% vs. 45,13%, p=0,0014) cells compared to bulk CD8+ T cells. Notably, the frequencies of CD96+ cells were also significantly increased in the HCV-specific CD8+ T-cell subset compared to bulk (41,02% vs. 10,84%, p<0,0001) (f1).
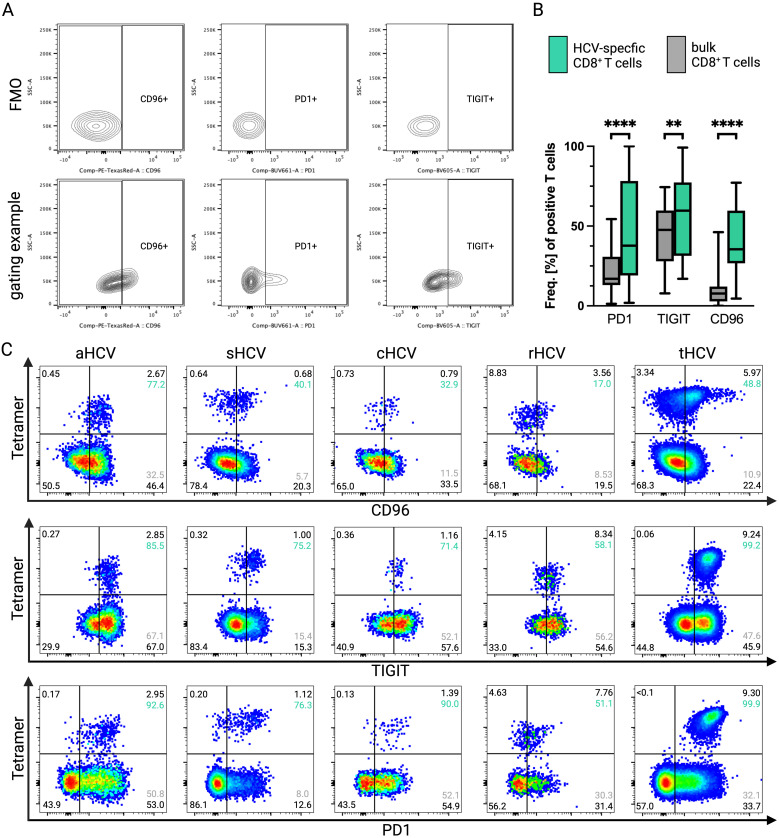
Next, the expression dynamics of CD96 across clinical stages was characterized. HCV-specific CD8+ T cells showed higher frequencies in acute (42,29% vs. 17,32%, p=0,0156), chronic (51,13% vs. 12,69%, p=0,0005), spontaneously resolved (33,37% vs. 4,74%, p=0,0156) and treated (32,84% vs. 7,90%, p=0,0078) infection compared to bulk CD8+ T cells, with peak levels observed in the chronic group (f2). Comparing the frequencies of CD96+ bulk and HCV-specific CD8+ T cells across the different disease stages revealed no significant differences.
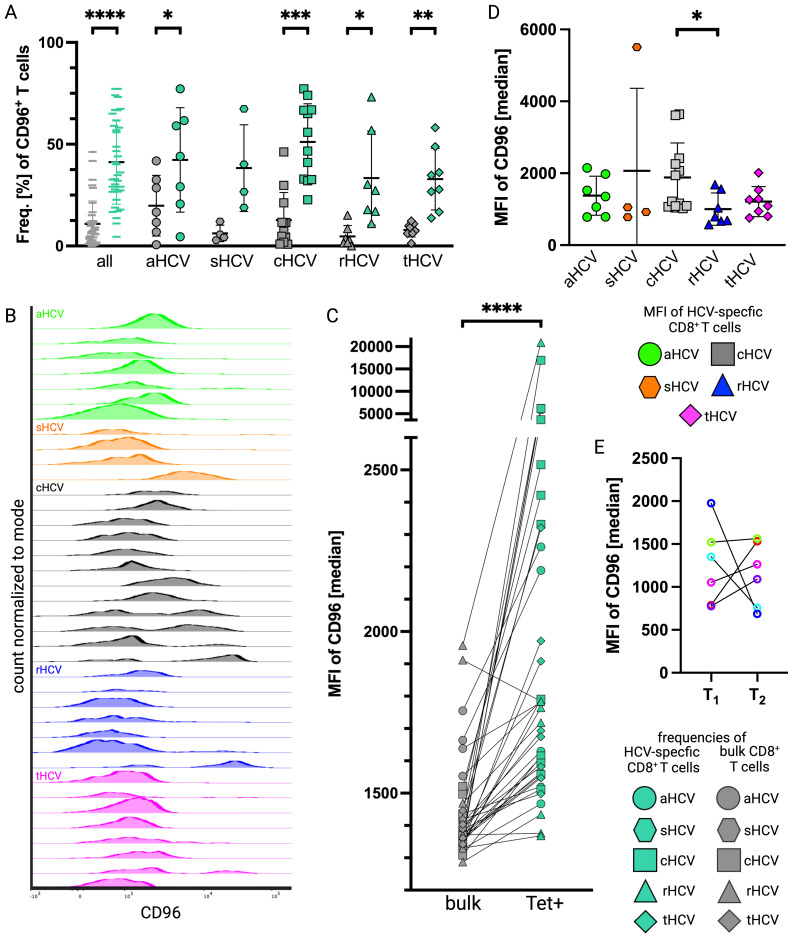
Because CD96 expression was mostly continuously distributed rather than strict bimodal, especially in acute, subacute, resolved, and treated patients, CD96 was analyzed both by frequency and as MFI. This analysis (f2) showed that CD96 expression on CD96+ CD8+ T cells is significantly increased on HCV-specific compared to bulk cells (3626,47 vs. 1709,88, p<0,0001) (f2). Moreover, in the HCV-specific subset, the MFI showed a statistical trend toward increased levels in the chronic group compared to the other groups (f2), with a significantly higher MFI of CD96 in cHCV patients compared to the rHCV patients (1882,33 vs. 1001,29, p=0,0130). A comparative analysis of samples from patients collected during (sub-)acute stages and after spontaneous resolution or treatment did not show significant differences in CD96 MFI (MFI 1244,33 vs. 1149, p>0,9999) (f2). The MFI of PD1 significantly decreased after viral clearance (1667 vs. 541,83, p=0,0312) (Supplementary Figure 3C), and TIGIT showed a similar trend, although it was not statistically significant (2823 vs. 1732,83, p=0,0938) (Supplementary Figure 4C). No predictive factors for changes in CD96 expression after viral clearance were identified from patient characteristics (Supplementary Table 1).
CD96+ HCV-specific CD8+ T cells are marked by increased frequencies of IRF4+, TCF1+ and TOX+ cells
Comparing a broad panel of proteins, including lineage markers (CD3, CD4, CD8, CD14, CD19), adenosine-signaling pathways (CD38, CD39, CD73), immune checkpoints (PD1, TIGIT, CD96), activation marker (CD28), transcription factors (IRF4, NR2F6, T-bet, TCF1, TOX), and markers of various functional T cells (CD62L, CD127, CD69, Slamf6), allowed the characterization of the expression signature of HCV-specific versus bulk CD8+ T cells. The HCV-specific subset showed significantly higher frequencies of CD28+ (75,89% vs. 66,90%, p=0,0341), CD38+ (41,17% vs. 20,79%, p=0,0015), IRF4+ (95,82% vs. 88,36%, p<0,0001), PD1+ (46,58% vs. 23,03%, p<0,0001) and TIGIT+ (57,09% vs. 45,13%, p=0,0014) cells, while the frequencies of CD62L+ (14,47% vs. 24,27%, p<0,0001) and NR2F6+ (61,30% vs. 76,72%, p=0,0003) cells were significantly decreased (f3). For CD39/CD73 subsets (Supplementary Figure 5A), the frequencies of CD39+ CD73+ (1,83% vs. 0,70%, p=0,0060) and CD39+ CD73- (19,52% vs. 4,95%, p=0,0006) cells were significantly higher in the HCV-specific CD8+ T-cell subset compared to the bulk population, while the frequencies of CD39- CD73- (52,17% vs. 59,73%, p=0,0253) cells were significantly lower (Supplementary Figure 5B).
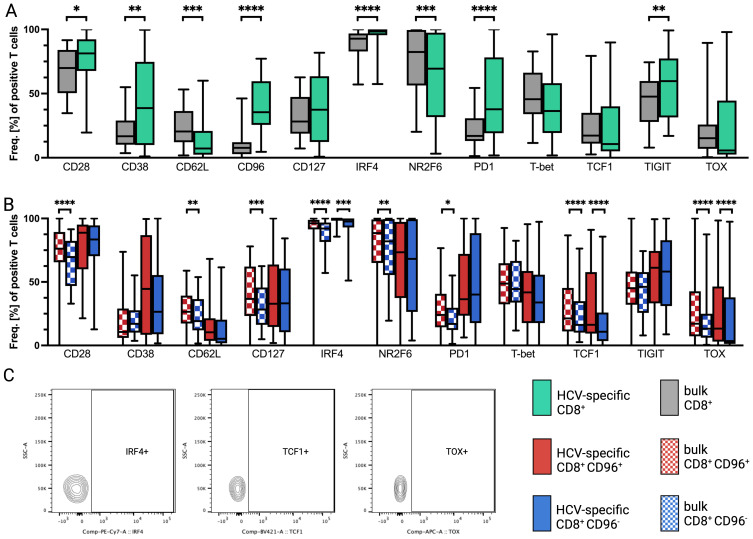
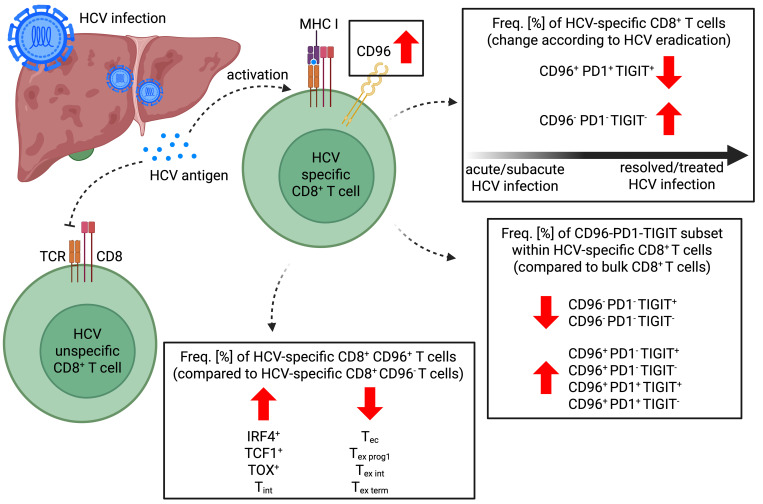
Given that HCV-specific T cells were predominantly CD96+, we examined how these cells differed from the CD96- population. We found significantly higher frequencies of IRF4+ (98,39% vs. 94,35%, p=0,0002), TCF1+ (29,67% vs. 19,97%, p<0,0001) and TOX+ (27,23% vs. 20,80%, p<0,0001) cells in the CD96+ subset compared to the CD96- HCV-specific CD8+ T-cells (f3).
Analysis of the CD96+ bulk CD8+ T-cell subset revealed significantly elevated frequencies of CD28+ (74,78% vs. 65,76%, p<0,0001), CD62L+ (27,79% vs. 23,85%, p=0,0054), CD127+ (40,40% vs. 31,21%, p=0,0001), IRF4+ (89,59% vs. 88,07%, p<0,0001), NR2F6+ (78,49% vs. 75,98%, p=0,0022), PD1+ (27,55% vs. 21,82%, p=0,0109), TCF1+ (29,17% vs. 22,90%, p<0,0001) and TOX+ (27,85% vs. 20,31%, p<0,0001) cells in the CD96+ compared to the CD96- bulk CD8+ T-cell subset (f3). For the CD39/CD73 subsets, the CD96+ population tended to exhibit increased frequencies of the CD39+ CD73- subset compared to the CD96- population, while lower frequencies of the CD39- CD73+ and CD39- CD73- subsets were observed. However, these differences were statistically significant only for the overall CD8+ T cells with the CD39+ CD73- (9,99% vs. 3,65%, p=0,0006) and CD39- CD73- (54,42% vs. 59,93%, p=0,0236) subsets (Supplementary Figure 5C).
CD96+ HCV-specific CD8+ T cells show deviant frequencies of functional T-cell phenotypes compared to their CD96- counterparts
To evaluate the functional development of the CD8+ T cells, we classified cells based on CD127 and CD62L expression into effector (Tec, CD127- CD62L-), effector memory (Tem, CD127+ CD62L-), intermediate (Tint, CD127- CD62L+) and naïve/central memory (Tn/cm, CD127+ CD62L+) CD8+ T cells (ref. 62, ref. 63) (f4). This CD127/CD62L-based scheme functions as a simplified phenotypic framework rather than as a definitive lineage classification, and the Tn/cm designation reflects the fact that naïve and central memory cells cannot be reliably distinguished with the current marker set. HCV-specific CD8+ T cells exhibited significantly higher frequencies of Tem (56,02% vs. 44,91%, p=0,0038) but significantly lower frequencies of Tint (1,44% vs. 3,19%, p=0,0026) and Tn/cm (12,67% vs. 20,35%, p=0,0028) cells compared to bulk CD8+ T cells (f4).
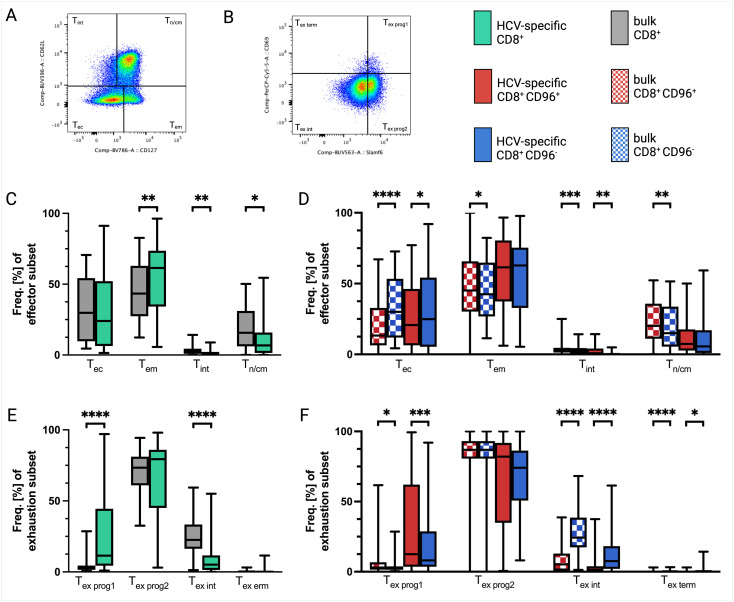
A comparative analysis of CD96+ and CD96- cells showed that the CD96+ subset had significantly lower frequencies of Tec in both HCV-specific (26,50% vs. 29,72%, p= 0,0243) and bulk (20,76% vs. 32,09%, p<0,0001) populations. Conversely, Tint frequencies were notably higher in HCV-specific (2,53% vs. 0,81%, p=0,0032) and bulk (4,48% vs. 3,10%, p=0,0006) subsets. For Tem (49,05% vs. 44,79%, p=0,0298) and Tn/cm (23,08% vs. 20,03%, p=0,0058), only the CD96+ bulk, and not the HCV-specific CD8+ T cells, showed significantly increased frequencies compared to CD96- cells, although similar trends were observed in the HCV-specific population (f4).
Finally, the interconnections between CD96 and exhaustion markers was investigated. While on average 41,02% of all HCV-specific CD8+ T cells were CD96+, the TIGIT+ HCV-specific CD8+ T cells showed increased frequencies of 58,86% CD96+ cells, and for the PD1+ HCV-specific CD8+ T-cell subset, 64,29% of cells were CD96 +. These increased frequencies of CD96+ cells were significant for all HCV-specific CD8+ T cells compared to the PD1+ (p< 0.0001) and the TIGIT+ (p< 0.0001) subset (data not shown). Using CD69 and Slamf6 to differentiate phenotypic subsets previously associated with distinct exhausted T cell subsets, the cells were categorized as quiescent resident progenitor 1 (Tex prog1, Slamf6+ CD69+), proliferative circulating progenitor 2 (Tex prog2, Slamf6+ CD69-), circulating mildly cytotoxic intermediate (Tex int, Slamf6- CD69-) and terminally exhausted resident (Tex term, Slamf6- CD69+) T cells (ref. 64) (f4). HCV-specific CD8+ T cells showed an increase in frequencies for Tex prog1 (25,38% vs. 3,74%, p<0,0001) but a decrease in Tex int (9,40% vs. 24,78%, p<0,0001) compared to bulk (f4). For the Tex prog1 cells, significantly elevated frequencies were found in both the CD96+ bulk (6,37% vs. 3,53%, p=0,0129) and HCV-specific (31,01% vs. 19,66%, p=0,0005) CD8+ T-cell subsets compared to CD96- populations. The frequencies of the Tex int (8,68% vs. 27,09%, p<0,0001 respectively 4,17% vs. 13,23%, p<0,0001) and Tex term (0,34% vs. 0,56%, p<0,0001 respectively 0,28% vs. 1,18%, p=0,0175) subsets were significantly decreased in the CD96+ compared to the CD96- population for bulk as well as HCV-specific CD8+ T cells (f3). These SLAMF6/CD69 designations should be understood as phenotypic categories aligned with previously described exhaustion states, mainly because the underlying framework was based on murine chronic LCMV models and CD69 also indicates tissue-resident and recently activated cells (see Limitations).
CD96/PD1/TIGIT co-expression on HCV-specific CD8+ T cells significantly differs from the bulk CD8+ T-cell population and changes upon HCV eradication
PD1 and TIGIT are well-characterized inhibitory receptors linked to dysfunctional T cells. PD1 signaling reduces proliferation, cytokine production und cytolytic activity (ref. 65, ref. 66) while TIGIT impairs IFNγ-production (ref. 67) and increases the suppressive function of Tregs (ref. 68). Both receptors are upregulated due to chronic antigen stimulation (ref. 30, ref. 69). The CD96 and TIGIT signaling pathways are key regulatory components in T- and NK-cell modulation (ref. 70, ref. 71). These receptors operate within an intricate network that includes molecules like DNAM-1, all sharing ligands to finely tune immune responses (ref. 27, ref. 28, ref. 31–ref. 34). Although CD96 (ref. 29, ref. 36, ref. 37, ref. 72) and TIGIT (ref. 73–ref. 76) are predominantly known by their inhibitory roles, emerging evidence suggests that CD96 might also have co-stimulatory effects, especially in CD8+ T cells (ref. 77, ref. 78). This functional duality positions CD96 and TIGIT as possible targets for immunotherapy, where strategic adjustment of their signaling pathways may potentiate immune responses (ref. 37, ref. 44), making their co-expression in HCV infection a subject of particular interest.
To investigate this co-expression, we analyzed the average frequencies of CD96/PD1/TIGIT populations in bulk and HCV-specific CD8+ T-cell subset (f5). We observed lower frequencies of CD96- PD1- TIGIT+ and CD96- PD1- TIGIT- and higher frequencies of CD96+ PD1+ TIGIT+ and CD96+ PD1+ TIGIT- subsets in the HCV-specific CD8+ T-cell population. In-depth analysis revealed a significant decrease in the HCV-specific CD8+ T-cell population for the CD96- PD1- TIGIT+ (12,86% vs. 25,00%, p<0,0001) and CD96- PD1- TIGIT- (19,53% vs. 44,53%, p<0,0001) subsets, whereas the frequencies of the CD96+ PD1- TIGIT+ (8,98% vs. 2,39%, p<0,0001), CD96+ PD1- TIGIT- (12,05% vs. 5,04%, p<0,0001), CD96+ PD1+ TIGIT+ (13,98% vs. 2,65%, p<0,0001) and CD96+ PD1+ TIGIT- (6,00% vs. 0,76%, p<0,0001) subsets were significantly increased compared to bulk (f5).
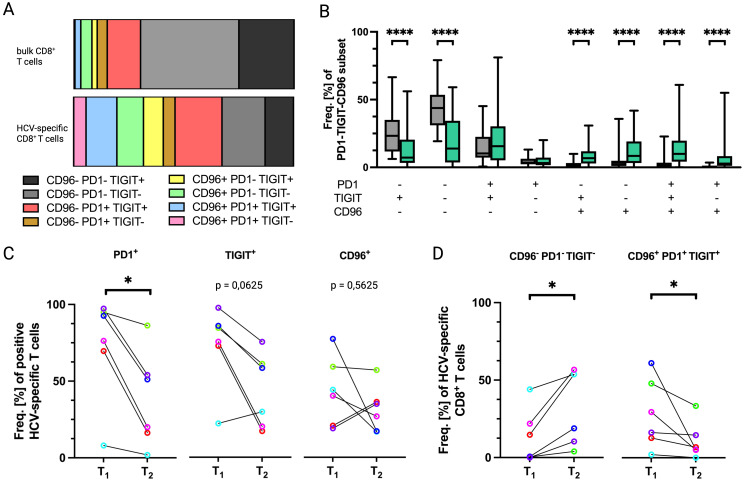
Patients who spontaneously resolve HCV infection exhibit lower frequencies of PD1+ CD8+ HCV-specific T cells (ref. 13, ref. 79), as well as patients after DAA therapy (ref. 80, ref. 81). It has also been reported that frequency of TIGIT+ CD8+ HCV-specific T cells decreases following spontaneous resolution of infection (ref. 30). Finally, we assessed how HCV clearance influences the CD8+ T-cell phenotype using samples of six patients at two different time points of infection (T1 and T2, aHCV or sHCV and rHCV or tHCV). We observed a significant reduction of the PD1+ subset after HCV eradication (73,12% vs. 38,26%, p=0,0312) (f5). For the TIGIT+ cells, there was also a clear trend toward decrease after eradication, but it did not reach statistical significance (72,78% vs. 43,43%, p=0,0625). No clear trend clear trend was detected in the CD96+ subset, even when comparing clinical parameters (Supplementary Table 1). Regarding changes in CD96/PD1/TIGIT co-expression (Supplementary Figure 6), there was a significant increase in the CD96- PD1- TIGIT- subset (13,61% vs. 32,89%, p=0,0312), while the CD96+ PD1+ TIGIT+ subset significantly decreased (28,13% vs. 10,80%, p=0,0312) after HCV eradication (f5).
Discussion
This study presents the first comprehensive analysis of CD96 expression patterns across all stages of HCV infection. It offers a detailed, hypothesis-generating phenotypic characterization of CD96 expression on HCV-specific CD8+ T cells across all major clinical stages of HCV infection. HCV-specific CD8+ T cells consistently exhibit higher levels of CD96+ HCV-specific CD8+ T cells compared to overall bulk populations, showing distinct trends from the well-known checkpoints PD1 and TIGIT.
The increase in CD96+ frequencies among HCV-specific compared to bulk CD8+ T cells was significant across all HCV-infection stages except the subacute group, likely due to the small sample size (n=4). We kept the sHCV classification of patients to preserve clinical detail rather than merging groups to increase statistical power. This underscores that clinical HCV staging remains difficult, even at specialized centers. Despite lacking statistical significance, these subacute patients also showed a clear trend toward higher frequencies of CD96+ HCV-specific CD8+ T cells (f1). Overall, these findings implicate that CD96 upregulation may be an integral part of the anti-HCV immune response during ongoing viral antigen presentation. Since CD96 expression showed a primarily continuous distribution rather than a strictly bimodal pattern, both frequency-based and intensity-based analyses were considered. MFI analysis indicated that CD96 expression peaks during chronic infection. Although only statistically significant compared to the rHCV group – probably due to cohort size – our data suggest that CD96 expression is elevated on HCV-specific CD8+ T cells throughout all infection stages. This pattern sharply contrasts with the better-known profiles of PD1 and TIGIT (ref. 13, ref. 30, ref. 79).
HCV-specific CD8+ T cells displayed a distinct phenotypic profile compared to bulk populations, marked by higher frequencies of CD28+, CD38+, IRF4+, PD1+, and TIGIT+ cells, along with lower frequencies of CD62L+ and NR2F6+ cells. Notably, the CD96+ subset was consistently enriched with IRF4+, TCF1+, and TOX+ cells compared to the CD96- subset, indicating a specific transcriptional program which could be linked to a flexible, memory-like state rather than terminal exhaustion. While TOX is traditionally associated with exhaustion during chronic viral infections (ref. 49, ref. 82, ref. 83), it is also expressed in polyfunctional memory T cells, regardless of TCF1 co-expression (ref. 84). TCF1 has been connected to HCV-specific memory-like CD8+ T cells (ref. 85), self-renewal (ref. 86) and activated stem cell-like precursor central memory-like CD8+ T cells. It is also crucial for maintaining exhausted CD8+ T cells with stem-cell like phenotype (ref. 87). TCF1 expression is regulated by T-cell receptor signaling strength (ref. 88), and higher levels of CD8+ T cells expressing Transcription factor 7, which encodes for TCF1, are associated with improved responses to anti-PD1 therapy (ref. 89). The co-expression of TCF1 and TOX in CD96+ cells could indicate that these cells may display some degree of therapeutic plasticity, with a lower likelihood toward terminal exhaustion, than their CD96- counterparts. Additionally, IRF4 overexpression can promote T-cell exhaustion and downregulation of TCF1 (ref. 90). However, IRF4 also plays a key role in the differentiation, proliferation, and function of effector and memory cytotoxic CD8+ T cells. It regulates the production of interleukin-9 (IL-9) by IL-9-producing (Tc9) CD8+ T cells and the development of IL-17-producing (Tc17) CD8+ T cells (ref. 91). Overall, our findings may further support the idea that there is a link between CD96 expression and memory-like features of CD8+ T cells. Because we did not measure IFNγ, TNFα, IL-2, granzyme B, perforin, CD107a, proliferation upon peptide restimulation, or response to checkpoint blockade, the link between the observed CD96-associated IRF4/TCF1/TOX pattern and any specific functional state remains speculative. While our study mainly focused on phenotypic analysis, the presence of TCF1 in CD96+ HCV-specific T cells suggests functional relevance (ref. 89). TCF1+ PD1+ T cells represent progenitor-exhausted cells with stem cell-like properties that respond to immune-checkpoint therapy (ref. 92, ref. 93). The maintenance of TCF1 expression in CD96+ cells, along with increased proportions of Tem (CD127+ CD62L-) and progenitor-exhausted (Slamf6+) characteristics (ref. 64), may indicates a higher probability for these cells to preserve proliferative and therapeutic potential with a less exhausted and non-viable phenotype. Additionally, the antigen-dependent, reversible regulation of the CD96+PD1+TIGIT+ triple-positive subset following viral clearance supports the idea that CD96 marks a more dynamic, non-terminally differentiated population. Consequently, our findings reinforce the connection between CD96 expression and memory-like CD8+ T-cell traits on a phenotypic based model, suggesting that this subset more likely maintains the proliferative and therapeutic capacities essential for effective immune-checkpoint blockade responses than the CD96- subset.
The CD127/CD62L-based classification served as a simplified phenotypic framework rather than a definitive delineation of human CD8+ T-cell differentiation states. HCV-specific CD8+ T cells were mainly CD127+ CD62L- effector memory (Tem) cells with higher frequencies in the CD96+ subgroup compared to the CD96- group. This aligns with reports describing a polarization of HCV-specific CD8+ T cells toward memory-like traits, with molecular patterns of exhaustion remaining even after HCV clearance (ref. 94). Within the CD96+ subset, CD8+ CD127- CD62L- Tec decreased, and CD127- CD62L+ Tint increased compared to CD96- cells. After activation, CD8+ T cells lower CD127 expression and then re-express it while reducing CD62L. Further differentiation depends on antigen exposure, leading to CD62L- CD127- Tec or CD62L+ CD127+ Tcm if the antigen is absent. Upon stimulation, these Tcm cells produce strong IL-2 responses and proliferate but show limited immediate cytotoxicity. In contrast, Tec cells exhibit high cytolytic activity but low proliferation. CD127+ CD62L- Tem display moderate effector function and recall capacity. Effector-type cells tend to protect against peripheral infections, whereas Tcm are more effective in systemic infections (ref. 63). This supports the idea that CD96+ CD8+ T cells are more memory-like. However, a more precise determination of CD8+ T-cell differentiation states would require additional markers such as CD45RA/CCR7, CD27/CD28, KLRG1, or CD57, which were not included in this panel. Future studies should ideally apply such extended panels and then analyze CD96 expression across differentiation states, rather than the other way round.
When using Slamf6 and CD69 to distinguish different states of exhausted T cells (ref. 64), the Tex prog1 subset is characterized by high TCF1 and CD28 expression, increased cytokine production, and strong proliferative capacity. Tex prog2 cells are highly proliferative, but produce fewer cytokines, have reduced TCF1 expression, and likely serve as a transitional stage toward Tex int. The Tex int subset is a precursor to the dysfunctional Tex term, which loses T-bet and gains Eomes and TOX (ref. 64). CD69 can reduce proliferative capacity (ref. 95), but using it to define subsets has limitations. CD69 is associated with tissue-resident cells (ref. 96, ref. 97), a population that may not be assessable using PBMC. It can also be assumed that the role of CD69 forming tissue-resident T cells depends on the specific tissue (ref. 98). Moreover, intrahepatic CD69+ CD8+ T cells show lower levels of cytotoxic proteins and T-bet (ref. 97). In mouse models, the CD69+ Tex prog2 and Tex term cells are rare in peripheral blood but enriched in the spleen (ref. 64). Therefore, subset distributions in peripheral blood may differ significantly from those in various tissues. At different stages of HCV infection, CD8+ bulk and HCV-specific CD96+ T cells were mainly composed of Slamf6+ CD69- proliferative circulating Tex prog2 cells. CD96+ CD8+ T cells exhibited higher frequencies of Tex prog1 but lower frequencies of the Tex int and Tex term subsets compared to CD96- cells. In summary, this further supports the thesis that CD96+ cells may be linked to a slightly impaired functional state, yet still capable of change over time, and therefore are not definitively differentiated. However, we also recognize that these phenotypic classifications should be interpreted cautiously when applied to peripheral blood-derived HCV-specific CD8+ T cells. Therefore, the cells analyzed from blood may not accurately represent the liver compartment, and positivity for CD69 does not automatically indicates tissue residency or exhaustion. Phenotypes derived from PBMC may not fully capture intrahepatic T-cell states. The exhaustion trajectory model based on expression of CD69 and Slamf6 primarily originates from murine and chronic infection settings. To better understand these phenotypes and functional subsets, future studies should include tissue-resident T cells, especially from the liver as the primary site of HCV infection, where elevated antigen exposure may influence T-cell differentiation, function, and CD96 expression.
Because PD1, TIGIT, and CD96 may act as potential therapeutic targets for immune-checkpoint blockade and markers of exhaustion, their co-expression was analyzed across all stages of HCV infection. PD1 inhibits T-cell activation through PD-L1/PD-L2–mediated signaling that affects T-cell receptor signaling (ref. 99) and metabolic modulation (ref. 100). This leads to decreased T-cell function, including reduced proliferation and cytokine production (ref. 101). Normally, this helps maintain immune tolerance (ref. 102), but PD1 deficiency can cause immune overactivation and autoreactivity (ref. 103, ref. 104). Tumor-associated PD-L1 upregulation suppresses anti-tumor responses, making the PD1 pathway a major therapeutic target (ref. 101). In chronic HCV-infection, intrahepatic CD8+ HCV-specific T cells show increased CTLA4, decreased CD28 and CD127, and fail to respond to anti-PD1 therapy, unlike their peripheral counterparts (ref. 105). TIGIT mediates intrinsic inhibitory signals in T and NK cells (ref. 73–ref. 76) through its immunoglobulin tail tyrosine (ITT)-like motif that binds “Growth Factor Receptor-Bound Protein 2” (Grb2), recruiting “Src homology region 2 domain-containing phosphatase-1” (SHP-1), and activating “phosphatidylinositol 3-kinase” (PI3K) and “mitogen-activated protein kinase” (MAPK) signaling (ref. 106). TIGIT also contains the “immunoreceptor tyrosine-based inhibition motif” (ITIM), which interacts with SHP-1, SHP-2, or the “Src homology 2 domain containing inositol polyphosphate 5-phosphatases 1 and 2” (SHIP1 or SHIP2) (ref. 107). Similarly, the YXXM motif of CD96 may bind the p85 subunit of PI3K via SH2, opens the possibility of inhibitory signaling potential (ref. 108). Therefore, it is conceivable that co-expression of PD1, TIGIT, and CD96 may result in a more inhibited, functionally restricted phenotype if their inhibitory signals are enhanced. However, because TIGIT and CD96 share the same ligand, there is also the possibility that co-expression could cause competitive binding, potentially limiting the function of one receptor. Considering the possibility of bidirectional signaling with co-inhibitory (ref. 36, ref. 109) and co-stimulatory (ref. 23, ref. 77) functions, these pathway connections may be highly relevant for further thesis generation and ongoing research. In our study, all CD96+ CD96/PD1/TIGIT subsets (CD96+ PD1+ TIGIT+, CD96+ PD1+ TIGIT-, CD96+ PD1- TIGIT+, CD96+ PD1- TIGIT-) were enriched in HCV-specific CD8+ T cells compared to the overall population, while CD96- PD1- TIGIT- and CD96- PD1- TIGIT+ CD8+ T cells declined. After HCV eradication, the frequencies of CD96+ PD1+ TIGIT+ cells decreased, whereas CD96- PD1- TIGIT- counterparts increased. This strengthens the assumption that ongoing antigen exposure sustains highly differentiated CD96+ PD1+ TIGIT+ T cells. It is consistent with the hypothesis that CD96 marks a dynamic, non-terminally differentiated population in chronic HCV infection, but it does not provide direct evidence for it.
The findings described above can carry translational therapeutic implications. AGEN1777 (TIGIT/CD96 bispecific antibody) shows improved anti-tumor response in preclinical models (ref. 44, ref. 110). GSK is testing the anti-CD96 antibody GSK6097608 in patients with advanced solid tumors (ref. 111). Blocking of CD96 enhances CD8+ anti-tumor response in mouse models and CD96-deficient CD8+ T cells demonstrate greater inhibition of tumor growth than CD96+ cells (ref. 37). Preclinical studies indicate that CD96 signaling limits T-cell cytotoxicity (ref. 36), as depletion or blockade of CD96 boosts anti-tumor responses in multiple mouse models (ref. 38–ref. 41), especially when combined with anti-PD1 therapy. Higher CD96 expression on CD8+ T cells in cancer correlates with poorer responses to anti-PD1 therapy, and combining PD1 and CD96 blockade further improves CD8+ T-cell function (ref. 42, ref. 43). In contrast, CD96Hi CD4+ T cells exhibit a Th1/Th17 phenotype with high secretion of IFNγ (ref. 23) and a co-stimulatory effect of CD96 on CD8+ T cells has been observed (ref. 78). These findings support an inhibitory role for CD96 and strengthen the thesis that combined checkpoint blockade could be more effective than PD1 inhibition alone, although some co-stimulatory effects of CD96 may also be present. Nonetheless, the specific effects of CD96 blockade as a standalone treatment remain unclear and require further clinical research. Assuming that the indications described here are correct and CD96+ CD8+ T cells have more memory-like phenotypes with sustained proliferative capacity, this subset could be a target for checkpoint-based immunotherapy and warrants further functional investigation.
We also need to address the limitations of this study, primarily the moderate cohort size, which may have restricted the detection of additional significant differences. Cohort composition was limited by the MHC class I tetramer approach and the requirement for specific HLA types, potentially reducing generalizability, as different HLA types or epitopes can provoke distinct immune responses (ref. 112, ref. 113). However, this approach provides the necessary resolution to characterize HCV-specific CD8+ T cells, which are often below the detection limits of conventional methods. Despite this variability, the consistent patterns observed in CD96 emphasize the patterns of this checkpoint signature. In this context, it should be acknowledged that the compared patient groups comprise relatively small sample sizes, particularly the subacute group. Nevertheless, we retained the current classification based on clinical documentation to ensure an unbiased representation of real-world clinical practice. We further have to acknowledge, that some observed differences between HCV-specific and bulk CD8+ T cells may reflect differences in activation and differentiation states, in addition to antigen specificity itself. Based on our findings for CD8+ HCV-specific T cells, we cannot draw broad conclusions about other infections. In this context, it has been reported that HIV-1 downregulates CD96 on CD4+ T cells as a viral escape (ref. 23). It is also important to note that our focus was on CD8+ T cells; however, the role of CD96 on CD4+ T cells also warrants investigation. Bunet et al. evaluated CD96 expression on CD8+ T cells in HIV infection and reported a reduction in HIV positive individuals, especially in typical progressors compared to elite controllers. Like our data, they also observed a correlation between activation-associated CD28 and CD96+ T cells. Their study linked CD96 downregulation to a terminally differentiated memory phenotype and concluded that the loss of CD96 may contribute to a suboptimal response to HIV infection (ref. 77). Consequently, although our study suggests that CD96+ CD8+ T cells in HCV maintain plasticity and memory functions with a higher probability than their CD96- counterparts, further research is needed to explore the bidirectional roles of CD96. Future studies should also include larger, more diverse cohorts, covering other acute and chronic viral and bacterial infections and varying therapeutic regimens, to determine if CD96 regulation is a conserved feature of human immune responses across pathogen-driven disease states. Independent validation of CD96 expression patterns in scRNA-seq and high-dimensional cytometry datasets from HCV and other (chronic) infection cohorts would further boost confidence in the current phenotypic observations. Future research involving functional testing of isolated CD96+ HCV-specific CD8+ T cells will be crucial to determine if the phenotypic differences observed here translate into altered cytotoxicity, proliferative capacity, or recall response. Additional analyses of intrahepatic HCV-specific CD8+ T cells, CD155/CD111 expression on hepatocytes and antigen-presenting cells, and DNAM-1 co-expression on CD96+ versus CD96- HCV-specific CD8+ T cells would help to clarify the ligand-dependent signaling context of CD96 in vivo. Additionally, while our phenotypic profiling offers indirect evidence, it is important to directly assess functionality of CD96+ versus CD96– subsets, especially before and after anti-CD96 intervention. Therefore, future studies should compare sorted CD96+ and CD96- CD8+ T cells in various functional assays to see if the phenotypic differences described here result in functional distinctions. Additionally, using antigen-specific CD8+ T cells would allow for consideration of disease-specific effects.
In summary, CD96+ CD8+ T cells were more prevalent in the HCV-specific population compared to the overall CD8+ T-cell pool. Chronic antigen stimulation increased CD96 expression, while transient antigen exposure or HCV eradication decreased it. Phenotypically, the CD96+ subset was enriched for IRF4+, TCF1+, and TOX+ CD8+ T cells, regardless of HCV specificity, may indicating an association between CD96 and a transcriptional or phenotypic program characterized by plasticity and memory-like features rather than terminal exhaustion. This subset contained fewer highly cytolytic Tec cells and higher frequencies of CD39+ CD73- cells, supporting a profile that could be less effector-like and more memory-associated. After HCV-eradication, frequencies of CD96+ PD1+ TIGIT+ HCV-specific CD8+ T cells declined, while their triple-negative counterparts increased, emphasizing the antigen-dependent nature of checkpoint molecule co-expression. Overall, these findings reinforce the notion that CD96 is a distinct checkpoint marker for memory-like HCV-specific CD8+ T cells which may retain greater therapeutic plasticity. This highlights the potential of CD96 as a checkpoint-expressing subset that could be relevant for future therapeutic research. Since we did not directly measure CD96 signaling, CD96 blockade, or combination checkpoint inhibition in CD8+ HCV-specific T cells, the translational implications presented here are speculative and meant to generate hypotheses. It remains to be seen, whether CD96+ HCV-specific CD8+ T cells respond differently to checkpoint blockade or work non-redundantly with anti-PD1 or anti-TIGIT in this disease setting. We therefore frame CD96 as a candidate population distinct from terminally exhausted cells and worth further functional and therapeutic investigation, rather than as an established therapeutic target.
References
- Hepatitis C.. 2024
- F Cui, D Faini, D Razavi-Shearer, H Razavi, C Manzengo Mingiedi, MA Gonzalez. The burden of chronic hepatitis B and C in 2022 and progress towards elimination: a global report.. Lancet Gastroenterol Hepatol. (, 2026. [DOI | PubMed]
- JM Micallef, JM Kaldor, GJ Dore. Spontaneous viral clearance following acute hepatitis C infection: a systematic review of longitudinal studies.. J Viral Hepat. (, 2006. [DOI | PubMed]
- G Indolfi, P Easterbrook, S Giometto, F Malik, R Chou, E Lucenteforte. Efficacy and safety of DAA in children and adolescents with chronic HCV infection: a systematic review and meta-analysis.. Liver Int. (, 2024. [DOI | PubMed]
- C Dietz, B Maasoumy. Direct-acting antiviral agents for hepatitis C virus infection-from drug discovery to successful implementation in clinical practice.. Viruses. (, 2022. [DOI | PubMed]
- L Coyer, O Njoya, R Njouom, T Mossus, MP Kowo, F Essomba. Achieving a high cure rate with direct-acting antivirals for chronic hepatitis C virus infection in Cameroon: a multi-clinic demonstration project.. Trop Med Int Health. (, 2020. [DOI | PubMed]
- CM Walker. Adaptive immunity to the hepatitis C virus.. Adv Virus Res. (, 2010. [DOI | PubMed]
- LM McLane, MS Abdel-Hakeem, EJ Wherry. CD8 T cell exhaustion during chronic viral infection and cancer.. Annu Rev Immunol. (, 2019. [DOI | PubMed]
- EJ Wherry. T cell exhaustion.. Nat Immunol. (, 2011. [DOI | PubMed]
- A Baessler, DAA Vignali. T cell exhaustion.. Annu Rev Immunol. (, 2024. [DOI | PubMed]
- A Chow, K Perica, CA Klebanoff, JD Wolchok. Clinical implications of T cell exhaustion for cancer immunotherapy.. Nat Rev Clin Oncol. (, 2022. [DOI | PubMed]
- Y Ishida, Y Agata, K Shibahara, T Honjo. Induced expression of PD-1, a novel member of the immunoglobulin gene superfamily, upon programmed cell death.. EMBO J. (, 1992. [DOI | PubMed]
- L Golden-Mason, B Palmer, J Klarquist, JA Mengshol, N Castelblanco, HR Rosen. Upregulation of PD-1 expression on circulating and intrahepatic hepatitis C virus-specific CD8+ T cells associated with reversible immune dysfunction.. J Virol. (, 2007. [DOI | PubMed]
- V Kasprowicz, J Schulze Zur Wiesch, T Kuntzen, BE Nolan, S Longworth, A Berical. High level of PD-1 expression on hepatitis C virus (HCV)-specific CD8+ and CD4+ T cells during acute HCV infection, irrespective of clinical outcome.. J Virol. (, 2008. [DOI]
- DY Chen, D Wolski, J Aneja, L Matsubara, B Robilotti, G Hauck. Hepatitis C virus-specific CD4+ T cell phenotype and function in different infection outcomes.. J Clin Invest. (, 2020. [DOI | PubMed]
- MF Krummel, JP Allison. CD28 and CTLA-4 have opposing effects on the response of T cells to stimulation.. J Exp Med. (, 1995. [DOI | PubMed]
- N Nakamoto, H Cho, A Shaked, K Olthoff, ME Valiga, M Kaminski. Synergistic reversal of intrahepatic HCV-specific CD8 T cell exhaustion by combined PD-1/CTLA-4 blockade.. PloS Pathog. (, 2009. [DOI | PubMed]
- AJ Korman, SC Garrett-Thomson, N Lonberg. The foundations of immune checkpoint blockade and the ipilimumab approval decennial.. Nat Rev Drug Discov. (, 2022. [DOI | PubMed]
- S Ali, M Arshad, M Summer, M Zulfiqar, S Noor, L Nazakat. Recent developments on checkpoint inhibitors, CAR T cells, and beyond for T cell-based immunotherapeutic strategies against cancer.. J Oncol Pharm Pract. (, 2025. [DOI | PubMed]
- Y Shiravand, F Khodadadi, SMA Kashani, SR Hosseini-Fard, S Hosseini, H Sadeghirad. Immune checkpoint inhibitors in cancer therapy.. Curr Oncol. (, 2022. [DOI | PubMed]
- PL Wang, S O’Farrell, C Clayberger, AM Krensky. Identification and molecular cloning of tactile. A novel human T cell activation antigen that is a member of the Ig gene superfamily.. J Immunol. (, 1992. [DOI]
- G Gruenbacher, O Nussbaumer, H Gander, B Steiner, N Leonhartsberger, M Thurnher. Stress-related and homeostatic cytokines regulate Vγ9Vδ2 T-cell surveillance of mevalonate metabolism.. Oncoimmunology. (, 2014. [DOI | PubMed]
- S Dehn, R Burkhard, J Leyens, T Kaiser, S Brandimarte, D Heiligensetzer. HIV-1 manipulates CD96 on CD4(+) T cells to subvert antiviral immunity.. Sci Adv. (, 2025. [DOI | PubMed]
- A Lepletier, VP Lutzky, D Mittal, K Stannard, TS Watkins, CN Ratnatunga. The immune checkpoint CD96 defines a distinct lymphocyte phenotype and is highly expressed on tumor-infiltrating T cells.. Immunol Cell Biol. (, 2019. [DOI | PubMed]
- FA Deuss, GM Watson, Z Fu, J Rossjohn, R Berry. Structural basis for CD96 immune receptor recognition of nectin-like protein-5, CD155.. Structure. (, 2019. [DOI | PubMed]
- D Meyer, S Seth, J Albrecht, MK Maier, L du Pasquier, I Ravens. CD96 interaction with CD155 via its first Ig-like domain is modulated by alternative splicing or mutations in distal Ig-like domains.. J Biol Chem. (, 2009. [DOI | PubMed]
- S Seth, MK Maier, Q Qiu, I Ravens, E Kremmer, R Förster. The murine pan T cell marker CD96 is an adhesion receptor for CD155 and nectin-1.. Biochem Biophys Res Commun. (, 2007. [DOI | PubMed]
- VM Holmes, C Maluquer de Motes, PT Richards, J Roldan, AK Bhargava, JS Orange. Interaction between nectin-1 and the human natural killer cell receptor CD96.. PloS One. (, 2019. [DOI | PubMed]
- CJ Chan, L Martinet, S Gilfillan, F Souza-Fonseca-Guimaraes, MT Chow, L Town. The receptors CD96 and CD226 oppose each other in the regulation of natural killer cell functions.. Nat Immunol. (, 2014. [DOI | PubMed]
- C Ackermann, M Smits, R Woost, JM Eberhard, S Peine, S Kummer. HCV-specific CD4+ T cells of patients with acute and chronic HCV infection display high expression of TIGIT and other co-inhibitory molecules.. Sci Rep. (, 2019. [DOI | PubMed]
- FA Deuss, GM Watson, KJ Goodall, I Leece, S Chatterjee, Z Fu. Structural basis for the recognition of nectin-like protein-5 by the human-activating immune receptor, DNAM-1.. J Biol Chem. (, 2019. [DOI | PubMed]
- SS Karade, RA Mariuzza. How natural killer cell receptors stick to cell-cell adhesion proteins.. Structure. (, 2019. [DOI | PubMed]
- C Bottino, R Castriconi, D Pende, P Rivera, M Nanni, B Carnemolla. Identification of PVR (CD155) and Nectin-2 (CD112) as cell surface ligands for the human DNAM-1 (CD226) activating molecule.. J Exp Med. (, 2003. [DOI | PubMed]
- S Tahara-Hanaoka, K Shibuya, Y Onoda, H Zhang, S Yamazaki, A Miyamoto. Functional characterization of DNAM-1 (CD226) interaction with its ligands PVR (CD155) and nectin-2 (PRR-2/CD112).. Int Immunol. (, 2004. [DOI | PubMed]
- B Zhang, W Zhao, H Li, Y Chen, H Tian, L Li. Immunoreceptor TIGIT inhibits the cytotoxicity of human cytokine-induced killer cells by interacting with CD155.. Cancer Immunol Immunother. (, 2016. [DOI | PubMed]
- CQ Wang, FC Choy, A Sanny, T Murakami, AH Tan, KP Lam. An inhibitory role for human CD96 endodomain in T cell anti-tumor responses.. Cells. (, 2023. [DOI | PubMed]
- D Mittal, A Lepletier, J Madore, AR Aguilera, K Stannard, SJ Blake. CD96 is an immune checkpoint that regulates CD8(+) T-cell antitumor function.. Cancer Immunol Res. (, 2019. [DOI | PubMed]
- H Harjunpää, SJ Blake, E Ahern, S Allen, J Liu, J Yan. Deficiency of host CD96 and PD-1 or TIGIT enhances tumor immunity without significantly compromising immune homeostasis.. Oncoimmunology. (, 2018. [DOI | PubMed]
- J Qiu, X Qu, Y Wang, C Guo, B Lv, Q Jiang. Single-cell landscape highlights heterogenous microenvironment, novel immune reaction patterns, potential biomarkers and unique therapeutic strategies of cervical squamous carcinoma, human papillomavirus-associated (HPVA) and non-HPVA adenocarcinoma.. Adv Sci (Weinh). (, 2023. [DOI | PubMed]
- Y Hanamatsu, C Saigo, Y Kito, T Takeuchi. An obstructive role of NK cells on metastatic growth of clear-cell sarcoma cells in a xenoplant murine model.. Mol Clin Oncol. (, 2021. [DOI | PubMed]
- C Boch, M Reschke, F Igney, P Maier, P Müller, S Danklmaier. Evaluating antibody pharmacokinetics as prerequisite for determining true efficacy as shown by dual targeting of PD-1 and CD96.. Biomedicines. (, 2022. [DOI | PubMed]
- Y Wang, C Wang, J Qiu, X Qu, J Peng, C Lu. Targeting CD96 overcomes PD-1 blockade resistance by enhancing CD8+ TIL function in cervical cancer.. J Immunother Cancer. (, 2022. [DOI | PubMed]
- H Zhang, Q Liu, Y Lei, J Zhou, W Jiang, Y Cui. Direct interaction between CD155 and CD96 promotes immunosuppression in lung adenocarcinoma.. Cell Mol Immunol. (, 2021. [DOI | PubMed]
- R Ward, N Ramsay, S Campbell, H Patel, M Bushell, BM Morin. Abstract 3915: BMS-986442 (AGEN1777), a novel TIGIT/CD96 bispecific antibody, demonstrates superior monotherapy and combination activity versus conventional anti-TIGIT antibodies in preclinical models.. Cancer Res. (, 2024. [DOI | PubMed]
- K Keetz, M Knapp, J Schulze Zur Wiesch. Utilizing pMHC multimers to study antigen-specific T cells and T cell exhaustion in chronic viral infections.. Methods Mol Biol. (, 2025. [DOI | PubMed]
- C Alanio, F Lemaitre, HK Law, M Hasan, ML Albert. Enumeration of human antigen-specific naive CD8+ T cells reveals conserved precursor frequencies.. Blood. (, 2010. [DOI | PubMed]
- E Barnes, SM Ward, VO Kasprowicz, G Dusheiko, P Klenerman, M Lucas. Ultra-sensitive class I tetramer analysis reveals previously undetectable populations of antiviral CD8+ T cells.. Eur J Immunol. (, 2004. [DOI | PubMed]
- J Grebely, M Prins, M Hellard, AL Cox, WO Osburn, G Lauer. Hepatitis C virus clearance, reinfection, and persistence, with insights from studies of injecting drug users: towards a vaccine.. Lancet Infect Dis. (, 2012. [DOI | PubMed]
- NH Wildner, A Walker, F Brauneck, V Ditt, S Peine, S Huber. Transcriptional pattern analysis of virus-specific CD8+ T cells in hepatitis C infection: increased expression of TOX and eomesodermin during and after persistent antigen recognition.. Front Immunol. (, 2022. [DOI | PubMed]
- S Ziegler, K Skibbe, A Walker, X Ke, FM Heinemann, A Heinold. Impact of sequence variation in a dominant HLA-A*02-restricted epitope in hepatitis C virus on priming and cross-reactivity of CD8+ T cells.. J Virol. (, 2014. [DOI | PubMed]
- A Walker, H Siemann, S Groten, RS Ross, N Scherbaum, J Timm. Natural prevalence of resistance-associated variants in hepatitis C virus NS5A in genotype 3a-infected people who inject drugs in Germany.. J Clin Virol. (, 2015. [DOI | PubMed]
- A Walker, M Bergmann, J Camdereli, R Kaiser, N Lübke, J Timm. A genotype independent, full-genome reverse-transcription protocol for HCV genotyping and resistance testing.. J Clin Virol. (, 2017. [DOI | PubMed]
- CL Day, NP Seth, M Lucas, H Appel, L Gauthier, GM Lauer. Ex vivo analysis of human memory CD4 T cells specific for hepatitis C virus using MHC class II tetramers.. J Clin Invest. (, 2003. [DOI | PubMed]
- A Rutebemberwa, SC Ray, J Astemborski, J Levine, L Liu, KA Dowd. High-programmed death-1 levels on hepatitis C virus-specific T cells during acute infection are associated with viral persistence and require preservation of cognate antigen during chronic infection.. J Immunol. (, 2008. [DOI | PubMed]
- JR Larrubia, S Benito-Martínez, J Miquel, M Calvino, E Sanz-de-Villalobos, T Parra-Cid. Costimulatory molecule programmed death-1 in the cytotoxic response during chronic hepatitis C.. World J Gastroenterol. (, 2009. [DOI | PubMed]
- T Shen, J Zheng, C Xu, J Liu, W Zhang, F Lu. PD-1 expression on peripheral CD8+ TEM/TEMRA subsets closely correlated with HCV viral load in chronic hepatitis C patients.. Virol J. (, 2010. [DOI | PubMed]
- H Radziewicz, CC Ibegbu, ML Fernandez, KA Workowski, K Obideen, M Wehbi. Liver-infiltrating lymphocytes in chronic human hepatitis C virus infection display an exhausted phenotype with high levels of PD-1 and low levels of CD127 expression.. J Virol. (, 2007. [DOI | PubMed]
- MJ Fuller, B Callendret, B Zhu, GJ Freeman, DL Hasselschwert, W Satterfield. Immunotherapy of chronic hepatitis C virus infection with antibodies against programmed cell death-1 (PD-1).. Proc Natl Acad Sci USA. (, 2013. [DOI | PubMed]
- RJ Johnston, L Comps-Agrar, J Hackney, X Yu, M Huseni, Y Yang. The immunoreceptor TIGIT regulates antitumor and antiviral CD8(+) T cell effector function.. Cancer Cell. (, 2014. [DOI | PubMed]
- S Li, J Ding, Y Wang, X Wang, L Lv. CD155/TIGIT signaling regulates the effector function of tumor-infiltrating CD8+ T cell by NF-κB pathway in colorectal cancer.. J Gastroenterol Hepatol. (, 2022. [DOI | PubMed]
- C Zhang, Y Wang, X Xun, S Wang, X Xiang, S Hu. TIGIT can exert immunosuppressive effects on CD8+ T cells by the CD155/TIGIT signaling pathway for hepatocellular carcinoma in vitro.. J Immunother. (, 2020. [DOI | PubMed]
- F Sallusto, D Lenig, R Förster, M Lipp, A Lanzavecchia. Two subsets of memory T lymphocytes with distinct homing potentials and effector functions.. Nature. (, 1999. [DOI | PubMed]
- MF Bachmann, P Wolint, K Schwarz, P Jäger, A Oxenius. Functional properties and lineage relationship of CD8+ T cell subsets identified by expression of IL-7 receptor alpha and CD62L.. J Immunol. (, 2005. [DOI | PubMed]
- JC Beltra, S Manne, MS Abdel-Hakeem, M Kurachi, JR Giles, Z Chen. Developmental relationships of four exhausted CD8(+) T cell subsets reveals underlying transcriptional and epigenetic landscape control mechanisms.. Immunity. (, 2020. [DOI | PubMed]
- H Arasanz, M Gato-Cañas, M Zuazo, M Ibañez-Vea, K Breckpot, G Kochan. PD1 signal transduction pathways in T cells.. Oncotarget. (, 2017. [DOI | PubMed]
- M Hashimoto, AO Kamphorst, SJ Im, HT Kissick, RN Pillai, SS Ramalingam. CD8 T cell exhaustion in chronic infection and cancer: opportunities for interventions.. Annu Rev Med. (, 2018. [DOI | PubMed]
- X Guan, R Hu, Y Choi, S Srivats, BY Nabet, J Silva. Anti-TIGIT antibody improves PD-L1 blockade through myeloid and Treg cells.. Nature. (, 2024. [DOI | PubMed]
- N Joller, E Lozano, PR Burkett, B Patel, S Xiao, C Zhu. Treg cells expressing the coinhibitory molecule TIGIT selectively inhibit proinflammatory Th1 and Th17 cell responses.. Immunity. (, 2014. [DOI | PubMed]
- CU Blank, WN Haining, W Held, PG Hogan, A Kallies, E Lugli. Defining ‘T cell exhaustion’.. Nat Rev Immunol. (, 2019. [DOI]
- HS Jin, Y Park. Hitting the complexity of the TIGIT-CD96-CD112R-CD226 axis for next-generation cancer immunotherapy.. BMB Rep. (, 2021. [DOI | PubMed]
- WC Dougall, S Kurtulus, MJ Smyth, AC Anderson. TIGIT and CD96: new checkpoint receptor targets for cancer immunotherapy.. Immunol Rev. (, 2017. [DOI | PubMed]
- SJ Blake, K Stannard, J Liu, S Allen, MC Yong, D Mittal. Suppression of metastases using a new lymphocyte checkpoint target for cancer immunotherapy.. Cancer Discov. (, 2016. [DOI | PubMed]
- N Joller, JP Hafler, B Brynedal, N Kassam, S Spoerl, SD Levin. Cutting edge: TIGIT has T cell-intrinsic inhibitory functions.. J Immunol. (, 2011. [DOI | PubMed]
- E Lozano, M Dominguez-Villar, V Kuchroo, DA Hafler. The TIGIT/CD226 axis regulates human T cell function.. J Immunol. (, 2012. [DOI | PubMed]
- N Stanietsky, H Simic, J Arapovic, A Toporik, O Levy, A Novik. The interaction of TIGIT with PVR and PVRL2 inhibits human NK cell cytotoxicity.. Proc Natl Acad Sci USA. (, 2009. [DOI | PubMed]
- N Stanietsky, TL Rovis, A Glasner, E Seidel, P Tsukerman, R Yamin. Mouse TIGIT inhibits NK-cell cytotoxicity upon interaction with PVR.. Eur J Immunol. (, 2013. [DOI]
- R Bunet, M Nayrac, H Ramani, M Sylla, M Durand, C Chartrand-Lefebvre. Loss of CD96 expression as a marker of HIV-specific CD8(+) T-cell differentiation and dysfunction.. Front Immunol. (, 2021. [DOI | PubMed]
- EY Chiang, PE de Almeida, DE de Almeida Nagata, KH Bowles, X Du, AS Chitre. CD96 functions as a co-stimulatory receptor to enhance CD8(+) T cell activation and effector responses.. Eur J Immunol. (, 2020. [DOI | PubMed]
- S Urbani, B Amadei, D Tola, M Massari, S Schivazappa, G Missale. PD-1 expression in acute hepatitis C virus (HCV) infection is associated with HCV-specific CD8 exhaustion.. J Virol. (, 2006. [DOI | PubMed]
- L Golden-Mason, J Klarquist, AS Wahed, HR Rosen. Cutting edge: programmed death-1 expression is increased on immunocytes in chronic hepatitis C virus and predicts failure of response to antiviral therapy: race-dependent differences.. J Immunol. (, 2008. [DOI | PubMed]
- S Li, E Mizukoshi, K Kawaguchi, M Miura, M Nishino, T Shimakami. Alterations in hepatocellular carcinoma-specific immune responses following hepatitis C virus elimination by direct-acting antivirals.. Int J Mol Sci. (, 2022. [DOI | PubMed]
- F Alfei, K Kanev, M Hofmann, M Wu, HE Ghoneim, P Roelli. TOX reinforces the phenotype and longevity of exhausted T cells in chronic viral infection.. Nature. (, 2019. [DOI | PubMed]
- O Khan, JR Giles, S McDonald, S Manne, SF Ngiow, KP Patel. TOX transcriptionally and epigenetically programs CD8(+) T cell exhaustion.. Nature. (, 2019. [DOI | PubMed]
- T Sekine, A Perez-Potti, S Nguyen, JB Gorin, VH Wu, E Gostick. TOX is expressed by exhausted and polyfunctional human effector memory CD8(+) T cells.. Sci Immunol. (, 2020. [DOI | PubMed]
- D Wieland, J Kemming, A Schuch, F Emmerich, P Knolle, C Neumann-Haefelin. TCF1(+) hepatitis C virus-specific CD8(+) T cells are maintained after cessation of chronic antigen stimulation.. Nat Commun. (, 2017. [DOI | PubMed]
- R Kratchmarov, AM Magun, SL Reiner. TCF1 expression marks self-renewing human CD8(+) T cells.. Blood Adv. (, 2018. [DOI | PubMed]
- X Zhao, Q Shan, HH Xue. TCF1 in T cell immunity: a broadened frontier.. Nat Rev Immunol. (, 2022. [DOI | PubMed]
- N Favret, MW Rudloff, P Zumbo, D Betel, M Philip. TCR signaling dynamically regulates TCF1 expression and effector differentiation.. J Immunol. (, 2023. [DOI]
- M Sade-Feldman, K Yizhak, SL Bjorgaard, JP Ray, CG de Boer, RW Jenkins. Defining T cell states associated with response to checkpoint immunotherapy in melanoma.. Cell. (, 2018. [DOI | PubMed]
- K Man, SS Gabriel, Y Liao, R Gloury, S Preston, DC Henstridge. Transcription factor IRF4 promotes CD8(+) T cell exhaustion and limits the development of memory-like T cells during chronic infection.. Immunity. (, 2017. [DOI | PubMed]
- M Huber, M Lohoff. IRF4 at the crossroads of effector T-cell fate decision.. Eur J Immunol. (, 2014. [DOI | PubMed]
- PH Wang, R Washburn, R Maniar, M Mu, O Ringham, R Kratchmarov. Cutting edge: promoting T cell factor 1(+) T cell self-renewal to improve programmed cell death protein 1 blockade.. J Immunol. (, 2022. [DOI | PubMed]
- I Siddiqui, K Schaeuble, V Chennupati, SA Fuertes Marraco, S Calderon-Copete, D Pais Ferreira. Intratumoral Tcf1(+)PD-1(+)CD8(+) T cells with stem-like properties promote tumor control in response to vaccination and checkpoint blockade immunotherapy.. Immunity. (, 2019. [DOI | PubMed]
- N Hensel, Z Gu, Sagar, D Wieland, K Jechow, J Kemming. Memory-like HCV-specific CD8+ T cells retain a molecular scar after cure of chronic HCV infection.. Nat Immunol. (, 2021. [DOI | PubMed]
- M Cheng, T Bergsbaken. Abstract 896: Investigating tissue-resident memory T cell differentiation of CAR T cells reveals an unexpected role for CD69.. Cancer Res. (, 2023. [DOI | PubMed]
- BV Kumar, W Ma, M Miron, T Granot, RS Guyer, DJ Carpenter. Human tissue-resident memory T cells are defined by core transcriptional and functional signatures in lymphoid and mucosal sites.. Cell Rep. (, 2017. [DOI]
- F Stelma, A de Niet, MJ Sinnige, KA van Dort, K van Gisbergen, J Verheij. Human intrahepatic CD69 + CD8+ T cells have a tissue resident memory T cell phenotype with reduced cytolytic capacity.. Sci Rep. (, 2017. [DOI | PubMed]
- DA Walsh, H Borges da Silva, LK Beura, C Peng, SE Hamilton, D Masopust. The functional requirement for CD69 in establishment of resident memory CD8(+) T cells varies with tissue location.. J Immunol. (, 2019. [DOI | PubMed]
- A Bianchi, A Grifoni, G Avvisati, A Crescenzi. PD-1/PD-L1 checkpoint in lymphoprolipherative Malignancies: focus on critical points for tissue assessment.. ARC Journals. (, 2017
- VA Boussiotis, N Patsoukis. Effects of PD-1 signaling on immunometabolic reprogramming.. Immunometabolism. (, 2022. [DOI | PubMed]
- Y Jiang, M Chen, H Nie, Y Yuan. PD-1 and PD-L1 in cancer immunotherapy: clinical implications and future considerations.. Hum Vaccin Immunother. (, 2019. [DOI | PubMed]
- RY Chen, Y Zhu, YY Shen, QY Xu, HY Tang, NX Cui. The role of PD-1 signaling in health and immune-related diseases.. Front Immunol. (, 2023. [DOI | PubMed]
- H Nishimura, T Okazaki, Y Tanaka, K Nakatani, M Hara, A Matsumori. Autoimmune dilated cardiomyopathy in PD-1 receptor-deficient mice.. Science. (, 2001. [DOI | PubMed]
- H Nishimura, T Honjo. PD-1: an inhibitory immunoreceptor involved in peripheral tolerance.. Trends Immunol. (, 2001. [DOI | PubMed]
- N Nakamoto, DE Kaplan, J Coleclough, Y Li, ME Valiga, M Kaminski. Functional restoration of HCV-specific CD8 T cells by PD-1 blockade is defined by PD-1 expression and compartmentalization.. Gastroenterology. (, 2008. [DOI | PubMed]
- S Liu, H Zhang, M Li, D Hu, C Li, B Ge. Recruitment of Grb2 and SHIP1 by the ITT-like motif of TIGIT suppresses granule polarization and cytotoxicity of NK cells.. Cell Death Differ. (, 2013. [DOI | PubMed]
- N Engels, J Wienands. The signaling tool box for tyrosine-based costimulation of lymphocytes.. Curr Opin Immunol. (, 2011. [DOI | PubMed]
- H Georgiev, I Ravens, G Papadogianni, G Bernhardt. Coming of age: CD96 emerges as modulator of immune responses.. Front Immunol. (, 2018. [DOI | PubMed]
- K Stanko, C Iwert, C Appelt, K Vogt, J Schumann, FJ Strunk. CD96 expression determines the inflammatory potential of IL-9-producing Th9 cells.. Proc Natl Acad Sci USA. (, 2018. [DOI | PubMed]
- A Study Investigating AGEN1777 in Participants With Advanced Solid Tumors ClinicalTrials.gov 2021 [updated 2024–08–20; cited 2025 13th June (. 2021
- Study of the Safety and Effectiveness of GSK6097608 in Participants With Advanced Solid Tumors ClinicalTrials.gov2020 [updated 2025–03–14; cited 2025 13th June (. 2020
- GM Lauer, K Ouchi, RT Chung, TN Nguyen, CL Day, DR Purkis. Comprehensive analysis of CD8(+)-T-cell responses against hepatitis C virus reveals multiple unpredicted specificities.. J Virol. (, 2002. [DOI | PubMed]
- S Osuch, T Laskus, K Perlejewski, H Berak, I Bukowska-Ośko, A Pollak. CD8(+) T-cell exhaustion phenotype in chronic hepatitis C virus infection is associated with epitope sequence variation.. Front Immunol. (, 2022. [DOI | PubMed]