
Dietary Cannabidiol Supplementation on Growth Performance, Behavior, Blood Profile, Metabolomic Analysis and Fatty Acid Composition in Rabbits: A Multi-Disciplinary Approach to Improve Welfare and Productivity
Abstract
Animal health and welfare are essential for ethical farming and high-quality food production. This study evaluated the effects of dietary cannabidiol (CBD) supplementation on behavior, some blood parameters, and fatty acid composition in meat and liver of rabbits. CBD is gaining attention for its pharmacological properties and its role in the endocannabinoid system. The results suggest that CBD supplementation can influence behavioral and physiological responses in rabbits, offering potential benefits for both animal welfare and meat quality.
Article type: Research Article
Keywords: oxidative status, metabolome profile, cannabidiol, rabbits, animal behavior, fatty acids
Affiliations: Department of Veterinary Medicine and Animal Production, University of Naples Federico II, 80137 Naples, Italy; nicolafrancesco.addeo@unina.it (N.F.A.); valeria.iervolino@unina.it (V.I.); ruggero.amato@unina.it (R.A.); mariariosaria.lanzieri@unina.it (M.L.); daria.lotito@unina.it (D.L.); alessia.staropoli@unina.it (A.S.); sara.damiano@unina.it (S.D.); frvinale@unina.it (F.V.); fulvia.bovera@unina.it (F.B.); nadia.musco@unina.it (N.M.); vincenzo.mastellone@unina.it (V.M.); Department of Agriculture, Food, Environment and Forestry (DAGRI), University of Florence, Via delle Cascine 5, 50144 Florence, Italy; mariavittoria.tignani@unifi.it (M.V.T.); giuliana.parisi@unifi.it (G.P.)
License: © 2025 by the authors. CC BY 4.0 Licensee MDPI, Basel, Switzerland. This article is an open access article distributed under the terms and conditions of the Creative Commons Attribution (CC BY) license (https://creativecommons.org/licenses/by/4.0/).
Article links: DOI: 10.3390/vetsci12080759 | PubMed: 40905739 | PMC: PMC12582029
Relevance: Relevant: mentioned in keywords or abstract
Full text: PDF (2.0 MB)
1. Introduction
Rabbit farming offers a more sustainable alternative to traditional livestock production with lower environmental impacts and superior nutritional benefits, aligning with the 2030 Sustainable Development Goals [ref. 1,ref. 2,ref. 3]. Additionally, rabbit meat is highly digestible and can be considered a functional food with lower fat, cholesterol, and saturated fatty acid content compared to other meats, making it a healthier dietary choice [ref. 4]. This combination of efficient production and nutritional value of the meat reinforces the role of rabbit farming in promoting sustainable and health-conscious food systems. To optimize rabbit breeding, there has been a significant evolution in feeding techniques for rabbits, in recent years. The use of additives in animal feed has always attracted interest in scientific research, aiming to enhance the health and well-being of farmed animals [ref. 5]. In this context, hemp (Cannabis sativa L.) is emerging as a dietary ingredient and functional additive for livestock feeding, due to its rich nutritional profile and potential to improve animal health and product quality [ref. 6]. There are more than 90 known cannabinoids [ref. 7]; among them, two are of particular interest: delta-9-tetrahydrocannabinol (THC) and cannabidiol (CBD) [ref. 8]. THC is a psychoactive molecule with both therapeutic and recreational applications, but its intoxicating properties necessitate strict regulation [ref. 9,ref. 10]. Conversely, CBD is non-psychoactive, has a favorable safety profile, and offers a range of therapeutic benefits without intoxication [ref. 10,ref. 11]. CBD, primarily derived from hemp flowers, leaves, and stems, is in high demand in the medical, pharmaceutical, and nutraceutical industries [ref. 5]. It exhibits anti-inflammatory, antioxidant, analgesic, antinociceptive, anxiolytic, antipsychotic, neuroprotective, appetite-stimulating, and anticonvulsant effects [ref. 12,ref. 13,ref. 14]. CBD-based products are also gaining popularity in veterinary medicine, particularly for companion animals [ref. 15,ref. 16]. CBD’s specific effects in livestock remain underexplored, although some evidence of hemp benefits has now been further investigated, even in animal husbandry [ref. 16,ref. 17,ref. 18]. Nonetheless, the action of CBD is mainly linked to its interaction with the endocannabinoid system (ECS), present in almost all animal species [ref. 19], which plays a crucial role in the regulation of physiological functions such as immune response and pain perception [ref. 8]. By modulating ECS, CBD can promote calmness and relaxation and help cope with stressful situations [ref. 20]. This has led to a growing interest in its application as a feed supplement in farm animals. This combined action of CBD on anxiety and gastrointestinal function may be particularly beneficial in rabbits (Oryctolagus cuniculus), commonly bred in cages for meat production [ref. 21].
Although several studies have been conducted on the use of hemp in rabbit nutrition [ref. 22,ref. 23,ref. 24] and on the effect of CBD on humans and other animal species, limited research has been carried out on CBD application in rabbit diets. Preliminary data suggest that CBD may positively influence various physiological parameters, such as the lipid profile, reducing triglyceride and cholesterol levels [ref. 25,ref. 26]. Rabbits are known to be particularly sensitive to stress, especially in intensive farming environments, where cages can limit the expression of their natural behaviors, raising ethical concerns about their welfare [ref. 27]. Although various cage and housing systems have been proposed to compare the level of welfare [ref. 28], rabbits remain significantly susceptible to stress due to their inability to fully express their innate behaviors. The introduction of dietary interventions such as those based on CBD could represent an effective strategy to mitigate the negative effects of environmental stress and improve the animal’s quality of life. Therefore, investigating the effect of CBD on this species could provide useful information to improve both nutritional management and the overall welfare of these animals.
The present study aimed to investigate the effects of dietary CBD supplementation on growth performance and meat quality of rabbits in the period of 65–92 days of age. At the same time, the potential of CBD to improve the general health of rabbits was explored by investigating blood biochemistry and metabolomics, oxidative stress, behavior, and fatty acid profile of the meat and liver, taking into account the possible gender differences.
2. Materials and Methods
2.1. Animals and Diet
The University of Napoli Federico II Ethical Animal Care and Use Committee in Italy approved all experimental protocols (protocol number 2019/0058989). The study complied with the EC Directive 2010/63/EU [ref. 29], which outlines the protection of animals used for scientific purposes.
A total of 42 New Zealand White × California rabbits, aged 60 days, with a balanced sex ratio (1:1) and an average weight of 1621.3 ± 46.2 g (measured using a Digital Rabbit Scale, model WS20, OLBA B.V., Coevorden, Netherlands), were systematically allocated into two groups, each consisting of 21 animals. The rabbits were housed individually in cages measuring 25 cm in length, 45 cm in depth, and 30 cm in height within a controlled environment (temperature 21 °C, relative humidity 62%, 16 h light/8 h dark photoperiod). During the acclimation period (from 60 to 64 days of age), all rabbits consumed an identical commercial diet. Beginning at 65 days of age, rabbits were divided in two groups, both fed this basal diet; however, the group receiving cannabidiol (CBD) supplementation (comprising 11 females and 10 males) was additionally administered 0.1 mL of a cannabis extract in coconut-based oil (Giantec; Isernia, Italy), equating to a daily dose of 10 mg of CBD per animal. The dosage was determined based on existing literature on laboratory rabbits [ref. 30] and manufacturer recommendations. The cannabis extract was delivered individually by applying it to a 15 g alfalfa-dehydrated meal-based wafer, which was consumed entirely by each rabbit. Conversely, the control group (CTRL; 10 females and 11 males) received the same alfalfa wafer with 0.1 mL of coconut oil but without the cannabis extract. From 65 to 92 days of age (for a total of 27 days), individual body weight and feed intake were monitored on a weekly basis. Feed intake was determined for each rabbit by weighing the feed offered and the residual feed, using individual hopper feeders designed to minimize feed losses.
The CBD extract was analyzed via High Performance Liquid Chromatography with a Diode Array Detector (HPLC-DAD), in accordance with the European Pharmacopoeia (Ph. Eur. 2.2.29) [ref. 31], and the analytical results are detailed in Table 1.
Table 1: CBD extract chemical analysis.
| Total cannabidiol (CBD + CBA) | 10.35% |
| Cannabidiol, CBD | 9.42% |
| Cannabidiolic acid, CBA | 1.06% |
| Total tetrahydrocannabinol (THC + THCA) | 0.19% |
| D9-Tetrahydrocannabinol | 0.19% |
| Tetrahydrocannabinolic acid | ND |
| D8-Tetrahydrocannabidinol | ND |
| Total cannabigerol (CBG + CBGA) | 0.36% |
| Cannabigerol | 0.24% |
| Cannabierolic acid | 0.11% |
| Cannabinol | 0.04% |
| Cannabichromene | 0.03% |
| Cannabidivarin | 0.07% |
| Cannabidivarinic acid | ND |
Abbreviations: ND = not detected.
The composition and chemical characteristics of both the diet and the wafer were sourced from commercial labels and are provided in Table 2. The ingredients were obtained from the commercial tag, and the chemical characteristics were determined according to AOAC (2002) [ref. 32] official methods to determine dry matter (DM, ID 934.01), the composition of ether extract (EE, ID 920.39), crude protein (CP, ID 2001.11), crude fiber (CF, ID 978.10) and ashes (ID 942.05). The fatty acid profile of CBD oil and the diet were analyzed as described in Section 2.4. and are given in Table 3 and Table 4, respectively.
Table 2: Chemical-nutritional characteristics and ingredients of the basal diet and wafer used during the trial.
| Basal Diet 1 | Wafer 2 | |
|---|---|---|
| Crude protein, % AF | 15.6 | 11.8 |
| Ether extract, % AF | 3.2 | 1.5 |
| Crude fiber, % AF | 19.9 | 19.8 |
| Ashes, % AF | 6.6 | 8.4 |
| Ca, % AF | 0.34 | – |
| P, % AF | 0.46 | 0.13 |
| Na, % AF | 0.22 | 0.05 |
| Lysine, % AF | 0.66 | – |
| Methionine, % AF | 0.23 | – |
| DE, MJ/kg | 11.6 | 10.9 |
Abbreviations: AF = as feed; DE = Digestible energy. 1 Ingredients (in a decreasing-amount order): wheat bran, sunflower meal, dehydrated beet pulp, wheat straw, soybean shells, barley, grape seeds meal, toasted soybean seeds, sugar cane molasses, dehydrated alfalfa meal, soybean oil, salt. Min-vit supplementation/kg: Vit A 9000 IU, Vit D3 900 IU, Vit E 30 mg, Mn 30 mg, Zn 42 mg, Cu 6 mg, Fe 45 mg, I 1.8 mg, Se 0.06 mg. 2 Ingredients (in a decreasing-amount order): dehydrated alfalfa hay, dehydrated alfalfa, heat-crushed barley, wheat bran, oats, corn flakes, sugar cane molasses, glucose and fructose syrup, maltodextrins, sucrose. Min-vit supplementation/kg: Vit A 367 IU, Vit D3 37.65 IU, choline 2.21 mg, Vit B1 0.61 mg, Vit B2 0.59 mg, Vit E 9.80 mg, biotin 0.02 mg, folic acid 0.04 mg, niacin 2.45 mg, calcium D-pantotenate 0.04 mg, CuSO4 0.37 mg, Fe 0.49 mg, MnO 2.54 mg, ZnSO4 * H2O 2.13 mg, butylhydroxitolouene 3.00 mg.
Table 3: Fatty acid profile of the CBD extract (g fatty acids/100 g total FAME).
| Fatty Acid | Mean Value |
|---|---|
| C6:0 | 0.03 |
| C8:0 | 41.83 |
| C10:0 | 39.78 |
| C12:0 | 0.15 |
| C14:0 | 0.01 |
| C16:0 iso | 0.04 |
| C16:0 | 1.20 |
| C16:1n-7 | 0.01 |
| C18:0 | 0.44 |
| C18:1n-9 | 1.57 |
| C18:1n-7 | 0.15 |
| C18:2n-6 | 9.76 |
| C18:3n-6 | 0.85 |
| C18:3-n3 | 3.58 |
| C18:4n-3 | 0.28 |
| C20:0 | 0.13 |
| C20:1n-9 | 0.05 |
| C22:0 | 0.05 |
| C22:5n-3 | 0.06 |
| SFA | 83.67 |
| MUFA | 1.79 |
| n-6 PUFA | 10.62 |
| n-3 PUFA | 3.92 |
SFA: saturated fatty acids, MUFA: monounsaturated fatty acids, PUFA: polyunsaturated fatty acids.
Table 4: Fatty acid profile (g fatty acids/100 g total fatty acid methyl esters, FAME) of the diet.
| Fatty Acid | Mean Value |
|---|---|
| C10:0 | 0.16 |
| C12:0 | 0.18 |
| C14:0 | 0.53 |
| C14:1n-5 | 0.02 |
| iso-C15:0 | 0.05 |
| anteiso-C15:0 | 0.02 |
| C15:0 | 0.14 |
| iso-C16:0 | 0.01 |
| C16:0 | 19.53 |
| C16:1n-9 | 0.14 |
| C16:1n-7 | 0.42 |
| C17:0 | 0.15 |
| C17:1 | 0.01 |
| C18:0 | 3.90 |
| C18:1n-9 | 26.71 |
| C18:1n-7 | 1.17 |
| C18:2n-6 | 39.84 |
| C18:3n-6 | 0.10 |
| C18:3n-3 | 4.89 |
| C20:0 | 0.34 |
| C20:1n-11 | 0.03 |
| C20:1n-9 | 0.38 |
| C20:1n-7 | 0.01 |
| C20:2n-6 | 0.05 |
| C20:3n-6 | 0.02 |
| C20:4n-6 | 0.21 |
| C22:0 | 0.32 |
| C22:1n-11 | 0.10 |
| C22:1n-9 | 0.23 |
| C22:4n-6 | 0.05 |
| C22:5n-3 | 0.03 |
| C24:0 | 0.27 |
| SFA | 25.61 |
| MUFA | 29.22 |
| n-6 PUFA | 40.26 |
| n-3 PUFA | 4.91 |
SFA: saturated fatty acids, MUFA: monounsaturated fatty acids, PUFA: polyunsaturated fatty acids.
The digestible energy (DE) content was estimated using the equation proposed by Fernandez-Carmona et al. (1996) [ref. 33]:
At 92 days of age, eight rabbits from each group (maintaining a 1:1 sex ratio) were transported to a specialized slaughterhouse. The protocol for slaughter, processing and analysis of carcass was done according to Hassan et al. (2016) [ref. 34]. The pelt, tail, and visceral parts were removed after the complete draining of the blood, and the remaining parts were designated as carcasses. The animals were kept under observation for approximately 2 h before slaughter, with access to water but without feed. After slaughtering, the carcasses were weighed and then refrigerated at 4 °C for 24 h in a ventilated room. After 24 h of refrigeration, carcasses were weighed again to obtain the refrigerated carcass weight (CC); then, skin, head, liver, heart, lungs + esophagus + trachea + thymus gland bundle, spleen, kidneys, and reproductive traits were removed and weighed individually (Sigma-Aldrich electronic balance, model Z742838, Merck KGaA, Darmstadt, Germany) to obtain the reference carcass (RC). Using a portable instrument (Model HI 9025; Hanna Instruments, Woonsocket, RI, USA), equipped with the electrode FC 230C (Hanna Instruments), the pH value was measured in the Biceps femoris (BF) and Longissimus dorsi (LD) muscles, 45 min and 24 h after slaughter.
2.2. Behavioral Analysis
Video recordings lasting 90 min each were conducted four times every seven days. The recording periods (12:00–15:00) were consistent across all weeks and were selected after preliminary observations, which characterized the periods of greatest daytime activity of animals. Also, the caring procedures started after the end of recording and, throughout the recording periods, measures were implemented to ensure that no individuals had access to the animals, preventing any interference with their usual behavioral patterns. The footage was captured using four AP-320S (C&Xanadu, Shanghai, China) cameras strategically positioned in the corners of the cages. The recordings for each group were watched and coded by an expert observer. A second operator coded 20% of the videos, and the interobserver reliability was found to be very high for all observed behaviors, ranging from 90 to 96%. Behavior was categorized according to the following ethogram: grooming, moving, setting, lying, looking around, gnawing, stretching and sniffing. For each animal, the duration of the observed behaviors was measured.
2.3. Blood Biochemistry and Oxidative Status
At the end of the experiment, blood samples were collected into tubes with and without K3-EDTA, and immediately transported to the laboratory. Serum was obtained by centrifugation at 1200× g for 15 min, then divided into aliquots and frozen at −80 °C.
Blood chemistry analyses on serum aliquots were performed by an automatic biochemical analyzer (AMS Autolab, Diamond Diagnostics, Holliston, MA, USA), using reagents from Spinreact (Girona, Spain) to determine: total proteins (TP), albumin (ALB), creatinine (CREA), glucose (GLU), aspartate amino transferase (AST), alanine-aminotransferase (ALT), gamma-glutamyltransferase (GGT), bilirubin (BIL), alkaline phosphatase (ALP), cholesterol (CHOL), and triglycerides (TRI). Reactive oxygen metabolites and the biological antioxidant potential were performed on serum aliquots using reagents from Diacron International s.r.l. (Grosseto, Italy).
2.4. Metabolomic Analysis
A quantity of 50 µL of rabbit’s serum was mixed with 150 μL of methanol:chloroform 3/1 v/v. The mix was sonicated with an ultrasonic bath (Sonorex, Bandelin Electronic GmbH & Co. K, Berlin, Germany) for 5 min and then left at −20 °C for 10 min for protein precipitation. The samples were centrifuged at 12,000 rpm for 30 min at 4 °C and the supernatant was recovered and dried under a gentle nitrogen flow. The crude extracts were resuspended in 100 µL of N-Hexane and derivatized with 100 µL of N,O bis(trimethylsilyl)trifluoroacetamide (BSTFA, Merck, Darmstadt, Germany), in an ultrasonic bath for 30 min. The trimethylsilyl derivatives were analyzed using an Agilent 8890 GC instrument (Milan, Italy) linked to an Agilent 5977B Inert MS. A HP-5MS capillary column ((5%-phenyl)-methylpolysiloxane stationary phase) was employed for the separation. The following oven GC temperature program was used: initial temperature of 80 °C for 2 min, rising at 10 °C/min to 180 °C; rising at 5 °C/min to 240 °C; rising at 25 °C/min to 290 °C and holding for 9 min. The solvent delay time was set at 5 min. The GC injector was set to splitless mode at 270 °C and the carrier gas was helium, at a flow rate of 1 mL/min; the transfer line temperature was set at 220 °C. Measurements were carried out in full scan mode (m/z 30–550) with electron impact (EI) ionization (70 eV). The temperatures of the EI ion source and the quadrupole mass filter were fixed at 260 and 150 °C, respectively. Identification of metabolites was obtained by comparison of deconvoluted mass spectra collected in NIST 20 library of known compounds (National Institute of Standards and Technology).
The metabolomic analysis was carried out on 8 biological replicates and each analysis was performed 3 times (technical replicates). Serum samples representing a biological replicate were collected from randomly selected animals.
2.5. Total Lipids and Fatty Acid Profiles of Feedstuff, Meat Cuts, and Livers
Total lipids from diets, meat cuts (thighs and loins) and liver were quantified gravimetrically. This was performed by extracting 2 g of each sample using the method described by Folch et al. (1957) [ref. 35]. The lipid extracts were then converted into fatty acid methyl esters (FAME) through base-catalyzed trans-esterification, following the procedure outlined by Christie (1982) [ref. 36].
The fatty acid composition of the CBD extract, dietary samples, meat and liver was analyzed using a Varian GC 430 gas chromatograph (Varian Inc., Palo Alto, CA, USA), equipped with a Supelco Omegawax™ 320 capillary column (Supelco, Bellefonte, PA, USA) and a flame ionization detector. An aliquot of 1 μL of lipid extracted sample, dissolved in hexane, was injected in GC, with helium serving as the carrier gas at a constant flow rate of 1.5 mL/min and a split ratio of 1:20. The gas chromatograph (GC) oven was initially held at 120 °C for 0.5 min, then ramped to 170 °C at a rate of 10 °C/min over 6 min, and subsequently to 220 °C at a rate of 3 °C/min over 12 min, where it was maintained for 13 min, resulting in a total runtime of 40 min. Injector and detector temperatures were set at 220 and 300 °C, respectively.
Fatty acids were identified by comparing FAME retention times to those of a Supelco 37-component FAME mix standard (Supelco, Bellefonte, PA, USA), and quantified using calibration curves with tricosanoic acid (C23:0) (Sigma-Aldrich, St. Louis, MO, USA) as internal standard. Chromatogram recordings were conducted with the Galaxie Chromatography Data System version 1.9.302.952 (Varian Inc., Palo Alto, CA, USA).
2.6. Cholesterol Content of the Loins, Thighs, and Livers
Cholesterol content was measured following the procedure described by Secci et al. (2018) [ref. 37]. In brief, 0.2 mL of lipid extract was mixed with 0.5 mL of 5α-cholestane (0.2 mg/mL in chloroform) as internal standard (Supelco, Bellefonte, PA, USA). After evaporating the solvent, 5 mL KOH (0.5 M in methanol) was added, and the mixture was then saponified by heating in a water bath at 95 °C for 40 min. Following saponification, 3 mL of distilled water and 2 mL of n-hexane were added, and the upper phase was collected for the gas chromatography run. The analysis was performed on a Varian GC 430 gas chromatograph (Varian Inc., Palo Alto, CA, USA), equipped with a flame ionization detector and a Supelco SACTM fused silica capillary column (30 m × 0.25 mm i.d., 0.25-μm film; Supelco, Agilent Technologies, Santa Clara, CA, USA). An aliquot of 1 µL was injected with a 1:100 split ratio at 300 °C. The oven temperature was planned to increase from 130 to 290 °C at a rate of 20 °C/min over 8 min and then maintained at 290 °C for 11 min. The detector temperature was set at 300 °C, with helium as the carrier gas, at a constant flow rate of 1.3 mL/min.
2.7. Oxidative Status of the Loins, Thighs, and Livers
To assess the primary metabolites formed from lipid oxidation in rabbits’ loins, thighs, and livers, conjugated dienes (CD) were quantified, using 0.5 µL of lipid extract dissolved in 3 mL of pure hexane, as described by Srinivasan et al. (1996) [ref. 38]. Absorbance was measured at 232 nm with a 50 Scan spectrophotometer using Cary Win UV software version 5.3, and the concentration of hydroperoxides (mmol/kg) was calculated based on a molar extinction coefficient of 29,000 mL/mmol × cm. Lipid peroxidation in meat was further evaluated through malondialdehyde (MDA) levels. The secondary oxidative products in the meat and liver samples were assessed as thiobarbituric acid reactive substances (TBARS), using a colorimetric method adapted from Secci et al. (2016) [ref. 39]. The procedure involved dissolving the sample in 5% trichloroacetic acid (TCA) and adding 0.02 M thiobarbituric acid (TBA). After incubating at 97 °C for 40 min, the oxidation products were quantified by comparing the absorbance at 532 nm to calibration curves prepared with 1,1,3,3-tetraethoxypropane (TEP) in 5% TCA, with concentrations ranging from 0.2 to 3.1 mmol/L. The TBARS results were expressed as mg of malondialdehyde equivalents (MDA eq.) per 100 g of sample.
2.8. Statistical Analysis
Data were processed with a two-way ANOVA by using the GLM procedure of SAS (2002) [ref. 40], according to the following model:
where Y is the single observation, m the general mean, G the effect of the group differently fed (i = CTRL or CBD), S the effect of the gender (j = female or male), G × S the interaction between the two main factors, and e the error.
Before data analysis, the normal distribution of the data was checked [ref. 40]. Comparison among means was performed by Tukey’s test [ref. 40] at p < 0.05. p values lower than 0.05 are considered significant, while p values ranging between 0.05 and 1 are considered a tendency.
Statistical analysis of metabolomic data was performed by Mass Profile Professional Software Version 13.1.1 (Agilent Technologies). Row data were aligned, normalized and grouped by the dietary treatment (CTRL or CBD) administered to rabbits and then subjected to Principal Component Analysis (PCA) and hierarchical clustering analysis, to look for trends between and within the two conditions. Student’s t-test (p < 0.05) and fold change (>2.0) were used to compare the metabolomic profiles of rabbits in CTRL and CBD groups. Metabolites were finally identified by comparison of deconvoluted mass spectra collected in NIST (National Institute of Standards and Technology) 20 library of known compounds.
3. Results
Chemical analysis of the cannabis extract showed that the total amount of cannabidiol (CBD + CBDA) was the highest active ingredient of the product (10.35%), while very low levels (0.19%) of total tetrahydrocannabinol (THC + THCA) were detected (as shown in Table 1).
Table 3 shows the main fatty acids detected in the lipid profile of the CBD extract used in this study, predominantly composed of saturated fatty acids (SFAs), accounting for nearly 84 g FA/100 g of the total FAME. Among unsaturated fatty acids, n-6 PUFAs, primarily represented by linoleic acid (C18:2n-6), and n-3 PUFAs, with α-linolenic acid (C18:3n-3) as the most abundant, were present in smaller proportions.
Regarding the chemical-nutritional characteristics and ingredients of the basal diet and wafer used along the trial, in Table 2 the proximate composition, the content in Ca, p and Na, in some amino acids (lysine and methionine), and the value of digestible energy are reported while the fatty acid profile of the diet can be found in Table 4. In the diet, n-6 PUFAs emerged as the predominant fatty acid class, followed by MUFAs, SFAs, and n-3 PUFAs.
3.1. Growth Performance and Carcass Characteristics
Regarding the in vivo results (Table 5), the live weight (LW) of the rabbits was significantly affected by CBD supplementation at the end of the experiment (p = 0.05), according to a significant (p < 0.01) increase in body weight (BWG) recorded in the CBD group along the experimental period (from 65 to 92 days) compared to the CTRL group. Considering the whole experimental period, the difference in feed intake (FI) between sexes was statistically significant, with the highest values in males (p < 0.01). In the experiment carried out, daily feed consumption showed a non-linear trend, recording an average consumption of about 160 g/rabbit/day in both groups. The ability of the cannabinoid system to control appetite, feed intake, and energy balance has recently received much attention, especially in light of the different modes of action underlying these functions. Feed conversion ratio (FCR) was significantly (p < 0.01) lower in the CBD group during the whole experimental period. No interaction effects between group and sex were recorded.
Table 5: Rabbit in vivo performance according to dietary treatment group, sex, and their interaction.
| Group | Sex | p-Values | RMSE | |||||
|---|---|---|---|---|---|---|---|---|
| CTRL | CBD | Females | Males | Group | Sex | Interaction | ||
| LW 65d, g | 1727.1 | 1707.1 | 1625.7 b | 1808.6 a | 0.95 | 0.03 | 0.38 | 91.6 |
| LW 92d, g | 2637.1 b | 2731.4 a | 2608.6 b | 2760.0 a | 0.05 | 0.03 | 0.62 | 101.3 |
| BWG 65–70d, g | 35.71 b | 48.27 a | 40.29 b | 43.71 a | 0.01 | 0.04 | 0.49 | 3.96 |
| BWG 86–92d, g/d | 38.98 B | 44.08 A | 46.33 A | 36.74 B | <0.01 | <0.01 | 0.51 | 3.26 |
| BWG 65–92d, g/d | 33.70 B | 37.94 A | 36.40 | 35.23 | <0.01 | 0.12 | 0.28 | 2.75 |
| FI 65–70d, g/d | 126.6 B | 145.4 A | 135.1 | 136.9 | <0.01 | 0.63 | 0.38 | 10.0 |
| FI 71–78d, g/d | 153.7 | 153.9 | 145.3 B | 162.3 A | 0.54 | <0.01 | 0.79 | 11.3 |
| FI 79–85d, g/d | 170.7 A | 157.1 B | 147.6 B | 180.2 A | <0.01 | <0.01 | 0.61 | 13.5 |
| FI 86–92d, g/d | 186.8 | 179.2 | 169.3 B | 196.8 A | 0.11 | <0.01 | 0.74 | 12.63 |
| FI 65–92d, g/d | 161.9 | 161.4 | 151.8 B | 171.5 A | 0.45 | <0.01 | 0.57 | 11.9 |
| FCR 65–70d, g/g | 3.54 A | 3.02 B | 3.35 | 3.13 | <0.01 | 0.07 | 0.70 | 0.26 |
| FCR 71–78d, g/g | 4.30 | 4.14 | 4.13 | 4.30 | 0.15 | 0.012 | 0.80 | 0.32 |
| FCR 79–85d, g/g | 5.51 | 5.27 | 5.01 B | 5.77 A | 0.06 | <0.01 | 0.47 | 0.39 |
| FCR 86–92d, g/g | 4.79 A | 4.06 B | 3.65 B | 5.35 A | <0.01 | <0.01 | 0.82 | 0.30 |
| FCR 65–92d, g/g | 4.80 A | 4.25 B | 4.17 B | 4.86 A | <0.01 | <0.01 | 0.63 | 0.32 |
CBD: cannabidiol extract; RMSE: root mean square error; a, b: p < 0.05, A, B: p < 0.01; LW: live weight; BWG: body weight gain; FI: feed intake; FCR: feed conversion ratio.
Table 6 shows the characteristics of rabbit carcasses. Warm carcass weights and carcass yield were significantly higher (p < 0.05 and p < 0.01, respectively) in the CBD group compared to the CTRL one. Spleen, as a % of warm carcass, was heavier in the CBD group while liver was heavier in the CTRL group (p < 0.01). Baseline carcass weight was higher in the CBD group (p < 0.05), while inguinal fat was significantly (p < 0.01) heavier in the CTRL group. Our results indicated a significant difference related to sex in in vivo performance, particularly in terms of body weight gain (BWG), males showing higher BWG at 65–70 days (p < 0.05) compared to females. However, in the period 86–92 days, BWG was lower in males (p < 0.01), with no significant differences observed over the overall trial period (65–92 days). Additionally, no significant disparities were found between males and females in post-mortem outcomes, except for carcass yield, reference carcass weight and warm carcass weight being higher in males (p < 0.01, p < 0.05 and p < 0.05, respectively) and perineal fat (in %) being higher in females (p < 0.05). No interaction effects between group and sex were recorded.
Table 6: Rabbit carcass traits according to dietary treatment group, sex, and their interaction.
| Group | Sex | p-Values | RMSE | |||||
|---|---|---|---|---|---|---|---|---|
| CTRL | CBD | Females | Males | Group | Sex | Interaction | ||
| LW, g | 2617.1 | 2668.3 | 2585.2 b | 2700.2 a | 0.06 | 0.03 | 0.79 | 165.4 |
| Skin, % LW | 14.23 | 15.31 | 13.72 | 15.81 | 0.19 | 0.06 | 0.27 | 1.05 |
| Full GUT, % LW | 17.65 | 16.69 | 17.86 a | 16.49 b | 0.72 | 0.04 | 0.36 | 1.39 |
| Empty GUT, % LW | 8.80 | 8.44 | 8.76 | 8.49 | 0.42 | 0.51 | 0.24 | 0.87 |
| Warm Carcass, g | 1604.3 a | 1702.9 b | 1581.4 a | 1725.8 b | 0.03 | 0.02 | 0.75 | 109.1 |
| Carcass Yield, % | 61.30 B | 63.82 A | 61.17 B | 63.91 A | <0.01 | <0.01 | 0.16 | 1.65 |
| Spleen, % HC | 4.25 B | 6.70 A | 5.41 | 5.54 | <0.01 | 0.59 | 0.20 | 0.23 |
| Urinary + genitals, % LW | 0.66 | 0.62 | 0.64 | 0.63 | 0.74 | 0.95 | 0.49 | 0.04 |
| pH LD1h | 7.11 | 6.86 | 6.97 | 7.06 | 0.11 | 0.80 | 0.95 | 0.33 |
| pH BF1h | 6.91 | 6.75 | 6.71 | 6.96 | 0.56 | 0.30 | 0.44 | 0.40 |
| Chilled carcass, g | 1577.1 | 1688.6 | 1591.4 | 1674.3 | 0.07 | 0.08 | 0.91 | 98.6 |
| CC Yield, % | 60.26 B | 63.28 A | 61.56 | 62.00 | <0.01 | 0.63 | 0.84 | 0.47 |
| pH LD24h | 5.87 A | 5.76 B | 5.81 | 5.83 | <0.01 | 0.94 | 0.31 | 0.045 |
| pH BF24h | 5.93 | 5.89 | 5.91 | 5.92 | 0.28 | 0.95 | 0.43 | 0.048 |
| Reference carcass, g | 1029.6 b | 1116.5 a | 1022.1 b | 1124.0 a | 0.03 | 0.03 | 0.70 | 84.93 |
| Head, % RC | 14.33 | 13.04 | 14.02 | 14.15 | 0.24 | 0.63 | 0.35 | 1.06 |
| Liver, % RC | 8.47 A | 6.91 B | 7.55 | 7.82 | <0.01 | 0.92 | 0.20 | 0.43 |
| Kidney, % RC | 1.71 | 1.60 | 1.66 | 1.66 | 0.22 | 0.85 | 0.46 | 0.14 |
| Lungs, % RC | 1.43 | 1.43 | 1.41 | 1.45 | 0.96 | 0.66 | 0.59 | 0.12 |
| Heart, % RC | 1.29 | 1.33 | 1.26 | 1.36 | 0.31 | 0.28 | 0.23 | 0.09 |
| Inguinal fat % RC | 0.19 A | 0.15 B | 0.18 | 0.16 | 0.01 | 0.45 | 0.84 | 0.01 |
| Perirenal fat, % RC | 2.39 | 2.40 | 2.55 a | 2.23 b | 0.96 | 0.02 | 0.76 | 0.16 |
| Scapular fat, % RC | 0.49 | 0.49 | 0.50 | 0.47 | 0.97 | 0.80 | 0.94 | 0.03 |
CBD: cannabidiol extract; RMSE: root mean square error; a, b: p < 0.05, A, B: p < 0.01; LW: live weight; GUT: gastro-intestinal tract; CC: chilled carcass; RC: reference carcass; HC: hot carcass; LD: Longissimus dorsi; BF: Biceps femoris.
3.2. Behavioral Analysis
The study assessed the behavior of rabbits by quantifying the duration of various activities. In Table 7, in terms of resting behavior, the CTRL rabbits spent more time lying down (7458.2 s) than the CBD rabbits (5875.6 s), although this difference did not achieve statistical significance (p = 0.0850).
Table 7: Seconds spent by rabbits in different behaviors according to dietary treatment group, sex and their interaction at day 1 of the trial.
| Group | Sex | p-Values | RMSE | |||||
|---|---|---|---|---|---|---|---|---|
| CTRL | CBD | Female | Male | Group | Sex | Interaction | ||
| Grooming | 974.0 | 1064.5 | 1131.8 | 906.2 | 0.8024 | 0.3719 | 0.5942 | 482.9 |
| Moving | 35.74 | 36.23 | 29.73 | 42.27 | 0.8330 | 0.0706 | 0.0306 | 11.66 |
| Setting | 610.7 | 816.1 | 740.2 | 686.6 | 0.2162 | 0.6184 | 0.7890 | 305.03 |
| Lying | 7534.6 | 7850.8 | 7393.8 | 7891.7 | 0.4336 | 0.3243 | 0.8155 | 799.4 |
| Look around | 4.27 | 5.79 | 6.24 | 3.84 | 0.4786 | 0.1932 | 0.1917 | 2.99 |
| Gnawing | 3.90 | 3.57 | 4.74 | 2.73 | 0.9890 | 0.5115 | 0.9167 | 5.49 |
| Stretching | 28.99 | 24.03 | 23.44 | 29.57 | 0.4394 | 0.4241 | 0.7208 | 15.51 |
| Sniffing | 121.6 | 120.9 | 129.4 | 112.2 | 0.9574 | 0.3360 | 0.9717 | 31.86 |
CBD: cannabidiol extract group; RMSE: root mean square error.
In Table 8, during the initial phase of the experiment (day 9 of the trial), rabbits fed the CBD diet demonstrated a statistically significant increase in time spent on locomotor activities (Moving; p = 0.0192).
Table 8: Seconds spent by rabbits in different behaviors according to dietary treatment group, sex, and their interaction at day 9 of the trial.
| Group | Sex | p-Values | RMSE | |||||
|---|---|---|---|---|---|---|---|---|
| CTRL | CBD | Female | Male | Group | Sex | Interaction | ||
| Grooming | 1074.6 | 1155.8 | 1244.3 | 986.1 | 0.7375 | 0.3150 | 0.5688 | 440.67 |
| Moving | 22.29 b | 90.09 a | 39.91 | 72.46 | 0.0192 | 0.3440 | 0.2839 | 10.31 |
| Setting | 784.5 | 564.6 | 698.8 | 650.4 | 0.1640 | 0.6088 | 0.9097 | 285.4 |
| Lying | 7689.1 | 7267.1 | 7212.5 | 7743.7 | 0.4552 | 0.3154 | 0.8271 | 842.3 |
| Look around | 0.46 B | 11.80 A | 10.86 a | 1.40 b | 0.0011 | 0.0450 | 0.4079 | 2.86 |
| Gnawing | 1.51 | 4.43 | 4.53 | 1.40 | 0.4817 | 0.4378 | 0.9361 | 6.38 |
| Stretching | 24.97 | 35.31 | 30.49 | 29.80 | 0.2846 | 0.9321 | 0.5799 | 17.13 |
| Sniffing | 115.5 | 187.8 | 163.97 | 139.29 | 0.1487 | 0.7506 | 0.8829 | 83.05 |
CBD: cannabidiol extract group; RMSE: root mean square error; a, b: p < 0.05, A, B: p < 0.01.
At the end of the trial (Table 9), rabbits treated with CBD exhibited a significant (p = 0.0498) increase in grooming behavior (1820.5 s) compared to the other group (1019.2 s). Although the difference in movement was not statistically significant, there was a tendency for increased movement in the CBD group (101.03 vs. 33.40 s).
Table 9: Seconds spent by rabbits in different behaviors according to dietary treatment group, gender and their interaction at end of the trial.
| Group | Sex | p-Values | RMSE | |||||
|---|---|---|---|---|---|---|---|---|
| CTRL | CBD | Female | Male | Group | Sex | Interaction | ||
| Grooming | 1019.2 b | 1820.5 a | 1635.5 | 1204.1 | 0.0498 | 0.3619 | 0.9746 | 626.95 |
| Moving | 33.40 | 101.03 | 54.23 | 80.14 | 0.0927 | 0.3759 | 0.4383 | 72.58 |
| Setting | 923.7 | 967.9 | 946.8 | 944.7 | 0.8791 | 0.9884 | 0.6739 | 531.5 |
| Lying | 7458.2 | 5875.6 | 6340.3 | 6993.5 | 0.0850 | 0.5956 | 0.8224 | 1472.8 |
| Look around | 11.20 | 37.06 | 24.11 | 24.14 | 0.0772 | 0.7825 | 0.8891 | 24.82 |
| Gnawing | 6.11 | 14.03 | 13.91 | 6.23 | 0.5397 | 0.5559 | 0.7101 | 20.29 |
| Stretching | 27.31 b | 44.11 a | 38.71 | 32.74 | 0.0101 | 0.4915 | 0.2946 | 9.58 |
| Sniffing | 94.0 | 107.6 | 82.91 | 118.7 | 0.6736 | 0.4037 | 0.0928 | 81.78 |
CBD: cannabidiol extract group; RMSE: root mean square error; a, b: p < 0.05.
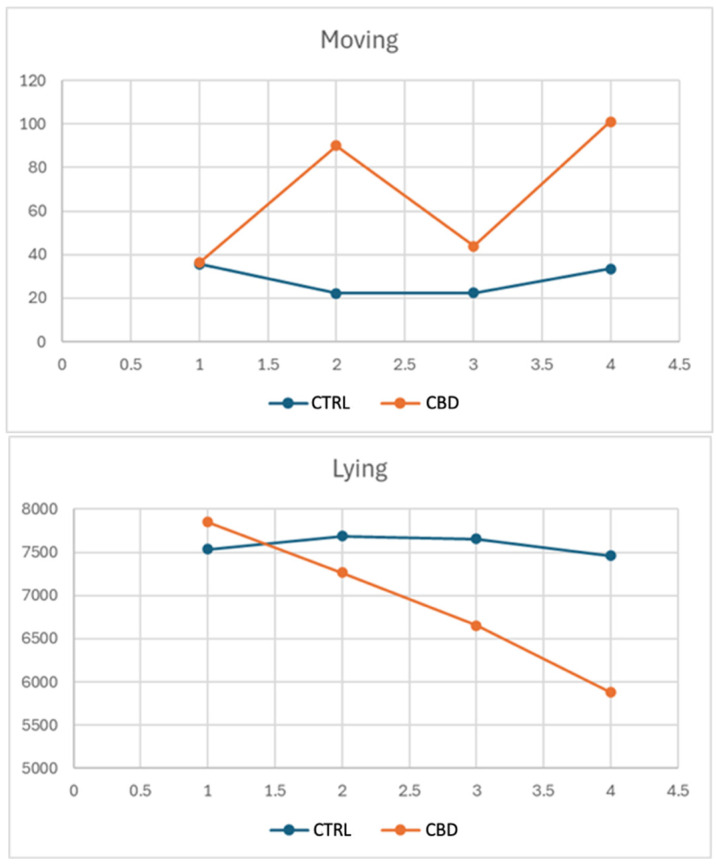
Figure 1 illustrates the effects of the diet administered on two distinct behaviors: movement and time spent lying down. In particular, the CBD group showed a marked increase in movement, with values reaching approximately 100 units at the second and fourth time points, compared to the CTRL group, which remained stable between 20 and 40 units. Similarly, the time spent lying down decreased significantly in the CBD group, dropping from values similar to those of the CTRL at the beginning to around 5500 units by the fourth time point, while the CTRL group remained stable at about 7500–7800 units.
3.3. Blood Profiles
The study assessed the blood profiles of rabbits based on dietary treatment, gender, and the interaction between these factors (Table 10).
Table 10: Rabbit blood profiles according to dietary treatment group, sex, and their interaction.
| Group | Sex | p-Values | RMSE | |||||
|---|---|---|---|---|---|---|---|---|
| CTRL | CBD | Female | Male | Group | Sex | Interaction | ||
| Glu, mg/dL | 107.9 | 97.34 | 99.30 | 105.9 | 0.1381 | 0.4062 | 0.1219 | 11.19 |
| Chol, mg/dL | 66.94 | 57.88 | 64.64 | 59.19 | 0.0853 | 0.1689 | 0.5971 | 9.87 |
| Try, mg/dL | 82.50 A | 72.33 B | 78.63 | 76.20 | 0.0217 | 0.3398 | 0.8062 | 7.32 |
| TP, g/L | 7.20 | 7.29 | 7.29 | 7.19 | 0.8676 | 0.8077 | 0.0735 | 0.70 |
| Alb, g/L | 3.00 | 2.87 | 2.84 | 3.03 | 0.5011 | 0.3042 | 0.3546 | 0.29 |
| Glob, g/d | 4.20 | 4.41 | 4.45 | 4.16 | 0.5946 | 0.4235 | 0.0163 | 0.5853 |
| Alb/Glob | 0.71 a | 0.65 b | 0.64 b | 0.73 a | 0.0221 | 0.0296 | 0.7859 | 0.059 |
| Urea, mg/dL | 30.43 | 29.14 | 31.14 | 28.43 | 0.6801 | 0.4791 | 0.6089 | 7.45 |
| Crea, mg/dL | 0.877 | 0.867 | 0.94 | 0.81 | 0.8217 | 0.3088 | 0.3684 | 0.24 |
| Ast, U/L | 25.16 | 28.14 | 28.54 | 24.76 | 0.5301 | 0.3926 | 0.0408 | 7.10 |
| Alt, U/L | 65.36 | 61.73 | 63.06 | 64.03 | 0.2101 | 0.8654 | 0.3005 | 4.92 |
| Ldh, U/L | 460.29 | 468.57 | 437.0 | 491.86 | 0.7235 | 0.2346 | 0.0148 | 83.76 |
| CPK, U/L | 1260.7 | 1324.3 | 1312.7 | 1272.3 | 0.6247 | 0.7898 | 0.0857 | 216.44 |
| dROMS UCARR | 103.7 A | 69.71 B | 88.71 | 84.74 | 0.0022 | 0.3215 | 0.5430 | 16.05 |
| BAP, umol/L | 1636.7 B | 2543.3 A | 2241.9 | 1938.1 | 0.0030 | 0.4503 | 0.9940 | 419.18 |
Glu: glucose, Chol: cholesterol, Try: triglycerides, TP total proteins, Alb: albumin, Glob: globulin, Crea: creatinine, Ast: aspartate amino transferase, Alt: alanine-aminotransferase, Ldh: lactate dehydrogenase, CPK: creatine phosphokinase, dROMS: Reactive Oxygen Metabolites-derived compounds, BAP: Biological Antioxidant Potential. CBD: cannabidiol extract group; RMSE: root mean square error; a, b: p < 0.05, A, B: p < 0.01.
Based on the results of the blood profile, a statistically significant reduction in triglyceride levels (p = 0.0217) was found in rabbits treated with CBD. Additionally, the albumin/globulin ratio exhibited a significant decrease in the CBD-treated group (p = 0.0221), as for the cholesterol levels in the same group, their values tended to be lower compared to the CTRL one, with a p-value of 0.0853, suggesting a potential influence of diet on cholesterol levels. The levels of the derivates of reactive oxygen metabolites (dROMs) were significantly lower in the CBD group, indicating a reduced oxidative stress (p = 0.0022). Conversely, the biological antioxidant potential (BAP) values were higher in the CBD group, suggesting an enhanced antioxidant capacity (p = 0.003). The group receiving CBD demonstrated significantly lower triglyceride levels compared to the CTRL group (p = 0.0217). Furthermore, a significant difference in the albumin/globulin ratio was also highlighted between the different groups and between sexes, with a lower value in females. In particular, the CTRL group showed a higher albumin/globulin ratio than the CBD group (p = 0.0221).
3.4. Metabolomic Analysis
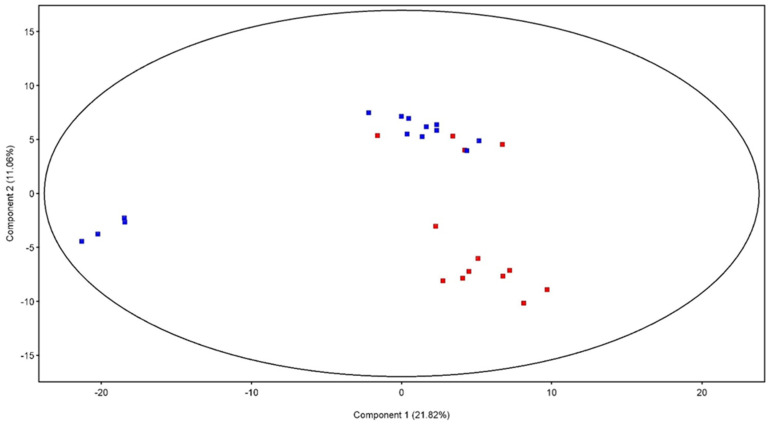
PCA score plot (Figure 2) shows that the rabbit’s serum metabolome changed after the treatments, and a separation of samples in the second component of variance was registered. A minimum spread for the CTRL (blue) is noted, while for the treated group (CBD, in red) there is a spread with four subclasses of samples. In Figure 3, the hierarchical cluster obtained from the metabolomic profiles of the two groups is reported. By categorizing the data of each group, hierarchical cluster analysis characterizes similarities and differences in the metabolic profiles of the groups (CTRL, CBD). This figure represents the normalized abundance of each compound that is present or absent. The clustering clearly demonstrated a different accumulation of serum molecules between the two groups, suggesting that the metabolic profile was affected by the dietary treatment in a unique way.
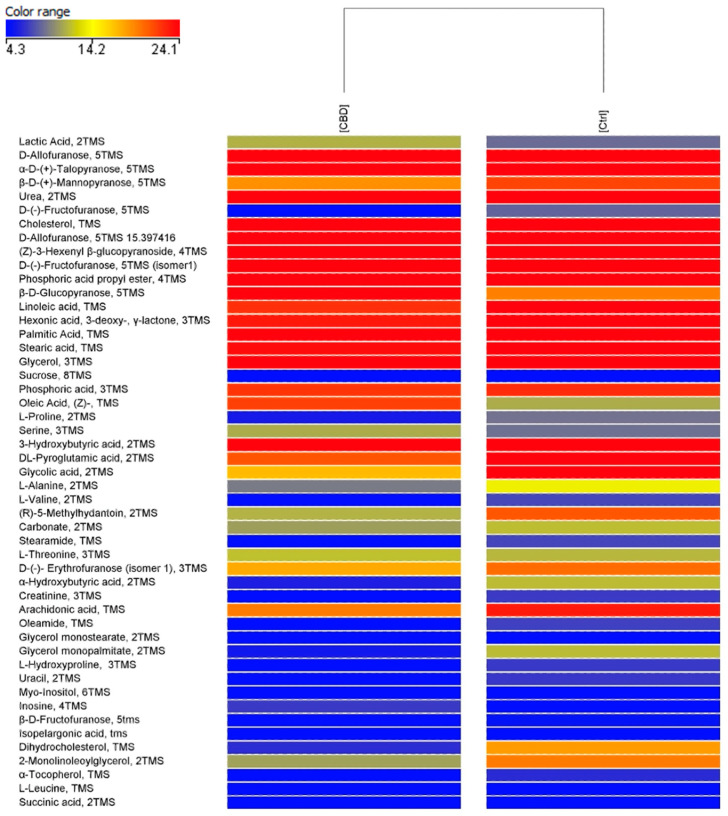
Metabolomic analysis revealed 343 compounds as a result of the data processing. Among them, 35 differently accumulated compounds were highlighted by univariate statistical analysis (T-test, p < 0.05 and fold change > 2.0). Three significant compounds were identified and reported in Table 11, respectively, D-(-)-Fructofuranose, 5TMS (isomer 1); Dihydrocholesterol, TMS; and 2-Monolinoleoylglycerol, 2TMS. All the identified compounds are down-regulated by CBD’s treatment.
Table 11: Significant identified metabolites downregulated (↓) by CBD vs. CTRL in rabbits. Statistical significance was tested by t-test (p < 0.05; fold change > 0.2).
| Compound | RegulationCBD vs. CTRL |
|---|---|
| D-(-)-Fructofuranose 5TMS (isomer 1) | ↓ |
| Dihydrocholesterol, TMS | ↓ |
| 2-Monolinoleoylglycerol, 2TMS | ↓ |
3.5. Total Lipids and Fatty Acid Profile of the Loins, Thighs, and Livers
The complete fatty acid profiles in the thigh and loin of rabbits, and in their livers, were analyzed, resulting in limited significant effects of dietary treatment on individual fatty acid content. The total lipids and the fatty acid profile of the loins are reported in Table 12. In the loins, SFAs such as C10:0 and C12:0 were significantly higher in rabbits fed the CTRL compared to those fed the CBD-enriched diet. Female rabbits displayed higher concentrations of C17:0 than males which, conversely, exhibited higher levels of eicosadienoic acid (C20:2n-6) in the same cut.
Table 12: Total lipid content (g/100 g tissue) and fatty acid profile (g fatty acid/100 g FAME) of the loins according to dietary treatment group, sex, and their interaction.
| Group | Sex | p Values | RMSE | |||||
|---|---|---|---|---|---|---|---|---|
| CTRL | CBD | Female | Male | Group | Sex | Interaction | ||
| Total lipids | 2.13 | 1.26 | 1.52 | 1.87 | 0.135 | 0.529 | 0.694 | 1.004 |
| Fatty acids | ||||||||
| C10:0 | 0.12 a | 0.05 b | 0.07 | 0.10 | 0.024 | 0.205 | 0.069 | 0.047 |
| C12:0 | 0.17 a | 0.09 b | 0.11 | 0.15 | 0.019 | 0.198 | 0.119 | 0.052 |
| Iso C14:0 | 0.03 | 0.03 | 0.03 | 0.03 | 0.675 | 0.224 | 0.115 | 0.011 |
| C14:0 | 1.61 | 1.55 | 1.48 | 1.68 | 0.846 | 0.478 | 0.896 | 0.494 |
| C14:1n-5 | 0.05 | 0.04 | 0.04 | 0.05 | 0.535 | 0.421 | 0.599 | 0.03 |
| Iso C15:0 | 0.05 | 0.05 | 0.04 | 0.05 | 0.806 | 0.591 | 0.527 | 0.015 |
| Anteiso C15:0 | 0.12 | 0.12 | 0.12 | 0.12 | 0.933 | 0.677 | 0.227 | 0.018 |
| C15:0 | 0.58 | 0.57 | 0.59 | 0.57 | 0.819 | 0.421 | 0.844 | 0.046 |
| Iso C16:0 | 0.16 | 0.15 | 0.16 | 0.15 | 0.568 | 0.384 | 0.754 | 0.029 |
| C16:0 | 23.81 | 24.60 | 24.07 | 24.35 | 0.273 | 0.689 | 0.272 | 1.257 |
| C16:1n-9 | 0.38 | 0.36 | 0.37 | 0.37 | 0.372 | 0.919 | 0.919 | 0.044 |
| C16:1n-7 | 1.37 | 1.36 | 1.12 | 1.60 | 0.978 | 0.147 | 0.828 | 0.564 |
| C17:0 | 0.65 | 0.66 | 0.70 a | 0.61 b | 0.851 | 0.033 | 0.620 | 0.068 |
| C18:0 | 7.77 | 8.35 | 8.61 | 7.51 | 0.415 | 0.140 | 0.829 | 1.269 |
| C18:1n-9 | 23.87 | 23.43 | 23.28 | 24.01 | 0.720 | 0.553 | 0.579 | 2.215 |
| C18:1n-7 | 1.46 | 1.53 | 1.48 | 1.50 | 0.599 | 0.874 | 0.642 | 0.219 |
| C18:2n-6 | 27.97 | 27.29 | 27.48 | 27.78 | 0.444 | 0.729 | 0.221 | 1.568 |
| C18:3n-6 | 0.08 | 0.11 | 0.11 | 0.08 | 0.243 | 0.243 | 0.929 | 0.034 |
| C18:3n-3 | 2.45 | 2.35 | 2.30 | 2.49 | 0.806 | 0.644 | 0.544 | 0.743 |
| C20:0 | 0.14 | 0.14 | 0.15 | 0.12 | 0.925 | 0.130 | 0.887 | 0.032 |
| C20:1n-9 | 0.22 | 0.23 | 0.22 | 0.23 | 0.724 | 0.442 | 0.506 | 0.042 |
| C20:2n-6 | 0.19 | 0.19 | 0.17 b | 0.21 a | 0.624 | 0.015 | 0.099 | 0.031 |
| C20:3n-6 | 0.32 | 0.37 | 0.34 | 0.35 | 0.577 | 0.852 | 0.510 | 0.145 |
| C20:4n-6 | 4.47 | 4.43 | 4.86 | 4.04 | 0.974 | 0.590 | 0.635 | 2.723 |
| C20:3n-3 | 0.05 | 0.04 | 0.04 | 0.05 | 0.375 | 0.375 | 0.283 | 0.015 |
| C20:4n-3 | 0.01 | 0.01 | 0.01 | 0.01 | 0.717 | 0.717 | 0.124 | 0.008 |
| C20:5n-3 | 0.09 | 0.10 | 0.10 | 0.09 | 0.692 | 0.692 | 0.494 | 0.051 |
| C22:0 | 0.05 | 0.06 | 0.05 | 0.05 | 0.338 | 0.766 | 0.898 | 0.017 |
| C22:1n-9 | 0.05 | 0.05 | 0.05 | 0.04 | 0.716 | 0.347 | 0.102 | 0.023 |
| C22:4n-6 | 0.80 | 0.82 | 0.84 | 0.78 | 0.934 | 0.799 | 0.577 | 0.455 |
| C22:5n-6 | 0.27 | 0.27 | 0.29 | 0.25 | 0.913 | 0.631 | 0.775 | 0.144 |
| C22:5n-3 | 0.44 | 0.42 | 0.47 | 0.40 | 0.864 | 0.563 | 0.578 | 0.263 |
| C24:0 | 0.11 | 0.12 | 0.12 | 0.10 | 0.747 | 0.665 | 0.088 | 0.054 |
| C22:6n-3 | 0.09 | 0.04 | 0.09 | 0.04 | 0.223 | 0.223 | 0.815 | 0.064 |
| C24:1n-9 | 0.03 | 0.04 | 0.04 | 0.03 | 0.820 | 0.460 | 0.820 | 0.023 |
| SFA | 35.34 | 36.53 | 36.30 | 35.58 | 0.085 | 0.275 | 0.177 | 1.156 |
| MUFA | 27.43 | 27.03 | 26.61 | 27.85 | 0.778 | 0.391 | 0.651 | 2.567 |
| n-6 PUFA | 34.10 | 33.48 | 34.08 | 33.50 | 0.711 | 0.732 | 0.937 | 3.027 |
| n-3 PUFA | 3.12 | 2.96 | 3.01 | 3.07 | 0.493 | 0.807 | 0.571 | 0.428 |
| n-6 PUFA + n-3 PUFA | 37.22 | 36.40 | 37.10 | 36.60 | 0.620 | 0.796 | 0.865 | 2.858 |
| n-6/n-3 | 11.25 | 11.40 | 11.6 | 11.1 | 0.906 | 0.713 | 0.717 | 2.281 |
SFA: saturated fatty acids, MUFA: monounsaturated fatty acids, PUFA: polyunsaturated fatty acids. CBD: cannabidiol extract group; RMSE: root mean square error; a, b: p < 0.05.
Sex exerted a more pronounced influence on thigh fatty acid profiles (Table 13), since female rabbits contained higher levels of C17:0, as in the loins, and C18:0 fatty acids, whereas the thighs of male rabbits had a greater concentration of C20:2n-6, as in the other cuts. Interestingly, C20:1n-9 showed a trend toward being more abundant in the hind limb muscle of males, although this did not reach statistical significance (p = 0.074), as well as C10:0 and C12:0 (p = 0.060 and 0.087, respectively).
Table 13: Total lipid content (g/100 g tissue) and fatty acid profile (g fatty acid/100 g fatty acid methyl esters) of the thighs according to dietary treatment group, sex, and their interaction.
| Group | Sex | p Values | RMSE | |||||
|---|---|---|---|---|---|---|---|---|
| CTRL | CBD | Female | Male | Group | Sex | Interaction | ||
| Total lipids | 1.56 | 1.62 | 1.54 | 1.64 | 0.725 | 0.604 | 0.867 | 0.331 |
| Fatty acids | ||||||||
| C10:0 | 0.11 | 0.07 | 0.06 | 0.12 | 0.114 | 0.060 | 0.067 | 0.048 |
| C12:0 | 0.16 | 0.11 | 0.10 | 0.16 | 0.105 | 0.087 | 0.152 | 0.054 |
| Iso C14:0 | 0.02 | 0.03 | 0.02 | 0.02 | 0.231 | 0.574 | 0.910 | 0.007 |
| C14:0 | 1.39 | 1.48 | 1.30 | 1.58 | 0.674 | 0.218 | 0.823 | 0.389 |
| C14:1n-5 | 0.07 | 0.05 | 0.05 | 0.08 | 0.368 | 0.239 | 0.516 | 0.040 |
| Iso C15:0 | 0.05 | 0.05 | 0.05 | 0.05 | 0.444 | 0.912 | 0.740 | 0.014 |
| Anteiso C15:0 | 0.12 | 0.11 | 0.12 | 0.11 | 0.760 | 0.760 | 0.544 | 0.019 |
| C15:0 | 0.55 | 0.56 | 0.56 | 0.55 | 0.769 | 0.560 | 0.826 | 0.041 |
| Iso C16:0 | 0.14 | 0.14 | 0.15 | 0.14 | 0.884 | 0.470 | 0.942 | 0.021 |
| C16:0 | 23.34 | 23.95 | 23.40 | 23.90 | 0.388 | 0.480 | 0.315 | 1.259 |
| C16:1n-9 | 0.39 | 0.38 | 0.38 | 0.39 | 0.728 | 0.944 | 0.351 | 0.065 |
| C16:1n-7 | 1.63 | 1.44 | 1.23 | 1.84 | 0.581 | 0.089 | 0.428 | 0.602 |
| C17:0 | 0.63 | 0.65 | 0.69 a | 0.59 b | 0.522 | 0.017 | 0.522 | 0.062 |
| C18:0 | 8.63 | 8.67 | 9.24 a | 8.06 b | 0.937 | 0.042 | 0.663 | 0.930 |
| C18:1n-9 | 20.81 | 21.67 | 20.37 | 22.11 | 0.525 | 0.215 | 0.639 | 2.420 |
| C18:1n-7 | 1.55 | 1.47 | 1.51 | 1.51 | 0.296 | 0.950 | 0.886 | 0.131 |
| C18:2n-6 | 28.53 | 28.90 | 29.91 | 28.52 | 0.628 | 0.601 | 0.437 | 1.357 |
| C18:3n-6 | 0.10 | 0.10 | 0.11 | 0.09 | 0.803 | 0.292 | 0.427 | 0.027 |
| C18:3n-3 | 2.16 | 2.33 | 2.14 | 2.35 | 0.525 | 0.406 | 0.702 | 0.465 |
| C20:0 | 0.13 | 0.13 | 0.14 | 0.12 | 0.904 | 0.094 | 0.500 | 0.019 |
| C20:1n-9 | 0.20 | 0.22 | 0.19 | 0.23 | 0.387 | 0.074 | 0.348 | 0.038 |
| C20:2n-6 | 0.24 | 0.26 | 0.21 B | 0.28 A | 0.376 | 0.006 | 0.150 | 0.037 |
| C20:3n-6 | 0.54 | 0.44 | 0.50 | 0.48 | 0.191 | 0.830 | 0.919 | 0.133 |
| C20:4n-6 | 5.80 | 4.62 | 5.91 | 4.50 | 0.319 | 0.232 | 0.739 | 2.056 |
| C20:3n-3 | 0.05 | 0.06 | 0.05 | 0.06 | 0.616 | 0.292 | 0.973 | 0.022 |
| C20:4n-3 | 0.01 | 0.01 | 0.01 | 0.01 | 0.467 | 0.467 | 0.467 | 0.008 |
| C20:5n-3 | 0.10 | 0.09 | 0.10 | 0.08 | 0.359 | 0.434 | 0.842 | 0.031 |
| C22:0 | 0.06 | 0.05 | 0.06 | 0.05 | 0.579 | 0.116 | 0.278 | 0.016 |
| C22:1n-9 | 0.04 a | 0.03 b | 0.04 | 0.03 | 0.048 | 0.330 | 0.842 | 0.008 |
| C22:4n-6 | 1.10 | 0.88 | 1.05 | 0.93 | 0.285 | 0.543 | 0.671 | 0.361 |
| C22:5n-6 | 0.42 | 0.31 | 0.40 | 0.34 | 0.324 | 0.113 | 0.093 | 0.821 |
| C22:5n-3 | 0.64 | 0.50 | 0.67 | 0.47 | 0.365 | 0.225 | 0.450 | 0.284 |
| C24:0 | 0.12 | 0.10 | 0.10 | 0.12 | 0.270 | 0.182 | 0.674 | 0.023 |
| C22:6n-3 | 0.11 | 0.09 | 0.12 | 0.08 | 0.390 | 0.200 | 0.182 | 0.049 |
| C24:1n-9 | 0.04 | 0.04 | 0.05 | 0.03 | 0.939 | 0.201 | 0.285 | 0.029 |
| SFA | 35.46 | 36.12 | 36.00 | 35.58 | 0.307 | 0.509 | 0.152 | 1.135 |
| MUFA | 24.73 | 25.30 | 23.82 | 26.21 | 0.719 | 0.154 | 0.562 | 2.867 |
| n-6 PUFA | 36.74 | 35.50 | 37.10 | 35.14 | 0.492 | 0.283 | 0.961 | 3.194 |
| n-3 PUFA | 3.08 | 3.08 | 3.08 | 3.07 | 0.996 | 0.914 | 0.667 | 0.265 |
| n-6 PUFA + n-3 PUFA | 39.80 | 38.60 | 40.20 | 38.20 | 0.489 | 0.315 | 0.989 | 3.179 |
| n-6/n-3 | 12.04 | 11.58 | 12.14 | 11.48 | 0.581 | 0.433 | 0.746 | 1.496 |
SFA: saturated fatty acids, MUFA: monounsaturated fatty acids, PUFA: polyunsaturated fatty acids. CBD: cannabidiol extract group; RMSE: root mean square error; A, B: p > 0.01; a, b: p < 0.05.
Rabbits consuming the CBD diet had livers with significantly higher concentrations of palmitoleic acid (C16:1n-7), as shown in Table 14. For the concentration of C20:0 fatty acid, a significant interaction between sex and dietary group was found. Additionally, eicosadienoic acid (C20:2n-6) and the n-6/n-3 ratio were significantly higher in male rabbits.
Table 14: Total lipid content (g/100 g tissue) and fatty acid profile (g fatty acid/100 g fatty acid methyl esters) of the livers according to dietary treatment group, sex, and their interaction.
| Group | Sex | p Values | RMSE | |||||
|---|---|---|---|---|---|---|---|---|
| CTRL | CBD | Female | Male | Group | Sex | Interaction | ||
| Total lipids | 2.95 | 3.56 | 3.27 | 3.24 | 0.951 | 0.104 | 0.602 | 0.625 |
| Fatty acids | ||||||||
| C10:0 | 0.02 | 0.01 | 0.02 | 0.01 | 0.256 | 0.260 | 0.563 | 0.005 |
| C12:0 | 0.02 | 0.02 | 0.02 | 0.02 | 0.592 | 0.592 | 0.128 | 0.004 |
| Iso C14:0 | 0.01 | 0.01 | 0.01 | 0.01 | 0.869 | 0.017 | 0.159 | 0.005 |
| C14:0 | 0.31 | 0.34 | 0.36 | 0.30 | 0.319 | 0.563 | 0.737 | 0.110 |
| C14:1n-5 | 0.01 | 0.01 | 0.01 | 0.01 | 0.070 | 0.778 | 0.113 | 0.005 |
| Iso C15:0 | 0.02 | 0.02 | 0.02 | 0.02 | 0.588 | 0.588 | 0.473 | 0.008 |
| anteiso C15:0 | 0.04 | 0.04 | 0.04 | 0.04 | 0.806 | 0.591 | 0.591 | 0.015 |
| C15:0 | 0.38 | 0.38 | 0.40 | 0.36 | 0.156 | 0.868 | 0.659 | 0.054 |
| Iso C16:0 | 0.08 | 0.07 | 0.09 | 0.07 | 0.123 | 0.722 | 0.830 | 0.021 |
| C16:0 | 17.72 | 19.16 | 18.13 | 18.74 | 0.394 | 0.061 | 0.556 | 1.268 |
| C16:1n-9 | 0.26 | 0.28 | 0.29 | 0.25 | 0.223 | 0.554 | 0.703 | 0.063 |
| C16:1n-7 | 0.34 | 0.49 | 0.415 b | 0.418 a | 0.962 | 0.050 | 0.962 | 0.128 |
| C17:0 | 1.03 | 1.01 | 1.05 | 0.99 | 0.260 | 0.809 | 0.983 | 0.103 |
| C18:0 | 20.87 | 19.96 | 20.49 | 20.35 | 0.826 | 0.174 | 0.834 | 1.155 |
| C18:1n-9 | 10.85 | 12.20 | 12.12 | 10.83 | 0.316 | 0.260 | 0.828 | 2.083 |
| C18:1n-7 | 1.05 | 1.07 | 1.08 | 1.04 | 0.704 | 0.735 | 0.312 | 0.144 |
| C18:2n-6 | 31.36 | 30.94 | 30.58 | 31.72 | 0.057 | 0.445 | 0.377 | 0.979 |
| C18:3n-6 | 0.14 | 0.12 | 0.14 | 0.12 | 0.352 | 0.534 | 0.605 | 0.042 |
| C18:3n-3 | 1.18 | 1.25 | 1.28 | 1.15 | 0.249 | 0.539 | 0.635 | 0.189 |
| C20:0 | 0.13 | 0.13 | 0.14 | 0.13 | 0.475 | 0.743 | 0.050 | 0.011 |
| C20:1n-9 | 0.18 | 0.18 | 0.16 | 0.20 | 0.339 | 0.895 | 0.529 | 0.057 |
| C20:2n-6 | 0.57 a | 0.53 b | 0.41 | 0.68 | 0.037 | 0.727 | 0.231 | 0.211 |
| C20:3n-6 | 0.86 | 0.76 | 0.72 | 0.90 | 0.220 | 0.514 | 0.584 | 0.263 |
| C20:4n-6 | 9.56 | 8.46 | 9.25 | 8.78 | 0.609 | 0.244 | 0.780 | 1.647 |
| C20:3n-3 | 0.06 | 0.04 | 0.05 | 0.06 | 0.310 | 0.105 | 0.645 | 0.026 |
| C20:4n-3 | 0.01 | 0.02 | 0.02 | 0.01 | 0.829 | 0.293 | 1.000 | 0.007 |
| C20:5n-3 | 0.06 | 0.06 | 0.07 | 0.06 | 0.339 | 0.889 | 0.385 | 0.016 |
| C22:0 | 0.20 | 0.17 | 0.18 | 0.19 | 0.358 | 0.095 | 0.851 | 0.028 |
| C22:1n-9 | 0.03 | 0.04 | 0.04 | 0.04 | 0.813 | 0.120 | 0.212 | 0.013 |
| C22:4n-6 | 0.99 | 0.85 | 0.89 | 0.95 | 0.644 | 0.256 | 0.543 | 0.220 |
| C22:5n-6 | 0.59 | 0.51 | 0.55 | 0.54 | 0.894 | 0.362 | 0.556 | 0.147 |
| C22:5n-3 | 0.42 | 0.34 | 0.40 | 0.36 | 0.384 | 0.149 | 1.000 | 0.085 |
| C24:0 | 0.19 | 0.17 | 0.19 | 0.18 | 0.715 | 0.519 | 0.692 | 0.005 |
| C22:6n-3 | 0.21 | 0.16 | 0.21 | 0.15 | 0.067 | 0.117 | 0.697 | 0.054 |
| C24:1n-9 | 0.26 | 0.18 | 0.21 | 0.23 | 0.808 | 0.151 | 0.339 | 0.090 |
| SFA | 41.02 | 41.51 | 41.13 | 41.40 | 0.452 | 0.608 | 0.730 | 1.176 |
| MUFA | 12.97 | 14.45 | 14.31 | 13.11 | 0.254 | 0.349 | 0.767 | 2.267 |
| n-6 PUFA | 44.07 | 42.17 | 42.54 | 43.69 | 0.134 | 0.344 | 0.642 | 2.156 |
| n-3 PUFA | 1.94 | 1.86 | 2.01 | 1.79 | 0.481 | 0.07 | 0.743 | 0.199 |
| n-6 PUFA + n-3 PUFA | 46.00 | 44.00 | 44.6 | 45.5 | 0.132 | 0.332 | 0.632 | 2.233 |
| n-3/n-6 | 0.04 | 0.04 | 0.047 a | 0.041 b | 0.023 | 0.953 | 0.993 | 0.004 |
| n-6/n-3 | 22.87 | 23.04 | 21.17 b | 24.74 a | 0.025 | 0.903 | 0.924 | 2.500 |
SFA: saturated fatty acids, MUFA: monounsaturated fatty acids, PUFA: polyunsaturated fatty acids. CBD: cannabidiol extract group; RMSE: root mean square error; a, b: p < 0.05.
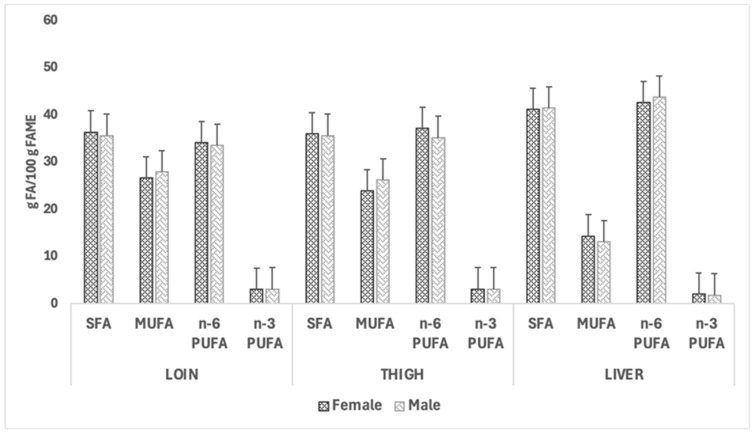
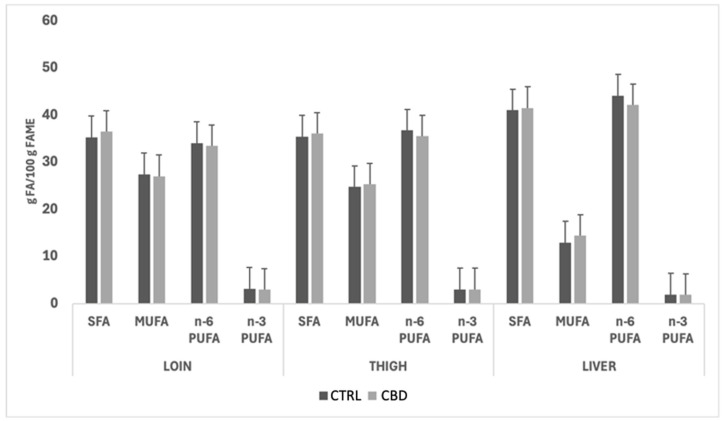
Figure 4 and Figure 5 illustrate the impact of sex and dietary treatment, respectively, on the fatty acid class composition of loins, thighs, and livers of CTRL and CBD groups. In both figures, no significant effects of the dietary treatment were observed for the fatty acid group composition; however, quantitatively, the most abundant fatty acid classes in both females and males were SFAs and n-6 PUFAs across the two muscles and the liver. The liver exhibited reduced MUFA levels compared to the muscle cuts, and the n-6 PUFA content was consistently higher in this organ. A similar pattern was observed when comparing the fatty acid group profiles in rabbits fed the two dietary treatments.
3.6. Cholesterol of Meat Cuts and Livers
The cholesterol content did not exhibit significant differences across meat cuts or liver for any of the fixed effects (Table 15); however, a trend was observed for the interaction between diet group and sex in the loin (p = 0.077). Although no statistical differences were detected, the CBD-fed rabbits displayed a higher cholesterol content, not in the loin but slightly in the thigh and notably in the liver compared to the CTRL group.
Table 15: Cholesterol content (mg/100 g tissue) of the loins, thighs and livers of the rabbits according to dietary treatment group, sex, and their interaction.
| Meat Portion/Organ | Group | Sex | p-Values | RMSE | ||||
|---|---|---|---|---|---|---|---|---|
| CTRL | CBD | Female | Male | Group | Sex | Interaction | ||
| Loin | 41.253 | 36.238 | 37.049 | 40.442 | 0.240 | 0.418 | 0.077 | 7.436 |
| Thigh | 48.153 | 50.925 | 50.046 | 49.032 | 0.301 | 0.698 | 0.770 | 4.709 |
| Liver | 352.72 | 416.872 | 388.902 | 380.691 | 0.205 | 0.865 | 0.639 | 87.642 |
CBD: cannabidiol extract group; RMSE: root mean square error.
3.7. Oxidative Status of Meat and Livers
Regarding the lipid oxidative status in the loins and thighs, no significant effects on malondialdehyde (MDA) and conjugated dienes (CD) levels were observed related to diet, sex, or their interaction, thus indicating that the factors investigated did not have a significant impact on tissue lipid oxidation. The only exception was the level of conjugated dienes in the liver, which was significantly higher in the CTRL rabbits (43.35 vs. 25.96 mmol Hp/kg lipid).
4. Discussion
The results of this study indicated that the dietary supplementation of CBD in rabbit diets may have several physiological, productive and behavioral benefits and could represent a promising strategy for improving animal welfare and health management. At the end of the experimental period, the live weight of CBD-treated rabbits was higher than that of the CTRL group. In terms of feed intake, considering the entire duration of the experiment (65–92 days), our results agree with those of Horakova et al. (2020) [ref. 41] who found no significant differences between CBD and CTRL groups (p = 0.45). Despite this, considering the entire experimental period, feed intake showed significance for the interaction group × sex. As for the feed conversion ratio, Horakova et al. (2020) [ref. 41] showed a trend towards higher values in the experimental group treated with hemp herb, although without significant differences. In agreement with this observation, in the present study an improvement in the feed conversion ratio in the CBD-treated group during the whole experimental period was recorded.
4.1. Growth Performance and Carcass Characteristics
Growth performance, however, showed significant differences between sexes. Between the 65th and 70th day of age, males showed a faster growth than females, whereas between the 86th and 92nd day, females had outpaced males in weight gain. This could indicate that there is a difference in the growth patterns of males and females, especially in the later stages of development [ref. 42]. Indeed, this observation is supported by Setiaji et al. (2013) [ref. 43], who found differences in growth patterns between sexes at specific stages of development. Based on what was described above, it can be stated that the reason for the discrepancies between our results and those of other studies could be connected to the different experimental conditions related to dietary treatment. Some studies carried out in other species reported that Cannabis sativa had no impact on carcass traits of sheep [ref. 44], goats [ref. 45], and chickens [ref. 46]. Conversely, when specifically utilizing cannabidiol as one of the non-psychoactive compounds of Cannabis sativa, it can increase carcass characteristics, as shown in our study, where the supplementation significantly increased warm carcass weight and carcass yield. Moreover, spleen weight as a percentage of the warm carcass was higher in the CBD group, probably due to the immunomodulatory effect of cannabinoids through the activation of selective receptors changing the activity of various immune cells [ref. 47]. The liver was heavier and the percentage of inguinal fat was significantly higher in the control group, suggesting that the administered CBD may have influenced fat deposition, reducing its accumulation in certain regions of the body. This is supported by studies conducted on other animal models, such as that of Erukainure et al. (2022) [ref. 26], in which CBD was also shown to have effects on lipid metabolism. Although few sex differences were observed, some results included a higher warm carcass weight, a higher reference carcass weight, and a higher carcass yield in males. In summary, this indicates that males provide more usable meat. However, perineal fat percentage was higher in females, which confirms a gender variation in fat distribution [ref. 48]. The results obtained in this trial indicate that CBD may be a new feed additive for rabbits, which helps to improve meat production without increasing feed intake. Long-term studies will be needed to fully understand the implications of CBD on rabbit health and the mechanisms underlying variations in growth performance.
4.2. Metabolomic Analysis
An untargeted metabolomics approach [ref. 49] has been applied to compare the serum metabolomic profiles of the different groups and GC-MS datasets were first submitted to Principal Component Analysis (PCA, Figure 1) and shown as a hierarchical cluster (Figure 2). PCA score plot showed that serum metabolomic profiles were affected by the different dietary treatments, revealing a clear separation between the CTRL group and the CBD-treated group in the second component of variance. The clustering pattern suggests that CBD administration induced specific metabolome profile changes. Based on the hierarchical cluster, the CBD-treated group exhibited a marked shift in abundance compared to the CTRL group, probably due to specific lipid metabolism, amino acid turnover, and energy pathways. In particular, the untargeted metabolomic analysis revealed that dihydrocholesterol and 2-monolinoleoylglycerol were down-regulated in the CBDs group rabbits. The downregulation of dihydrocholesterol in serum obtained from animals treated with CBD suggests a lower susceptibility to diseases related to aorta plaques [ref. 50]. 2-Monolinoleoylglycerol, also known as 2-linoleoylglycerol is involved in anti-inflammatory effects [ref. 51] and regulatory roles in lipid metabolism [ref. 52]. Finally, the downregulation of fructofuranose indicates an impact on simple carbohydrate pathways. Accordingly, previous studies showed that CBD can affect energy balance and glucose regulation, with possible implications on bioenergetics and systemic metabolism [ref. 53].
4.3. Blood Profiles
Additionally, the decreases in triglycerides in CBD group are in line with existing literature, which suggests that there is an involvement of CBD in lipid metabolic pathways [ref. 25], probably mediated by interaction with the endocannabinoid system. The hypotriglyceridemic effect can therefore be linked to the action of CBD in modulating the synthesis or use of triglycerides, as discussed by Dochez-Arnault et al. (2023) [ref. 25], due to the inhibition of lipogenesis or due to the enhancement of fatty acid beta-oxidation, as reported in a previous paper [ref. 54]. Regarding cholesterol, a trend was observed in the CBD group, with lower cholesterol levels than the CTRL group. This highlighted that CBD may have a beneficial potential for lipid metabolism, as confirmed by Erukainure et al. (2021) [ref. 55]. Moreover, regarding blood profiles, the ratio Alb/Glob indeed yielded a significantly different between the two groups, with a lower value in the CBD group. It follows that CBD could act as a modulator of the balance of the two proteins in the blood and is therefore relevant to health regarding protein and immune function [ref. 56]. In fact, an imbalance in this ratio can be associated with inflammatory conditions, as documented by Cattaneo et al. (2021) [ref. 57]. These results indicate that CBD could have a promising role in the management of conditions related to immune dysfunction or alterations in protein balance, broadening the potential therapeutic applications of this compound. The well-documented antioxidant and anti-inflammatory action of CBD [ref. 58,ref. 59,ref. 60] further underlines its role in improving animal health. This significant decrease in dROMs observed in this study supports the antioxidant efficacy of CBD which could be due to an imbalance between the production of reactive oxygen species (ROS) and antioxidant defense systems [ref. 61]. Such an imbalance can compromise many important physiological functions, such as nutrient absorption and digestion, making animals more susceptible to disease exposure [ref. 62]. Thus, CBD can modulate the oxidative balance by changing the levels and activities of both antioxidants and pro-oxidants independently of classic cannabinoid receptors [ref. 63]. It has been documented that CBD improves the activity of antioxidant enzymes, while also stopping free radical chain reactions [ref. 64,ref. 65,ref. 66]. This could be especially beneficial for rabbits because they are susceptible to oxidative stress due to environmental conditions and dietary challenges. Therefore, the improvement in Biological Antioxidant Potential (BAP) in CBD-treated groups may be indicative of an increase in endogenous antioxidant capacity, which can counteract cell damage induced by ROS, thus significantly affecting the long-term health and well-being of rabbits. In this regard, dietary supplementation with CBD could be a useful tool to increase the resilience of animals in intensive farming conditions, where they are usually exposed to a wide range of stress factors.
4.4. Behavioral Analysis
Behavioral analyses revealed significant changes in CBD-treated rabbits in terms of generalized increases in locomotor activity and grooming behaviors, which became more evident on day 9 than on day 1; indeed, on day 1, behaviors were relatively normal, while on day 9, data obtained indicate that CBD-treated rabbits showed significantly higher look around behavior than the CTRL group, suggesting an increased exploratory behavior. Although less evident, CBD-treated rabbits tended to show more pronounced “movement” behavior. A confirmation that CBD-treated rabbits spent significantly more time grooming than the CTRL group was given at the end of the experiment. The tendency towards more marked movement behavior, already observed on day 9, continued until the end of the experiment. “Stretching” also increased significantly in CBD-treated rabbits, which could be associated with changes in muscle tone or comfort. Such behavioral changes could be interpreted as an improvement in psychological well-being, probably associated with the anxiolytic action of CBD. Indeed, CBD has been successfully used to control anxiety and stressful conditions in animals [ref. 67,ref. 68], supporting the hypothesis that the behaviors observed in the rabbits of the present study could be signs of increased relaxation and comfort. Moreover, as shown in Figure 1, for the CTRL group, the level of movement remained relatively stable, fluctuating between 20 and 40 units over time. On the other hand, in the CBD group, there is a much more marked degree of variability, with an initial increase in movement to about 100 units at the second time point, with a decrease and then another increase to almost 100 units at the fourth time point. This suggests that CBD had a significant effect on the increase in movement of rabbits compared to the CTRL rabbits fed a diet without CBD, with variations occurring over time. The time spent lying down, showed a different trend, since the CTRL group remained approximately at the same level with slight fluctuations of about 7500–7800 units whilst the CBD-treated group showed a steady decline in time spent lying down, from an initial value almost equal to that of the CTRL rabbits and decreasing to about 5500 units at the fourth point. The variability in movement and the consistent reduction in lying time in the CBD group indicated that the addition of CBD in the diet may stimulate or activate physical activity over time, in stark contrast to the stability observed in the CTRL group. Further studies would be necessary to fully understand the mechanisms underlying these effects.
4.5. Total Lipids and Fatty Acid Profile of the Loins, Thighs, and Livers
Furthermore, it is also interesting to investigate the potential effect of CBD on lipid metabolism in rabbits and, consequently, on the lipid composition of the final products [ref. 27]. Starting from a wider context, the nutritional quality of rabbit meat can be further improved through targeted dietary strategies. Additives such as essential oils and plant extracts offer antimicrobial, antioxidant, anti-inflammatory, and immunomodulatory effects, while also serving as potential alternatives to antibiotics, contributing to livestock sustainability [ref. 6,ref. 10]. Thus, functional ingredients, including plant- and animal-derived bioactives, are increasingly used in feed and food applications for their ability to enhance the nutritional value, sensory attributes, and health benefits of animal products. Moreover, the administration of selected dietary additives in rabbits’ diet could be considered an effective way to enrich rabbit meat with unsaturated fatty acids, which are safe for human consumption [ref. 69]. This modification can intervene in different ways such as by free-ranging rabbits, which improves the concentration of n-3 PUFAs in the meat and the antioxidant capacity compared to cage rearing for the higher quality of nutrition based on grazed plants; or by the enrichment of the animals’ diets with natural feed [ref. 27], such as bilberry, thyme, and linseed, which improve the n-3 PUFA and antioxidant contents in the meat. For instance, Simonová et al. (2020) [ref. 70] noted that sage administration to rabbits increased the fat and protein contents, the meat energy value, and the eicosapentaenoic acid. Therefore, phytobiotics, plant-derived substances with health-promoting properties, such as hemp-derived CBD extracts are attracting growing interest in animal nutrition, and our study contributes to exploring their potential applications also in these terms.
Our results showed that the fatty acid profiles of the meat and liver samples reflected the diet, which was rich in n-6 PUFAs. The predominant fatty acids in the meat and liver were linoleic (C18:2n-6), oleic (C18:1n-9), palmitic (C16:0), and stearic (C18:0) acids. While n-3 PUFAs were present and represented mainly by C18:3n-3, they were less abundant, leading to a higher n-6/n-3 ratio in both cuts and liver. There is considerable evidence indicating that the fatty acids of dietary fats may significantly affect adipose and muscle fatty acid composition in rabbits [ref. 71]. The composition of the CBD extract, which was rich in linoleic acid but contained limited n-3 PUFAs, may have also contributed to the observed fatty acid profile. This little enhancement of n-3 PUFAs might be justified as the CBD extract used was a component of hemp oil rather than the oil itself, which usually contains high n-3 PUFA concentrations [ref. 72,ref. 73]. Otherwise, since the dietary effect was minimal, this can likely be attributed to the low level of CBD inclusion, maybe indicating the possibility of a dose-dependent relationship.
Nonetheless, the scarcity of n-3 PUFAs and the greater presence of n-6 PUFAs should not be considered only as a negative effect. Linoleic acid (LA, C18:2n-6) is an essential n-6 PUFA serving as a precursor to arachidonic acid (AA, C20:4n-6), which plays a key role in various physiological processes. According to Kim and Song (2024) [ref. 74], dietary LA and alpha-linolenic acid (ALA, C18:3n-3) are the primary n-6 and n-3 PUFAs, respectively, both critical for synthesizing long-chain PUFAs like AA, eicosapentaenoic acid (EPA), and docosahexaenoic acid (DHA). However, the conversion efficiency of these precursors into LC-PUFAs is low, making dietary sources important. As emphasized by Castellini et al. (2022) [ref. 75], humans and animals cannot synthesize LA or ALA due to the absence of necessary desaturase and elongase enzymes, so these fatty acids must be obtained from the diet. However, excessive intake of LA can hinder the conversion of ALA into EPA and DHA, as discussed by Kim and Song (2024) [ref. 75], and this is of particular concern in Western diets. Moreover, the intramuscular fat significantly influences meat quality, and alterations in its content can modify the fatty acid composition, affecting the nutritional quality of meat [ref. 76]. In our study, rabbit meat, rich in LA, especially in loins and thighs, serves as a functional food source for this essential PUFA. Jackson et al. (2024) [ref. 77] highlighted that elevated LA levels in the diet and blood are associated with improved cardiometabolic outcomes, and this is beneficial for health-conscious consumers concerned about excessive fat intake and its associated risks, such as ischemic heart disease, obesity, and type-2 diabetes [ref. 78].
Even though the differences were minor, the significantly higher level of C14:0 and C16:1n-7 in the CBD liver was associated with the dietary factor, while C10:0 and C12:0 levels in the loin were greater in the CTRL than in the CBD group. These findings may suggest that CBD treatment might have influenced the lipid composition, potentially modulating polyunsaturated fatty acid metabolism [ref. 79].
Regarding the effect of sex, a more pronounced influence was observed in the thigh, with significant differences recorded for some fatty acids (C17:0, C18:0, and C20:2n-6), while other fatty acids (C10:0, C12:0, and C16:1n-7) exhibited a trend toward significant variation. These differences may stem from distinct metabolic pathways or sex-based variations in fatty acid storage, as supported by previous research on gender-driven metabolic responses in rabbits [ref. 80,ref. 81].
Although most of our results did not reach statistical significance, it is still possible to formulate some hypotheses regarding the potential role of CBD in rabbit lipid metabolism through pathways related to oxidative stress modulation, endocannabinoid signaling, and inflammatory responses. Given the current lack of literature on this topic in rabbits, these interpretations remain speculative and should be viewed as preliminary considerations aimed at stimulating further research. Thus, the hypotheses here underwritten are intended as a contribution to ongoing scientific dialogue rather than as definitive conclusions.
So, several observations and existing evidence provide a basis for further exploration of cannabidiol’s (CBD) role in lipid metabolism, oxidative stress, and lipid oxidation. Lipid metabolism is fundamental in mammals, serving as the primary energy reserve and maintaining energy homeostasis. Key tissues involved include adipose tissue, skeletal muscle, and liver. In adipose tissue, fatty acids are mobilized to supply energy to other tissues. In skeletal muscle, fatty acids undergo oxidation, while in the liver, they contribute to the synthesis of triglycerides and the secretion of very low-density lipoproteins [ref. 80,ref. 82].
Peroxisome proliferator-activated receptors (PPARs), particularly PPAR-α and PPAR-γ, play a pivotal role in regulating lipid metabolism. PPAR-α, predominantly expressed in the liver, adipose tissue, and skeletal muscle, promotes fatty acid oxidation. Conversely, PPAR-γ, highly expressed in adipose tissue, regulates adipogenesis and lipid storage [ref. 80]. These transcription factors orchestrate the expression of genes responsible for fatty acid transport, storage, and oxidation, ensuring lipid homeostasis [ref. 82]. CBD has been shown to interact with various receptor targets, including PPAR-γ, CB2 receptors, and the 5-hydroxytryptamine 1A receptor (5-HT1A). Studies suggest that its effects on PPAR-γ may reduce lipid accumulation and improve metabolic parameters under certain conditions, such as obesity and hyperlipidemia [ref. 83]. Thus, it has been suggested that CBD may interact with PPAR-γ, thereby influencing lipid homeostasis, although direct evidence specific to rabbit models is currently lacking. Further research is needed to determine whether such interactions occur in this species and whether they significantly affect lipid deposition in tissues.
Similarly, the potential modulation of the endocannabinoid system (ECS) by CBD warrants attention. The ECS also plays a central role in regulating energy and lipid metabolism [ref. 84,ref. 85]. The ECS consists of endogenous cannabinoids like anandamide (AEA) and 2-arachidonoylglycerol (2-AG), their receptors (CB1 and CB2), and enzymes responsible for their synthesis and degradation [ref. 20]. AEA, derived from arachidonic acid, is critical in fat storage and energy balance. Although CBD exhibits low affinity for CB1 and CB2 receptors, it indirectly modulates the ECS by inhibiting fatty acid amide hydrolase (FAAH), increasing AEA levels. This interaction may influence lipid metabolism and energy expenditure [ref. 86].
Further connections between CBD and lipid homeostasis involve polyunsaturated fatty acid (PUFA) metabolism. Essential PUFAs, such as linoleic acid and α-linolenic acid, serve as precursors to n-6 and n-3 fatty acids, respectively. Metabolites of n-6 PUFAs, including AEA and 2-AG, contribute to inflammation and ECS tone. By modulating ECS activity and PUFA metabolism, cannabinoids like CBD may influence systemic inflammation, oxidative stress, and lipid balance [ref. 84]. However, the extent to which these interactions translate to observable changes in lipid profiles in rabbit tissues remains speculative and requires targeted studies.
Experimental evidence also highlights CBD’s effects on fatty acid metabolism. For example, Bielawiec et al. (2023) [ref. 86] demonstrated that CBD reduced the expression of long-chain fatty acid (LCFA) transport proteins and inhibited de novo lipogenesis in skeletal muscle. In rats fed a high-fat diet, CBD positively impacted fatty acid elongation and desaturation, reducing intramuscular lipid accumulation. Similarly, Jadoon et al. (2016) [ref. 87] observed that CBD (dosage of 3 mg/kg body weight/day over a period of 4 weeks) improved lipid profiles, including elevated HDL-C levels and reduced total cholesterol and liver triglycerides, in genetically obese mice.
The role of CBD in cholesterol metabolism has also been explored. He et al. (2024) [ref. 88] reported that CBD enhances cholesterol efflux through the PPAR-γ-ABCA1/ABCG1 pathway, crucial for macrophage cholesterol regulation. Additionally, CBD downregulated scavenger receptors such as CD36 and SRA while upregulating cholesterol efflux proteins like ABCA1 and ABCG1, reducing foam cell formation and intracellular cholesterol accumulation. These mechanisms highlight CBD’s potential in improving cardiovascular health and mitigating atherosclerosis.
While these mechanisms have been observed in vitro and in other animal models, their relevance to rabbit tissues and their potential implications for meat quality remain unexplored.
However, challenges related to the oral administration of CBD in rabbits remain significant. Rooney et al. (2022) [ref. 30] noted that rabbits exhibit low bioavailability of CBD and its precursor CBDA due to their unique coprophagic behavior, which likely alters the absorption profiles. While dietary lipids have been shown to enhance CBD absorption in rats, similar strategies require adaptation for rabbit models. This variability in pharmacokinetics may explain the lack of significant outcomes in our study, underscoring the need for tailored administration strategies.
4.6. Lipid Oxidative Status of the Muscles and Livers
Finally, according to Wang et al. (2021) [ref. 89], rabbit meat (rich in PUFAs) is prone to lipid oxidation. In our results, the liver of the CBD-fed rabbits showed less conjugated dienes than the other group. This might be linked to the fact that oxidative stress, a critical factor in cellular homeostasis, is another area where CBD exhibits potential effects. Excessive Reactive Oxygen Species (ROS) production disrupts redox balance, leading to lipid peroxidation, DNA damage, and inflammation. Phyto cannabinoids like CBD mitigate oxidative stress through multiple mechanisms, including ROS scavenging, inhibition of NADPH oxidase activity, and modulation of ECS signaling [ref. 90]. Additionally, endocannabinoids, like AEA (anandamide or arachidonoyl ethanolamine), attenuate the oxidative damage, suggesting a complex interplay between ECS and oxidative pathways. Whether these effects are sufficiently pronounced to alter the oxidative stress markers in rabbit tissues is yet to be determined.
Moreover, studies by Schuelert and McDougall (2011) [ref. 91] have suggested that CBD exerts significant antioxidant properties, which could be useful for mitigating oxidative stress. The decrease in CD level observed in this trial suggests that CBD exhibited some antioxidant activity, which may be helpful in avoiding oxidative damage [ref. 92]. However, further investigation is needed to explain the mechanisms by which these changes in fatty acid composition could be influenced by CBD and to find out whether these trends turn into significant benefits in rabbit health, welfare, and meat properties.
5. Conclusions
This study provides new insights into the effects of CBD supplementation in rabbits, highlighting its potential role in improving animal health and welfare. CBD was associated with positive physiological and behavioral responses, improved body weight gain, reduced triglyceride levels, and enhanced antioxidant capacity, as shown by lower dROM and higher BAP values. Importantly, CBD inclusion did not negatively affect the lipid quality or chemical composition of rabbit meat. These findings suggest that CBD may act as a modulator of lipid metabolism and oxidative stress, offering a promising alternative to traditional feed additives for intensive rabbit farming, where animals are often exposed to stress factors. However, more detailed studies are required to understand the role of CBD in rabbit lipid metabolism and to assess whether it can effectively improve the nutritional and functional properties of the meat itself, with possible implications for key aspects such as shelf life, food safety, and consumer perception. Furthermore, future studies should aim to optimize CBD administration strategies, further investigate its bioavailability and interactions with the endocannabinoid system, and assess its long-term effects on productivity and welfare. Additionally, the gender-specific differences observed in some parameters merit further investigation.
References
- S.D. Lukefahr, J.I. McNitt, P.R. Cheeke, N.M. Patton. Rabbit Production, 2022
- P. Kumar, N. Sharma, L.K. Narnoliya, A.K. Verma, P. Umaraw, N. Mehta, A.Q. Sazili. Improving Quality and Consumer Acceptance of Rabbit Meat: Prospects and Challenges. Meat Sci., 2024. [DOI | PubMed]
- A.S. Abdelazeem, A.M. Fayed, M.M. Basyony, S.H. Abu Hafsa, A.E. Mahmoud. Hematology Profile, Digestive Enzymes, Thyroid Hormones, Productivity, and Nitrogen Balance of Growing Male Rabbits Supplemented with Exogenous Dietary Lysozyme. Anim. Biotechnol., 2023. [DOI | PubMed]
- L.C. De Cerqueira Magalhães, R.B. Costa, G.M.F. de Camargo. Consumption of Rabbit Meat in Brazil: Potential and Limitations. Meat Sci., 2022. [DOI | PubMed]
- S. Fallahi, Ł. Bobak, S. Opaliński. Hemp in Animal Diets—Cannabidiol. Animals, 2022. [DOI | PubMed]
- G. Papatzimos, E. Kasapidou. Review of hemp components as functional feed and food ingredients: Impact on animal product quality traits and nutritional value. Explor. Foods Foodomics, 2024. [DOI]
- S. Pisanti, A.M. Malfitano, E. Ciaglia, A. Lamberti, R. Ranieri, G. Cuomo, M. Abate, G. Faggiana, M.C. Proto, D. Fiore. Cannabidiol: State of the art and new challenges for therapeutic applications. Pharmacol. Ther., 2017. [DOI | PubMed]
- O.I. Halawa, T.J. Furnish, S. Mark, M.S. Wallace. Role of Cannabinoids in Pain Management. Essentials of Pain Medicine (Fourth Edition), 2018. [DOI]
- E. Jang, H. Kim, S. Jang, J. Lee, S. Baeck, S. In, E. Han. Concentrations of THC, CBD, and CBN in Commercial Hemp Seeds and Hempseed Oil Sold in Korea. Forensic Sci. Int., 2020. [DOI | PubMed]
- F.U. Hassan, C. Liu, M. Mehboob, R.M. Bilal, M.A. Arain, F. Siddique, Q. Lin. Potential of Dietary Hemp and Cannabinoids to Modulate Immune Response to Enhance Health and Performance in Animals: Opportunities and Challenges. Front. Immunol., 2023. [DOI | PubMed]
- I. Corsato Alvarenga, K.S. Panickar, H. Hess, S. McGrath. Cannabinoids in Animal Health: A Review. Annu. Rev. Anim. Biosci., 2023. [DOI | PubMed]
- L. Cristino, T. Bisogno, V. Di Marzo. Cannabinoids and the expanded endocannabinoid system in neurological disorders. Nat. Rev. Neurol., 2020. [DOI | PubMed]
- A.R. Petrovici, N. Simionescu, A.I. Sandu, V. Paraschiv, M. Silion, M. Pinteala. New Insights on Hemp Oil Enriched in Cannabidiol: Decarboxylation, Antioxidant Properties and In Vitro Anticancer Effect. Antioxidants, 2021. [DOI | PubMed]
- R.M. Vitale, F.A. Iannotti, P. Amodeo. The (Poly)Pharmacology of Cannabidiol in Neurological and Neuropsychiatric Disorders: Molecular Mechanisms and Targets. Int. J. Mol. Sci., 2021. [DOI | PubMed]
- C.H.J. Yu, H.V. Rupasinghe. Cannabidiol-Based Natural Health Products for Companion Animals: Recent Advances in the Management of Anxiety, Pain, and Inflammation. Res. Vet. Sci., 2021. [DOI | PubMed]
- R. Amato, E. Pacifico, D. Lotito, V. Iervolino, L. Pierantoni, L. Cortese, M.E. Pero. Effects of a Cannabinoid-Based Phytocomplex (Pain Relief™) on Chronic Pain in Osteoarthritic Dogs. Animals, 2025. [DOI | PubMed]
- F. Zicarelli, D. Lotito, P. Iommelli, R. Amato, T.M. Mahayri, N. Musco, P. Lombardi. Hemp Hay (Cannabis sativa L.) in Grazing Goats’ Diet: Effects on Oxidative and Inflammatory Status. Animals, 2025. [DOI | PubMed]
- P. Iommelli, F. Zicarelli, R. Amato, N. Musco, F. Sarubbi, L. Bailoni, R. Tudisco. The Effects of Hemp Hay (Cannabis sativa L.) in the Diets of Grazing Goats on Milk Production and Fatty Acid Profile. Animals, 2024. [DOI | PubMed]
- R.J. Silver. The Endocannabinoid System of Animals. Animals, 2019. [DOI | PubMed]
- J. Corroon, J.F. Felice. The Endocannabinoid System and Its Modulation by Cannabidiol (CBD). Altern. Ther. Health Med., 2019. [PubMed]
- A. Trocino, F. Menegon, C. Zomeño, D. Pasqualin, G. Cunial, G. Xiccato, F. Pirrone, D. Bertotto, M. Bortoletti, F. Dorigo. A Pilot Study about On-Farm Assessment of Health and Welfare in Rabbits Kept in Different Housing Systems. Front. Vet. Sci., 2022. [DOI | PubMed]
- Z. Formelová, Ľ. Chrastinová, M. Chrenková, M. Polačiková, M. Rajský, O. Bučko, F. Vizzarri. Hempseed Cake in Rabbit Nutrition: Livestock Performances, Quality of Meat, Digestibility of Nutrients and Animal Health Status. Slovak J. Anim. Sci., 2023. [DOI]
- K.J. Jacobson, E.G. Verret, C.L. Runyan, L.A. Kinman, W.F. Owsley, J.P. Muir, W.B. Smith. Hempseed Meal as a Feedstuff in the Diet of Growing Meat Rabbits. Appl. Anim. Sci., 2023. [DOI]
- A. Baláži, A. Svoradová, A. Kováčik, J. Vašíček, P. Chrenek. The Effects of Adding Hempseed Cake on Sperm Traits, Body Weight, Haematological and Biochemical Parameters in Rabbit Males. Vet. Sci., 2024. [DOI | PubMed]
- J. Dochez-Arnault, C. Desdoits-Lethimonier, I. Matias, B. Evrard, M. Lagarrigue, M. Toupin, A. Lardenois, F. Chalmel, S. Mazaud-Guittot, N. Dejucq-Rainsford. Expression of the endocannabinoid system and response to cannabinoid components by the human fetal testis. BMC Med., 2023. [DOI | PubMed]
- O.L. Erukainure, M.G. Matsabisa, V.F. Salau, K.A. Olofinsan, S.O. Oyedemi, C.I. Chukwuma, A.L. Nde, I.M. Shahidul. Cannabidiol Improves Glucose Utilization and Modulates Glucose-Induced Dysmetabolic Activities in Isolated Rats’ Peripheral Adipose Tissues. Biomed. Pharmacother., 2022. [DOI | PubMed]
- S.A. Siddiqui, D.N. Adli, W.S. Nugraha, B. Yudhistira, F.V. Lavrentev, S. Shityakov, S.A. Ibrahim. Social, Ethical, Environmental, Economic and Technological Aspects of Rabbit Meat Production—A Critical Review. Heliyon, 2024. [DOI]
- S. Saxmose Nielsen, J. Alvarez, D.J. Bicout, P. Calistri, K. Depner, V. Michel. Health and Welfare of Rabbits Farmed in Different Production Systems. EFSA J., 2020. [PubMed]
- 29. European Commission National Competent Authorities for the Implementation of Directive 2010/63/EU on the Protection of Animals Used for Scientific Purposes. Working Document on Specific Articles in Directive 2010/63/EUEuropean CommissionBrussels, Belgium2011112
- T.A. Rooney, J.W. Carpenter, B. KuKanich, S.M. Gardhouse, G.C. Magnin, T.N. Tully. Feeding Decreases the Oral Bioavailability of Cannabidiol and Cannabidiolic Acid in Hemp Oil in New Zealand White Rabbits (Oryctolagus cuniculus). Am. J. Vet. Res., 2022. [DOI | PubMed]
- 31. European Directorate for the Quality of Medicines (EDQM) European Pharmacopoeia6th ed.European Directorate for the Quality of Medicines (EDQM)Strasbourg, France2008Chapter 244074413
- 32. AOAC Official Methods of Analysis18th ed.Association of Official Analytical ChemistsArlington, VA, USA2000Volume 2
- J. Fernández-Carmona, C. Cervera, E. Blas. Prediction of the Energy Value of Rabbit Feeds Varying Widely in Fibre Content. Anim. Feed Sci. Technol., 1996. [DOI]
- F.A. Hassan, K.M. Mahrose, M.M. Basyony. Effects of grape seed extract as a natural antioxidant on growth performance, carcass characteristics and antioxidant status of rabbits during heat stress. Arch. Anm. Nutr., 2016. [DOI]
- J. Folch, M. Lees, G.H. Sloane Stanley. A Simple Method for the Isolation and Purification of Total Lipides from Animal Tissues. J. Biol. Chem., 1957. [DOI | PubMed]
- W.W. Christie. A Simple Procedure for Rapid Transmethylation of Glycerolipids and Cholesteryl Esters. J. Lipid Res., 1982. [DOI | PubMed]
- G. Secci, F. Bovera, S. Nizza, N. Baronti, L. Gasco, G. Conte, G. Parisi. Quality of Eggs from Lohmann Brown Classic Laying Hens Fed Black Soldier Fly Meal as Substitute for Soya Bean. Animal, 2018. [DOI | PubMed]
- S. Srinivasan, Y.L. Xiong, E.A. Decker. Inhibition of Protein and Lipid Oxidation in Beef Heart Surimi-Like Material by Antioxidants and Combinations of pH, NaCl, and Buffer Type in the Washing Media. J. Agric. Food Chem., 1996. [DOI]
- G. Secci, M. Borgogno, P. Lupi, S. Rossi, G. Paci, S. Mancini, G. Parisi. Effect of Mechanical Separation Process on Lipid Oxidation in European Aquacultured Sea Bass, Gilthead Sea Bream, and Rainbow Trout Products. Food Control, 2016. [DOI]
- 40.SAS/STAT SoftwareSAS Institute, Inc.Cary, NC, USA2021
- L. Horakova, O. Šťastník, L. Pavlata, E. Mrkvicova. The use of hemp herb in diet for growing rabbits. Proceedings of the MendelNet
- R. Aguilar-Roblero, G. González-Mariscal. Behavioral, Neuroendocrine and Physiological Indicators of the Circadian Biology of Male and Female Rabbits. Eur. J. Neurosci., 2020. [DOI | PubMed]
- A. Setiaji, S. Sutopo, E. Kurnianto. Growth Analysis in Rabbit Using Gompertz Non-Linear Model. J. Indones. Trop. Anim. Agric., 2013. [DOI]
- G.L. Krebs, D.W. De Rosa, D.M. White, B.L. Blake, K.C. Dods, C.D. May, Z.X. Tai, E.H. Clayton, E.E. Lynch. Intake, Nutrient Digestibility, Rumen Parameters, Growth Rate, Carcase Characteristics and Cannabinoid Residues of Sheep Fed Pelleted Rations Containing Hemp (Cannabis sativa L.) Stubble. Transl. Anim. Sci., 2021. [DOI]
- S. Khamhan, T. Tathong, C. Phoemchalard. The Effects of Fresh Hemp Leaf Supplementation (Cannabis sativa) on the Physiological and Carcass Characteristics and Meat Quality in Transported Goats. Animals, 2023. [DOI | PubMed]
- M. Yusuf, M. Yusup, R.D. Pramudya, A.Y. Fauzi, A. Rizky. Enhancing User Login Efficiency via Single Sign-On Integration in Internal Quality Assurance System (espmi). Int. Trans. Artif. Intell., 2024. [DOI]
- H.K. Bhatt, D. Song, G. Musgrave, P.S.S. Rao. Cannabinoid-Induced Changes in the Immune System: The Role of microRNAs. Int. Immunopharmacol., 2021. [DOI | PubMed]
- M.A. Nasr, T. Abd-Elhamid, M.A. Hussein. Growth Performance, Carcass Characteristics, Meat Quality and Muscle Amino-Acid Profile of Different Rabbit’s Breeds and Their Crosses. Meat Sci., 2017. [DOI | PubMed]
- N.J. Nealon, S. Summers, J. Quimby, J.A. Winston. Untargeted Metabolomic Profiling of Serum from Client-Owned Cats with Early and Late-Stage Chronic Kidney Disease. Sci. Rep., 2024. [DOI | PubMed]
- Y. Duan, K. Gong, S. Xu, F. Zhang, X. Meng, J. Han. Regulation of Cholesterol Homeostasis in Health and Diseases: From Mechanisms to Targeted Therapeutics. Signal Transduct. Target. Ther., 2022. [DOI | PubMed]
- Y.F. Wang, G.L. Lee, Y.H. Huang, C.C. Kuo. sn-1,2-Diacylglycerols Protect against Lethal Endotoxemia by Controlling Systemic Inflammation. Immunobiology, 2016. [DOI | PubMed]
- G. Tortoriello, J. Beiersdorf, S. Romani, G. Williams, G.A. Cameron, K. Mackie, T. Harkany. Genetic Manipulation of sn-1-Diacylglycerol Lipase and CB1 Cannabinoid Receptor Gain-of-Function Uncover Neuronal 2-Linoleoyl Glycerol Signaling in Drosophila melanogaster. Cannabis Cannabinoid Res., 2021. [DOI | PubMed]
- E.M. Morris, S.E. Kitts-Morgan, D.M. Spangler, I.M. Ogunade, K.R. McLeod, D.L. Harmon. Alteration of the Canine Metabolome after a 3-Week Supplementation of Cannabidiol (CBD) Containing Treats: An Exploratory Study of Healthy Animals. Front. Vet. Sci., 2021. [DOI | PubMed]
- N. Musco, P. Lombardi, N.F. Addeo, G. Secci, G. Parisi, M.E. Pero, G. Piccolo, A. Nizza, F. Bovera. Mirrors Can Affect Growth Rate, Blood Profile, Carcass and Meat Traits and Caecal Microbial Activity of Rabbits Reared in a “Small Group” Free-Range System. Animals, 2019. [DOI | PubMed]
- O.L. Erukainure, M.G. Matsabisa, V.F. Salau, S.O. Oyedemi, O.R. Oyenihi, C.U. Ibeji, M.S. Islam. Cannabis sativa L. (var. Indica) Exhibits Hepatoprotective Effects by Modulating Hepatic Lipid Profile and Mitigating Gluconeogenesis and Cholinergic Dysfunction in Oxidative Hepatic Injury. Front. Pharmacol., 2021. [PubMed]
- Z. Li, H. He, M. Chen, M. Ni, C. Guo, Z. Wan, H. Xu. Novel Mechanism of Clostridium butyricum Alleviated Coprophagy Prevention-Induced Intestinal Inflammation in Rabbit. Int. Immunopharmacol., 2024. [DOI | PubMed]
- L. Cattaneo, V. Lopreiato, F. Piccioli-Cappelli, E. Trevisi, A. Minuti. Plasma albumin-to-globulin ratio before dry-off as a possible index of inflammatory status and performance in the subsequent lactation in dairy cows. J. Dairy Sci., 2021. [DOI | PubMed]
- F.F. Peres, A.C. Lima, J.E.C. Hallak, J.A. Crippa, R.H. Silva, V.C. Abílio. Cannabidiol as a promising strategy to treat and prevent movement disorders?. Front. Pharmacol., 2018. [DOI | PubMed]
- N.F. Addeo, S. Vozzo, G. Secci, V. Mastellone, G. Piccolo, P. Lombardi, G. Parisi, K.A. Asiry, Y.A. Attia, F. Bovera. Different combinations of butchery and vegetable wastes on growth performance, chemical-nutritional characteristics and oxidative status of black soldier fly growing larvae. Animals, 2021. [DOI | PubMed]
- G. Della Rocca, A. Di Salvo. Hemp in veterinary medicine: From feed to drug. Front. Vet. Sci., 2020. [DOI | PubMed]
- L. Sacchettino, C. Gatta, L. Maruccio, C. Boncompagni, F. Napolitano, L. Avallone, D. d’Angelo. Combining cannabis and melatonin treatment with a rehabilitation program improved symptoms in a dog with compulsive disoder: A case report. Res Vet. Sci., 2023. [DOI | PubMed]
- Y.A. Attia, R.A. Hassan, N.F. Addeo, F. Bovera, R.A. Alhotan, A.D. Al-Qurashi, S. Basiouni. Effects of spirulina Spirulina platensis and/or allium Allium sativum on antioxidant status, immune response, gut morphology, and intestinal lactobacilli and coliforms of heat-stressed broiler chicken. Vet. Sci., 2023. [DOI | PubMed]
- S. Atalay, I. Dobrzyńska, A. Gęgotek, E. Skrzydlewska. Cannabidiol protects keratinocyte cell membranes following exposure to UVB and hydrogen peroxide. Redox Biol., 2020. [DOI | PubMed]
- G. Jîtcă, B.E. Ősz, C.E. Vari, C.-M. Rusz, A. Tero-Vescan, A. Pușcaș. Cannabidiol: Bridge between Antioxidant Effect, Cellular Protection, and Cognitive and Physical Performance. Antioxidants, 2023. [DOI | PubMed]
- M. Rajesh, P. Mukhopadhyay, S. Bátkai, V. Patel, K. Saito, S. Matsumoto, Y. Kashiwaya, B. Horváth, B. Mukhopadhyay, L. Becker. Cannabidiol attenuates cardiac dysfunction, oxidative stress, fibrosis, and inflammatory and cell death signaling pathways in diabetic cardiomyopathy. J. Am. Coll. Cardiol., 2010. [DOI | PubMed]
- A. Jastrząb, A. Gęgotek, E. Skrzydlewska. Cannabidiol regulates the expression of keratinocyte proteins involved in the inflammation process through transcriptional regulation. Cells, 2019. [DOI | PubMed]
- K.L. Overall. Manual of Clinical Behavioral Medicine for Dogs and Cats, 2013
- M.A. ElSohly, M.M. Radwan, W. Gul, S. Chandra, A. Galal. Phytochemistry of cannabis Cannabis sativa L. Prog. Chem. Org. Nat. Prod., 2017. [DOI]
- P.G. Peiretti. Effects of dietary fatty acids on lipid traits in the muscle and perirenal fat of growing rabbits fed mixed diets. Animals, 2012. [DOI | PubMed]
- M.P. Simonová, Ľ. Chrastinová, M. Chrenková, Z. Formelová, A. Kandričáková, E. Bino, A. Lauková. Benefits of enterocin M and sage combination on the physico-chemical traits, fatty acid, amino acid, and mineral content of rabbit meat. Probiotics Antimicrob. Proteins, 2020. [DOI | PubMed]
- D. Miteva, K. Velikov, S. Ivanova, K. Dimov. Production of rabbit meat with functional properties. AgroLife Sci. J., 2020
- K. Ostapczuk, S.O. Apori, G. Estrada, F. Tian. Hemp Growth Factors and Extraction Methods Effect on Antimicrobial Activity of Hemp Seed Oil: A Systematic Review. Separations, 2021. [DOI]
- M. Tura, M. Mandrioli, E. Valli, T.G. Toschi. Quality Indexes and Composition of 13 Commercial Hemp Seed Oils. J. Food Compos. Anal., 2023. [DOI]
- O.Y. Kim, J. Song. Important Roles of Linoleic Acid and α-linolenic acid in Regulating Cognitive Impairment and Neuropsychiatric Issues in Metabolic-Related Dementia. Life Sci., 2024. [DOI | PubMed]
- C. Castellini, S. Mattioli, E. Moretti, E. Cotozzolo, F. Perini, A. Dal Bosco, G. Collodel. Expression of genes and localization of enzymes involved in polyunsaturated fatty acid synthesis in rabbit testis and epididymis. Sci. Rep., 2022. [DOI | PubMed]
- A. Zubiri-Gaitán, A. Blasco, R. Ccalta, K. Satué, P. Hernández. Intramuscular Fat Selection in Rabbits Modifies the Fatty Acid Composition of Muscle and Liver Tissues. Animals, 2022. [DOI | PubMed]
- K.H. Jackson, W.S. Harris, M.A. Belury, P.M. Kris-Etherton, P.C. Calder. Beneficial Effects of Linoleic Acid on Cardiometabolic Health: An Update. Lipids Health Dis., 2024. [DOI | PubMed]
- I. Chernukha, E. Kotenkova, V. Pchelkina, N. Ilyin, D. Utyanov, T. Kasimova, L. Fedulova. Pork Fat and Meat: A Balance between Consumer Expectations and Nutrient Composition of Four Pig Breeds. Foods, 2023. [DOI | PubMed]
- P. Pacher, N.M. Kogan, R. Mechoulam. Beyond THC and Endocannabinoids. Annual Review of Pharmacology and Toxicology, 2020. [DOI]
- L. Liu, C. Fu, F. Li. Acetate Affects the Process of Lipid Metabolism in Rabbit Liver, Skeletal Muscle and Adipose Tissue. Animals, 2019. [DOI | PubMed]
- R. Gál, D. Zapletal, P. Jakešová, E. Straková. Proximate Chemical Composition, Amino Acids Profile and Minerals Content of Meat Depending on Carcass Part, Sire Genotype and Sex of Meat Rabbits. Animals, 2022. [DOI | PubMed]
- L. Lei, S. Xiaoyi, L. Fuchang. Effect of dietary copper addition on lipid metabolism in rabbits. Food Nutr. Res., 2017. [DOI | PubMed]
- S. Senapati, A.A.A. Youssef, C. Sweeney, C. Cai, N. Dudhipala, S. Majumdar. Cannabidiol loaded topical ophthalmic nanoemulsion lowers intraocular pressure in normotensive Dutch-belted rabbits. Pharmaceutics, 2022. [DOI | PubMed]
- S. Komarnytsky, T. Rathinasabapathy, C. Wagner, B. Metzger, C. Carlisle, C. Panda, S. Le Brun-Blashka, J.P. Troup, S. Varadharaj. Endocannabinoid System and Its Regulation by Polyunsaturated Fatty Acids and Full Spectrum Hemp Oils. Int. J. Mol. Sci., 2021. [DOI | PubMed]
- V. Rakotoarivelo, J. Sihag, N. Flamand. Role of the endocannabinoid system in the adipose tissue with focus on energy metabolism. Cells, 2021. [DOI | PubMed]
- P. Bielawiec, S. Dziemitko, K. Konstantynowicz-Nowicka, A. Chabowski, J. Dzięcioł, E. Harasim-Symbor. Cannabidiol improves muscular lipid profile by affecting the expression of fatty acid transporters and inhibiting de novo lipogenesis. Sci. Rep., 2023. [PubMed]
- K.A. Jadoon, S.H. Ratcliffe, D.A. Barrett, E.L. Thomas, C. Stott, J.D. Bell, S.E. O’Sullivan, G.D. Tan. Cannabidiol (CBD) and D9-tetrahydrocannabivarin (THCV) are nonpsychoactive phytocannabinoids affecting lipid and glucose metabolism in animal models. This study set out to examine the effects of these compounds in patients with type 2 diabetes. Diabetes Care, 2016
- M. He, J. Shi, Y.J. Xu, Y. Liu. Cannabidiol (CBD) inhibits foam cell formation via regulating cholesterol homeostasis and lipid metabolism. Mol. Nutr. Food Res., 2024. [DOI]
- Z. Wang, Z. He, D. Zhang, X. Chen, H. Li. Effect of Multiple Freeze–Thaw Cycles on Protein and Lipid Oxidation in Rabbit Meat. Int. J. Food Sci. Technol., 2021. [DOI]
- P. Remiszewski, I. Jarocka-Karpowicz, M. Biernacki, A. Jastrząb, E. Schlicker, M. Toczek, B. Malinowska. Chronic Cannabidiol Administration Fails to Diminish Blood Pressure in Rats with Primary and Secondary Hypertension Despite its Effects on Cardiac and Plasma Endocannabinoid System, Oxidative Stress and Lipid Metabolism. Int. J. Mol. Sci., 2020. [DOI | PubMed]
- N. Schuelert, J.J. McDougall. The Abnormal Cannabidiol Analogue O-1602 Reduces Nociception in a Rat Model of Acute Arthritis via the Putative Cannabinoid Receptor GPR55. Neurosci. Lett., 2011. [DOI | PubMed]
- D.M. Kopustinskiene, R. Masteikova, R. Lazauskas, J. Bernatoniene. Cannabis sativa L. Bioactive Compounds and their Protective Role in Oxidative Stress and Inflammation. Antioxidants, 2022. [DOI | PubMed]