A Study to Assess the Prevalence and Determinants of Compulsive Buying Disorder Among College Students in Chengalpattu District, Tamil Nadu
Abstract
Introduction
Compulsive buying disorder (CBD), also referred to as compulsive buying-shopping disorder, shopping addiction, oniomania, or pathological buying, is characterized by excessive and poorly controlled preoccupations, urges, or behaviors related to shopping and spending. Digitalization in e-commerce and payment systems has made indulgence in shopping easier than ever. CBD is a growing concern, especially in the younger generation.
Aim
To determine the prevalence of CBD and its associated factors among undergraduate medical students.
Methodology
A cross-sectional study was done among undergraduate medical students in a tertiary college in Chengalpattu district, Tamil Nadu, India. A total of 300 students participated in the study. A pretested semi-structured questionnaire was used to collect socio-demographic details and information on factors associated with CBD. A validated scale was used to assess CBD. Data analysis was done using IBM SPSS Statistics for Windows, Version 25 (IBM Corp., Armonk, NY).
Results
The prevalence of CBD was found to be 68/300 (22.6%) among the undergraduate medical students. A total of 26/103 (25.2%) males were affected compared to 42/197 (21.3%) female students. Being tempted to buy during deals and offers, social media influence, and not having a habit of saving money were found to be significantly associated with CBD.
Conclusion
CBD is an often-overlooked behavioral concern in academic settings, and its presence is highlighted in this study. These findings underscore the influence of social media, peers, and strategic deals by e-commerce services on students’ purchasing habits. Interventions to identify and treat CBD in the early stages are important to prevent long-term financial and psychological consequences.
Article type: Research Article
Keywords: compulsive behaviors, impulsive behaviors, medical students, mental health, online shopping behavior
License: Copyright © 2025, CM et al. CC BY 4.0 This is an open access article distributed under the terms of the Creative Commons Attribution License CC-BY 4.0., which permits unrestricted use, distribution, and reproduction in any medium, provided the original author and source are credited.
Article links: DOI: 10.7759/cureus.85664 | PubMed: 40642701 | PMC: PMC12241713
Relevance: Relevant: mentioned in keywords or abstract
Full text: PDF (552 KB)
Introduction
Compulsive buying disorder (CBD), otherwise known as compulsive buying-shopping disorder, shopping addiction, oniomania, and pathological buying, is categorized as too much or perhaps improperly controlled obsessions, desires, or actions regarding going shopping and shelling out, despite not requiring or using those products, resulting in severe negative consequences for affected persons and their family and impairments in important areas of functioning [ref. 1,ref. 2].
We are in an era of technological innovation leading to rapid urbanization, which is accompanied by an increase in people’s average purchasing power. Once people reach a level of financial independence, they tend to develop shopping habits and indulge in buying things that are beyond their essential and daily needs. This condition becomes pathological when it affects their financial stability and affects their personal and professional life [ref. 3]. This condition is often rooted in pre-existing psychiatric conditions such as depression, stress, and anxiety. Shopping has become the only way to cope with stress. It has also been postulated that compulsive buying is associated with attention deficit hyperactivity disorder (ADHD) traits, self-rated depression, and lifetime psychological comorbidities [ref. 4].
It has been found that at least one-quarter of the global population indulges in compulsive buying at some point in their lifetime [ref. 5]. The common age group is 18 to 24 years of age, during which various factors such as self-esteem and social image gain importance in the lives of young adults [ref. 6]. The female gender is commonly involved in compulsive buying when compared with males, as women often tend to accept the fact that they enjoy shopping [ref. 7].
Schlosser et al. hypothesized that CBD occurs in four phases: anticipation, preparation, shopping, and spending [ref. 8]. The first phase begins when a person anticipates having a particular product he wishes to have and creates scenarios in his mind in which he is happy and content with that product. The second phase begins when an individual receives sufficient money to buy the product. In this phase, the person actively searches the Internet for the best available price and decides when and where to purchase the product. In the third phase, the act of shopping comes into play, in which a person visits a particular store and buys a product about which they are intensely excited [ref. 8]. The final act of purchase is usually followed by disappointment or letdown and guilt [ref. 9]. The motives or factors that predispose a person to involvement in CBD may include depression, anger, boredom, and anxiety, which are usually relieved after the completion of the act of buying things [ref. 10].
Although India is a developing country, there has been a rapid rise in e-commerce, leading to the availability of many online retailers selling all types of consumer items from fashion and jewelry to all types of electronics. Everything is digitally available, accompanied by a review system that provides a review of products. Therefore, a person with a CBD tends to obsessively scroll various webpages regarding the product and read a countless number of reviews before deciding [ref. 11]. A single critical negative review may leave them off, and a vicious cycle continues for the next product. This, in addition to the consequences of CBD, also increases screen time and various side effects associated with prolonged gadget use, such as headaches, anxiety, and depression [ref. 12].
Based on the above background, this study was conducted among medical students in a tertiary medical college and hospital to determine the prevalence of compulsive buying disorders and the associated factors that would have predisposed them to the condition.
Materials and methods
Definition
CBD is categorized as improperly controlled obsessions, desires, or actions regarding going shopping and shelling out, despite not requiring or using those products, resulting in severe negative consequences for affected persons and their family and impairments in important areas of functioning.
Study setting
A cross-sectional study was done among undergraduate medical students at Sree Balaji Medical College and Hospital, a tertiary medical college situated in Chengalpattu district, Tamil Nadu, India. The total duration of the study was six months, from January 2024 to June 2024. Ethical approval was obtained from the Institutional Human Ethics Committee, Sree Balaji Medical College and Hospital (002/SBMCH/IHEC/2023/2095).
Sample size calculation
Since there is no previous study done on CBD in India, prevalence (P) was taken as 50% and applying the formula Z2 PQ/L2 with Z = 1.96, 95% Confidence Interval, P = 50%, Q = 50%, and absolute precision L = 6%, the minimum required sample size was calculated to be 267. Assuming a nonresponse rate of 10%, the sample size is rounded off to 300, which is the minimum required sample size.
Sampling method
The total number of undergraduate medical students in the selected medical college was 1250, who were distributed among regular and supplementary batches across four academic years. The participants were selected from all academic years using probability-proportional-to-size (PPS) sampling, which was used to determine the number of participants from each academic year. The participants from each year were line-listed and systematic random sampling was used to select participants from each year. In each batch, the first participant was chosen among the first five students in the line list by lottery method and subsequently, every fourth student was chosen. If a participant did not consent to participate in the study, the next person in line was approached to provide consent.
Data analysis
Data were entered into Microsoft Excel 2013 (Microsoft Corp., Redmond, WA, USA), and statistical analysis was performed using IBM SPSS Statistics for Windows, Version 25 (IBM Corp., Armonk, NY). Descriptive statistics are presented as tables and graphs. Bivariate analysis was performed using the Chi-square test, and variables that were found to be statistically significant at 95% CI were included in the logistic regression model. The strength of the association between CBD and related factors was quantified using adjusted odds ratios.
Study tools
A pretested semi-structured questionnaire was used to collect socio-demographic details, and details regarding CBD-like modes of shopping, payment methods, etc. (see Appendix A). The Richmond Compulsive Buying Scale [ref. 13] was used to measure CBD prevalence (see Appendix B). It is a 6-item questionnaire in which responses were graded on a Likert scale of 1-7. When a person scores above 25, they are considered to have compulsive buying disorder [ref. 13,ref. 14].
Results
The sociodemographic features and sources of money of the study participants are listed in Table 1. Most study participants belonged to the age group of 21-24 years, comprising 168 (56%) students. The majority of the study participants were female students (197 (65.7%)). Among the study participants, only 14 (4.7%) had their own sources of income, while 62 (20.7%) of the respondents received financial support from people other than their parents.
Table 1: Distribution of socio-demographic variables among the study participants (n=300)
| Variables | Category | Frequency N= 300 | Percentage (%) |
| Age | 17-20 | 132 | 44 |
| 21-24 | 168 | 56 | |
| Gender | Female | 197 | 65.7 |
| Male | 103 | 34.3 | |
| Year of study | 1st and 2nd year | 164 | 54.7 |
| 3rd and 4th year | 136 | 45.3 | |
| Residence | Living away from parents | 139 | 46.3 |
| Living with parents | 161 | 53.7 | |
| Own Income Source | Yes | 14 | 4.7 |
| No | 286 | 95.3 | |
| Pocket money per month | More than Rs. 5000 | 98 | 32.7 |
| Less than Rs. 5000 | 202 | 67.3 | |
| Financial support from people other than their parents | Supported by others | 62 | 20.7 |
| Not supported by others | 238 | 79.3 |
The financial habits of study participants are given in Table 2. Seventy (23.3%) of them were accountable to their parents for their expenditures. Among the participants, 149 (49.7%) had savings or recurrent deposit accounts. Two-thirds of participants (198 (66%)) reported that their spending habits were not influenced by their social circles. The majority of the participants (232 (77.3%)) didn’t have the habit of saving money.
Table 2: Distribution of financial practices among the study participants (n=300)
| Variables | Category | Frequency N= 300 | Percentage (%) |
| Accountability to parents | Not accountable | 70 | 23.3 |
| Accountable | 230 | 76.7 | |
| Has savings or recurrent deposit account | Doesn’t have a savings account | 149 | 49.7 |
| Has savings account | 151 | 50.3 | |
| Tempted to buy during offers and deals | Yes | 135 | 45 |
| No | 165 | 55 | |
| Ever been scolded by parents for spending too much | Yes | 117 | 39 |
| No | 183 | 61 | |
| Spending influence by social circle | Yes | 102 | 34 |
| No | 198 | 66 | |
| Social media influence on spending | Yes | 126 | 42 |
| No | 174 | 58 | |
| Habit of saving money | Yes | 68 | 22.7 |
| No | 232 | 77.3 | |
| Been taught about financial saving | Yes | 100 | 33.3 |
| No | 200 | 66.7 |
Figure 1 shows where the study participants spend more money. Participants could choose multiple options if they found more than one option suitable. Most of them (259 (86.3%)) spent a lot on food and snacks, followed by clothes, on which around half of them (151 (50.3%)) spent a great deal of money. Approximately one-fifth of students spent a fair amount of money on electronic gadgets (63 (21%)) and cosmetics (65 (21.7%)). 20 (6.7%) of the participants spent more money on tobacco, alcohol, and related products and 11 (3.7%) of them on in-game purchases.
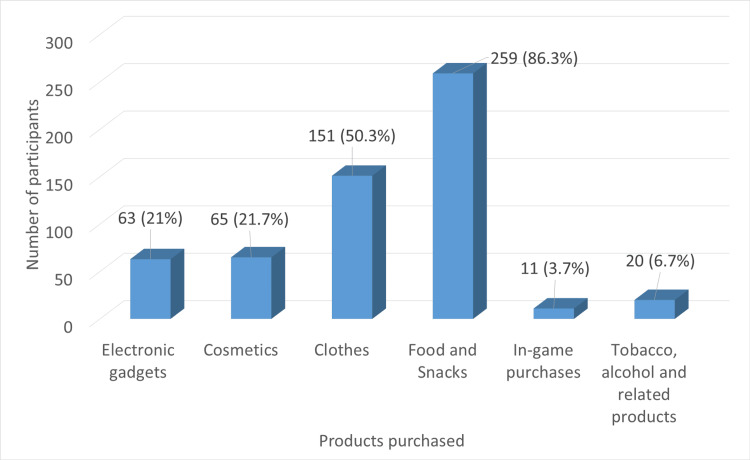
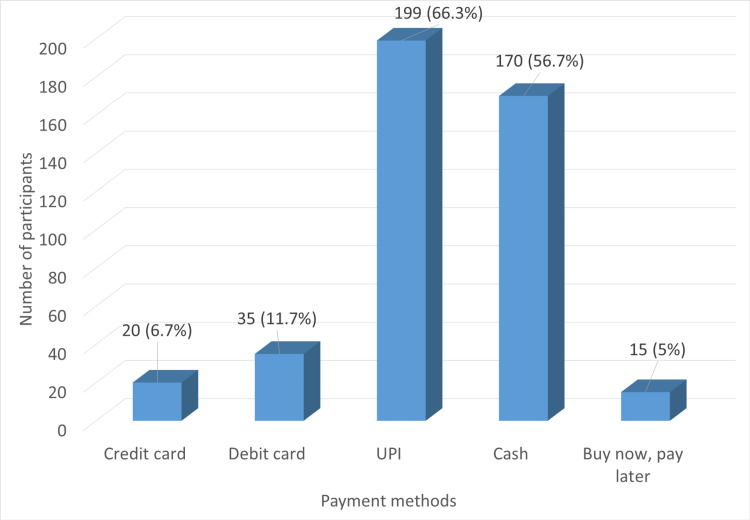
Figure 2 shows the participants’ preferred mode of payment, and they were free to choose more than one option if they found it appropriate. 199 (66.3%) of the students preferred Unified Payments Interface (UPI) payment, followed by cash, which was preferred by a little over half (170 (56.7%)) of the study participants. The payment modes that were liked better by the least number of people were ‘Buy Now, Pay Later’ (15 (5%)) and credit card (20 (6.7%)).
The bivariate analysis of the study variables and the outcome, CBD, is given in Table 3. It was found that students who had their own source of income had 3.689 times higher odds of having CBD when compared to those who did not, with p values of 0.012 and 95% CI = 1.246-10.918. Participants whose spending habits were influenced by social media had 3.647 times more odds of having CBD than those who were not influenced by social media. Other variables that were found to be significantly associated with CBD were living away from parents, being tempted to buy during offers and deals, being influenced by social circles, and not having a habit of saving money.
Table 3: * p-value <0.05, statistically significant at 95% confidence interval † 95% confidence interval
| S. No. | Variables | Category | Has compulsive buying disorder | Doesn’t have compulsive buying disorder | Unadjusted odd’s ratio (95% CI) † | p-value | ||
| – | – | – | Frequency (n) | Percentage (%) | Frequency (n) | Percentage (%) | – | – |
| 1. | Age | 17-20 | 33 | 25 | 99 | 75 | 1.267 (0.737-2.178) | 0.392 |
| 21-24 | 35 | 20.8 | 133 | 79.2 | ||||
| 2. | Gender | Female | 42 | 21.3 | 155 | 78.7 | 0.802 (0.458-1.405) | 0.441 |
| Male | 26 | 25.2 | 77 | 74.8 | ||||
| 3. | Year of study | 1st and 2nd year | 38 | 23.2 | 126 | 76.8 | 1.066 (0.619-1.836) | 0.819 |
| 3rd and 4th year | 30 | 22.1 | 106 | 77.9 | ||||
| 4. | Residence | Living away from parents | 40 | 28.8 | 99 | 71.2 | 1.919 (1.109-3.322) | 0.019* |
| Living with parents | 28 | 17.4 | 133 | 82.6 | ||||
| 5. | Own source of income | Yes | 7 | 50 | 7 | 50 | 3.689 (1.246-10.918) | 0.012* |
| No | 61 | 21.3 | 225 | 78.7 | ||||
| 6. | Pocket money per month | More than Rs. 5000 | 28 | 28.6 | 70 | 71.4 | 1.620 (0.927-2.832) | 0.089 |
| Less than Rs. 5000 | 40 | 19.8 | 162 | 80.2 | ||||
| 7. | Accountability to parents | Not accountable | 18 | 25.7 | 52 | 74.3 | 1.246 (0.670-2.318) | 0.487 |
| Accountable | 50 | 21.7 | 180 | 78.3 | ||||
| 8. | Financial support from others | Supported by others | 14 | 22.6 | 48 | 77.4 | 0.994 (0.509-1.939) | 0.986 |
| Not supported by others | 54 | 22.7 | 184 | 77.3 | ||||
| 9. | Has savings or recurrent deposit account | Doesn’t have a savings account | 34 | 22.8 | 115 | 77.2 | 1.017 (0.593-1.747) | 0.950 |
| Has savings account | 34 | 22.5 | 117 | 77.5 | ||||
| 10. | Tempted to buy during offers and deals | Yes | 46 | 34.1 | 89 | 65.9 | 3.360 (1.895-5.957) | 0.000* |
| No | 22 | 13.3 | 143 | 86.7 | ||||
| 11. | Ever been scolded by parents for spending too much | Yes | 40 | 34.2 | 77 | 65.8 | 2.876 (1.651-5.009) | 0.000* |
| No | 28 | 15.3 | 155 | 84.7 | ||||
| 12. | Spending influence by social circle | Yes | 34 | 33.3 | 68 | 66.7 | 2.412 (1.387-4.193) | 0.002* |
| No | 34 | 17.2 | 164 | 82.8 | ||||
| 13. | Social media influence on spending | Yes | 45 | 35.7 | 81 | 64.3 | 3.647 (2.062-6.451) | 0.000* |
| No | 23 | 13.2 | 151 | 86.8 | ||||
| 14. | Habit of saving money | No | 25 | 36.8 | 43 | 63.2 | 2.555 (1.411-4.628) | 0.002* |
| Yes | 43 | 18.5 | 189 | 81.5 | ||||
| 15. | Been taught about financial saving | Yes | 22 | 22 | 78 | 78 | 0.944 (0.531-1.681) | 0.845 |
| No | 46 | 23 | 154 | 77 | ||||
The logistic regression of variables found to be significant in the bivariate analysis is shown in Table 4 with the adjusted odds ratio. Not having a habit of saving money was found to be significant with an adjusted odds ratio of 3.115 for people who saved money (p-value 0.002 and CI=1.501-6.463). Other variables found to be significantly associated with CBD are being tempted to buy during offers and deals, and spending is influenced by social media.
Table 4: * p-value <0.05, statistically significant at 95% confidence interval † 95% confidence interval
| S. No. | Variables | Category | Unadjusted odd’s ratio (95% CI) † | p-value | Adjusted odd’s ratio (95% CI) † | p-value |
| 1. | Residence | Living away from parents | 1.919 (1.109-3.322) | 0.019 | 1.503 (0.794-2.844) | 0.210 |
| Living with parents | ||||||
| 2. | Own source of income | Yes | 3.689 (1.246-10.918) | 0.012 | 2.735 (0.778-9.621) | 0.117 |
| No | ||||||
| 3. | Tempted to buy during offers and deals | Yes | 3.360 (1.895-5.957) | 0.000 | 2.728 (1.385-5.372) | 0.004* |
| No | ||||||
| 4. | Ever been scolded by parents for spending too much | Yes | 2.876 (1.651-5.009) | 0.000 | 1.457 (0.770-2.758) | 0.247 |
| No | ||||||
| 5. | Spending influence by social circle | Yes | 2.412 (1.387-4.193) | 0.002 | 1.192 (0.586-2.424) | 0.628 |
| No | ||||||
| 6. | Social media influence on spending | Yes | 3.647 (2.062-6.451) | 0.000 | 2.127 (1.053-4.299) | 0.036* |
| No | ||||||
| 7. | Habit of saving money | No | 2.555 (1.411-4.628) | 0.002 | 3.115 (1.501-6.463) | 0.002* |
| Yes |
Discussion
CBD is one of the underreported conditions that, if left unchecked, could lead to financial problems, and the person affected could end up with mental health problems such as depression and anxiety. The results of the present study, which was performed to determine the prevalence of CBD, compared with those of studies conducted elsewhere, are discussed below.
In the present study, the prevalence of CBD was 22.6%. According to Black et al., the lifetime prevalence of CBD is 5.8% in the US [ref. 15]. A study conducted by Amin et al. in Saudi Arabia and Narayanan et al. in Chengalpattu district found the prevalence of CBD to be 18.2% and 29.7%, respectively [ref. 16,ref. 17]. A study by Lejoyeux et al. in France reported the prevalence of CBD to be 11% [ref. 18]. A comparatively lower prevalence of 8.3% was reported in a study by Maraz et al. in England [ref. 19]. As the prevalence was found to be as low as 8.3% to almost one-fourth of participants being affected in some studies, it could be attributed to various factors such as demographics, economic status of the population, and the data collection tool used to quantify CBD.
According to the present study, males were more commonly affected (26 (25.2%)) than female participants (42 (21.3%)). Contradictory findings were found in studies conducted by McElroy et al. and Schlosser et al. in the US, in which women were more commonly affected than men based on the notion that women love shopping and indulge in that activity more than men [ref. 7,ref. 8]. These findings could be further explored to identify spending patterns by gender through qualitative interviews [ref. 8].
In this study, those who were tempted to buy during offers and deals were found to have a statistically significant association with CBD. A motivation theory put forth by Kukar-Kinney et al. found that high-pressure indicators in the form of daily deals and offers affect the vulnerable population, leading to CBD and overspending [ref. 20]. Reducing these advertisements was found to have a positive impact on the spending behavior of the study population, which could in turn reduce the CBD [ref. 20].
According to the present study, participants who were influenced by social media tended to have a higher prevalence of CBD. A study done by Park and Chun found that luxury images and consumer items used by social media influencers could stimulate luxury purchases among the youth population, which could in turn lead to compulsive buying [ref. 21]. A study done by Alajlan and Saleh in Saudi Arabia found that materialism mediates the relationship between advertisements on social media and compulsive buying behavior [ref. 22]. A study by Singh et al. found that fear of missing out (FOMO) due to exposure to goods and products through social media can trigger CBD among individuals [ref. 23].
CBD was found to be more common among those who did not have the habit of saving money. Poor management of financial resources is a common problem, especially among college students [ref. 24]. When exposed to situations in which they have to maintain their social image or status, they tend to impulsively spend money on maintaining their status quo among their peers. This could, in turn, lead to CBD and guilt and self-sabotage, especially when they end up with financial problems. Similar findings were observed in a study done by Harnish et al. [ref. 25].
The major strength of the study lies in the fact that the study population is medical students, who are already subjected to high academic pressure and various sociocultural pressures that predispose them to these behavior patterns. The use of a standardized, validated questionnaire enhanced the reliability of the findings. The cross-sectional nature of this study is a major limitation, as it is difficult to establish a causal relationship.
Conclusions
CBD is an often-overlooked behavioral concern in academic settings, and its presence is highlighted in this study. These findings underscore the influence of social media, peers, and strategic deals by e-commerce services on students’ purchasing habits. It is important to identify and treat CBD in the early stages to prevent long-term financial and psychological consequences. Educational institutions should integrate awareness programs and mental health support systems. Parents should be counseled to prevent CBD in children. Further research is needed to explore the longitudinal patterns and associated risk factors. Addressing this issue holistically can contribute to the overall well-being of future healthcare professionals.
Table 5: UPI: Unified Payments Interface
| S. No. | Variables | Answers |
| 1. | Participant ID | |
| 2. | Age | |
| 3. | Gender | |
| Male | ||
| Female | ||
| Other | ||
| 4. | Year of study | |
| 5. | Residence | |
| Living away from parents | ||
| Living with parents | ||
| 6. | Do you have your own income source? | |
| Yes | ||
| No | ||
| 7. | How much pocket money do you receive per month? | |
| 8. | Are you supported financially by people other than your parents? | |
| Yes | ||
| No | ||
| 9. | Are you accountable to your parents for your spending? | |
| No | ||
| Yes | ||
| 10. | Do you have a savings or recurrent deposit account? | |
| No | ||
| Yes | ||
| 11. | Are you tempted to buy during offers and deals? | |
| Yes | ||
| No | ||
| 12. | Have you ever been scolded by your parents for spending too much money? | |
| Yes | ||
| No | ||
| 13. | Do you feel that your spending behaviour is influenced by social circle (other than social media)? | |
| Yes | ||
| No | ||
| 14. | Does social media play a role in your buying behaviour? | |
| Yes | ||
| No | ||
| 15. | Do you have a habit of saving money? | |
| Yes | ||
| No | ||
| 16. | Did any in your family or school teach you about financial savings? | |
| Yes | ||
| No | ||
| 17. | What are the things you spend money the most on? | |
| Electronic gadgets | ||
| Cosmetics | ||
| Clothes | ||
| Food and snacks | ||
| In-game purchases | ||
| Tobacco, alcohol and related products | ||
| 18. | What is your preferred mode of payment? | |
| Credit card | ||
| Debit card | ||
| UPI | ||
| Cash | ||
| Buy now, pay later | ||
Table 6: Source: Ridgway et al. (2008) [ref. 13]
| Strongly Disagree | Strongly Agree | ||||||
| 1 | 2 | 3 | 4 | 5 | 6 | 7 | |
| 1) My closet has unopened shopping bags in it. | |||||||
| 2) Others might consider me a schopaholic. | |||||||
| 3) Much of my life centers around buying things. | |||||||
| 4) I consider myself an impulsive purchaser. | |||||||
| Never | Very Often | ||||||
| 1 | 2 | 3 | 4 | 5 | 6 | 7 | |
| 5) I buy things that I don’t need. | |||||||
| 6) I buy things I did not plan to buy. | |||||||
References
- A ElBarazi. Association between compulsive buying disorder and childhood trauma. Glob J Intellect Dev, 2023
- A Müller, NM Laskowski, TA Thomas. Update on treatment studies for compulsive buying-shopping disorder: a systematic review. J Behav Addict, 2023. [PubMed]
- A Jose. A study on the effects of compulsive buying behavior and shopping addiction on the self-esteem of college-going female students. Int J Indian Psychol, 2023
- DW Black, M Shaw, B McCormick, JD Bayless, J Allen. Neuropsychological performance, impulsivity, ADHD symptoms, and novelty seeking in compulsive buying disorder. Psychiatry Res, 2012. [PubMed]
- G Adamczyk. Compulsive and compensative buying among online shoppers: an empirical study. PLoS One, 2021
- R Granero, F Fernández-Aranda, G Mestre-Bach. Compulsive buying behavior: clinical comparison with other behavioral addictions. Front Psychol, 2016. [PubMed]
- SL McElroy, Jr Keck PE, Jr Pope HG, JM Smith, SM Strakowski. Compulsive buying: a report of 20 cases. J Clin Psychiatry, 1994. [PubMed]
- S Schlosser, DW Black, S Repertinger, D Freet. Compulsive buying: demography, phenomenology, and comorbidity in 46 subjects. Gen Hosp Psychiatry, 1994. [PubMed]
- LM Koran, RJ Faber, E Aboujaoude, MD Large, RT Serpe. Estimated prevalence of compulsive buying behavior in the United States. Am J Psychiatry, 2006. [PubMed]
- RG Miltenberger, J Redlin, R Crosby. Direct and retrospective assessment of factors contributing to compulsive buying. J Behav Ther Exp Psychiatry, 2003. [PubMed]
- P Dixit, U Phalswal, A Rathee, YS Devi. Online compulsive buying behavior and its association with internet addiction, self-esteem, impulsiveness, and emotional distress among nursing students. Ind Psychiatry J, 2024. [PubMed]
- JE Grant, SR Chamberlain. Compulsive buying disorder: conceptualization based on addictive, impulsive, and obsessive-compulsive features and comorbidity. Psychiatry Res Commun, 2024
- NM Ridgway, M Kukar-Kinney, KB Monroe. An expanded conceptualization and a new measure of compulsive buying. J Consum Res, 2008
- A Müller, P Trotzke, JE Mitchell, M de Zwaan, M Brand. The pathological buying screener: development and psychometric properties of a new screening instrument for the assessment of pathological buying symptoms. PLoS One, 2015
- DW Black. Epidemiology and phenomenology of compulsive buying disorder. The Oxford Handbook of Impulse Control Disorders, 2012
- HS Amin, AA Binobaid, KN Nagshabandi, OB Alammari, OH Alshunaybir, SA Alhammad, AI Almezaini. Compulsive buying disorder (CBD) among medical students in colleges of medicine, dentistry and pharmacy at King Saud University in Riyadh. J Family Med Prim Care, 2022. [PubMed]
- A Narayanan, VD Rajasekar, R Danasekaran. Compulsive buying disorder among medicine, dentistry, and nursing undergraduate students from Chengalpattu district, Tamil Nadu, India: a cross-sectional study. J Clin Diagnostic Res, 2025
- M Lejoyeux, C Richoux-Benhaim, A Betizeau, V Lequen, H Lohnhardt. Money attitude, self-esteem, and compulsive buying in a population of medical students. Front Psychiatry, 2011. [PubMed]
- A Maraz, MD Griffiths, Z Demetrovics. The prevalence of compulsive buying: a meta-analysis. Addiction, 2016. [PubMed]
- M Kukar-Kinney, AC Scheinbaum, T Schaefers. Compulsive buying in online daily deal settings: an investigation of motivations and contextual elements. J Bus Res, 2016
- J Park, J Chun. The consumer socialization process: how social media affects youth luxury consumption. J Glob Fash Mark, 2025
- M Alajlan, M Saleh. Impact of social media advertisement and influencers on compulsive buying mediated by materialism: the moderating role of narcissism. 2024
- A Singh, MA Kumar, M Jagadish, N Thoufeeq, KG Krishna. The impact of social media on compulsive buying behaviour. IJCRT, 2023
- OA Stolper, A Walter. Financial literacy, financial advice, and financial behavior. J Bus Econ, 2017
- RJ Harnish, MJ Roche, KR Bridges. Predicting compulsive buying from pathological personality traits, stressors, and purchasing behavior. Pers Individ Differ, 2021