
Prevalence of Impairing Substance Use in Injured Drivers
Abstract
This cross-sectional study assesses the prevalence of alcohol, cannabis, recreational drugs, and sedating medications in injured drivers in Canada and identifies demographic and collision factors associated with substance use.
Affiliations: Department of Emergency Medicine, The University of British Columbia, Vancouver, British Columbia, Canada; Department of Emergency Medicine, Dalhousie Medicine, Saint John, New Brunswick, Canada; Division of Medical Sciences, University of Northern British Columbia, Prince George, British Columbia, Canada; Department of Surgery, Division of Neurosurgery, Dalhousie University, Halifax, Nova Scotia, Canada; Department of Emergency Medicine, University of Saskatchewan, Saskatoon, Saskatchewan, Canada; Department of Emergency and Family Medicine, University of Montreal, Montreal, Quebec, Canada; Department of Family and Emergency Medicine, Université Laval, Quebec City, Quebec, Canada; Department of Emergency Medicine, University of Toronto, Toronto, Ontario, Canada; Department of Emergency Medicine, Dalhousie University, Dalhousie University, Halifax, Nova Scotia, Canada; Department of Emergency Medicine, Northern Ontario School of Medicine, Thunder Bay, Ontario, Canada; Department of Emergency Medicine, Memorial University, St John’s, New Foundland and Labrador, Canada; Department of Surgery, University of Saskatchewan, Regina, Saskatchewan, Canada; Department of Emergency Medicine, University of Alberta, Edmonton, Alberta, Canada; School of Public Health, University of Alberta, Edmonton, Alberta, Canada; Department of Emergency Medicine, University of Ottawa, Ottawa, Ontario, Canada; Department of Emergency Medicine, University of Calgary, Calgary, Alberta, Canada
License: Copyright 2025 Brubacher JR et al. JAMA Network Open. CC BY 4.0 This is an open access article distributed under the terms of the CC-BY License.
Article links: DOI: 10.1001/jamanetworkopen.2025.6379 | PubMed: 40261650 | PMC: PMC12015673
Relevance: Moderate: mentioned 3+ times in text
Full text: PDF (215 KB)
Introduction
Globally, 1.2 million people die from road trauma each year and many more are injured.1 Many of these collisions are caused by impaired driving. Alcohol-impaired driving is well known to cause collisions.2 Cannabis-impaired driving has attracted increased attention due to global trends toward cannabis legalization and is also associated with increased crash risk.3 Depressants, opioids, and stimulants also increase collision risk.4,5,6,7
Monitoring drug-involved driving is difficult, and prevalence estimates may be biased by methodological limitations. Drug testing requires collection and analysis of biological fluids, such as urine, saliva, or blood, which can be difficult to obtain and have varying degrees of diagnostic accuracy. Furthermore, unbiased prevalence estimates require random selection and standardized testing. The major sources used to monitor drug-involved driving in North America—roadside surveys, coroner data, and police or hospital data from crash-involved drivers—likely misrepresent the true prevalence. Roadside surveys typically obtain saliva samples from consenting drivers and analyze them for drugs in a toxicology laboratory. This approach is limited by refusal rates of 20% to 30%, which may bias results.8,9 Further, blood testing is the benchmark for detecting drugs, and drug concentrations in saliva correlate poorly with those in blood or with impairment.10 Coroner data may be susceptible to bias if drug testing is based on suspicion of drug use and/or racial or gender bias. There may also be differences in drug concentration between the time of collision and when coroner samples are obtained due to postmortem distribution.11 Drivers who have been in a collision may be drug tested by police as part of the collision investigation or in hospital as part of clinical management. These approaches may be susceptible to selection bias if testing is based on suspicion of drug use. The objectives of this study are to (1) report the prevalence of alcohol, cannabis, recreational drugs, and sedating medications in injured drivers in Canada; (2) identify demographic and collision factors associated with increased prevalence for drug or alcohol use; and (3) compare the prevalence of drug-involved driving in different parts of the country.
Methods
This cross-sectional study was approved by the research ethics boards of participating institutions with waivers of informed consent because procedures to protect personal information were observed and because blood samples analyzed were only those that were excess from clinical use. The reporting of the study followed the Strengthening the Reporting of Observational Studies in Epidemiology (STROBE) reporting guideline.
Setting
Participating emergency departments (EDs) operate within regional trauma centers from 15 cities in 8 Canadian provinces. This study is restricted to data collected when all 8 provinces were participating (January 2019 to June 2023); a total of 15 trauma centers participated. According to the 2021 National Census, the total census subdivision of these cities is 10.5 million, which is more than one-quarter of the entire Canadian population (38.25 million).12
Design
Methods of this cross-sectional study have been published previously.13,14,15 They are summarized below.
Population
We prospectively identified drivers who were assessed in the ED for injuries following a motor vehicle crash. Drivers of on-road vehicles (automobiles, sport-utility vehicles, pickup trucks, vans, heavy vehicles, and motorcycles) who had blood obtained within 6 hours of a collision were eligible. Drivers who died at the scene or in the ED were excluded because their medical records and blood samples were inconsistently available across hospital sites due to privacy and legal concerns. Drivers with minor injuries who did not require bloodwork were excluded.
Procedures
Nonstudy clinicians at participating hospitals obtained blood samples to guide trauma management when there was evidence that the driver may have had moderate to severe injuries based on mechanism of injury (eg, high-speed collision) and/or clinical evidence that the driver was injured (eg, unstable vital signs). Research assistants identified eligible drivers and obtained blood that remained after clinical use before it was discarded by hospital laboratories. Cases with no excess blood available were excluded. Blood was frozen for later toxicology analysis at a central laboratory. Research assistants, trained by the project manager (H.C.), reviewed medical records of all eligible drivers and used standardized forms to record basic demographic, medical, and collision information.
Toxicology
Broad-spectrum toxicology testing for cannabinoids, other recreational drugs (cocaine, amphetamines, and opiates), and psychotropic pharmaceuticals (including antihistamines, benzodiazepines, other hypnotics, and sedating antidepressants) was done with liquid chromatography-tandem mass spectrometry. Alcohol level was measured with gas chromatography. Detection limits were 0.2 ng/mL for tetrahydrocannabinol (THC; the primary psychoactive ingredient in cannabis), 0.01% for alcohol, and 1 ng/mL for other drugs. In most cases, samples consisted of whole blood. When only plasma specimens were available, results were adjusted to equivalent whole blood results.16 We reported the following substance categories: THC detectable, THC greater than 5 ng/mL, blood alcohol concentration (BAC) detectable, BAC greater than 0.08%, stimulants detectable, depressants detectable, and opioids detectable. eTable 1 in Supplement 1 shows the substances included in each category. Note that a BAC of 0.08% (80 mg/dL or 17.3 mmol/L) is the legal concentration for operating a motor vehicle in Canada. For cannabis, it is illegal to drive with blood THC greater than 2 ng/mL with higher penalties for THC greater than 5 ng/mL.
Risk Factors
We measured the association of risk factors with substance detection. These included sex, age range, residential postal code (urban or rural based on Canada Post designation),17 time of crash (4-hour blocks), day of crash, year, season, crash type (single-vehicle or multivehicle), injury severity (admitted to hospital or discharged from the ED), and region (British Columbia, Alberta, Saskatchewan, Ontario, Quebec, and the Atlantic provinces).
Statistical Analysis
We computed the crude prevalence for each substance (or substance class) among all included drivers and in selected subgroups of drivers (objective 1). To identify factors associated with substance use (objective 2), we fit separate logistic regression models with each substance of interest as the outcome. Models included all risk factors mentioned previously as covariates. Given the low rate of missing covariates (3.7%), drivers with missing values were excluded. We used cluster-robust standard errors with small-sample correction (CR2 estimator) to account for correlation between drivers who visited the same hospital site.18 Because risk factors are categorical, often with more than 2 possible values, we used Wald χ2 tests to compute P values for the overall effect of each risk factor. Unlike likelihood ratio tests, Wald tests do not require the assumption of independence within clusters. We report adjusted odds ratios (aORs) and 95% CIs derived from model coefficients. Because analyses were exploratory, we considered associations with each factor and substance threshold as separate hypotheses. P values less than .05 were considered statistically significant.19 To examine geographic variation in substance use (objective 3), we computed crude prevalence in each region with 95% CIs derived from 1-sample proportions assuming asymptotic normality. Statistical analysis was conducted from April to May 2024 using R version 4.3.1 (R Project for Statistical Computing).
Results
During the study period, 12 486 drivers had blood tests ordered; of these, 2381 were excluded because blood was taken more than 6 hours after the collision, 1772 were excluded because excess blood was unavailable, and 5 were excluded because they died in the ED. In total, 8328 drivers (mean [SD] age, 43 [18] years; median [IQR] age, 40 [28-57] years; 5605 male [67.3%]; 2723 female [32.7%]) were included (Table 1). Of these, 6916 (83.0%) had an urban address and 3039 (36.5%) required hospital admission. Two-thirds of collisions (5369 collisions [64.5%]) occurred during a weekday, 5485 (65.8%) were between 10 am and 10 pm, and 3373 (40.5%) were single-vehicle collisions. eTable 2 in Supplement 1 provides additional information on the drivers and associated collisions.
Table 1. : Characteristics of Injured Drivers and Collisions by Region
| Characteristic | Injured drivers, No. (%) | ||||||
|---|---|---|---|---|---|---|---|
| National (N = 8328) | British Columbia (n = 2418) | Alberta (n = 1605) | Saskatchewan (n = 577) | Ontario (n = 1823) | Quebec (n =1281) | Atlantic Provinces (n = 624) | |
| Age group, y | |||||||
| <19 | 304 (3.7) | 54 (2.2) | 79 (4.9) | 37 (6.4) | 45 (2.5) | 55 (4.3) | 34 (5.4) |
| 19-24 | 1068 (12.8) | 247 (10.2) | 210 (13.1) | 100 (17.3) | 261 (14.3) | 162 (12.6) | 88 (14.1) |
| 25-34 | 1874 (22.5) | 564 (23.3) | 310 (19.3) | 127 (22.0) | 411 (22.5) | 311 (24.3) | 151 (24.2) |
| 35-44 | 1445 (17.4) | 422 (17.5) | 326 (20.3) | 87 (15.1) | 302 (16.6) | 208 (16.2) | 100 (16.0) |
| 45-54 | 1243 (14.9) | 387 (16.0) | 240 (15.0) | 69 (12.0) | 285 (15.6) | 166 (13.0) | 96 (15.4) |
| 55-64 | 1223 (14.7) | 376 (15.6) | 235 (14.6) | 75 (13.0) | 251 (13.8) | 200 (15.6) | 86 (13.8) |
| 65-74 | 716 (8.6) | 233 (9.6) | 119 (7.4) | 56 (9.7) | 157 (8.6) | 107 (8.4) | 44 (7.1) |
| >74 | 455 (5.5) | 135 (5.6) | 86 (5.4) | 26 (4.5) | 111 (6.1) | 72 (5.6) | 25 (4.0) |
| Sex | |||||||
| Male | 5605 (67.3) | 1596 (66.0) | 1038 (64.7) | 393 (68.1) | 1325 (72.7) | 827 (64.6) | 426 (68.3) |
| Female | 2723 (32.7) | 822 (34.0) | 567 (35.3) | 184 (31.9) | 498 (27.3) | 454 (35.4) | 198 (31.7) |
| Residential postal code | |||||||
| Urban | 6916 (83.0) | 2285 (94.5) | 1348 (84.0) | 261 (45.2) | 1434 (78.7) | 1071 (83.6) | 517 (82.9) |
| Rural | 1161 (13.9) | 87 (3.6) | 197 (12.3) | 225 (39.0) | 357 (19.6) | 193 (15.1) | 102 (16.3) |
| Missing | 251 (3.0) | 46 (1.9) | 60 (3.7) | 91 (15.8) | 32 (1.8) | 17 (1.3) | 5 (0.8) |
| Injury severity | |||||||
| Admitted | 3039 (36.5) | 606 (25.1) | 490 (30.5) | 233 (40.4) | 979 (53.7) | 481 (37.5) | 250 (40.1) |
| Treated and released | 5280 (63.4) | 1811 (74.9) | 1115 (69.5) | 342 (59.3) | 843 (46.2) | 795 (62.1) | 374 (59.9) |
| Missing | 9 (0.1) | 1 (<0.1) | 0 | 2 (0.3) | 1 (0.1) | 5 (0.4) | 0 |
| Crash type | |||||||
| Single-vehicle | 3373 (40.5) | 786 (32.5) | 678 (42.2) | 311 (53.9) | 711 (39.0) | 520 (40.6) | 367 (58.8) |
| Multivehicle | 4953 (59.5) | 1632 (67.5) | 927 (57.8) | 266 (46.1) | 1110 (60.9) | 761 (59.4) | 257 (41.2) |
| Missing | 2 (<0.1) | 0 | 0 | 0 | 2 (0.1) | 0 | 0 |
| Time between crash and blood draw, min | |||||||
| Mean (SD) | 117 (71) | 125 (66) | 111 (67) | 124 (69) | 99 (72) | 135 (77) | 107 (68) |
| 0-60 | 1667 (20.0) | 246 (10.2) | 353 (22.0) | 66 (11.4) | 675 (37.0) | 182 (14.2) | 145 (23.2) |
| 61-120 | 2277 (27.3) | 792 (32.8) | 424 (26.4) | 163 (28.2) | 302 (16.6) | 445 (34.7) | 151 (24.2) |
| 121-240 | 3733 (44.8) | 1195 (49.4) | 729 (45.4) | 296 (51.3) | 714 (39.2) | 514 (40.1) | 285 (45.7) |
| 240-360 | 651 (7.8) | 185 (7.7) | 99 (6.2) | 52 (9.0) | 132 (7.2) | 140 (10.9) | 43 (6.9) |
Table 2, eTable 3 in Supplement 1, and Figure 1 show toxicology findings according to risk factor. Of all drivers, 4568 (54.9%) tested positive for an impairing substance, including 1341 (16.1%) with BAC greater than 0%, 1354 (16.3%) with THC greater than 0 ng/mL, 1057 (12.7%) with stimulants, 905 (10.9%) with opioids, and 2368 (28.4%) with depressants. One in 8 drivers (1024 drivers [12.3%]) had BAC greater than 0.08% and 277 (3.3%) had THC greater than 5 ng/mL. One in 5 drivers (1798 drivers [21.6%]) had used more than 1 class of substance. Substances were least commonly detected in drivers aged 75 years or older (195 of 455 drivers [42.9%]) followed by drivers younger than 19 years (149 of 304 drivers [49.0%]) and drivers aged 65 to 74 years (352 of 716 drivers [49.2%]). Substances were detected in 3141 males (56.0%) and 1427 females (52.4%). Males had higher prevalence of alcohol, THC, stimulants, and opioids, and females had a higher prevalence of depressants.
Table 2. : Substance Prevalence Among Injured Drivers by Select Risk Factors
| Factor | Injured drivers, No./total No. (%) | |||||||||
|---|---|---|---|---|---|---|---|---|---|---|
| BAC >0 | BAC ≥0.08% | THC >0 | THC ≥5 ng/mL | Stimulants | Depressants | Opioids | Any substance | Polysubstance | ||
| National (all drivers) | 1341/8328 (16.1) | 1024/8328 (12.3) | 1354/8328 (16.3) | 277/8328 (3.3) | 1057/8328 (12.7) | 2368/8328 (28.4) | 905/8328 (10.9) | 4568/8328 (54.9) | 1798/8328 (21.6) | |
| Age group, y | ||||||||||
| <19 | 42/304 (13.8) | 23/304 (7.6) | 64/304 (21.1) | 12/304 (3.9) | 23/304(7.6) | 59/304 (19.4) | 18/304 (5.9) | 149/304 (49.0) | 46/304 (15.1) | |
| 19-24 | 243/1068 (22.8) | 191/1068 (17.9) | 294/1068 (27.5) | 68/1068 (6.4) | 137/1068 (12.8) | 235/1068 (22.0) | 93/1068 (8.7) | 625/1068 (58.5) | 265/1068 (24.8) | |
| 25-34 | 434/1874 (23.2) | 353/1874 (18.8) | 438/1874 (23.4) | 94/1874 (5.0) | 344/1874 (18.4) | 460/1874 (24.5) | 183/1874 (9.8) | 1132/1874 (60.4) | 509/1874 (27.2) | |
| 35-44 | 252/1445 (17.4) | 202/1445 (14.0) | 222/1445 (15.4) | 48/1445 (3.3) | 273/1445 (18.9) | 428/1445 (29.6) | 183/1445 (12.7) | 849/1445 (58.8) | 376/1445 (26.0) | |
| 45-54 | 175/1243 (14.1) | 136/1243 (10.9) | 147/1243 (11.8) | 19/1243 (1.5) | 153/1243 (12.3) | 382/1243 (30.7) | 154/1243 (12.4) | 648/1243 (52.1) | 255/1243 (20.5) | |
| 55-64 | 134/1223 (11.0) | 92/1223 (7.5) | 132/1223 (10.8) | 22/1223 (1.8) | 96/1223 (7.8) | 385/1223 (31.5) | 158/1223 (12.9) | 618/1223 (50.5) | 226/1223 (18.5) | |
| 65-74 | 49/716 (6.8) | 22/716 (3.1) | 41/716 (5.7) | 12/716 (1.7) | 18/716 (2.5) | 260/716 (36.3) | 85/716 (11.9) | 352/716 (49.2) | 88/716 (12.3) | |
| >74 | 12/455 (2.6) | 5/455 (1.1) | 16/455 (3.5) | 2/455 (0.4) | 13/455 (2.9) | 159/455 (34.9) | 31/455 (6.8) | 195/455 (42.9) | 33/455 (7.3) | |
| Sex | ||||||||||
| Male | 1061/5605 (18.9) | 803/5605 (14.3) | 1034/5605 (18.4) | 216/5605 (3.9) | 814/5605 (14.5) | 1388/5605 (24.8) | 647/5605 (11.5) | 3141/5605 (56.0) | 1306/5605 (23.3) | |
| Female | 280/2723 (10.3) | 221/2723 (8.1) | 320/2723 (11.8) | 61/2723 (2.2) | 243/2723 (8.9) | 980/2723 (36.0) | 258/2723 (9.5) | 1427/2723 (52.4) | 492/2723 (18.1) | |
| Residential postal code | ||||||||||
| Urban | 1012/6916 (14.6) | 772/6916 (11.2) | 1081/6916 (15.6) | 227/6916 (3.3) | 828/6916 (12.0) | 1899/6916 (27.5) | 704/6916 (10.2) | 3657/6916 (52.9) | 1380/6916 (20.0) | |
| Rural | 270/1161 (23.3) | 204/1161 (17.6) | 217/1161 (18.7) | 36/1161 (3.1) | 190/1161 (16.4) | 393/1161 (33.9) | 169/1161 (14.6) | 747/1161 (64.3) | 348/1161 (30.0) | |
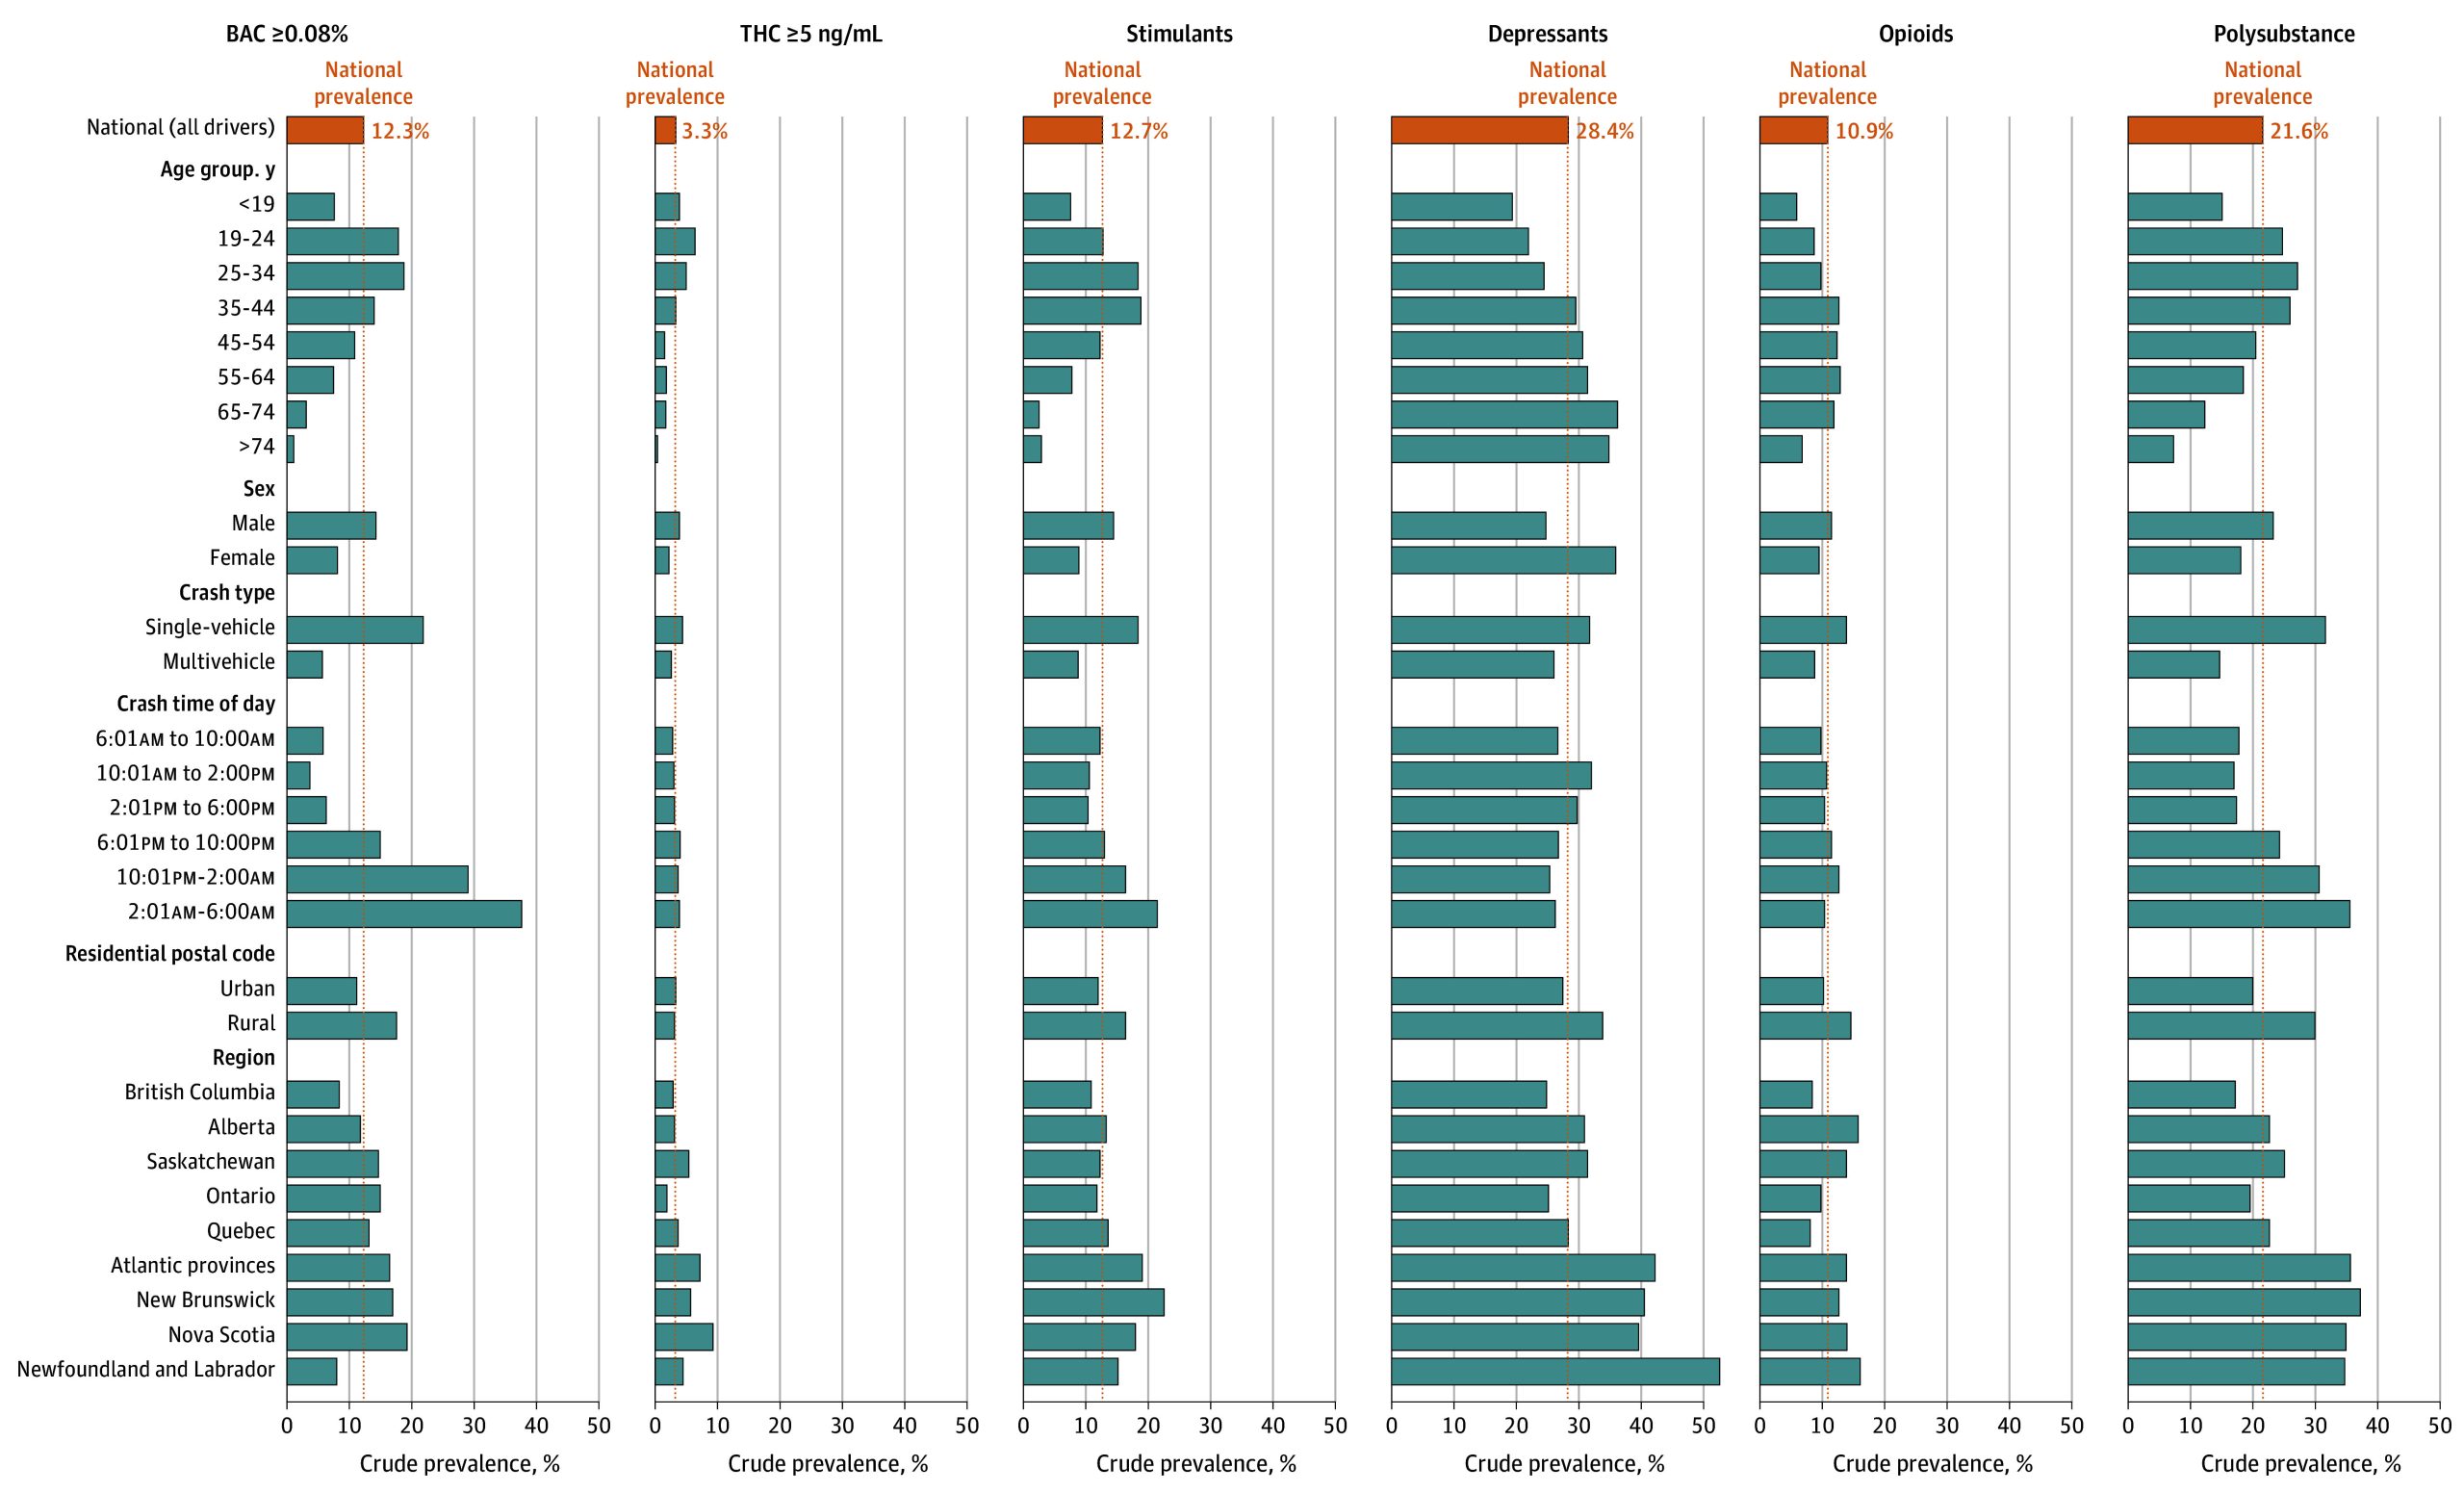
The pattern varied by age. Cannabis was most common in drivers aged 19 to 24 years, alcohol in drivers aged 19 to 34 years, stimulants in drivers aged 35 to 44 years, opioids in those aged 55 to 64 years, and depressants in those aged 65 to 74 years. Substance use was more prevalent in drivers with a rural address (747 of 1161 drivers [64.3%]) vs an urban address (3657 of 6916 drivers [52.9%]), especially for alcohol (204 rural drivers [17.6%] had BAC >0.08% vs 772 urban drivers [11.2%]). Polysubstance use was also higher in rural drivers (348 drivers [30.0%]) than in urban drivers (1380 drivers [20.0%]).
eTable 4 in Supplement 1 and the maps in the eFigure in Supplement 1 show prevalence of different substances by region. Substance use was most prevalent in the Atlantic provinces where two-thirds of drivers (69.6%; 95% CI, 65.7%-73.1%) tested positive for an impairing substance, and lowest in British Columbia where one-half (48.5%; 95% CI, 46.5%-50.5%) tested positive. There were slight variations in this pattern for individual substances.
eTable 5 in Supplement 1 and Figure 2 show results from our adjusted models. Compared with middle-aged drivers (ages 45-54 years), drivers younger than 45 years were more likely to test positive for THC (aORs ranging from 1.36; 95% CI, 1.07-1.73 to 2.79; 95% CI, 2.32-3.36) and drivers aged 19 to 44 years were more likely to have been drinking (aORs ranging from 1.25; 95% CI, 1.02-1.53 to 1.59; 95% CI, 1.33-1.90). Importantly, drivers younger than 19 years were less likely to have been drinking than middle-aged drivers (aOR, 0.58; 95% CI, 0.34-0.98). These models also show that males were more likely than females to have been drinking (aOR, 1.53; 95% CI, 1.21-1.92), to test positive for THC (aOR, 1.66; 95% CI, 1.48-1.86), or to have used a stimulant (aOR, 1.53; 95% CI, 1.34-1.75), but were less likely to have used a depressant (aOR, 0.54; 95% CI, 0.47-0.62).
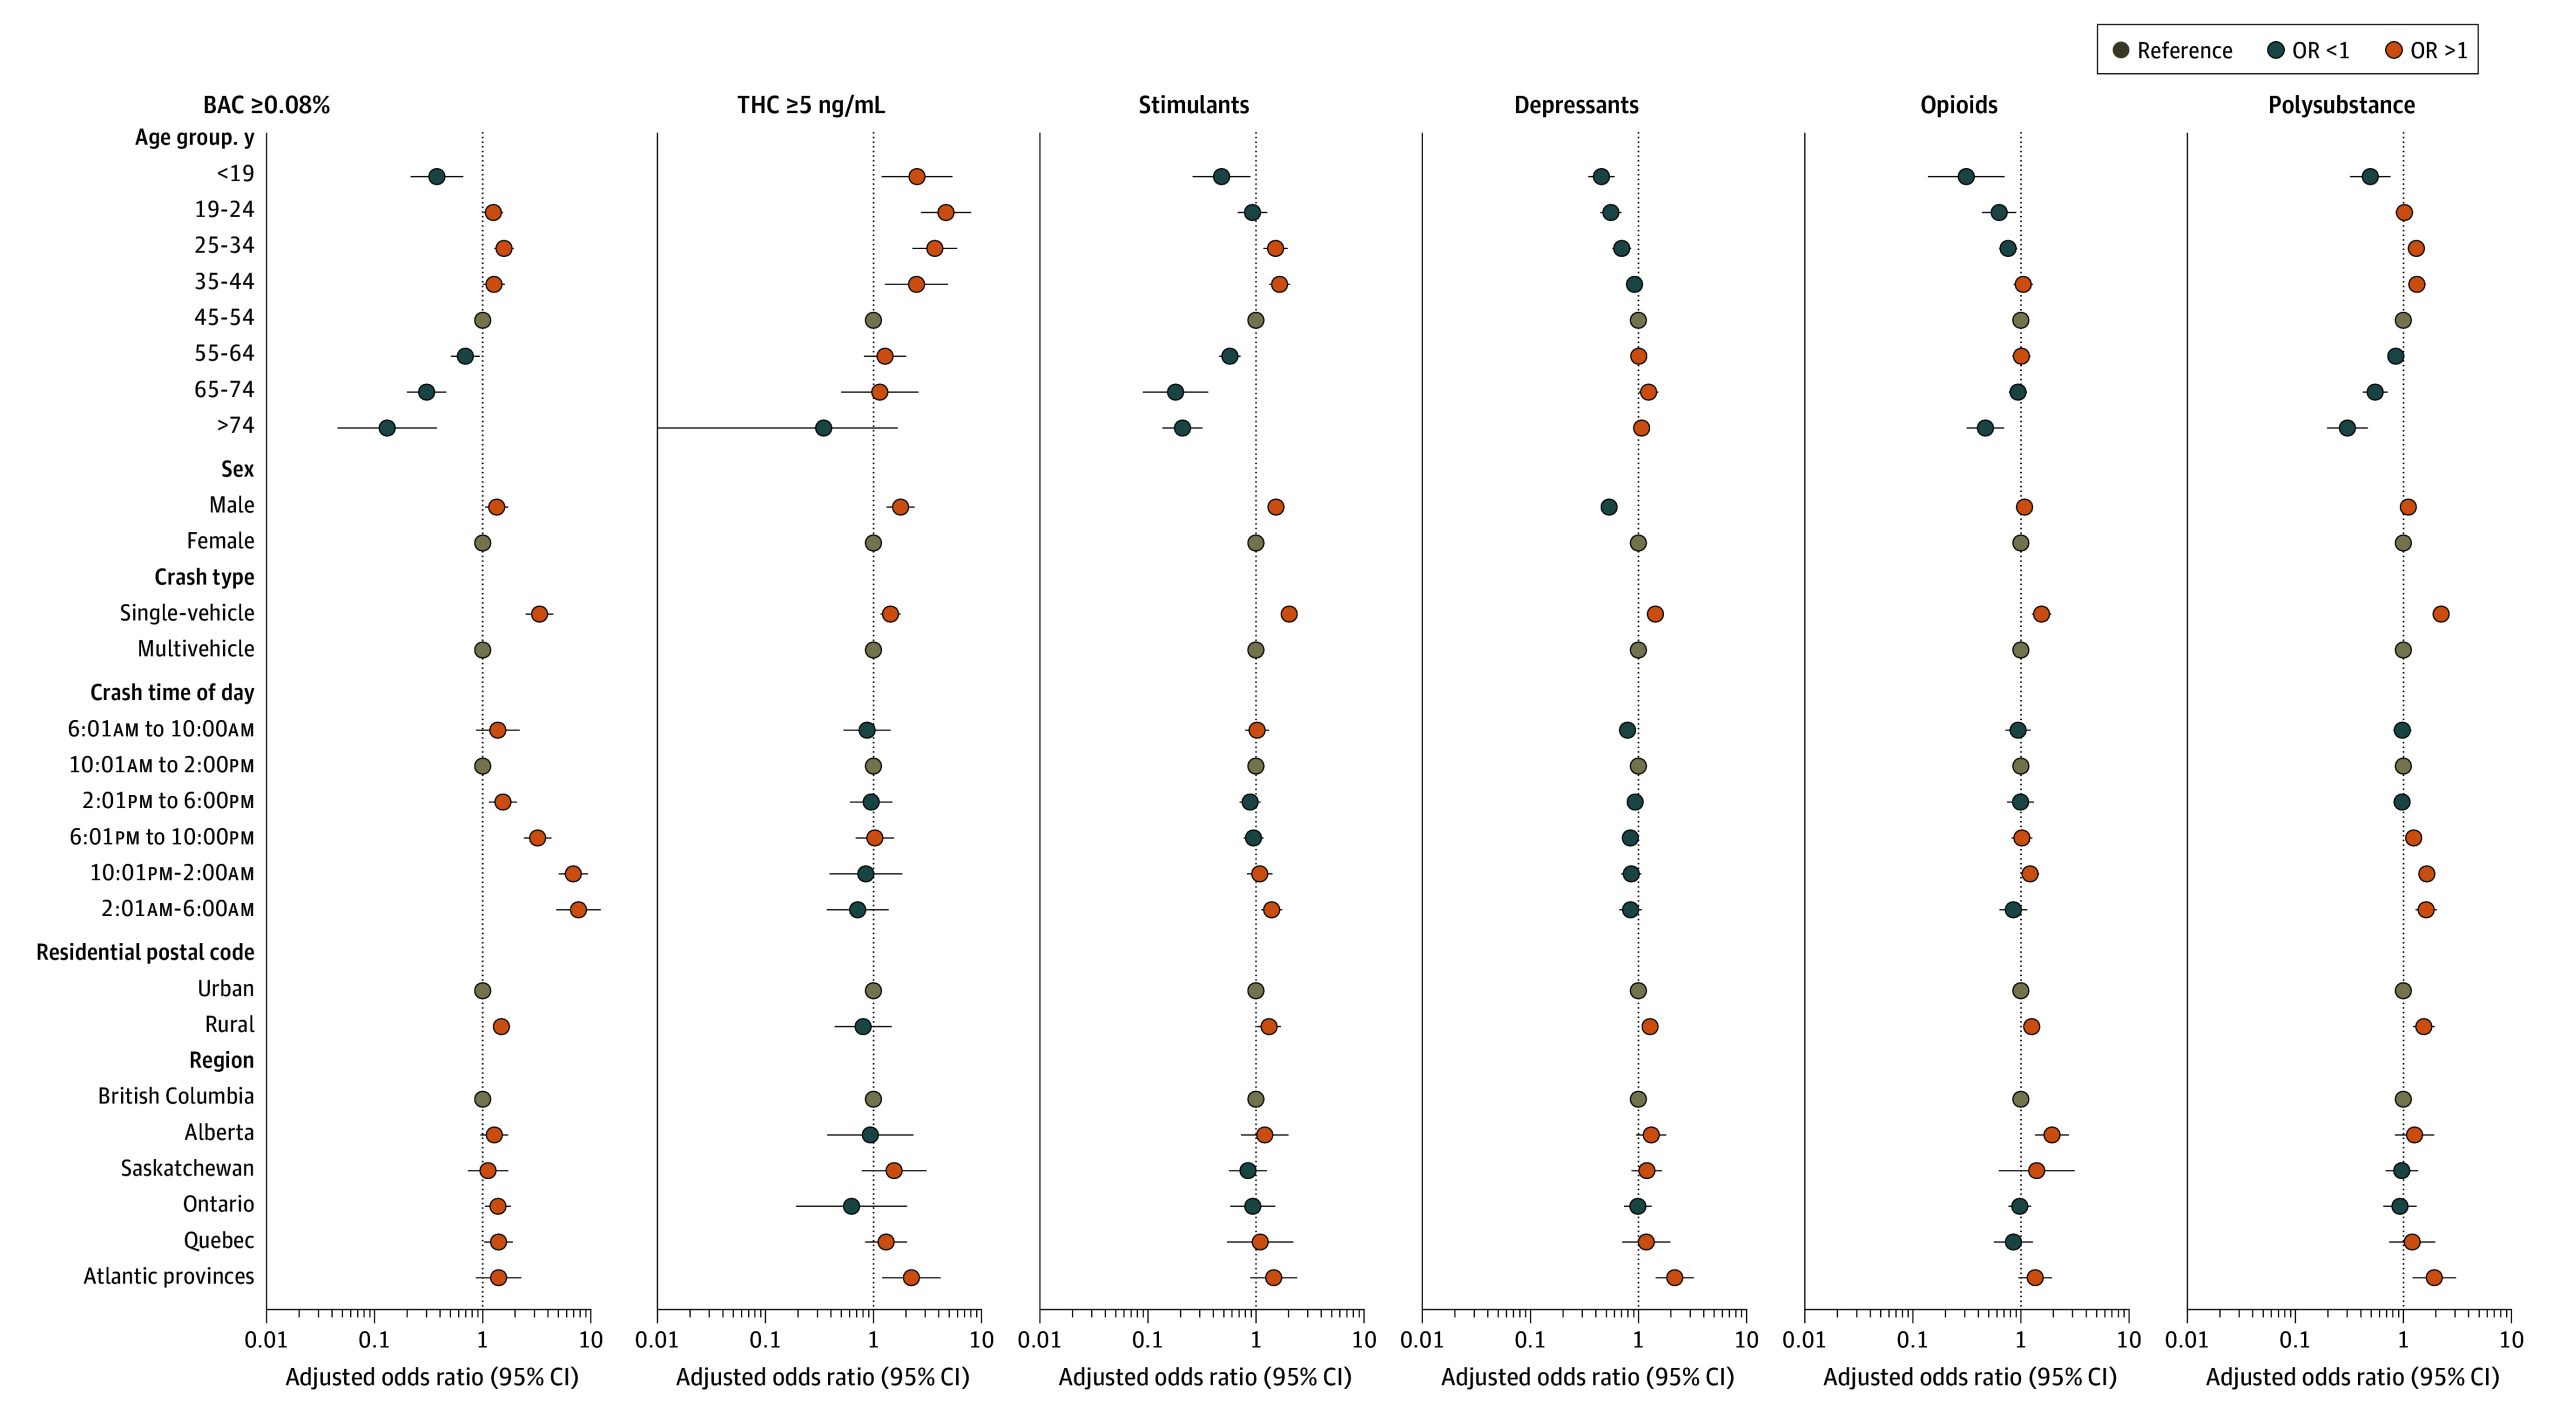
Rural drivers were more likely to have been drinking (aOR, 1.51; 95% CI, 1.29-1.76) and more likely to have used stimulants (aOR, 1.32; 95 CI, 1.03-1.70), depressants (aOR, 1.28; 95% CI, 1.09-1.51), opioids (aOR, 1.26; 95% CI, 1.08-1.47), any substance (aOR, 1.40; 95% CI, 1.20-1.63), or multiple classes of substances (aOR, 1.55; 95 CI, 1.23-1.95). Many geographic differences were also significant. Compared with drivers from British Columbia, drivers from the Atlantic provinces were more likely to test positive for a depressant (aOR, 2.17; 95% CI, 1.45-3.26), for THC of 5 ng/mL or greater (aOR, 2.24; 95% CI, 1.21-4.18), for at least 1 impairing substance (aOR, 1.98; 95% CI, 1.30-3.02), or for multiple substances (aOR, 1.93; 95% CI, 1.22-3.07), and Alberta drivers were more likely to have used opioids (aOR, 1.94; 95% CI, 1.36-2.78).
Discussion
This cross-sectional study reports toxicology results from 8328 injured drivers from 15 Canadian trauma centers. Although presence of an impairing substance does not necessarily mean the driver was impaired, our findings are concerning. More than one-half of drivers (54.9%) had used at least 1 impairing substance, and 1 in 5 (21.6%) had used 2 or more classes of substances, putting them at higher risk of collision.7,20 Depressants, including antihistamines, benzodiazepines and other hypnotics, antidepressants, anticonvulsants, and antipsychotics, were the most commonly detected class of impairing substances (28.4% of drivers). Depressants, especially benzodiazepines, increase collision risk.4,7,21,22 We also found that 12.7% of drivers tested positive for a stimulant and 10.9% had used an opioid. Stimulants and opioids also increase collision risk.7,14
Alcohol and THC were the 2 most commonly detected single substances. One in 6 drivers (16.1%) had been drinking alcohol, and 12.3% had BAC greater than 0.08%. Driving with BAC greater than 0.08% causes a 6-fold increase in collision risk2 and constitutes a criminal offense in Canada. THC was detected more often than alcohol (16.3%); however, detectable THC does not necessarily indicate recent cannabis use.23 Approximately 1 in 30 drivers (3.3%) had THC greater than 5 ng/mL. At a population level, drivers with THC greater than 5 ng/mL have increased risk of crashing, although this risk is less than for drivers with BAC greater than 0.08%.7,14 These statistics suggest that, although more drivers test positive for THC, alcohol remains the greater threat to road safety.
Research from other jurisdictions also indicates a high prevalence of impairing substances in injured drivers. Thomas et al24 studied 1856 injured drivers from 5 US trauma centers (2019-2020), and 56.0% tested positive for any impairing substance, including 24.2% for alcohol and 25.2% for THC. DiRago et al25 studied 4988 crash-involved drivers in Australia (2013-2018), and 38.4% tested positive for any impairing substance, 15.8% for alcohol, and 11.1% for THC. Legrand et al26 investigated 2492 injured drivers from Europe (2007-2010), and 33.3% tested positive for any impairing substance; alcohol was positive in 24.4% and THC in 2.7% of drivers. A 2018 Italian study27 of 1026 injured drivers found that 30.6% tested positive for an impairing substance; 17.3% had BAC greater than 0.05%, 13.6% tested positive for a medicinal drug, and 1.5% had THC greater than 2 ng/mL. These studies used different sampling strategies, which limits direct comparison of results. Nevertheless, like the current research, all report a high prevalence of substance use, especially alcohol, in injured drivers. The higher prevalence of THC in North American drivers vs European or Australian drivers may reflect differences in cannabis consumption rates, in traffic policy and enforcement, and/or in drug use and driving cultures.
We found marked geographic variation in the prevalence of substance use. Prevalence was lowest in British Columbia and highest in Atlantic Canada. This pattern, which persisted after adjustment for driver age, driver sex, and crash type, may be explained by differences in driving and substance use culture, differences in social acceptability of driving after substance use, differences in enforcement of traffic laws, and different prescribing practices (for opioids, depressants, and/or medical cannabis). We also found that substance use was more frequent in drivers with a rural vs an urban address. Other researchers also found higher rates of alcohol and/or drug use in rural drivers,28 which is likely due to multiple factors such as less access to public transportation or taxis in rural areas, difficulty enforcing traffic laws in rural areas, and differences in driving culture and risk perception.29
The current study found variation in substance use by age. Compared with middle-aged drivers (45-55 years), drivers younger than 19 years had a lower prevalence of all substances except THC; they were less likely to test positive for any impairing substance and less likely to have BAC greater than 0.08%. These lower rates are probably explained by zero-tolerance laws for alcohol or drug use in novice drivers. Unfortunately, 7.6% of young drivers had BAC greater than 0.08%. This finding contrasts with Canadian roadside surveys, which found almost no alcohol use in drivers younger than 19 years.8 This discrepancy likely reflects the extreme collision risk in young drinking drivers30 which results in them being over-represented in crash statistics. In contrast with alcohol, THC was twice as prevalent in drivers younger than 19 years compared with drivers aged 45 to 54 years, likely because many young drivers believe it is safe to drive after using cannabis and that the risk of being caught by police is low.31 Moreover, cannabis is predominantly a recreational drug of adolescents and younger adults.32 These findings suggest the need for increased enforcement of zero-tolerance laws in novice drivers, combined with public education on the risks of alcohol and/or cannabis in young drivers.
The use of most substances was highest in drivers aged 19 to 44 years. Alcohol use was highest in drivers aged 25 to 34 years, suggesting increasing alcohol use once drivers are no longer subject to zero-tolerance laws. THC, especially at higher levels, was most common in drivers aged 19 to 24 years, followed by drivers aged 25 to 34 years. The highest rate of stimulant use was in drivers aged 25 to 44 years. These findings suggest the need for increased enforcement measures and social marketing campaigns targeting alcohol, cannabis, and recreational drug use in young to middle-aged drivers.
Older drivers were less likely to use substances with the exception of opioids and depressants. Opioids were most often detected in drivers aged 35 to 74 years and depressants in drivers aged 65 years or older, likely reflecting greater use of prescription medications in older drivers. Use of depressants and opioids by older drivers is concerning because their sedative effects likely exacerbate the impact of age-related declines in reaction time, vision, and cognition. These findings speak to the importance of minimizing sedating medication use in older drivers combined with education on the risks of sedating medications.
The current study also found that more males used recreational substances (alcohol, cannabis, and stimulants) whereas more females used depressants, including prescription medications used to treat anxiety, depression, or other mental health problems. These findings are consistent with the epidemiology of mental health disorders: women have higher rates of anxiety and mood disorders than men, whereas men have higher rates of substance use disorders.33
Strengths and Limitations
Our study had several strengths. Blood tests were obtained to guide trauma management, and we conducted comprehensive toxicology testing on all drivers for whom excess blood was available. This process minimized the selection bias that would occur if toxicology tests were ordered based on clinical suspicion of drug use. Further, our design permitted ethical review board approval for waiver of consent, which allowed us to avoid the refusal bias that could occur if consent were required and drivers who used drugs or alcohol were less likely to participate. We included drivers treated in 15 trauma centers in 8 provinces, making our results more generalizable than if we included only a few hospitals. Data were collected prospectively over a 4-year period, which mitigates the risk of having results skewed by transient events that temporarily impact substance use.
This study also had limitations. Our methods did not allow us to interview or examine drivers. As such, we do not know when the driver used an impairing substance, the route of administration, or if they were impaired. This limitation also means that we were unable to study factors such as impulsivity, risk taking behavior, and anxiety or mood disorders, which also contribute to substance use.34,35 Unavailability of excess blood in many drivers may be a concern, but we believe that this factor is unlikely to have caused bias because availability of excess blood is mostly related to hospital laboratory processes and not driver characteristics. Our findings may not apply to minor-injury collisions that do not require blood tests. The study period included cases from before, during, and after the COVID-19 pandemic, which may have impacted drug and alcohol use in some drivers.
Conclusions
More than one-half of the drivers in this national cross-sectional study tested positive for an impairing substance and more than one-fifth had used multiple classes of substances. THC was detected slightly more often than alcohol, although alcohol remains the greater threat to road safety based on levels in excess of regulations and high collision risk. Prevalence for most substances was higher in younger drivers and in males, while older drivers and females were more likely to have used depressants. Moreover, while highest in Atlantic Canada, the prevalence of substance use was high across the country. These findings suggest that impaired driving remains a substantial road safety concern in Canada. Continued monitoring is required to develop rational targeted interventions and to evaluate the effectiveness of prevention measures.
References
- 1World Health Organization. Global status report on road safety 2023. Published December 13, 2023. Accessed March 14, 2025. https://www.who.int/publications/i/item/9789240086517
- The Long Beach/Fort Lauderdale relative risk study.. J Safety Res., 2009. [DOI | PubMed]
- The effects of cannabis intoxication on motor vehicle collision revisited and revised.. Addiction., 2016. [DOI | PubMed]
- Medications and risk of motor vehicle collision responsibility in British Columbia, Canada: a population-based case-control study.. Lancet Public Health., 2021. [DOI | PubMed]
- Amphetamine-type stimulant use and the risk of injury or death as a result of a road-traffic accident: a systematic review of observational studies.. Eur Neuropsychopharmacol., 2016. [DOI | PubMed]
- Medication use and the risk of motor vehicle collisions among licensed drivers: a systematic review.. Accid Anal Prev., 2016. [DOI | PubMed]
- Odds of culpability associated with use of impairing drugs in injured drivers in Victoria, Australia.. Accid Anal Prev., 2020. [DOI | PubMed]
- 8Ontario Ministry of Transportation. 2022 Roadside survey of alcohol and drug use by drivers in Ontario: final report. Published 2023. Accessed March 14, 2025. https://www.library.mto.gov.on.ca/SydneyPLUS/Sydney/Portal/default.aspx?component=AAAAIY&record=983dae99-27e7-4847-8957-896fe5b8433b&lang=en-US
- 9Berning A, Compton C, Wochinger K. Results of the 2013–2014 National Roadside Survey of Alcohol and Drug Use by drivers. US Department of Transportation National Highway Traffic Safety Administration. Published February 2015. Accessed March 14, 2025. https://www.nhtsa.gov/sites/nhtsa.gov/files/812118-roadside_survey_2014.pdf
- Correlation between oral fluid and blood THC concentration: a systematic review and discussion of policy implications.. Accid Anal Prev., 2022. [DOI | PubMed]
- Interpretation of postmortem forensic toxicology results for injury prevention research.. Inj Prev., 2013. [DOI | PubMed]
- 12Statistics Canada. Census profile, 2021 census of population. Published February 9, 2022. Updated November 15, 2023. Accessed March 14, 2025. https://www12.statcan.gc.ca/census-recensement/2021/dp-pd/prof/index.cfm?Lang=E
- Prevalence of alcohol and drug use in injured British Columbia drivers.. BMJ Open., 2016. [DOI | PubMed]
- Cannabis use as a risk factor for causing motor vehicle crashes: a prospective study.. Addiction., 2019. [DOI | PubMed]
- Epidemiology of drug driving: protocol from a national Canadian study measuring levels of cannabis, alcohol and other substances in injured drivers.. BMC Public Health., 2020. [DOI | PubMed]
- Delta(9)-THC, 11-OH-Delta(9)-THC and Delta(9)-THCCOOH plasma or serum to whole blood concentrations distribution ratios in blood samples taken from living and dead people.. Forensic Sci Int., 2001. [DOI | PubMed]
- 17Mechanda K, Puderer H. How postal codes map to geographic areas. Statistics Canada Geography Division. Published February 2007. Accessed March 14, 2025. https://publications.gc.ca/Collection/Statcan/92F0138M/92F0138MIE2007001.pdf
- Using cluster-robust standard errors when analyzing group-randomized trials with few clusters.. Behav Res Methods., 2022. [DOI | PubMed]
- Do P values lose their meaning in exploratory analyses? It depends how you define the familywise error rate.. Rev Gen Psychol., 2017. [DOI]
- Impacts of alcohol and opioid polysubstance use on road safety: systematic review.. Accid Anal Prev., 2022. [DOI | PubMed]
- Risk of road accident associated with the use of drugs: a systematic review and meta-analysis of evidence from epidemiological studies.. Accid Anal Prev., 2013. [DOI | PubMed]
- Prescription medication use as a risk factor for motor vehicle collisions: a responsibility study.. Inj Prev., 2021. [DOI | PubMed]
- Residual blood THC levels in frequent cannabis users after over four hours of abstinence: a systematic review.. Drug Alcohol Depend., 2020. [DOI | PubMed]
- 24Thomas FD, Berning A, Darrah J, . Drug and alcohol prevalence in seriously and fatally injured road users before and during the COVID-19 public health emergency. National Highway Traffic Safety Administration. Published October 2020. Accessed March 14, 2025. https://rosap.ntl.bts.gov/view/dot/50941
- Prevalence of drugs in injured drivers in Victoria, Australia.. Aust J Forensic Sci., 2019. [DOI]
- Alcohol and drugs in seriously injured drivers in six European countries.. Drug Test Anal., 2013. [DOI | PubMed]
- Prevalence of therapeutic drugs in blood of drivers involved in traffic crashes in the area of Bologna, Italy.. Forensic Sci Int., 2019. [DOI | PubMed]
- Comparing rural traffic safety in Canada and Australia: a scoping review of the literature.. Rural Remote Health., 2022. [DOI | PubMed]
- Identification of differences between rural and urban safety cultures.. Accid Anal Prev., 2009. [DOI | PubMed]
- The relationship between blood alcohol concentration (BAC), age, and crash risk.. J Safety Res., 2008. [DOI | PubMed]
- Attitudes toward driving after cannabis use: a systematic review.. J Cannabis Res., 2024. [DOI | PubMed]
- 32Statistics Canada. National cannabis survey, 2023. Published March 18, 2024. Accessed March 14, 2025. https://www150.statcan.gc.ca/n1/en/daily-quotidien/240318/dq240318e-eng.pdf?st=U90_8TXK
- Cross-national associations between gender and mental disorders in the World Health Organization world mental health surveys.. Arch Gen Psychiatry., 2009. [DOI | PubMed]
- A review of drug use and driving: epidemiology, impairment, risk factors and risk perceptions.. Drug Alcohol Rev., 2004. [DOI | PubMed]
- Mental disorders as risk factors for substance use, abuse and dependence: results from the 10-year follow-up of the National Comorbidity Survey.. Addiction., 2010. [DOI | PubMed]