Integration of Gastric Cancer RNA‐Seq Datasets Along With PPI Network Suggests That Nonhub Nodes Have the Potential to Become Biomarkers
Abstract
Background:
The breakthrough discovery of novel biomarkers with prognostic and diagnostic value enables timely medical intervention for the survival of patients diagnosed with gastric cancer (GC). Typically, in studies focused on biomarker analysis, highly connected nodes (hubs) within the protein–protein interaction network (PPIN) are proposed as potential biomarkers. However, this study revealed an unexpected finding following the clustering of network nodes. Consequently, it is essential not to overlook weakly connected nodes (nonhubs) when determining suitable biomarkers from PPIN.
Methods and Results:
In this study, several potential biomarkers for GC were proposed based on the findings from RNA‐sequencing (RNA‐Seq) datasets, along with differential gene expression (DGE) analysis, PPINs, and weighted gene co‐expression network analysis (WGCNA). Considering the overall survival (OS) analysis and the evaluation of expression levels alongside statistical parameters of the PPIN cluster nodes, it is plausible to suggest that THY1, CDH17, TGIF1, and AEBP1, categorized as nonhub nodes, along with ITGA5, COL1A1, FN1, and MMP2, identified as hub nodes, possess characteristics that render them applicable as biomarkers for the GC. Additionally, insulin‐like growth factor (IGF)‐binding protein‐2 (IGFBP2), classified as a nonhub node, demonstrates a significant negative correlation with both groups within the same cluster. This observation underscores the conflicting findings regarding IGFBP2 in various cancer studies and enhances the potential of this gene to serve as a biomarker.
Conclusion:
The findings of the current study not only identified the hubs and nonhubs that may serve as potential biomarkers for GC but also revealed a PPIN cluster that includes both hubs and nonhubs in conjunction with IGFBP2, thereby enhancing the understanding of the complex behavior associated with IGFBP2.
Article type: Research Article
Keywords: biomarker discovery, gastric cancer, IGFBP2, integration of RNA‐seq datasets, nonhubs, protein–protein interaction network
Affiliations: Department of Alborz Health Technology Development Center Alborz University of Medical Sciences Alborz Iran; Department of Medical Biotechnology, Drug Design and Bioinformatics Unit, Biotechnology Research Center Pasteur Institute of Iran Tehran Iran; Department of Computer Engineering Sharif University of Technology Tehran Iran; Department of Biology, College of Sciences Shiraz University Shiraz Iran
License: © 2025 The Author(s). Cancer Reports published by Wiley Periodicals LLC. CC BY 4.0 This is an open access article under the terms of the http://creativecommons.org/licenses/by/4.0/ License, which permits use, distribution and reproduction in any medium, provided the original work is properly cited.
Article links: DOI: 10.1002/cnr2.70126 | PubMed: 39854135 | PMC: PMC11757912
Relevance: Moderate: mentioned 3+ times in text
Full text: PDF (2.4 MB)
Background
The modern world of biology and concerned researchers believe that prolonged delays in the pathological diagnosis and prognosis of cancers result in missed treatment opportunities and impose substantial financial burdens associated with care. Exploring novel biomarkers with prognostic and diagnostic value provides timely medical intervention for survival of patients with gastric cancer (GC) [ref. 1, ref. 2, ref. 3].
Currently, GC is recognized as the fourth leading cause of cancer‐related fatalities globally, particularly affecting populations in East Asia. A contributing factor to the high mortality rate is that patients with GC often seek medical intervention only when the disease has progressed to an advanced stage with the tumor having metastasized to other parts of the body. Consequently, developing early and noninvasive diagnostic and prognostic biomarkers that can effectively monitor and predict cancer progression at various stages is paramount [ref. 4, ref. 5, ref. 6].
In numerous studies focused on cancer, RNA‐Seq has been extensively employed as a standalone technique for DGE analysis. However, a large number of differentially expressed genes (DEGs) achieve statistical significance, prompting the use of both PPIN and WGCNA as methodologies to filter these genes and associate them with disease phenotypes, cellular structures, and biological pathways. The WGCNA facilitates the identification of co‐expressed genes, while PPIN aids in clustering proteins linked to each gene, thereby contributing to identifying genes closely associated with the disease [ref. 7, ref. 8, ref. 9, ref. 10].
The PPIN serves as a collective representation and association of proteins arising from biochemical processes within the cell. In this kind of network, the nodes symbolize proteins, while the edges denote the interactions between the proteins. The topological parameters of the network are established based on the connections and interactions among the nodes [ref. 11, ref. 12].
The primary topological parameters of PPIN, such as degree (K), Betweenness Centrality (BC), and Closeness Centrality (CC), play a crucial role in elucidating the function of proteins (network nodes) within disease‐related signaling pathways. In this context, the degree of a node is quantified by the number of edges associated with it. The BC serves as a centrality measure within a graph, focusing on the shortest paths (SPs) and indicating the frequency with which a node appears on these paths between pairs of nodes [ref. 13]. This metric helps identify nodes that act as intermediaries connecting different sections of a graph. CC, on the other hand, provides an estimate of the speed at which information can flow from a given node to other nodes. Consequently, proteins exhibiting high values of K and BC are considered to be significantly interconnected with other proteins, forming clusters within the PPIN, and are commonly referred to as hub nodes. Conversely, nodes characterized by low K and BC, situated among hub nodes, are identified as nonhubs [ref. 14].
In numerous studies, it has been demonstrated that clustered hub nodes significantly influence the majority of activities essential for cellular survival and the progression of diseases, making them suitable candidates for evaluation through various laboratory and clinical phases before being recognized as biomarkers [ref. 15, ref. 16].
Nonhubs are considered to have less impact on the development of biological processes, leading to the lack of the capacity to serve as clinical biomarkers. Despite the limited number of bioinformatics studies exploring the potential of nonhubs as biomarkers, this topic has garnered interest due to their significant impact on pharmacological and biological characteristics. According to these investigations, nonhubs in biological systems influence biological processes primarily through interacting with hub nodes [ref. 17, ref. 18, ref. 19].
Clearly, a full explanation of the interaction between PPIN nodes (hubs and nonhubs) plays a crucial role in identifying approaches that enhance exploratory processes for evaluating various biomarkers. In contrast to earlier research, this study uniquely investigates the potential of utilizing hubs and nonhubs (The less prominent nodes within the PPI network) as biomarkers in GC [ref. 20, ref. 21, ref. 22].
Material and Methods
Datasets Resources and Integration Pipeline
The workflow of the current study includes 15 steps presented in the pipeline (Figure 1). All the Fastq paired‐end of 48 mRNA sequencing profiles from GC were retrieved from the NCBI‐SRA using SRA‐Toolkit (https://github.com/ncbi/sra‐tools/wiki/02.‐Installing‐SRA‐Toolkit) (Table 1). In order to increase the accuracy of the integration results, only paired‐end GC datasets containing normal and tumor samples were selected.
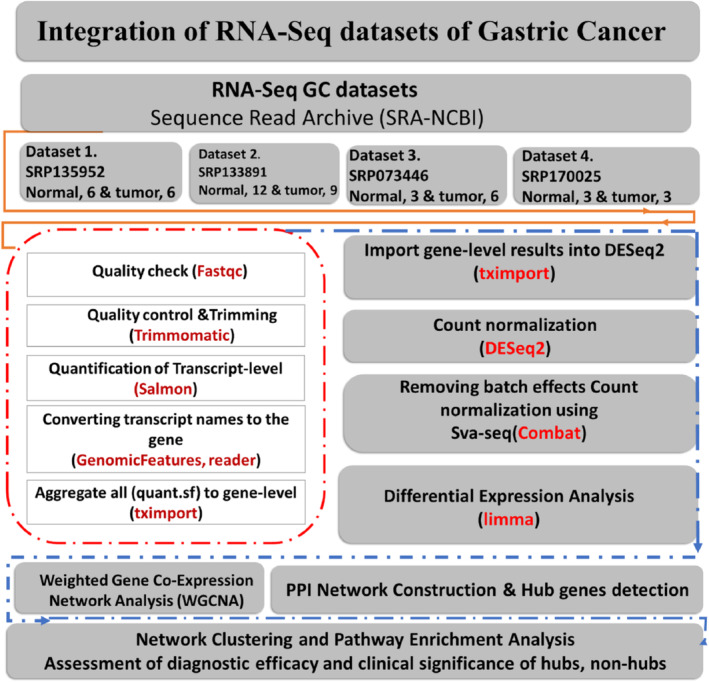
TABLE 1: The RNA‐seq datasets of gastric cancer employed in the present study.
| R | SRA study | Library layout | Experimental design (tumor/normal) | Organization name |
|---|---|---|---|---|
| 1 | SRP135952 | Paired | 12 (6/6) | East China Normal University |
| 2 | SRP133891 | Paired | 21 (12/9) | Hallym University Medical Center |
| 3 | SRP170025 | Paired | 6 (3/3) | Fudan University Shanghai Cancer Center |
| 4 | SRP073446 | Paired | 9 (3/6) | National Chung Cheng University |
RNA‐Seq Data Analysis, Batch Effect Removal, and DGE Analysis
After the quality check of Fastq paired‐end reads, more than 30% of the reads by quality below Q20 and adapters (first 12 bp of the reads) were trimmed utilizing the final version of FastQC [ref. 23] and Trimmomatic [ref. 24]. Subsequently, transcript‐level quantifications for each GC‐RNA‐Seq dataset were accurately quantified from cleaned reads according to the annotation file (Gencode.v99) using Salmon [ref. 25].
After obtaining all quant files related to each dataset, the tximport, GenomicFeatures, and Reader packages were employed to import the transcript level to the gene‐level files [ref. 26]. SVA‐seq (ComBat function) and DESeq2 packages were run on merged normalized values to detect and remove batch effects, low‐expression genes, and other undesirable sources of variation in merged datasets [ref. 27, ref. 28]. To characterize significant DEGs and normalized log expression values, Limma with an adjusted p value threshold (Benjamini–Hochberg) of 0.05 and a fold‐change limit of |log2FC| ≥ 1 were used [ref. 29].
WGCN Analysis and PPIN Construction
Following the DGE analysis, WGCN analysis was applied to DEGs to filter and screen the co‐expression genes related to GC. All interconnected nodes and their interactions were derived through the igraph package using a specific formula and set of criteria [ref. 30]. Subsequently, the edges of the WGC network were then converted into weights assigned to the nodes, resulting in a giant component of the weighted network. Following this, the weighted adjacency matrix of the giant component was converted to a symmetric matrix, which was then used to create a new adjacency matrix employing the topological overlapping measure (TOM) function available in the WGCNA R package [ref. 31].
A comprehensive matrix representing all SPs within the weighted network was developed for every pair of nodes, implementing Dijkstra’s algorithm [ref. 32]. This resulting matrix (Dj) served as the basis for determining the distance value associated with each node in the network. The average SPs from all noncore genes to node j were computed to derive Dj for each node. Then, the average SPs were subtracted from the core genes to reach node j. This value was divided by the average SPs to node j in the entire network. This rating system implies how close each node is to the core nodes [ref. 33, ref. 34].
The STRING database [ref. 35] was recruited to build a PPIN based on five sources of evidence. The extracted interactions were imported into the R program to visualize the PPIN.
Investigation of the Correlation Between the Expression Level of Hubs, Nonhubs, and IGFBP2
To evaluate the clinical significance of the identified PPIN nodes (both hubs and nonhubs), in conjugation with IGFBP2, Pearson’s correlation and the statistical relationship were calculated pairwise among these groups based on their expression levels, employing the corTest package.
Comparative Examination of IGFBP2 Expression Levels, Mutation Frequencies, and Patient Survival Outcomes Across Different Types of Cancer
The comparison of the expression levels of IGFBP2 across different types of cancer, highlighting instances of both downregulation and upregulation of this gene, was analyzed using TCGA data through the UALCAN database.
An analysis was conducted to compare patient survival rates at both up and down expression levels of IGFBP2, utilizing various survival metrics such as disease‐specific survival (DSS), progression‐free survival (PFS), disease‐free survival (DFS), and overall survival (OS). This analysis was based on the TCGA dataset obtained from CBioPortal and employed the Survminer R package along with Kaplan–Meier (kME) methods. Additionally, genetic alterations of IGFBP2 were assessed across different types of cancer via Oncoprint [ref. 36].
Functional and Pathway Enrichment Analysis
Functional pathway enrichment analysis for all the significant PPIN clustered nodes was conducted using g:Profiler (http://biit.cs.ut.ee/gprofiler/) and EnrichR (https://cran.r‐project.org/package=enrichR).
Results
RNA‐Seq Data Normalization, Batch Effect Removal, and DGE Analysis
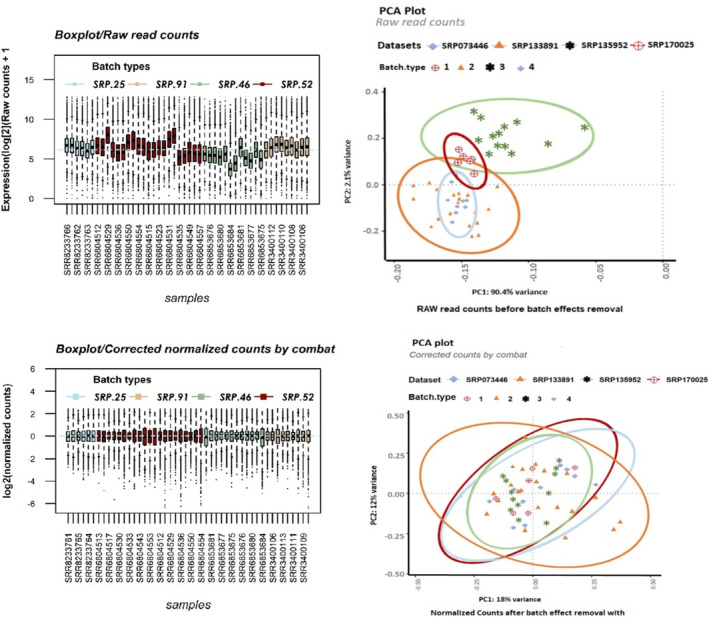
Following the integration of the four datasets, we performed clustering on the raw read counts (Figure 2B) as well as on the counts’ postbatch effect removal (generated by ComBat) (Figure 2D) by principal component analysis (PCA) separately. The box plot illustrates the distribution of counts across samples for both unnormalized counts (Figure 2A) and batch‐corrected counts (Figure 2C). When normalization was performed separately for each batch followed by ComBat application, the optimal outcomes were achieved regarding batch similarity and the creation of a distinct normalized expression matrix suitable for DGE analysis.
After the normalization process and batch effect removal, a unique and normalized matrix with all samples (48 samples) was created and prepared to screen the DEGs between the GC and the control samples through the limma package. A total of 1000 DEGs (padj < 0.05) were obtained, of which 439 genes (padj < 0.05, log2FC ≥ 1) were significantly upregulated (uDEGs), and 133 genes (padj < 0.05, log2FC ≤ −1) were significantly downregulated (dDEGs) (Table S1).
Discovery of Hubs and Nonhubs From the WGC and Clustered PPI Networks
The SP of the WGCN analysis‐based scoring system explained in the material and methods section was used to detect nodes with shorter distances from the core genes (nodes with a positive D‐score), thereby extracting a smaller network from the huge component network. This network consists of 83 nodes containing 19 core nodes and 64 neighbors. The giant component of this network (core network) includes 16 seed nodes and 61 neighboring nodes. The diameter of the WGCN was six genes containing LIFR, LIF, PDGFR, COL1A2, FN1, CEACAM1, and RAB37. The network transitivity was about 50%, the edge density was about 14%, and the mean distance was 2.54 (Table S2).
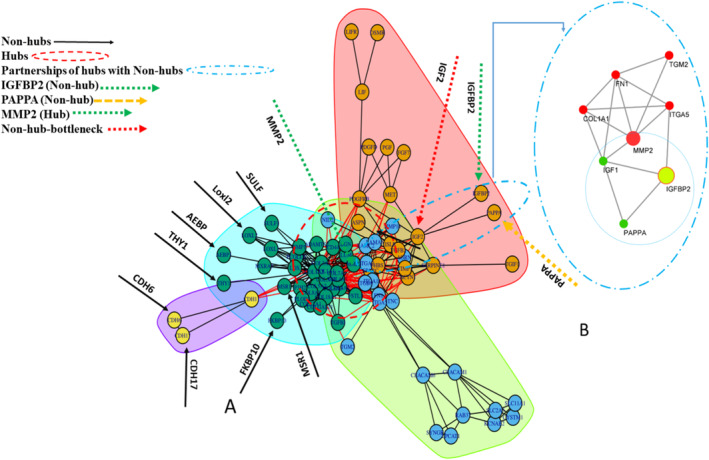
In general, 83 co‐expressed DEGs (padj < 0.05) extracted from WGCN were selected to construct the PPIN. The PPIN nodes with degree greater than 13 and BC greater than 63.94 were considered hubs, including COL1A1, COL1A2, COL3A1, COL5A1, COL4A1, FN1, COL5A2, MMP2, ITGA2, SPARC, THBS1, and ITGA5. The direct neighbors of the hubs with a degree less than three and a BC less than nine, as well as indirect neighbors with two edge distances of the hubs with a degree less than three and a BC equal to zero were considered nonhubs, including NID2, MXRA5, FKBP10, SULF1, THY1, AEBP1, TGM2, CDH17, CDH6, TGIF1, IGFBP2, and PAPPA (Table 2). The clustering of PPIN was performed via a greedy optimization algorithm, resulting in four clusters (Figure 3).
TABLE 2: Statistical information of significant nodes (hubs and nonhubs) represented in PPIN based on K, BC, CC, and distance.
| Gene symbol | Features | K | BC | CC | Distance | |
|---|---|---|---|---|---|---|
| Cluster A | COL1A2* | UP | 37 | 450.23 | 0.5984 | 1.65 |
| COL4A1* | UP | 27 | 73.23 | 0.5205 | 1.9 | |
| COL5A2* | UP | 23 | 65.7 | 0.481 | 2.05 | |
| COL3A1* | UP | 32 | 213.01 | 0.539 | 1.83 | |
| COL5A1* | UP | 28 | 100.81 | 0.5241 | 1.88 | |
| COL1A1* | UP | 39 | 436.86 | 0.608 | 1.62 | |
| MMP2* | UP | 20 | 91.19 | 0.5067 | 1.95 | |
| FKBP10 | UP | 2 | 0 | 0.3838 | 2.57 | |
| THY1 | Up | 1 | 0 | 0.3762 | 2.62 | |
| MXRA5 | UP | 3 | 0 | 0.3918 | 2.52 | |
| SPARC* | UP | 18 | 70.08 | 0.4935 | 2 | |
| Cluster B | THBS1* | UP | 18 | 65.72 | 0.4935 | 2 |
| TGIF1 | UP | 1 | 0 | 0.2923 | 3.38 | |
| TGFBI | UP | 4 | 0 | 0.4368 | 2.26 | |
| IGFBP2 | Down | 1 | 0 | 0.3115 | 3.17 | |
| PAPPA | UP | 1 | 0 | 0.3115 | 3.17 | |
| Cluster C | FN1* | UP | 24 | 496.28 | 0.5507 | 1.79 |
| ITGA5* | UP | 18 | 269.01 | 0.5135 | 1.92 | |
| TGM2 | UP | 2 | 0.66 | 0.3878 | 2.55 | |
| NID2 | Up | 3 | 1.39 | 0.3938 | 2.51 | |
| CDH17 | Up | 2 | 0 | 0.2901 | 3.4 | |
| Cluster D | CDH6 | Up | 2 | 0 | 0.2901 | 3.4 |
| SULF1 | UP | 2 | 0 | 0.3838 | 2.57 | |
| AEBP1 | Up | 1 | 0 | 0.3762 | 2.62 | |
| TGM2 | Up | 2 | 0.66 | 0.3878 | 2.55 |
Note: Hub nodes exhibiting the highest values of K, BC, and CC, along with the lowest distance, are indicated with asterisks.
Assessment of Diagnostic Efficacy and Clinical Significance of Hubs and Nonhubs
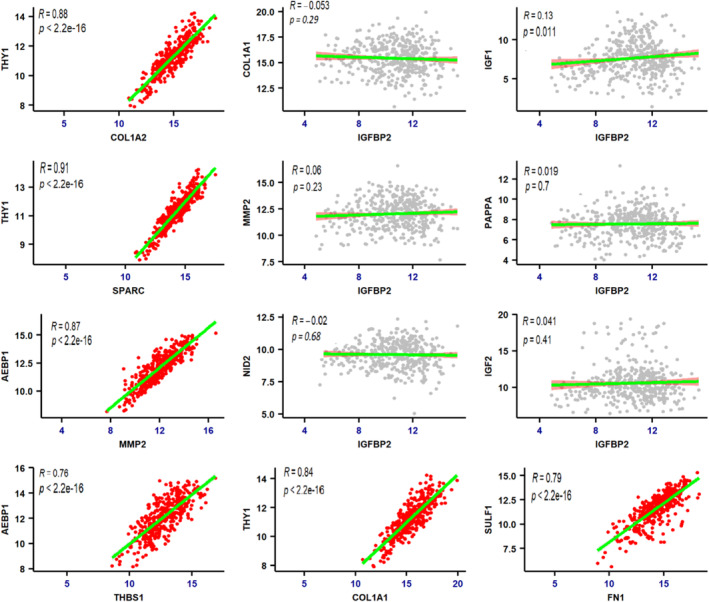
In the current study, the nonhub nodes within each cluster exhibited significant upregulation, and since they have been proposed as potential biomarkers in numerous investigations, we speculated that these nodes may be associated with the hubs and could play a vital role in the progression of GC. To substantiate this hypothesis, we performed Pearson’s correlation coefficient (r) test, which confirmed that all nonhubs correlate positively with the hubs. However, a statistically nonsignificant and negative correlation was observed between the expression levels of IGFBP2 and all hubs and nonhubs (Table S3). The results of this correlation analysis were derived consistent with our initial findings (Figure 4).
Examining the Expression Levels, the Mutation Percentage, and the Survival Outcomes Associated With IGFBP2 Across Various Cancer Types
Based on correlation analysis, the IGFBP2 gene, identified as a nonhub, exhibited significantly divergent trends compared to both hub and nonhub genes. Consequently, an independent assessment of this gene was conducted, focusing on comparative expression levels across various cancer types, mutation rate analysis, and multiple survival metrics, including OS, DSS, PFS, and DFS, to gain a deeper understanding of its characteristics.
As illustrated in Figure 5A,B, The expression level of IGFBP2 in numerous tumor samples is significantly downregulated, aligning with the findings of our study analysis (Table 2). This evidence further underscores the overall importance of our results.
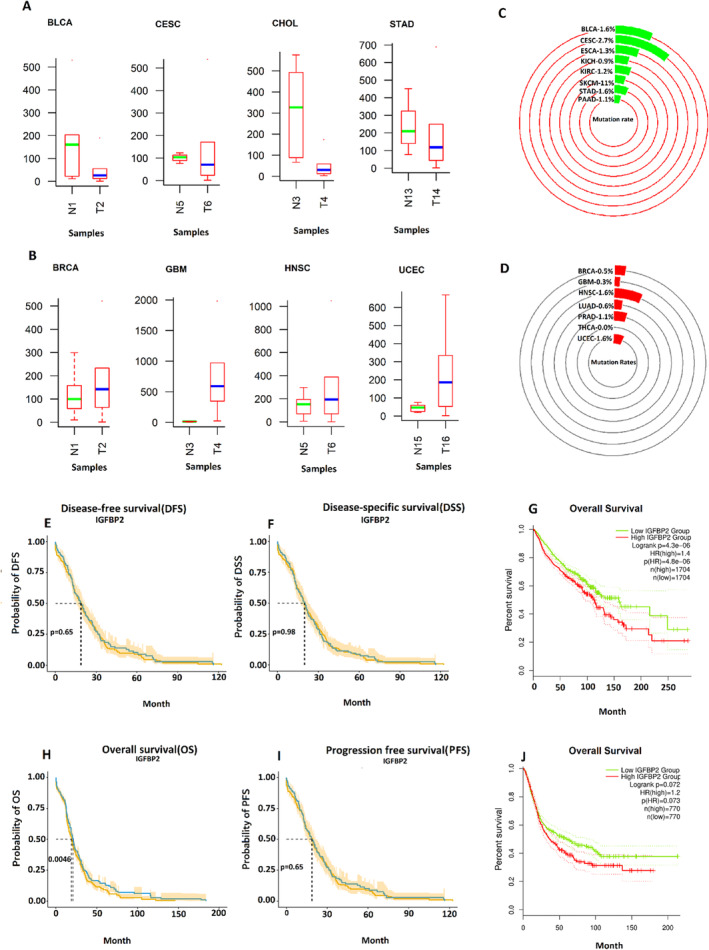
The percentage of mutations in GC samples, including amplification, severe depletion, mRNA upregulation, and various mutations, was assessed using OncoPrint to ascertain whether the conflicting trend of this gene is associated with its mutation rate. In this context, the mutation rate of this gene was initially evaluated across all cancers exhibiting downregulation of this gene, including BLCA (1.6%) and CESC (2.7%), ESCA (1.3%), KICH (0.9%), KIRC (1.2%), SKCM (1%), STAD (1.6%), and PAAD (1.1%) (Figure 5C). Then, the same mutational analysis was performed for cancer types exhibiting upregulation of IGFBP2, including BRCA (0.5%), GBM (0.3%), HNSC (1.6%), LUAD (0.6%), PRAD (1.1%), THCA (0%), and UCEC (1.6%) (Figure 5D). In both cases, it was unexpectedly discovered that IGFBP2 displayed a mutation rate that was nearly identical with a minimal percentage of mutation in different types of cancers.
The findings illustrated in Figure 5G,H,J indicate that the outcome of the OS analysis, considering both the downregulation and upregulation of IGFBP2, reveals that downregulation of this gene is associated with more prolonged survival in GC patients. Similarly, as indicated in Figure 5E,F,I, the prognostic impact of IGFBP2 on DSS, DFS, and PFS shows that the downregulation of this gene is associated with prolonged survival.
The comparative analysis of gene expression alongside survival outcomes may validate the contradictory function of IGFBP2 in GC and other malignancies.
Functional and Pathway Enrichment Analysis
A noteworthy finding from the correlation analysis was the negative correlation of IGFBP2 with both hubs and nonhubs. To gain a deeper understanding of the relationship between these two groups and IGFBP2, a pathway analysis was conducted to identify the biological processes and signaling pathways in which IGFBP2 participates, apart from its association with hubs and nonhubs. The outcomes of the signaling pathway analysis indicated that multiple signaling pathways were significantly enriched, demonstrating the co‐presence of these groups in relation to IGFBP2, with correlations that were either positive or negative, as detailed in Table S3.
According to the results of both correlation and pathway analysis, as shown in Table 3, The main hubs (MMP2, COL1A1, FN1) and nonhubs (PAPPA, TGM2, TGFB1, IGF1) jointly cooperate in vital biological pathways including regulation of transport and uptake of insulin‐like growth factor (IGF), Oncostatin M and TNF‐alpha effects on cytokine activity, cell motility, and apoptosis. Meanwhile, IGFBP2 is associated with both nonhubs and hubs, and it is found in the majority of pathways.
TABLE 3: Pathway analysis based on BioPlanet pathway maps.
| Series | Description | Adj‐p | Hubs | Nonhubs |
|---|---|---|---|---|
| 1 | Beta‐1 integrin cell surface interactions | 2.14E‐16 | COL1A1; COL3A1; COL5A1; COL4A1; COL5A2; FN1; ITGA5; THBS1; LAMA5 | TGM2 |
| 2 | Beta‐3 integrin cell surface interactions | 4.52E‐09 | COL1A1; COL4A1; FN1; THBS1 | THY1, TGFBI |
| 3 | NCAM1 interactions | 2.943e‐9 | COL1A1; COL3A1; COL1A2 | AGRN |
| 4 | Syndecan 1 pathway | 3.41E‐09 | COL1A1; COL3A1; COL1A2 | |
| 5 | Extracellular matrix organization | 9.41E‐14 | COL1A2; COL4A1; COL5A2; COL3A1; COL5A1; COL1A1; MMP2; SPARC; THBS1; FN1; ITGA5; MMP14 | NID2, PCOLCE |
| 6 | TGF‐beta regulation of extracellular matrix | 0.0234\3885 | COL1A1; FN1; TGFBI | NID2, AEBP1 |
| 7 | Alpha‐9 beta‐1 integrin pathway | 0.020489945 | FN1 | TGM2 |
| 8 | Interleukin‐4 signaling pathway | 2.89E‐04 | COL1A1; COL1A2 | THY1 |
| 9 | Integrin beta‐2 pathway | 0.025135122 | TGFBI | THY1 |
| 10 | Alpha‐M beta‐2 integrin signaling | 0.046128092 | MMP2 | THY1 |
| 11 | Signaling by PDGF | 0.042372297 | PDGFRB; COL1A1; COL3A1; COL1A2; COL4A2; COL5A1; COL4A1; PDGFD; COL5A2; COL6A3; THBS1 | THY1 |
| 12 | Oncostatin M | 0.002014676 | MMP2, COL1A1; FN1 | IGFBP2, TGM2 |
| 13 | Regulation of insulin‐like growth factor (IGF) transport and uptake by insulin‐like growth factor binding proteins (IGFBPs) | 0.020360665 | MMP2, FN1 | IGFBP2, PAPPA |
| 14 | Diabetes pathways | 0.025436156 | MMP2 | IGFBP2, PAPPA |
| 15 | Insulin‐like growth factor (IGF) activity regulation by insulin‐like growth factor binding proteins (IGFBPs) | 9.64E‐05 | MMP2 | IGFBP2, PAPPA, IGF1 |
Note: Significantly enriched pathway terms for hubs, nonhubs, and IGFBP2 are shown. The results of the presence of two nodes with IGFBP2 in the biological signaling pathways are consistent with the results of cluster analysis (Figure 3). As shown by the cluster analysis, IGFBP2 is clustered with PAPPA, MMP2, IGF1, TGM2, FN1, and COL1A1.
Discussion
In most biomarker‐based studies, hubs extracted from the PPIN are introduced as biomarkers and used in clinical trials following a series of statistically validated methodologies [ref. 1, ref. 37, ref. 38, ref. 39, ref. 40]. Surprisingly, the present investigation aimed to identify new biomarkers for GC by retrieving and clustering both hubs and nonhubs from the PPIN using stringent statistical techniques. The analysis revealed that specific subcluster hubs and nonhubs within each cluster exhibit interconnections regarding their prognostic and diagnostic capabilities in GC.
Given the implementation of previous scientific reports, the significant hub nodes within the PPIN, such as COL1A1, COL1A2, COL3A1, COL5A1, COL4A1, COL5A2, FN1, MMP2, ITGA2, SPARC, THBS1, and ITGA5, play a crucial role in promoting cell proliferation, resistance to chemotherapy, invasion, and migration of GC cells, as well as facilitating distant metastasis. These nodes warrant further statistical and experimental validation in the context of GC research [ref. 41, ref. 42, ref. 43, ref. 44, ref. 45, ref. 46].
However, considering the significant validation tests related to nonhubs (nodes with lower K, BC), including NID2, MXRA5, FKBP10, SULF1, THY1, AEBP1, TGM2, CDH17, CDH6, TGIF1, IGFBP2, and PAPPA, we hypothesize that these nodes can be associated with hubs and have the potential to be GC biomarkers.
An inconsistent trend of IGFBP2 was observed in both hubs and nonhubs. Therefore, various statistical validations were conducted to assess the specific potential of these two groups in relation to IGFBP2 and to determine whether the aforementioned elements are interconnected and possibly implicated in the GC signaling pathways.
Previous studies showed both types of nodes as validated biomarkers exhibiting upregulation in tumor conditions [ref. 47, ref. 48, ref. 49]. Overall, several nonhub proteins, including IGFBP2, PAPPA, CDH17, TGIF1, THY1, NID2, TGM2, and AEBP1, have been identified as oncogenic in specific stages of cancer [ref. 49, ref. 50, ref. 51]. Nevertheless, several contradictory studies (both in vitro and in vivo) suggested that these proteins may function as tumor suppressors [ref. 52, ref. 53, ref. 54]. Furthermore, several observations have illustrated the interaction between the identified nonhubs and hubs within our research [ref. 55, ref. 56, ref. 57].
Pearson’s correlation analysis was conducted to validate the significance of relationships between the expression level of hubs and nonhubs. While, all nonhubs showed a strong, significant positive correlation with the hubs, a significant negative correlation was observed between the expression level of IGFBP2 and both hubs and nonhubs (Table S3). Pearson’s correlation analysis conducted on TCGA data involving 293 patients with GC corroborated the findings of our study; however, the difference in IGFBP2 levels between the two groups of patients with GC was statistically insignificant. Given that IGFBP2 has not demonstrated a consistent trend in prior research or our current study, it was subjected to further examination through comparative analyses of various validation studies. The mutation frequency of this gene across multiple cancer types (1512 samples) revealed minimal variation in downregulated states (BLCA; 1.6%; KIRC; 1.2%; KICH; 0.9%; ESCA; 1.3%) and upregulated states (BRCA; 0.5%; GBM; 0.3%; PRAD; 1.1%; THCA; 0; LUAD; 0.6%). Consequently, it can be suggested that the fluctuating behavior of this gene in different cancers is not influenced by its mutation rate. As illustrated in Figure 5G,J, the low expression of this gene across assorted cancers, whether upregulated or downregulated, correlates with significantly longer survival. The alterations in the expression levels of this gene indicate an increase in various cancers such as BRCA, GBM, HNSC, LUAD, and UCEC, while a decrease is observed in other types, including BLCA, KIRC, KICH, and ESCA (Figure 5A,B). IGFBP2 is a member of a family comprising six insulin‐like growth factor binding proteins (IGFBPs). Current research indicates a varied expression pattern of this gene across different cancer types. For instance, studies have shown an upregulation of IGFBP2 in breast and cervical cancers [ref. 58, ref. 59, ref. 60], while downregulation has been noted in glioma, bladder cancer, and rhabdomyosarcoma (RMS) [ref. 61, ref. 62, ref. 63]. Consequently, it remains to be determined whether the overexpression or downregulation of this gene should be regarded as a potential biomarker. It raises the question of whether IGFBP2 functions as an oncogene or a tumor suppressor in cases of upregulation versus downregulation.
Considering the contradictory results, the multiple validation tests for IGFBP2, and the lack of a consistent trend, it seems that the best way to determine the exact role of this gene is to evaluate the interaction of this gene with hubs and nonhubs in the PPIN.
A selection of clustered genes suitable for investigation includes nonhub genes, such as PAPPA and IGF1, and hub genes, including MMP2, COL1A1, and FN1. Upon examining the interrelations among these genes, it became evident that they play a significant role in the regulation of IGF, as well as in the transport and uptake facilitated by IGFBPs and the regulation of IGFBP. Moreover, the activity of IGF acivity is regulated via the IGFBPs pathway.
Therefore, to clarify the function of this gene alongside its neighboring genes, a closer look at the IGF pathway should be taken. In addition to IGF‐I, IGF‐II, and IGFBP2, their receptors (IGF‐IRs) are components of the IGF pathway. Less is known about this pathway to date; however, the presence, interaction, and potency of IGFBPs with this pathway and both PAPPA and MMP2 could shed light on the complex role of this pathway in cancers [ref. 64, ref. 65, ref. 66, ref. 67]. PAPPA (nonhub) and MMP2 (hub) have been introduced as cancer biomarkers.
Since high levels of IGFBPs can inhibit IGF‐stimulated functions by blocking binding to its receptors, the proteolysis of IGFBP2 is a pivotal mechanism in regulating and enhancing the carcinogenic effects of IGF‐signal transmission. A number of studies reported that PAPPA and MMP2 act as IGFBP2 proteinases, leading to cleavage of the IGF1/IGFBP2 complex. The breakdown of this system leads to the release of IGF1 from the complex, and this process (accumulation of IGF1) can facilitate cell migration toward the tumor [ref. 68, ref. 69].
Given the role of IGFBP2 in the IGF system, it can be assumed that upregulation of this gene with blockade of the IGF pathway reduces the effect of tumorigenesis. On the other hand, the upregulation of PAPPA and MMP2 contributes to an increase in the accumulation of IGFBP2 in the cell through proteolysis of the IGF1/IGFBP2 complex, which in turn is involved in the stimulation of tumorigenesis by the IGF pathway. However, to justify the downregulation of this gene in our study and the TCG data, it can be proposed that the IGF pathway for the survival of its topicality also induces the expression of the hypoxia‐inducible factor 1 (HIF‐1), which can significantly reduce the expression of IGFBP2 [ref. 70, ref. 71, ref. 72, ref. 73, ref. 74].
From all the above interpretations, it can be concluded that the activity of IGFBP2 is dependent on the IGF pathway. Hence, upregulating the gene by blocking the IGF complex favors tumor suppression and is also a sign of activity accelerating proteolysis of two proteinase genes (PAPPA and MMP2). On the other hand, the downregulation of this gene may also be a biomarker of cancer recurrence since, in the absence of this gene, the IGF pathway will play a crucial role in tumorigenesis.
Given the statistically significant validation of nonhubs and hubs, it can be speculated that nonhubs and hubs have the potential to become GC biomarkers for the following reasons:
In light of the compelling evidence regarding IGFBP2 from both previous and current studies, we propose that IGFBP2, previously regarded as a dark horse, is influenced by the expression changes of nonhub genes (PAPPA, IGF1) and hub genes (COL1A1, FN1, MMP2) in GC. Significant downregulation and upregulation of this nonhub gene play a crucial role in tumorigenesis and tumor suppression. Alongside its neighboring genes within biological networks and signaling pathways, IGFBP2 plays a vital role in establishing a comprehensive signature throughout various stages of GC [ref. 75, ref. 76, ref. 77, ref. 78, ref. 79].
Conclusion
In summary, when presenting all the cumulative results of the study and considering the association of the IGFBP2 gene with hub and nonhub, it is essential to recognize that the designation of a gene as a biomarker is significantly influenced by its role within biological systems and gene networks. Specifically, nonhub genes within the PPIN exhibit lower K and BC values. However, it can be assumed that these elements appear to exert their effect on disease progression or suppression across the hubs. Therefore, additional computational, predictive modeling, and clinical research are required to determine which group, either hubs or nonhubs, exerts the most significant influence on the others and to assess the potential of nonhubs to serve as biomarkers. Undoubtedly, the advent of big data and machine learning present opportunities for understanding the interactions between hubs and nonhubs in tracking GC states, potentially leading to innovative solutions. Given that all selected datasets pertain to East Asia, we intend to investigate the relationship of this gene with its neighboring genes in the PPIN across various global populations. Furthermore, incorporating diverse variables such as age, gender, and climate into the DGE analysis enhances the precision of the research.
Author Contributions
Akram Siavoshi: conceptualization, data curation, formal analysis, methodology, investigation, visualization, writing – original draft, writing – review and editing. Mehran Piran: data curation, formal analysis, software, methodology, investigation, validation, visualization. Ali Sharifi‐Zarchi: conceptualization, data curation, methodology, investigation, formal analysis, writing – review and editing. Fatemeh Ataellahi: writing – review and editing, methodology.
Ethics Statement
The authors have nothing to report.
Consent
The authors have nothing to report.
Conflicts of Interest
The authors declare no conflicts of interest.
Supplementary Materials
References
- Increased Healthcare Costs by Later Stage Cancer Diagnosis,”. BMC Health Services Research, 2022. [DOI | PubMed]
- Does Delaying Time in Cancer Treatment Affect Mortality? A Retrospective Cohort Study of Korean Lung and Gastric Cancer Patients,”. International Journal of Environmental Research and Public Health, 2021. [DOI | PubMed]
- Mortality due to Cancer Treatment Delay: Systematic Review and Meta‐Analysis,”. British Medical Journal, 2020. [DOI]
- The Current and Future Incidence and Mortality of Gastric Cancer in 185 Countries, 2020–40: A Population‐Based Modelling Study,”. EClinicalMedicine, 2022. [DOI]
- Biomarkers of Gastric Cancer: Current Topics and Future Perspective,”. World Journal of Gastroenterology, 2018. [DOI | PubMed]
- Predictive Biomarkers in Gastric Cancer,”. Journal of Cancer Research and Clinical Oncology, 2023. [DOI | PubMed]
- RNA Sequencing: New Technologies and Applications in Cancer Research,”. Journal of Hematology and Oncology, 2020. [DOI | PubMed]
- Identifying Key Stage‐Specific Genes and Transcription Factors for Gastric Cancer Based on RNA‐Sequencing Data,”. Medicine, 2017. [DOI | PubMed]
- Identification of Protein Complexes From Multi‐Relationship Protein Interaction Networks,”. Human Genomics, 2016. [DOI | PubMed]
- Gene Expression Profiles and Pathway Enrichment Analysis to Identification of Differentially Expressed Gene and Signaling Pathways in Epithelial Ovarian Cancer Based on High‐Throughput RNA‐Seq Data,”. Genomics, 2022. [DOI | PubMed]
- Protein‐Protein Interactions Essentials: Key Concepts to Building and Analyzing Interactome Networks,”. PLoS Computational Biology, 2010. [DOI | PubMed]
- Essentiality and Centrality in Protein Interaction Networks Revisited,”. BMC Bioinformatics, 2015. [DOI | PubMed]
- Protein–Protein Interaction Networks: How Can a Hub Protein Bind So Many Different Partners?,”. Trends in Biochemical Sciences, 2009. [DOI | PubMed]
- How to Find Non‐Hub Important Nodes in Protein Networks?,”. Biophysical Journal, 2012. [DOI]
- “Novel Hub Protein Classification and Interaction Rules in Protein–Protein Interaction Network in Saccharomyces cerevisiae ,” (2011),. [DOI]
- Evolutionary Constraints on Hub and Non‐hub Proteins in Human Protein Interaction Network: Insight From Protein Connectivity and Intrinsic Disorder,”. Gene, 2009. [DOI | PubMed]
- Dynamic Modular Architecture of Protein‐Protein Interaction Networks Beyond the Dichotomy of ‘Date’ and ‘Party’ Hubs,”. Scientific Reports, 2013. [DOI | PubMed]
- “Exploring Centrality‐Lethality Rule From Evolution Constraint on Essential Hub and Nonessential Hub in Yeast Protein‐Protein Interaction Network,” (2011),. [DOI]
- Identification of Novel Hub Genes Associated With Gastric Cancer Using Integrated Bioinformatics Analysis,”. BMC Cancer, 2021. [DOI | PubMed]
- Identification of Hub Genes in Gastric Cancer by Integrated Bioinformatics Analysis. Translational,”. Cancer Research, 2021. [DOI]
- Bioinformatic Analysis of Potential Hub Genes in Gastric Adenocarcinoma,”. Science Progress, 2021. [DOI | PubMed]
- Biomarker Detection and Categorization in Ribonucleic Acid Sequencing Meta‐Analysis Using Bayesian Hierarchical Models,”. Applied Statistics, 2017. [DOI | PubMed]
- “FastQC: A Quality Control Tool for High Throughput Sequence Data. v. 0.11.5,” (2010),
- Trimmomatic: A Flexible Trimmer for Illumina Sequence Data,”. Bioinformatics, 2014. [DOI | PubMed]
- Salmon Provides Fast and Bias‐Aware Quantification of Transcript Expression,”. Nature Methods, 2017. [DOI | PubMed]
- Software for Computing and Annotating Genomic Ranges,”. PLoS Computational Biology, 2013. [DOI | PubMed]
- The sva Package for Removing Batch Effects and Other Unwanted Variation in High‐Throughput Experiments,”. Bioinformatics, 2019. [DOI]
- Moderated Estimation of Fold Change and Dispersion for RNA‐Seq Data With DESeq2,”. Genome Biology, 2014. [DOI | PubMed]
- Limma Powers Diferential Expression Analyses for RNA‐Sequencing and Microarray Studies,”. Nucleic Acids Research, 2015. [DOI | PubMed]
- The Igraph Software Package for Complex Network Research,”. International Journal of Complex Systems, 2006
- WGCNA: An R Package for Weighted Correlation Network Analysis,”. BMC Bioinformatics, 2008. [DOI | PubMed]
- Dijkstra’s Algorithm Revisited: The Dynamic Programming Connexion,”. Control and Cybernetics, 2006
- Systems Pharmacology of Arrhythmias,”. Science Signaling, 2010. [DOI | PubMed]
- Systems Biomedicine of Colorectal Cancer Reveals Potential Targets for CRC Treatment,”. Frontiers in Oncology, 2021. [DOI]
- STRING v9.1: Protein–Protein Interaction Networks, With Increased Coverage and Integration,”. Nucleic Acids Research, 2013. [DOI | PubMed]
- The cBio Cancer Genomics Portal: An Open Platform for Exploring Multidimensional Cancer Genomics Data,”. Cancer Discovery, 2012. [DOI | PubMed]
- Why Do Hubs Tend to Be Essential in Protein Networks?,”. PLoS Genetics, 2006. [DOI | PubMed]
- Comparative Genomics of Centrality and Essentiality in Three Eukaryotic Protein‐Interaction Networks,”. Molecular Biology and Evolution, 2005. [PubMed]
- Lethality and Centrality in Protein Networks,”. Nature, 2001. [PubMed]
- “Comparative Analysis of Pure Hubs and Pure Bottlenecks in Human Protein–Protein Interaction Networks,” (2021),. [DOI]
- Identifying the Hub Gene in Gastric Cancer by Bioinformatics Analysis and In Vitro Experiments,”. Cell Cycle, 2020. [DOI | PubMed]
- Bioinformatics Analysis of Hub Genes and Potential Therapeutic Agents Associated With Gastric Cancer,”. Cancer Management and Research, 2021. [PubMed]
- Identification of Potential Core Genes in Gastric Cancer Using Bioinformatics Analysis,”. Journal of Gastrointestinal Oncology, 2021. [DOI | PubMed]
- Identification and Validation of Key Genes Associated With Pathogenesis and Prognosis of Gastric Cancer,”. PeerJ, 2023. [DOI]
- Identification of Significant Genes Associated With Prognosis of Gastric Cancer by Bioinformatics Analysis,”. Journal of the Egyptian National Cancer Institute, 2022. [DOI | PubMed]
- SPARC Is Associated With Gastric Cancer Progression and Poor Survival of Patients,”. Clinical Cancer Research, 2010. [DOI | PubMed]
- Thy‐1 (CD90) Signaling Preferentially Promotes RORγt Expression and a Th17 Response,”. Frontiers in Cell and Developmental Biology, 2018. [DOI | PubMed]
- AEBP1 Down Regulation Induced Cell Death Pathway Depends on PTEN Status of Glioma Cells,”. Scientific Reports, 2019. [DOI | PubMed]
- CDH17 Is a More Sensitive Marker for Gastric Adenocarcinoma Than CK20 and CDX2,”. Archives of Pathology and Laboratory Medicine, 2017. [DOI | PubMed]
- Multiple Roles of THY1 in Gastric Cancer Based on Data Mining,”. Translational Cancer Research, 2020. [DOI | PubMed]
- IGF Binding Proteins in Cancer: Mechanistic and Clinical Insights,”. Nature Reviews Cancer, 2014. [DOI | PubMed]
- TGIF1 Knockdown Inhibits the Proliferation and Invasion of Gastric Cancer via AKT Signaling Pathway,”. Cancer Management and Research, 2021. [DOI | PubMed]
- Localization of CD44 and CD90 Positive Cells to the Invasive Front of Breast Tumors,”. Cytometry Part B–Clinical Cytometry, 2010. [DOI | PubMed]
- CD90/Thy1 Is Preferentially Expressed on Blast Cells of High Risk Acute Myeloid Leukemias,”. British Journal of Hematology, 2004. [DOI]
- NID2 Can Serve as a Potential Prognosis Prediction Biomarker and Promotes the Invasion and Migration of Gastric Cancer,”. Pathology Research and Practice, 2019. [DOI | PubMed]
- Bladder Cancer Stage‐Associated Hub Genes Revealed by WGCNA Co‐Expression Network Analysis,”. Hereditas, 2019. [DOI | PubMed]
- IGFBP2 Regulates PD‐L1 Expression by Activating the EGFR‐STAT3 Signaling Pathway in Malignant Melanoma,”. Cancer Letters, 2020. [DOI | PubMed]
- IGFBP2 Induces SPRY1 Expression via NF‐κB Signaling Pathway in Glioblastoma Multiforme (GBM),”. European Review for Medical and Pharmacological Sciences, 2017. [DOI | PubMed]
- Insulin‐Like Growth Factor Binding Protein‐2 Level Is Increased in Blood of Lung Cancer Patients and Associated With Poor Survival,”. PLoS One, 2013. [DOI | PubMed]
- IGF‐II and IGFBP‐2 Differentially Regulate PTEN in Human Breast Cancer Cells,”. Oncogene, 2007. [DOI | PubMed]
- IGFBP‐2 in Cervical Cancer Development,”. Experimental and Molecular Pathology, 2020. [DOI | PubMed]
- IQGAP1 and IGFBP2: Valuable Biomarkers for Determining Prognosis in Glioma Patients,”. Journal of Neuropathology and Experimental Neurology, 2007. [DOI | PubMed]
- IGFBP‐2 Acts as a Tumor Suppressor and Plays a Role in Determining Chemosensitivity in Bladder Cancer Cells,”. Oncotarget, 2019. [DOI | PubMed]
- Downregulation of IGFBP2 Is Associated With Resistance to IGF1R Therapy in Rhabdomyosarcoma,”. Oncogene, 2014. [DOI | PubMed]
- IGFBP‐2: The Dark Horse in Metabolism and Cancer,”. Cytokine and Growth Factor Reviews, 2015. [DOI | PubMed]
- Pregnancy‐Associated Plasma Protein a in Cancer: Expression, Oncogenic Functions and Regulation,”. American Journal of Cancer Research, 2018. [PubMed]
- Insulin‐Like Growth Factor‐1 Receptor (IGF‐1R) Expression on Circulating Tumor Cells (CTCs) and Metastatic Breast Cancer Outcome: Results From the TransMYME Trial,”. Breast Cancer Research and Treatment, 2020. [DOI | PubMed]
- Insulin‐Like Growth Factor Binding Protein 2 Enhances Glioblastoma Invasion by Activating Invasion‐Enhancing,”. Cancer Research, 2003. [PubMed]
- Matrix Metalloproteinase‐1 Facilitates MSC Migration via Cleavage of IGF‐2/IGFBP2 Complex,”. FEBS Open Bio, 2017. [DOI]
- Insulin‐Like Growth Factor System in Cancer: Novel Targeted Therapies,”. BioMed Research International, 2015. [DOI | PubMed]
- The Matrix Metalloproteinase and Insulin‐Like Growth Factor System in Oral Cancer—A Prospective Clinical Study,”. OncoTargets and Therapy, 2017. [DOI | PubMed]
- Co‐Targeting the IGF System and HIF‐1 Inhibits Migration and Invasion by (Triple‐Negative) Breast Cancer Cells,”. British Journal of Cancer, 2014. [DOI | PubMed]
- Reciprocal Positive Regulation of Hypoxia‐Inducible Factor 1α and Insulin‐Like Growth Factor 2,”. Cancer Research, 1999. [PubMed]
- Bimolecular Interaction of Insulin‐Like Growth Factor (IGF) Binding Protein‐2 With αvβ3 Negatively Modulates IGF‐I‐Mediated Migration and Tumor Growth 1,”. Cancer Research, 2004. [DOI | PubMed]
- The Direct Binding of Insulin‐Like Growth Factor‐1 (IGF‐1) to Integrin αvβ3 Is Involved in IGF‐1 Signaling,”. Journal of Biological Chemistry, 2009. [DOI | PubMed]
- IGFBP2: Integrative Hub of Developmental and Oncogenic Signaling Network,”. Oncogene, 2020. [DOI | PubMed]
- Non‐Invasive IGFBP1, IGFBP2 Biomarkers as Predictors and Outcomes of Usual Interstitial Pneumonia (UIP) Therapeutic Response,”. Egyptian Journal of Bronchology, 2021. [DOI]
- Prognostic Value of IGFBP2 in Various Cancers: A Systematic Review and Meta‐Analysis,”. Cancer Medicine, 2022. [DOI | PubMed]
- IGFBP2 in Cancer: Pathological Role and Clinical Significance,”. Oncology Reports, 2020. [PubMed]