Structure–Tissue Exposure/Selectivity Relationship (STR) on Carbamates of Cannabidiol
Abstract
The structure–tissue exposure/selectivity relationship (STR) aids in lead optimization to improve drug candidate selection and balance clinical dose, efficacy, and toxicity. In this work, butyrocholinesterase (BuChE)-targeted cannabidiol (CBD) carbamates were used to study the STR in correlation with observed efficacy/toxicity. CBD carbamates with similar structures and same molecular target showed similar/different pharmacokinetics. L2 and L4 had almost same plasma exposure, which was not correlated with their exposure in the brain, while tissue exposure/selectivity was correlated with efficacy/safety. Structural modifications of CBD carbamates not only changed drug plasma exposure, but also altered drug tissue exposure/selectivity. The secondary amine of carbamate can be metabolized into CBD, while the tertiary amine is more stable. Absorption, distribution, metabolism, excretion, and toxicity (ADMET) parameters can be used to predict STR. Therefore, STR can alter drug tissue exposure/selectivity in normal tissues, impacting efficacy/toxicity. The drug optimization process should balance the structure–activity relationship (SAR) and STR of drug candidates for improving clinical trials.
Article type: Research Article
Keywords: structure–activity relationship (SAR), structure–tissue exposure/selectivity relationship (STR), drug development and optimization, cannabidiol, carbamate, butyrocholinesterase
License: © 2024 by the authors. CC BY 4.0 Licensee MDPI, Basel, Switzerland. This article is an open access article distributed under the terms and conditions of the Creative Commons Attribution (CC BY) license (https://creativecommons.org/licenses/by/4.0/).
Article links: DOI: 10.3390/ijms252211888 | PubMed: 39595958 | PMC: PMC11593952
Relevance: Relevant: mentioned in keywords or abstract
Full text: PDF (1.7 MB)
1. Introduction
At the final stage in drug discovery, the main goal of lead optimization is to attain a drug candidate that achieves a concentration–time profile in the body that is adequate for the desired efficacy and safety profile [ref. 1,ref. 2]. During lead optimization, structural modification not only changes pharmacokinetic properties in plasma, but also alters drug exposure/selectivity in disease-targeted tissues/normal tissue [ref. 3,ref. 4]. Despite great efforts to achieve lead optimization, the failure rate of drug development remains very high (~90%) [ref. 5,ref. 6]. However, overemphasis on drug exposure in plasma and overlooking drug distribution in disease-targeted tissue/normal tissues may mislead the selection of drug candidates for clinical trials [ref. 6,ref. 7,ref. 8,ref. 9,ref. 10].
The drug discovery process is long, complex, and expensive; thus, lead optimization can improve drug potency/specificity through the structure–activity relationship (SAR) and drug-like properties [ref. 4,ref. 11]. However, current lead optimization overly emphasizes potency/specificity using SAR but overlooks tissue exposure/selectivity in disease/normal tissues using the structure–tissue exposure/selectivity relationship (STR), which may mislead drug candidate selection and impact the balance of clinical dose/efficacy/toxicity. An STR study of selective estrogen receptor modulators suggested that STR alters drug tissue exposure/selectivity in disease-targeted tissues vs. normal tissues, impacting clinical efficacy/toxicity [ref. 12]. Lead optimization needs to balance the SAR and STR in selecting drug candidates for clinical trials to improve the success of drug development.
Carbamate can be hydrolyzed by AChE/BuChE in the blood to significantly affect oral bioavailability, but how does the substituent of carbamate influence pharmacokinetic and pharmacodynamic characteristics [ref. 11,ref. 12,ref. 13]? Rivastigmine, a pseudo-irreversible carbamate inhibitor, is a well-tolerated and effective treatment for Alzheimer’s disease (AD) [ref. 14,ref. 15]; however, the first-pass metabolism leads to its short plasma elimination half-life (1.5 h) and low bioavailability (36–40%), which is relative to cholinergic side effects like dyspepsia, anorexia, nausea, vomiting, and severe bradycardia [ref. 16,ref. 17]. The first-pass metabolism of physostigmine led to very low bioavailability (only 2%), and drug concentrations after oral administration were 200 times less in plasma and 350 times less in brains than after intramuscular administration [ref. 18,ref. 19]. Hence, the modification of carbamates for drug brain delivery can be conducted to improve the bioavailability of carbamate inhibitors [ref. 20,ref. 21,ref. 22,ref. 23].
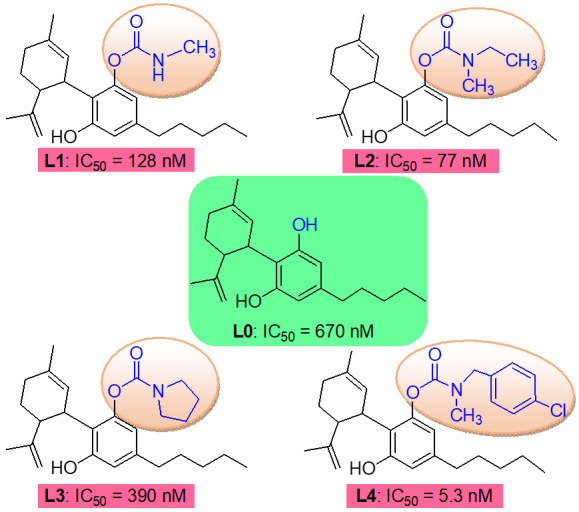
Cannabidiol (CBD) is one of active constituents in Cannabis sativa plant and approved as a drug for seizure disorder [ref. 24,ref. 25]. Recently, CBD carbamates were designed to discover potent selective BuChE inhibitors, and an SAR study showed that the amine group of carbamates can regulate the selectivity and potential to ChE by molecular interactions with the active site of ChE [ref. 26,ref. 27]. The carbamate of CBD affected the selectivity and potency on BuChE inhibitory activity; for example, L2 with methylethylamine showed similar ChE inhibitory activity to rivastigmine (IC50 values of AChE and BuChE of 14.95 and 0.077 μM, and 16.35 and 0.058 μM for L2 and rivastigmine); L1 and L2 with aliphatic amine exhibited better BuChE inhibition than L3 with cyclic amine; L4 with tert-benzylamine showed the most potent BuChE-inhibitory activity (Figure 1). Therefore, it is significant to study the pharmacokinetics of CBD carbamates to guide structural modification and supply preclinical pharmacokinetic data.
Cholinergic side effects limit the clinical applications of pseudo-irreversible inhibitors [ref. 28,ref. 29]. In this study, a rapid and simultaneous ultra-performance liquid chromatography–high resolution mass spectrometer (UPLC-HRMS) method for determination of CBD (L0) and its carbamates (L1–L4) was established to investigate the comparative pharmacokinetics of L0–L4. The brain is the target tissue of BuChE inhibitors. STR can alter drug candidate’s tissue exposure/selectivity in normal organs, impacting efficacy/toxicity [ref. 30]. Comprehensive data on CBD carbamates can be used to carry out STR analysis. In addition, this study may contribute to the development of the longer-acting and selective candidates of pseudo-irreversible inhibitors with anti-AD. It is significant to know about how the SAR and STR of CBD carbamates affect pharmacokinetic and pharmacodynamic characteristics.
2. Results and Discussion
2.1. Drug Exposure in Tissue but Not in Plasma Was Associated with Efficacy/Toxicity
2.1.1. No Correlation Between Drug Exposure in Plasma and in Disease-Targeted Tissues
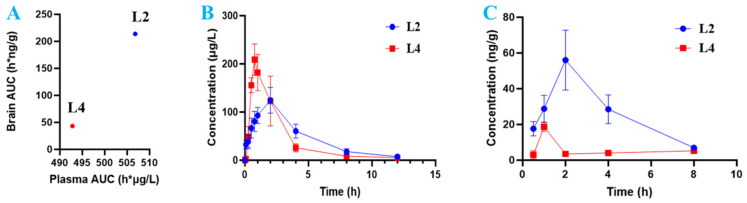
In the drug candidate development process, drug exposure in plasma (concentration of the drug in plasma and the area under the curve, AUC) is often recognized as an evaluation of drug exposure in the disease-targeted tissue (such as brain). Drug candidates with high exposure in the plasma are often chosen for future drug-like studies [ref. 31]. To investigate how drug exposure in plasma correlates with drug exposure in disease-targeted tissues, combined with the inhibitory activities against eqBuChE and plasma exposure from AUCplasma, L2 and L4, which shown better potent BuChE inhibitory activity and plasma exposure, were chosen for further invivo evaluation. We determined the drug concentration in plasma and target tissue (brain), and calculated the AUC after oral administration of L2 and L4 in rats (Figure 2A). Plasma AUC values of L2 and L4 were not correlated with AUCs in the brain tissue, as presented in Figure 2B,C. One interesting scenario was observed: similar drug plasma concentrations did not predict drug brain concentration. L2 and L4 had similar drug plasma concentration, whereas the brain concentration of L2 was fivefold higher than that of L4.
For drug candidates targeting the central nerve system (CNS), drug exposure in brain tissue has been used for drug candidate selection in AD, Parkinson’s disease, and other CNS-related diseases [ref. 7,ref. 32,ref. 33]. Drug level in the brain or in cerebrospinal fluid (CSF) have been measured and considered as a selection criterion during CNS drug optimization [ref. 34,ref. 35]. Any drug candidate with no ability to reach the brain is terminated for further development [ref. 4,ref. 30]. Therefore, CNS drug optimization should adapt a criterion to ensure drug exposure in brain organ vs. normal organ [ref. 7].
2.1.2. Structural Correlation of Drug Exposure with Drug Efficacy/Safety
To further study whether CBD drug exposure in the brain was better than plasma exposure, so as to correlate with drug efficacy/safety, we compared two CBD carbamates (L2 and L4) with similar drug plasma exposure and evident efficacy/toxicity profiles. As shown in Table 1, L2 with methylethylamine showed similar AChE inhibitory activity to rivastigmine; L1 and L2 with aliphatic amine exhibited better BuChE inhibition than L3 with cyclic amine; L4 with tert-benzylamine showed the most potent BuChE-inhibitory activity. L2 and L4 exposure in the plasma was >3-fold higher than CBD, L1, and L3. Interestingly, CBD, L1, and L3 have close BuChE inhibition. Although L2 and L4 had similar drug exposure in the plasma, L2 exposure in the brain was fivefold higher than L4, whereas BuChE inhibition of L4 was more potent than that of L2.
Table 1: Plasma AUC (ng·h/mL) after oral administration on rats and inhibitory activities against eeAChE and eqBuChE of CBD and L1–L4 (Ref. [ref. 27]) a.
| Compound | AUCplasma (ng·h/mL) | IC50, µM (or Inhibition Rate % at 20 µM) | |
|---|---|---|---|
| AChE b | BuChE c | ||
| CBD | 157.5 | 17.07 ± 2.43 | 0.67 ± 0.06 |
| L1 | 191.2 | 18.88 ± 1.11 | 0.128 ± 0.022 |
| L2 | 561.4 | 14.95 ± 1.02 | 0.077 ± 0.005 |
| L3 | 182.1 | na d | 0.39 ± 0.04 |
| L4 | 521.6 | 21.4 ± 2.8% | 0.0053 ± 0.0012 |
| rivastigmine | 16.35 ± 1.54 | 0.058 ± 0.013 | |
a Each IC50 value is the mean ± SEM from at least three independent experiments; thereinto, ChE inhibitors inhibit the activity of the enzymes AChE and BuChE, which catalyze the degradation/hydrolysis of the neurotransmitter acetylcholine (ACh); b eeAChE from electric eel; c eqBuChE from horse serum; d na: no activity.
ADMET analysis showed that compared to the rat acute oral toxicity (LD50) of CBD (319.5 mg/kg), LD50 values of L2–L4 decreased to 70.5, 80.0, and 84.0 mg/kg, while that of L1 significantly decreased to 22.1 mg/kg. Obviously, L2 and L4 had better safety profiles, but the secondary amine of carbamate (L1) increased oral toxicity, indicating that the amine group of carbamate affected its exposure in the plasma, which may be associated with drug efficacy/safety.
2.1.3. Relationship of Drug Exposure in Tissue and Plasma
Drug exposure in tissue is calculated by drug exposure in the plasma and tissue/plasma distribution coefficient (Kp), as shown in Equation (1):
Kp
where drug exposure in the plasma and the tissue can be calculated by the drug concentration vs. time curve, and Kp values can be calculated by Ctissue/Cplasma or AUCtissue/AUCplasma [ref. 36]. Based on the inhibitory activities against eqBuChE and plasma exposure from AUCplasma, L2 and L4 were chosen for further invivo evaluation. As shown in Table 2, Kp values (AUCtissue/AUCplasma ratio) of L2 and L4 in tissues showed significant difference although they had similar plasma AUCs. Hence, it was unreasonable to use drug exposure in the plasma to substitute for drug exposure in the disease-targeted tissue due to neglect of the differences of Kp values in various tissues for drug candidates. It is worth mentioning that Kp can be evaluated by the ratio of free fraction of drug candidate in plasma vs. in tissues in steady state. Nevertheless, this assessment is based on “free drug hypothesis” theory, which presumes that free drug concentration in tissue is close to that in plasma [ref. 37].
Table 2: Plasma and tissue AUC (ng·h/mL or ng·h/g) after oral administration of L2 and L4 in rats and Kp values were calculated by AUCtissue/AUCplasma.
| Parameter | L2 | L4 |
|---|---|---|
| AUCplasma | 506.8 | 492.8 |
| AUCbrain | 213.8 | 43.2 |
| AUCheart | 1331.9 | 7431.3 |
| AUCliver | 2684.5 | 4951.2 |
| AUCspleen | 1220.9 | 5773.9 |
| AUClung | 1655.0 | 7421.8 |
| AUCkidney | 2790.2 | 7723.4 |
| Kp brain | 0.42 | 0.088 |
| Kp heart | 2.63 | 15.08 |
| Kp liver | 5.30 | 10.05 |
| Kp spleen | 2.41 | 11.72 |
| Kp lung | 3.27 | 15.06 |
| Kp kidney | 5.51 | 15.67 |
In the BuChE-targeted drug optimization process, an ideal drug candidate not only has high specificity and potency against BuChE targets with low Ki (or low IC50), but also has high tissue exposure/selectivity in the brain to exert efficacy, and low tissue exposure/selectivity in other tissues to reduce toxicity [ref. 4,ref. 30].
In this study, drug candidates L2 and L4 with high plasma exposure were selected for further exposure/selectivity studies; however, if low tissue exposure with low tissue toxicity has a high maximum tolerated dose (MTD), a high dose is often required to achieve efficacy in clinical trials. Although L2 and L4 had similar exposure in plasma, both exposure and selectivity in the tissues had very different associations with their clinical efficacy/toxicity profiles (Figure 1 and Figure 2 and Table 3). Therefore, due to the lack of drug exposure/selectivity in the brain, the high CNS drug exposure/selectivity in healthy vital organs may lead to unmanageable toxicity in clinical studies [ref. 4].
Table 3: Physicochemical properties of CBD carbamates with similar structures. The data come from Mat-ADMET.
| Name | CBD | L1 | L2 | L3 | L4 |
|---|---|---|---|---|---|
| MW | 314.47 | 371.53 | 399.58 | 411.59 | 496.09 |
| TPSA | 40.46 | 58.56 | 49.77 | 49.77 | 49.77 |
| LogP | 6.455 | 5.887 | 6.710 | 6.913 | 8.053 |
| LogD | 4.792 | 4.111 | 4.181 | 4.076 | 4.817 |
| LogS | −4.654 | −4.300 | −3.840 | −4.061 | −5.751 |
| Solubility | 0.010 | 0.014 | 0.021 | 0.017 | 0.003 |
| BBB penetration | 0.915 | 0.804 | 0.957 | 0.921 | 0.902 |
| t1/2 (hours) | 8.091 | 6.094 | 6.015 | 8.595 | 8.273 |
| Pgp inhibitor | 0.128 | 0.878 | 0.102 | 0.994 | 1.000 |
| Rat acute oral toxicity (LD50) | 319.474 | 22.061 | 70.497 | 80.045 | 84.020 |
2.2. Drug Tissue Selectivity May Impact the Balance of Efficacy/Toxicity, Which Is Often Overlooked in the Drug Optimization Process
Dose escalation tests are always evaluated during clinical phase I/II trials, and MTD is constantly associated with drug exposure in certain toxicity-related organs [ref. 38]. Dose escalation results in sufficient drug exposure in disease-targeted tissues, whereas the probability of adverse effects for drug exposure in blood cells or vital organs also increases. To evaluate the balance between efficacy and toxicity for drug candidates, drug tissue selectivity is a crucial parameter and defined as follows in Equation (2), where the sum of Ctissue or AUCtissue is total drug concentration or AUC in different tissues.
CtissueCtissuetissuetissue
A perfect CNS drug candidate is supposed to exhibit high tissue selectivity and exposure in the brain for better therapeutic efficacy, and low tissue selectivity and exposure in other vital organs to reduce toxicity in the meantime. On the contrary, if a CNS drug candidate has low selectivity and low exposure in the brain but high selectivity/exposure in other vital organs, it may not be able to reach its therapeutic concentration in the CNS. Moreover, if a drug candidate shows low selectivity and exposure in both the brain and other vital organs, this indicates that the drug candidate maybe safe even with high drug exposure in the plasma during preclinical studies, but it may present insufficient therapeutic efficacy in further clinical studies. Drug candidate innovators should pay ample attention to this phenomenon, and this dilemma should be avoided during drug optimization.
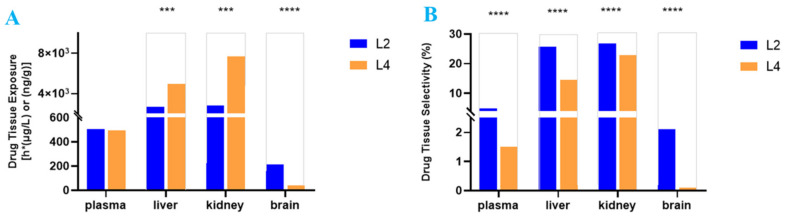
As shown in Figure 3A,B, the tissue exposure and selectivity were compared between L2 and L4. Despite the similar plasma exposure of L2 and L4, L2 had 5.1-fold higher exposure than L4 in the brain, and L2 had 1.8- to 2.8-fold lower exposure than L4 in the liver and kidney, respectively. All in all, L2 tissue selectivity in the brain was 21-fold higher than that of L4, whereas L2 tissue selectivity in the liver and kidney was 1.8- and 1.2-fold lower than that of L4, respectively (Figure 3B). Due to differing tissue selectivity, a much higher dose of L4 may achieve similar drug exposure in the brain compared to L2, but this would lead to higher L4 exposure in the liver and kidney to increase the drug toxicity in metabolism and elimination organs in the body.
In present study, three important PK parameters for studying STR, drug exposure, partition coefficient Kp, and drug selectivity in tissues, were closely associated with drug efficacy/toxicity. The content of drug candidate accumulated in certain tissue (Table 2) was evaluated by drug exposure (AUCtissue) and drug candidate partition coefficient (Kp) in the tissues, while drug tissue selectivity may impact the drug candidate’s therapeutic window between efficacy and toxicity (Figure 3).
Even in normal organs, the “free drug hypothesis” may not be accurate due to the transportation of both protein-bound drugs and free unbound drugs in normal tissues and disease-targeted tissues [ref. 7,ref. 32,ref. 33]. The overemphasis of free drug content in the plasma and neglect of drug tissue exposure may misguide the optimization process and selection of drug candidate. It is essential to choose total drug tissue exposure or Kp (total drug in tissue/plasma ratio) for drug candidate selection in lead optimization [ref. 4,ref. 9,ref. 10,ref. 39,ref. 40]. Hence, the adjustment of dose regimen for L2 and L4 should be carefully considered in terms of drug exposure in the brain/liver rather than in plasma exposure for clinical therapeutic efficacy, particularly regarding their unique activity as BuChE inhibitors.
2.3. Structural Modification Altered Drug Exposure and Selectivity in Various Tissues Despite Similar Drug Exposure in the Plasma
Structural modification of leads is a common technique in pharmacochemistry for lead optimization, owing to the fact that modification may impact the binding affinity of drug candidates to the molecular targets and pharmacokinetics of the drug candidate in the body. However, it is unclear that these structural modifications may alter drug exposure/selectivity in the tissues, which may affect their clinical efficacy/toxicity. Thus, we compared the drug exposure or tissue selectivity in various tissues of five CBD carbamates with similar chemical structures: L0, L1, L2, L3, and L4.
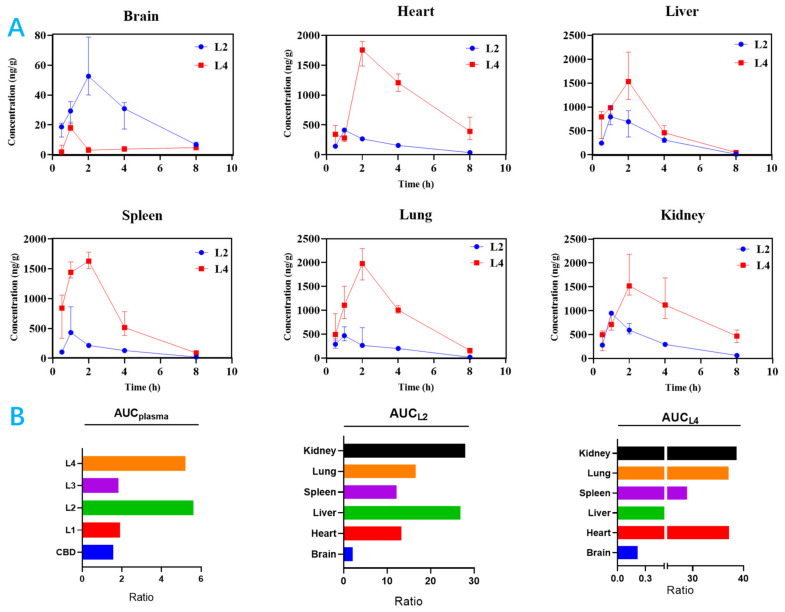
After oral administration of CBD and its carbamates, we firstly compared the difference in plasma concentration. The data revealed that drug plasma exposure and selectivity were significantly altered after structural modification. L1 and L3 had almost the same drug exposure as CBD in the plasma, which was much lower compared to L2 and L4. L2 and L4 had similar and the largest drug exposure in the plasma, but there was distinct tissue exposure in most organs, such as the brain, heart, kidney, liver, lung, and spleen. L2 and L4 had 0.08-fold to 16-fold exposure differences in tissues.
Moreover, the difference for tissue selectivity of L2 and L4 are presented in Figure 4. L2 had higher selectivity in the brain, kidney, and liver, while L4 had higher selectivity in the heart, kidney, and lung. These data prove that structural modifications can obviously change drug exposure and selectivity in different tissues, even though they exhibit similar or same drug exposure in plasma. However, these phenomena are always overlooked during drug selection in the drug optimization process.
2.4. ADMET and Physicochemical Property Prediction of CBD Carbamates
Although STR may provide guidance and orientation for lead optimization, the limited knowledge on STR relationship obstructs our understanding. Drug exposure in the plasma and tissues may be influenced by physicochemical properties, such as chemical solubility, lipophilicity (logP), ionization (pKa), polarity (such as polar surface area, PSA), plasma protein/tissue binding, and molecular weight (MW) [ref. 41,ref. 42]. However, CBD and L1–L4 in the present study had very similar physiochemical properties (Table 4 and Table S6). For example, L2 and L4 had close TPSA, logP, and MW, but both exhibited as large as fivefold differences in drug exposure in various tissues. Therefore, physicochemical properties cannot accurately explain the differences in drug exposure and selectivity in tissues. To better illuminate the molecular structure descriptors of these drug candidates, which may be related to drug exposure and tissue selectivity in different tissues, we used Mat-ADMET to collect more than 60 molecular structure descriptors to predict the ADMET of the substances (Table S6) to rationalize the results of the STR.
Table 4: Pharmacokinetic parameters of CBD and L1–L4 in plasma after intragastric administration.
| Pharmacokinetic Parameters | CBD | L1 | L2 | L3 | L4 | L1→CBD |
|---|---|---|---|---|---|---|
| t1/2 (h) | 3.70 ± 1.26 | 2.70 ± 1.27 | 2.64 ± 0.45 | 3.09 ± 1.52 | 2.17 ± 0.19 | 3.43 ± 1.64 |
| Tmax (h) | 1.20 ± 0.45 | 0.22 ± 0.07 | 1.80 ± 0.45 | 0.95 ± 0.11 | 0.80 ± 0.11 | 0.27 ± 0.15 |
| Cmax (μg/L) | 48.89 ± 11.02 | 119.98 ± 15.90 | 127.03 ± 23.65 | 60.01 ± 8.63 | 210.89 ± 30.74 | 94.59 ± 27.06 |
| AUC0-T (μg·h/L) | 157.50 ± 10.61 | 191.20 ± 58.69 | 561.35 ± 104.32 | 182.10 ± 13.94 | 521.56 ± 133.68 | 165.91 ± 87.56 |
| AUC0-∞ (μg·h/L) | 168.17 ± 11.50 | 196.80 ± 57.97 | 590.36 ± 110.07 | 200.40 ± 32.51 | 539.00 ± 131.18 | 172.51 ± 84.52 |
| MRT0-T (h) | 2.84 ± 0.23 | 2.05 ± 0.47 | 3.44 ± 0.22 | 2.72 ± 0.60 | 2.38 ± 0.21 | 2.21 ± 0.42 |
| Vd (L/kg) | 474.16 ± 155.23 | 319.94 ± 171.55 | 99.38 ± 23.95 | 320.94 ± 106.75 | 91.52 ± 22.81 | 577.46 ± 442.26 |
| CL (L/h/kg) | 89.55 ± 6.43 | 81.20 ± 21.71 | 26.07 ± 4.49 | 76.37 ± 11.68 | 28.99 ± 6.02 | 103.13 ± 42.44 |
The results in Table 4 and Table S6 show that CBD and L1–L4 complied with the rule-of-five (RO5) of orally administered drug candidates (four simple physicochemical parameter ranges: MW ≤ 500, logP ≤ 5, H-bond donors ≤ 5, and H-bond acceptors ≤ 10), 90% of which have accomplished clinical phase II trials; they might had blood–brain barrier (BBB) permeability and proper plasma protein binding rate, in which L2 had the best BBB permeability. CBD and L1–L4, the number of N and O atoms ≤ 5 in a molecule or logP − (N + O) > 0 had high potential to reach the brain as CNS drug candidates. CBD had long a half-life (t1/2). Interestingly, the introduction of a fat chain (L1 and L2) led to t1/2 decrease; the introduction of pyrrolidine (L3) and halogen-containing benzyl (L4) led to t1/2 increase [ref. 43]. Further, TPSA values of CBD and L1–L4 (<60) tended to be identified as CNS-active drug candidates. L2 had the lowest P-glycoprotein inhibition related to CNS transporter affinity. Carbamate decreased the rat acute oral toxicity (LD50) of CBD; however, L2–L4 had higher LD50 values than L1, which showed that the tertiary amine of carbamate had lower oral toxicity. These predictions indicated that CBD carbamates, especially L2, had a benign safety profile, and may be developed as a CNS-active drug candidate.
Therefore, it is worth considering the importance of STR in the chemical efficacy/toxicity during the drug optimization process. However, more data are required to further understand how the structural properties of carbamates relate to brain tissue. As a proof of concept, univariate feature analysis was used to study whether Kp is correlated with different molecular properties. The correlation of structure descriptors with the brain and liver were observed in CBD and four carbamates; these preliminary studies are required rational STR studies for drug candidate design in future [ref. 4,ref. 44,ref. 45]. It is crucial to keep a balanced structure–tissue exposure/selectivity–activity relationship (STAR) for drug candidate selection and drug optimization processes [ref. 4,ref. 30], which contributes to improving the clinical drug development.
2.5. Pharmacokinetics Study of CBD and Its Carbamates L1–L4
PD and PK studies are an integral part of lead optimization. Lead optimization is the complex, non-linear process of refining the chemical structure of a confirmed drug candidate to improve its drug-like properties. CBD carbamates had a more predictable response, greater bioavailability, and more potent BuChE inhibition than CBD. However, the amine substituent of carbamate affected their physicochemical and biological properties, as well as PK characteristics.
A rapid and sensitive UPLC-HRMS/MS method was established for the simultaneous determination of CBD and its carbamates L1–L4 in rat plasma samples for PK study. As shown in Table 3 and Figure 5, relevant PK parameters were obtained using WinNonLin software. The t1/2 and Tmax of CBD were 3.70 h and 1.20 h, respectively, which are consistent with the reported values of 1.4–10.9 h and 0–4 h [ref. 46,ref. 47]. The Tmax of L2 increased slightly to 1.80 h, while those of L1, L3, and L4 decreased to 0.22 h, 0.95 h, and 0.80 h, respectively, indicating that CBD carbamates can be rapidly metabolized in vivo. In the present work, carbamates reduced the long half-life (t1/2) of CBD to proper values (Table 4), but the Cmax after transformation greatly increased, that is, after the introduction of amine groups into CBD, the blood concentration increased. For example, L4 increased significantly to 210.89 μg/L; L1 and L2 increased to 119.98 μg/L and 127.03 μg/L, respectively; and L3 increased slightly to 60.01 μg/L. Further, L2 and L4 exposure in the plasma were similar: their AUC0-T values were 561.35 μg·h/L and 521.56 μg·h/L, respectively. Moreover, L2 and L4 had similar metabolisms, their Vd and CL values were 99.38 L/kg and 26.07 L/h/kg, and 91.52 L/kg and 28.99 L/h/kg, respectively. However, L2 and L4 exposures in the brain were significantly different.
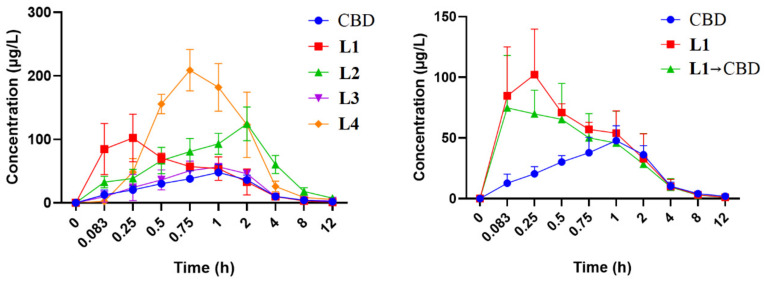
Further analysis of blood samples showed that CBD was observed in the plasma of L1, indicating that only L1 can be metabolized to produce CBD (Figure 5). Therefore, the tertiary amine of carbamate may be more stable than the secondary amine for CBD carbamate. Further, the Cmax and AUC0-T of L2 and L4 in the brain were 56 ng/g and 19 ng/g, and 213.8 ng·h/g and 43.2 ng·h/g, respectively, indicating that L2 had much higher exposure than L4 in the brain (Figure 2C and Table 2). The data of Mat-ADMET also showed that compared with L2, benzyl in L4 led to a higher plasma protein binding rate and lower brain exposure (Table 3). Therefore, the pharmacokinetics of carbamates was significantly affected by the chemical structures, which may guide structural modification [ref. 48,ref. 49,ref. 50].
3. Materials and Methods
3.1. Chemicals and Reagents
CBD was purchased from Push Bio-technology (Chengdu, China). The CBD carbamates (L1–L4), internal standard [IS, L5, CBD 4-bromobenzyl(methyl)carbamate] were synthesized, and the CBD L0–L5 were provided by School of Pharmacy, Anhui Medical University (Hefei, China). Methanol (MeOH), acetonitrile (ACN), ammonium formate, and formic acid (FA) of LC–MS grade were purchased from Thermo Fisher (San Jose, CA, USA). HPLC-grade ammonium acetate, methyl tertiary butyl ether (MTBE), ethyl acetate (EAC), and trichloromethane (CHCl3) were obtained from Sigma-Aldrich (St. Louis, MO, USA). Other reagents were chemically pure, and the deionized water was purified using a Milli-Q-Plus system (Bedford, MA, USA).
3.2. Animal Experiments
Animal experiments were conducted in accordance with the National Institutes of Health Laboratory Animal Care and Use Guidelines. Male SPF SD rats from the Animal Center of Anhui Medical University (Hefei, China) were used for the experiment. Compounds L0–L4 were dissolved in ethanol, and the single intragastric administration to rats at a dose of 15 mg/kg. At each time point (0.5, 1, 2, 4, and 8 h) after administration, samples of brain, heart, kidney, liver, lung, and spleen were collected from each rat for tissue distribution study. While for pharmacokinetic study, the plasma samples were gathered from the suborbital vein at 5, 15, 30, and 45 min and 1, 2, 4, 8, and 12 h after oral administration. The maintenance and treatment procedures for experimental animals were approved by the Animal Care and Use Committee of Anhui Medical University (approval number: LLSC20190274). Room temperature was 22 ± 2 °C, using a light/dark (12: 12 h) cycle, the animals were free to consume food and water one day before the experiment.
3.3. Samples Preparation Procedures
An aliquot of 60 μL plasma sample was spiked with 60 µL aqueous ascorbic acid (0.1%) and 20 μL of IS working solution (300 ng/mL). After vortexing for 30 s, 400 µL MTBE was added to plasma sample for liquid–liquid extraction. The mixture was vigorously mixed for 10 min and centrifuged at 12,000 rpm at 4 °C for 5 min; approximately 400 µL of supernatant was transferred to a clean 1.5 mL centrifuge tube and dried under a gentle stream of nitrogen gas. Subsequently, the residue was reconstituted with 100 µL of MeOH/water (7: 3, v/v), vortex-mixed for 2 min, and followed by centrifugation at 12,000 rpm for 20 min. Finally, 20 μL of the supernatant was injected into the UPLC-HRMS system for measurement. The tissue sample (100 mg) was homogenized in normal saline solution (1 mL), 600 μL homogenate sample was spiked with 60 µL aqueous ascorbic acid (0.1%) and 50 μL of the IS working solution (1000 ng/mL), and 1.2 mL MTBE was added for extraction. Then, 1 mL of supernatant was dried and proceeded as plasma sample pretreatment (Figure S1).
3.4. UPLC–HRMS Analysis of Drug Candidate Concentration
Quantitative analysis using Dionex Ultimate 3000 chromatography hyphenated to Q-Exactive plus Orbitrap mass spectrometer system (Thermo Fisher Scientific, Waltham, MA, USA). The analytes were detected in Full MS/dd-MS2 mode to choose the parent ion and optimize the retention time; then, we used the parallel reaction monitoring (PRM) mode through positive ionization condition for determination. Xcalibur 4.1 software (Thermo Fisher Scientific) was used for data acquisition and processing.
Chromatographic separation was achieved on a Shimadzu-pack GIST column (50 mm × 2.1 mm, 2 μm, Shimadzu Company, Kyoto, Japan). Binary mobile solvents consisted of water (containing 0.1% FA, v/v) (A) and acetonitrile (B), the gradient program was as follows: 0 min 60% A → 1 min 60% A → 1.5 min 20% A → 7 min 20% A → 7.1 min 60% A → 8.5 min 60% A. The flow rate was set at 0.30 mL/min and the column temperature was 40 °C. The typical source parameters were optimized as follows: spray voltage: 4500 V; capillary temperature: 320 °C; auxiliary gas heater temperature: 200 °C; pressure of sheath gas: 320 kPa; auxiliary gas: 50 kPa. The retention time and the optimal mass parameters are shown in Table S1. The method was validated according to U.S. Food and Drug Administration (FDA) guidance for selectivity (Figure S2), linearity (Table S2), matrix effect, recovery (Table S4), precision and accuracy (Table S3), and stability (Table S5).
3.5. ADMET and Physicochemical Properties Prediction of CBD Carbamates
Mat-ADMET is a computational tool used to evaluate the absorption, distribution, metabolism, excretion, and toxicity (ADMET) profiles, along with physicochemical properties of compounds. Mat-ADMET enables us to forecast various properties such as lipophilicity, water solubility, physicochemical, pharmacokinetics, drug-likeness, and other pertinent descriptors. Additionally, it provides valuable insight into predicting the similarity of leads towards cytotoxicity, carcinogenicity, hepatotoxicity, mean lethal dose (LD50) in rodents, and other parameters. The Mat-ADMET website is accessible freely using following the link: Mat-ADMET (matwings.com (accessed on 12 December 2022)).
3.6. Pharmacokinetics
Phoenix/WinNonlin software (version 6.4; Pharsight, Mountain View, CA, USA) was used to calculate the AUC and other pharmacokinetic parameters in plasma or tissue for each drug in a non-compartmental model.
3.7. Statistical Analysis
GraphPad Prism (version 8.0.1) software was used for statistical analysis. Statistical significance between two groups was calculated by Student’s t-test; the p value < 0.05 was considered significant.
4. Conclusions
During drug optimization process, the STR can improve drug selection and influence the balance of clinical efficacy/toxicity. In the present study, we investigated the STR in correlation with drug efficacy/toxicity using BuChE-targeted CBD and its carbamates L1–L4 with similar structures, the same molecular target, and similar/different PK profiles in plasma and tissues. The results showed that CNS drug exposure in the plasma was not correlated with those in the target tissue (brain), while tissue exposure/selectivity was correlated with drug efficacy/safety. L2 and L4 had similar drug exposures in the plasma, and L2 showed higher exposure and selectivity in the brain than L4, which was likely due to plasma protein binding and P-glycoprotein inhibition. In addition, structural modifications not only changed drug exposure in the plasma, but also altered drug exposure and selectivity in various tissues. The tertiary amine of carbamate (L2–L4) was more stable than the secondary amine (L1) in the plasma. Further, the ADMET study showed that Mat-ADMET can predict STR. The data indicated that STR can alter drug tissue exposure/selectivity in organic tissues, impacting clinical efficacy/toxicity. Owing to the limitation of the AD animal model, drug exposure in disease tissues may induce different STRs. The drug optimization process should balance SAR and STR in improving clinical trials.
References
- T. Takebe, R. Imai, S. Ono. The current status of drug discovery and development as originated in United States academia: The influence of industrial and academic collaboration on drug discovery and development. Clin. Transl. Sci., 2018. [DOI | PubMed]
- S. Verma, R.K. Pathak. Chapter 16—Discovery and optimization of lead molecules in drug designing. Bioinformatics Methods and Applications, 2022
- M. Davies, R.D.O. Jones, K. Grime, R. Jansson-Löfmark, A.J. Fretland, S. Winiwarter, P. Morgan, D.F. McGinnity. Improving the Accuracy of Predicted Human Pharmacokinetics: Lessons Learned from the AstraZeneca Drug Pipeline Over Two Decades. Trends Pharmacol. Sci., 2020. [DOI | PubMed]
- D. Sun, W. Gao, H. Hu, S. Zhou. Why 90% of clinical drug development fails and how to improve it. Acta Pharm. Sin. B, 2022. [DOI | PubMed]
- H. Dowden, J. Munro. Trends in clinical success rates and therapeutic focus. Nat. Rev. Drug Discov., 2019. [DOI | PubMed]
- R.K. Harrison. Phase II and Phase III failures: 2013–2015. Nat. Rev. Drug Discov., 2016. [DOI | PubMed]
- M.L. Rizk, L. Zou, R.M. Savic, K.E. Dooley. Importance of drug pharmacokinetics at the site of action. Clin. Transl. Sci., 2017. [DOI | PubMed]
- W.C. Dong, M.Y. Song, T.L. Zheng, Z.Q. Zhang, Y. Jiang, J.L. Guo, Y.Z. Zhang. Development of an hollow fiber solid phase microextraction method for the analysis of unbound fraction of imatinib and N-desmethyl imatinib in human plasma. J. Pharm. Biomed. Anal., 2024. [DOI | PubMed]
- X. Luo, Y. Ding, Y. Cao, Z. Liu, W. Zhang, S. Zeng, S.H. Cheng, H. Li, S.J. Haggarty, X. Wang. Few-shot meta-learning applied to whole brain activity maps improves systems neuropharmacology and drug discovery. iScience, 2024. [DOI | PubMed]
- K.K. Ghosh, P. Padmanabhan, C.T. Yang, D.C.E. Ng, M. Palanivel, S. Mishra, C. Halldin, B. Gulyás. Positron emission tomographic imaging in drug discovery. Drug Discov. Today, 2022. [DOI | PubMed]
- Z. Rankovic. CNS drug design: Balancing physicochemical properties for optimal brain exposure. J. Med. Chem., 2015. [DOI | PubMed]
- W. Gao, H. Hu, L. Dai, M. He, H. Yuan, H. Zhang, J. Liao, B. Wen, Y. Li, M. Palmisano. Structure–tissue exposure/selectivity relationship (STR) correlates with clinical efficacy/safety. Acta Pharm. Sin. B, 2022. [DOI | PubMed]
- A. Matošević, A. Bosak. Carbamate group as structural motif in drugs: A review of carbamate derivatives used as therapeutic agents. Arh. Hig. Rada Toksikol., 2020. [DOI | PubMed]
- T. Gonec, D. Pindjakova, L. Vrablova, T. Strharsky, H. Michnova, T. Kauerova, P. Kollar, M. Oravec, I. Jendrzejewska, A. Cizek. Antistaphylococcal Activities and ADME-Related Properties of Chlorinated Arylcarbamoylnaphthalenylcarbamates. Pharmaceuticals, 2022. [DOI | PubMed]
- A. Biancardi, C. Aimo, P. Piazza, F. Lo Chiano, S. Rubini, E. Baldini, S. Vertuani, S. Manfredini. Acetylcholinesterase (AChE) Reversible Inhibitors: The Role of Oxamyl in the Production of Poisoned Baits. Toxics, 2022. [DOI | PubMed]
- M.F. Eskander, N.G. Nagykery, E.Y. Leung, B. Khelghati, C. Geula. Rivastigmine is a potent inhibitor of acetyl- and butyrylcholinesterase in Alzheimer’s plaques and tangles. Brain Res., 2005. [DOI | PubMed]
- L. Brewer, K. Bennett, C. McGreevy, D. Williams. A population-based study of dosing and persistence with anti-dementia medications. Eur. J. Clin. Pharmacol., 2013. [DOI | PubMed]
- F.L. Tse, R. Laplanche. Absorption, metabolism, and disposition of [14C]SDZ ENA 713, an acetylcholinesterase inhibitor, in minipigs following oral, intravenous, and dermal administration. Pharm. Res., 1998. [DOI | PubMed]
- R.J. Polinsky. Clinical pharmacology of rivastigmine: A new-generation acetylcholinesterase inhibitor for the treatment of Alzheimer’s disease. Clin. Ther., 1998. [DOI | PubMed]
- S.M. Somani. Pharmacokinetics and pharmacodynamics of physostigmine in the rat after oral administration. Biopharm. Drug Dispos., 1989. [DOI | PubMed]
- T. Utsuki, N. Uchimura, M. Irikura, H. Moriuchi, H.W. Holloway, Q.S. Yu, E.L. Spangler, J. Mamczarz, D.K. Ingram, T. Irie. Preclinical investigation of the topical administration of phenserine: Transdermal flux, cholinesterase inhibition, and cognitive efficacy. J. Pharmacol. Exp. Ther., 2007. [DOI | PubMed]
- X. Dong. Current Strategies for Brain Drug Delivery. Theranostics, 2018. [DOI | PubMed]
- R.I. Teleanu, M.D. Preda, A.G. Niculescu, O. Vladâcenco, C.I. Radu, A.M. Grumezescu, D.M. Teleanu. Current Strategies to Enhance Delivery of Drugs across the Blood-Brain Barrier. Pharmaceutics, 2022. [DOI | PubMed]
- B. Sethi, V. Kumar, K. Mahato, D.W. Coulter, R.I. Mahato. Recent advances in drug delivery and targeting to the brain. J. Control. Release, 2022. [DOI | PubMed]
- S. Zhang, L. Gan, F. Cao, H. Wang, P. Gong, C. Ma, L. Ren, Y. Lin, X. Lin. The barrier and interface mechanisms of the brain barrier, and brain drug delivery. Brain Res. Bull., 2022. [DOI | PubMed]
- H. Li, Y. Liu, D. Tian, L. Tian, X. Ju, L. Qi, Y. Wang, C. Liang. Overview of cannabidiol (CBD) and its analogues: Structures, biological activities, and neuroprotective mechanisms in epilepsy and Alzheimer’s disease. Eur. J. Med. Chem., 2020. [DOI | PubMed]
- G. Watt, K. Shang, J. Zieba, J. Olaya, H. Li, B. Garner, T. Karl. Chronic Treatment with 50 mg/kg Cannabidiol Improves Cognition and Moderately Reduces Aβ40 Levels in 12-Month-Old Male AβPPswe/PS1ΔE9 Transgenic Mice. J. Alzheimers Dis., 2020. [DOI | PubMed]
- V.K. Gombar, S.D. Hall. Quantitative structure-activity relationship models of clinical pharmacokinetics: Clearance and volume of distribution. J. Chem. Inf. Model, 2013. [DOI | PubMed]
- X. Jiang, Z. Zhang, J. Zuo, C. Wu, L. Zha, Y. Xu, S. Wang, J. Shi, X.H. Liu, J. Zhang. Novel cannabidiol-carbamate hybrids as selective BuChE inhibitors: Docking-based fragment reassembly for the development of potential therapeutic agents against Alzheimer’s disease. Eur. J. Med. Chem., 2021. [DOI | PubMed]
- S. Gauthier. Cholinergic adverse effects of cholinesterase inhibitors in Alzheimer’s disease: Epidemiology and management. Drugs Aging, 2001. [DOI | PubMed]
- F. Tian, C. Li, X. Wang, S. Ren, N. Li, Q. Liu, S. Zhou, Y. Lu, D. Zhao, X. Chen. Comparative study on pharmacokinetics of a series of anticholinergics, atropine, anisodamine, anisodine, scopolamine and tiotropium in rats. Eur. J. Drug Metab. Pharmacokinet., 2015. [DOI | PubMed]
- P.Y. Muller, M.N. Milton. The Determination and interpretation of the therapeutic index in drug development. Nat. Rev. Drug Discov., 2012. [DOI | PubMed]
- M. Hammarlund-Udenaes. Active-site concentrations of chemicalsdare they a better predictor of effect than plasma/organ/tissue concentrations?. Basic Clin. Pharmacol. Toxicol., 2010. [DOI | PubMed]
- I. Loryan, A. Reichel, B. Feng, C. Bundgaard, C. Shaffer, C. Kalvass, D. Bednarczyk, D. Morrison, D. Lesuisse, E. Hoppe. Unbound brain-to-plasma partition coefficient, Kp, uu, brain—A game changing parameter for CNS drug discovery and development. Pharm. Res., 2022. [DOI | PubMed]
- M. Charve´riat, V. Lafon, F. Mouthon, L. Zimmer. Innovative approaches in CNS drug discovery. Therapie, 2021. [DOI | PubMed]
- I. Suridjan, R.A. Comley, E.A. Rabiner. The application of positron emission tomography (PET) imaging in CNS drug development. Brain Imaging Behav., 2019. [DOI | PubMed]
- W. Schmitt. General approach for the calculation of tissue to plasma partition coefficients. Toxicol. In Vitro, 2008. [DOI | PubMed]
- D. Zhang, C. Hop, G. Patilea-Vrana, G. Gampa, H.K. Seneviratne, J.D. Unadkat, J.R. Kenny, K. Nagapudi, L. Di, L. Zhou. Drug concentration asymmetry in tissues and plasma for small molecule-related therapeutic modalities. Drug Metab. Dispos., 2019. [DOI | PubMed]
- Z. Chen, Y. Yuan, Z. Li, M. Kutner, T. Owonikoko, W.J. Curran, F. Khuri, J. Kowalski. Dose escalation with over-dose and under-dose controls in Phase I/II clinical trials. Contemp. Clin. Trials, 2015. [DOI | PubMed]
- N.C. Patel. Methods to optimize CNS exposure of drug candidates. Bioorg. Med. Chem. Lett., 2020. [DOI | PubMed]
- P.J. Tonge. Drug-target kinetics in drug discovery. ACS Chem. Neurosci., 2018. [DOI | PubMed]
- A.W. Harrell, C. Sychterz, M.Y. Ho, A. Weber, K. Valko, K. Negash. Interrogating the relationship between rat in vivo tissue distribution and drug property data for >200 structurally unrelated molecules. Pharmacol. Res. Perspect., 2015. [DOI | PubMed]
- Y.A. Zolotarev, V.A. Mitkevich, S.I. Shram, A.A. Adzhubei, A.P. Tolstova, O.B. Talibov, A.K. Dadayan, N.F. Myasoyedov, A.A. Makarov, S.A. Kozin. Pharmacokinetics and Molecular Modeling Indicate nAChRα4-Derived Peptide HAEE Goes through the Blood-Brain Barrier. Biomolecules, 2021. [DOI | PubMed]
- C.A. Lipinski. Lead- and drug-like compounds: The rule-of-five revolution. Drug Discov. Today Technol., 2004. [DOI | PubMed]
- B. Zhang, A. Korolj, B.F.L. Lai, M. Radisic. Advances in organ-on-a-chip engineering. Nat. Rev. Mater., 2018. [DOI]
- L. David, A. Thakkar, R. Mercado, O. Engkvist. Molecular representations in AI-driven drug discovery: A review and practical guide. J. Cheminform., 2020. [DOI | PubMed]
- S.A. Millar, N.L. Stone, A.S. Yates, S.E. O’Sullivan. A Systematic Review on the Pharmacokinetics of Cannabidiol in Humans. Front. Pharmacol., 2018. [DOI | PubMed]
- J. Crockett, D. Critchley, B. Tayo, J. Berwaerts, G. Morrison. A phase 1, randomized, pharmacokinetic trial of the effect of different meal compositions, whole milk, and alcohol on cannabidiol exposure and safety in healthy subjects. Epilepsia, 2020. [DOI | PubMed]
- K. Rong, Z. Li, X. Wu, S. Gao, J. Zhao, J. Yang, X. Jiang, J. Zhang, W. Tang. Natural phenol carbamates: Selective BuChE/FAAH dual inhibitors show neuroprotection in an Alzheimer’s disease mouse model. Eur. J. Med. Chem., 2025. [DOI]
- C. Citti, F. Palazzoli, M. Licata, A. Vilella, G. Leo, M. Zoli, M.A. Vandelli, F. Forni, B. Pacchetti, G. Cannazza. Untargeted rat brain metabolomics after oral administration of a single high dose of cannabidiol. J. Pharm. Biomed. Anal., 2018. [DOI | PubMed]