A novel network-based method identifies a cuproplasia-related pan-cancer gene signature to predict patient outcome
Abstract
Supplementary Information:
The online version contains supplementary material available at 10.1007/s00439-024-02673-2.
Article type: Research Article
Keywords: Cuproplasia, Copper, Cancer, Gene regulatory network, Survival analysis
Affiliations: https://ror.org/03r8z3t63grid.1005.40000 0004 4902 0432Children’s Cancer Institute, Lowy Cancer Research Centre, UNSW, Kensington, NSW Australia; https://ror.org/03r8z3t63grid.1005.40000 0004 4902 0432School of Biomedical Sciences, UNSW Sydney, Kensington, NSW Australia; https://ror.org/02rc97e94grid.7778.f0000 0004 1937 0319Department of Pharmacy, Health and Nutritional Sciences, University of Calabria, Rende, Italy; https://ror.org/00d1dhh09grid.413480.a0000 0004 0440 749XDartmouth–Hitchcock Medical Center: Lebanon, New Hampshire, US; https://ror.org/03r8z3t63grid.1005.40000 0004 4902 0432School of Clinical Medicine, UNSW Medicine & Health, UNSW Sydney, Kensington, NSW Australia
License: © The Author(s) 2024 CC BY 4.0 Open Access This article is licensed under a Creative Commons Attribution 4.0 International License, which permits use, sharing, adaptation, distribution and reproduction in any medium or format, as long as you give appropriate credit to the original author(s) and the source, provide a link to the Creative Commons licence, and indicate if changes were made. The images or other third party material in this article are included in the article’s Creative Commons licence, unless indicated otherwise in a credit line to the material. If material is not included in the article’s Creative Commons licence and your intended use is not permitted by statutory regulation or exceeds the permitted use, you will need to obtain permission directly from the copyright holder. To view a copy of this licence, visit http://creativecommons.org/licenses/by/4.0/.
Article links: DOI: 10.1007/s00439-024-02673-2 | PubMed: 38642129 | PMC: PMC11485146
Relevance: Moderate: mentioned 3+ times in text
Full text: PDF (1.8 MB)
Introduction
Cuproplasia is defined as copper-dependent cell-growth and proliferation in disease (Ge et al. ref. 2022), which is distinct from cuproptosis, a process in which copper mediates cell death via cytotoxicity caused by increased mitochondrial-dependent energy metabolism and accumulation of reactive oxygen species (Tang et al. ref. 2022). This definition of cuproplasia was introduced at the Copper Cancer Consortium at Cold Spring Harbour Laboratory in 2020 (Ge et al. ref. 2022). Cuproplasia can be pharmacologically targeted; meaning that copper signalling can be activated with metal ionophores or repressed by copper-selective chelators. It can also be modulated by genetic manipulation of proteins related to copper homeostasis, which is regulated by the copper uptake, transport, and excretion within the cell and individual intracellular compartments.
Copper is a metal involved in many biological processes and is essential for cell growth. It is a redox cofactor for several copper-dependent enzymes and proteins, such as the mitochondrial Cu transporter SLC25A3 and cytochrome c oxidase COX (Tsang et al. ref. 2021). It also plays an important role in angiogenesis, by influencing vascular endothelial growth factor (VEGF) protein and its mRNA expression (McAuslan and Reilly ref. 1980; Sen et al. ref. 2002). These findings highlight the indispensable role of copper as a factor for enzymes in mediating a wide range of important cellular functions. However, the dysregulation of copper stimulates receptor tyrosine kinase (RTK) signalling pathways, inhibits key enzymes in cellular metabolism and respiration (Michniewicz et al. ref. 2021), and leads to oxidative stress and cytotoxicity (Que et al. ref. 2008; Solomon et al. ref. 1996). For example, cellular toxicity involved with disrupted copper homeostasis is often associated with accumulation of reactive oxygen species, anti-angiogenesis, and proteasome inhibition (Jiang et al. ref. 2022).
Furthermore, there is evidence showing that various proteins maintain appropriate intracellular copper bioavailability in cells and ensures the metalation of copper-dependent enzymes. Key regulators of mammalian copper homeostasis include the blood carrier protein ceruloplasmin (CP), SLC31A1 (also known as CTR1, a principal copper uptake transporter), as well as exporting proteins ATP7A and ATP7B, which possess both copper export and metallochaperone functions (Ge et al. ref. 2022). Additionally, somatic mutations in several regulating proteins cause copper accumulation or deficiency pathologies, such as mutations in ATP7A disrupt the homeostatic copper balance, leading to copper deficiency in Menkes disease (de Bie et al. ref. 2007).
With the increasing importance of understanding the role of copper and its related genes in cancer development, several studies in cancer such as in neuroblastoma (Rouaen et al. ref. 2022), pancreatic cancer (Guan et al. ref. 2022), glioma (Chen et al. ref. 2022; Michniewicz et al. ref. 2020, ref. 2022), bladder cancer (Song et al. ref. 2022), and breast cancer (Li et al. ref. 2022) have investigated the pro-tumorigenic role of copper. However, cuproplasia-associated gene signatures in a pan-cancer analysis are still unknown and no signatures have been detected to show the association of cuproplasia with cancer patients’ survival. Therefore, a comprehensive pan-cancer analysis is required to identify the role of cuproplasia-related genes and their associations with survival and biological processes.
We performed a comprehensive analysis on cuproplasia-related genes in cancer to better understand their effect, potential roles, and their associations with patient survival. We utilised a network control method (Liu et al. ref. 2011) using RNA-sequencing data from The Cancer Genome Atlas (TCGA) and Genotype-Tissue Expression (GTEx) datasets across 23 cancer types. The identified cuproplasia-related genes were correlated with patient survival and show the ability of generating a prognostic risk score model. To our knowledge, this is the first study which conducted a comprehensive pan-cancer analysis of the genes involved in cuproplasia. These results highlight the importance of identifying cuproplasia-related genes in tumour development. In addition, our findings provide novel insights on the effects of copper homeostasis on the molecular regulatory mechanisms of cancer initialisation and progression.
Materials and methods
Datasets and data processing
We obtained publicly available data from The Cancer Genome Atlas (TCGA) (Weinstein et al. ref. 2013) and the Genotype-Tissue Expression (GTEx) (Lonsdale et al. ref. 2013). From TCGA we selected 23 cancer types, based on the availability of matched RNA-sequencing data from normal tissues in GTEx (Supplementary Table 1 in Additional file 1), and patient survival data. This selection resulted in data from primary tumours and the corresponding GTEx normal tissues for 23 cancer types, for a total of 6,732 patients (6,728 patients had clinical data, including age and gender) and 4,597 normal tissues. Among the 6,728 patients, 6,678 patients had survival data and 50 patients did not include survival data. The 50 patients without survival data were removed in our survival analyses (i.e., there is no significant difference between the means of age between patients with and without survival data, p-values 0.5273, 0.5152, and 0.6829 for the tests of all patients, male patients, and female patients respectively using t-test). We further obtained publicly available gene expression and clinical data from a low grade glioma (LGG) dataset from the Chinese Glioma Genome Atlas (CGGA) database (http://www.cgga.org.cn/) (Liu et al. ref. 2018b; Wang et al. ref. 2015; Zhao et al. ref. 2021). Only 3 patients that did not have corresponding survival data were removed from survival analyses and LGG risk score model building, resulting in a training set of 345 patients and a test cohort of 420 patients to build the LGG risk score model.
Differentially expressed genes
Differential gene expression analysis was conducted in R (v4.2.2) using limma (Ritchie et al. ref. 2015) to compare gene expression data (expected counts from RSEM output) of TCGA primary tumours against the matched GTEx normal tissues for the 23 cancer types. The gene expression data was downloaded from UCSC Xena browser (https://xenabrowser.net/datapages/). Genes were considered differentially expressed if they had an adjusted p-value ≤ 0.05 and log2(|fold change|) ≥ 1. Benjamini-Hochberg was used for multiple test correction.
Construction of gene regulatory networks
Gene regulatory networks were constructed in R (v4.2.2) using Pearson correlation and STRING protein interaction database (Szklarczyk et al. ref. 2019) for each of the 23 cancer types. In this study, Pearson correlation was utilised to identify if there was a linear relationship between two quantitative variables (i.e., the expression of two genes). However, our proposed method was flexibly designed so that end users could use Pearson or other correlation methods such as Spearman. Due to the bias of the STRING network and the fact that STRING interactions may not occur in every cancer type, we built the gene regulatory network for a cancer type using the gene expression of patients in that cancer type, then we only used the STRING database as an additional resource to refine the network. The relative gene expression values of the significantly differentially expressed genes identified by comparing primary samples with the matched normal tissues for each cancer type were filtered to only include genes in the STRING database. These genes were used for network construction. We calculated the pairwise correlation coefficients (PCC) for all the nodes and retained only edges whose adjusted p-value ≤ 0.05. In the network, nodes are genes and edges show the interactions between the genes. We further refined the gene network using the STRING protein interaction database, by removing interactions not in the STRING database. This resulted in the final gene regulatory network for each cancer type.
Identification of critical nodes
We adopted established tools from network control (Liu et al. ref. 2011), that have been previously applied to gene network analysis (Pham et al. ref. 2019, ref. 2020, ref. 2021), and used these to identify critical nodes. According to the network control method, any directed network can be controlled by a minimum set of nodes, called a minimum driver node set (MDNS) that can interact to control or drive the whole network. To identify the critical nodes within the gene regulatory network for each cancer type, the MDNS of the network is detected. To identify if a node is critical, that node will be removed from the original network, and a new MDNS will be calculated. If the MDNS increases, then the removed node is identified as a critical node.
Collection of copper-related genes
To investigate cuproplasia-related prognostic effects for all downstream analyses in this study, we generated a 133-gene list. This gene list was obtained from copper-related gene sets in Molecular Signatures Database (MSigDB v2022.1.Hs) (Liberzon et al. ref. 2015; Subramanian et al. ref. 2005) as follows: WP_COPPER_HOMEOSTASIS, HP_DECREASED_CIRCULATING_COPPER_CONCENTRATION, HP_ABNORMAL_CIRCULATING_COPPER_CONCENTRATION, GOMF_COPPER_ION_TRANSMEMBRANE_TRANSPORTER_ACTIVITY, GOMF_COPPER_ION_BINDING, GOMF_COPPER_CHAPERONE_ACTIVITY, GOBP_RESPONSE_TO_COPPER_ION, GOBP_DETOXIFICATION_OF_COPPER_ION, GOBP_COPPER_ION_TRANSPORT, GOBP_COPPER_ION_TRANSMEMBRANE_TRANSPORT, GOBP_COPPER_ION_IMPORT, GOBP_COPPER_ION_HOMEOSTASIS, GOBP_CELLULAR_RESPONSE_TO_COPPER_ION, and GOBP_CELLULAR_COPPER_ION_HOMEOSTASIS. These gene sets were derived from different sources, including means of crowd sourcing, medical literature, Orphanet (a resource on rare diseases), DECIPHER (a database of genomic variation and phenotype in humans), and OMIM (a catalog of human genes and genetic disorders) (Supplementary Table 2 in Additional file 1). As these copper-related gene sets are related to abnormalities in human diseases, molecular functions, and biological processes, they may be appropriate to be used as candidates for investigating their clinical roles in tumours across cancer types. Then genes from each gene set were combined and overlapping genes are removed to obtain the final gene list (Supplementary Table 3 in Additional file 1).
Univariate cox proportional hazards regression model
The R package ezcox (https://github.com/ShixiangWang/ezcox) was used to analyse the effects of copper-related genes on survival using the Univariate Cox proportional hazards regression model. Genes with p-value ≤ 0.05 were considered to have a statistically significant effect on survival and were selected for further analysis.
Enrichment analysis
Enrichment analysis was conducted on the 30 critical cuproplasia-related genes identified in the pan-cancer analysis. Enrichr (Chen et al. ref. 2013; Kuleshov et al. ref. 2016; Xie et al. ref. 2021) was used to identify the enriched gene sets from Gene Ontology Biological Processes and Molecular Function dataset and enrichment of pathways from Kyoto Encyclopedia of Genes and Genomes (KEGG) database.
Survival analysis
To test if a cuproplasia-related gene signature infers survival, we used the SNFtool package (Wang et al. ref. 2014) to compute the squared Euclidean distances between all pairs of patients using a vector formed with the gene expression values of that gene set. The patients were clustered into 2 groups based on their Euclidean distances to other patients using spectral clustering, identifying 2 subgroups of patients with the most similar expression profile of the gene set. Survival analysis was performed using the survival package (Therneau and Grambsch ref. 2000) in R. This analysis was done for pan-cancer and individually for all 23 cancer types.
Single nucleotide and copy number variant analysis
To explore the potential changed activity of copper-related genes in cancer development, we analysed the single nucleotide variants (SNVs) and copy number variations (CNVs) of the critical cuproplasia-related genes (CCGs). GSCALite (Liu et al. ref. 2018a), a web server for analysing gene sets in cancer, was used for this exploration. This web server used the SNV and CNV data from the TCGA database. For the SNV data, we firstly selected only deleterious mutations, including Missense_Mutation, Nonsense_Mutation, Frame_Shift_Del, Splice_Site, Frame_Shift_Ins, In_Frame_Del, and In_Frame_Ins. We then kept mutations which had variant allele frequency larger than 0.1 and FILTER being PASS. Variant allele frequency was the ratio of read depth supporting the variant allele in tumour (i.e., t_alt_count) to read depth across this locus in tumour (i.e., t_depth). We obtained Revel scores of those mutations using Revel method (Ioannidis et al. ref. 2016). Based on the Revel scores, the mutations were categorised into supporting benign, moderate benign, strong benign, supporting pathogenic, moderate pathogenic, and strong pathogenic. Only pathogenic mutations were retained for further analyses. We used maftools package (version 2.16.0) to show the mutation distribution and type of SNVs for genes in an oncoplot. CNV data was already annotated as homozygous deletion, heterozygous deletion, heterozygous amplification or homozygous amplification within GSCALite. The homozygous deletion and amplification CNV events were combined with the pathogenic SNVs to separate patients into either mutant or wild type (WT). Survival analysis was performed using the survival package in R. This analysis was done pan-cancer for 29 CCGs (MT-CO1 was excluded due to missing data).
Construction and validation for a risk score model in low grade glioma (LGG)
A risk score model was constructed using the Least Absolute Shrinkage and Selection Operator (LASSO) regression model from glmnet package (Friedman et al. ref. 2010) using gene expression of the CCGs in LGG and survival data. Univariate Cox regression model was firstly used for the 13 CCGs of LGG to select 10 genes which were individually related to survival, then LASSO was applied to these 10 genes. Cross-validation confirmed the optimal model performance at log(λ) = -3.613 for 6 genes, implying that these 6 genes can be used to build the risk score model. The model was built using the gene expression data (expected counts from RSEM output) from the TCGA database (i.e., training set). To validate the risk score model we obtained gene expression and survival data from LGG patients in the CGGA database (http://www.cgga.org.cn/) (Liu et al. ref. 2018b; Wang et al. ref. 2015; Zhao et al. ref. 2021) (i.e., test set). The receiver operating characteristic (ROC) curve was plotted and the area under the ROC curve (AUC) was computed using the R package timeROC (Blanche et al. ref. 2013).
Results
A gene regulatory network identifies critical cuproplasia-related genes in pan-cancer
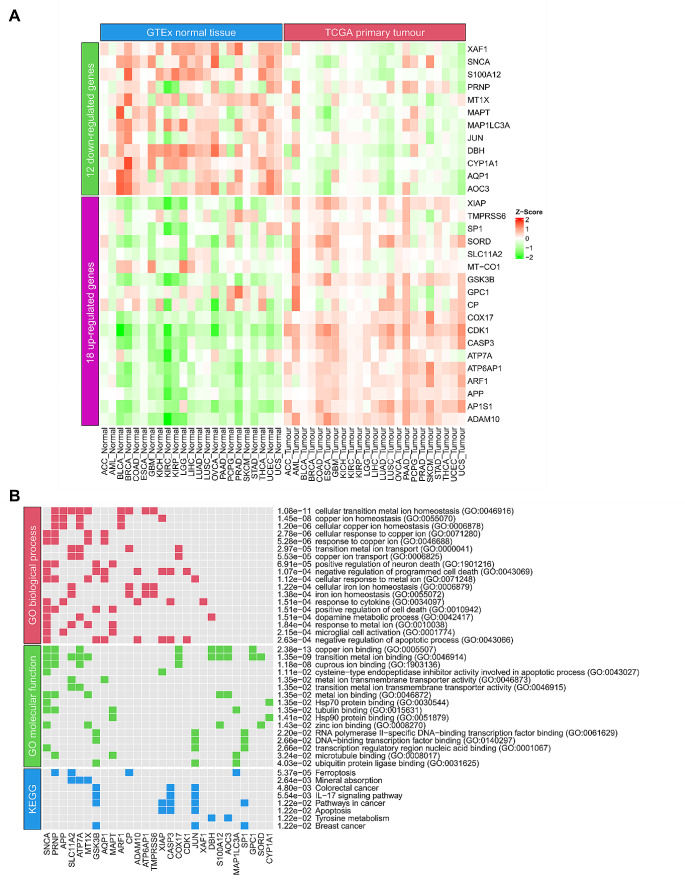
Gene regulatory networks can be used to elucidate molecular mechanisms in disease progression (Liu et al. ref. 2016; Yu et al. ref. 2017). To identify if there are CCGs that impact patient survival, we sought to generate a gene regulatory network to identify CCGs. We obtained gene expression data from 23 tumours and normal tissue samples from TCGA and GTEx respectively. Differential gene expression analysis identified for each cancer type genes that were significantly up- or down-regulated in tumour samples (Fig. 1A; Supplementary Table 4 in Additional file 1). An individual gene regulatory network was built (see methods) for the 23 cancer types (Fig. 1B; Table 1). To further identify the CCGs, we intersected the critical gene nodes in the estimated networks for each cancer type with copper metabolism related genes (113-gene set; Supplementary Table 3 in Additional file 1). These critical genes are identified as they play a central role in controlling the gene networks and resultant expression alterations in these genes may transform the state of a cell from normal to pre-cancerous or malignant (Table 2).
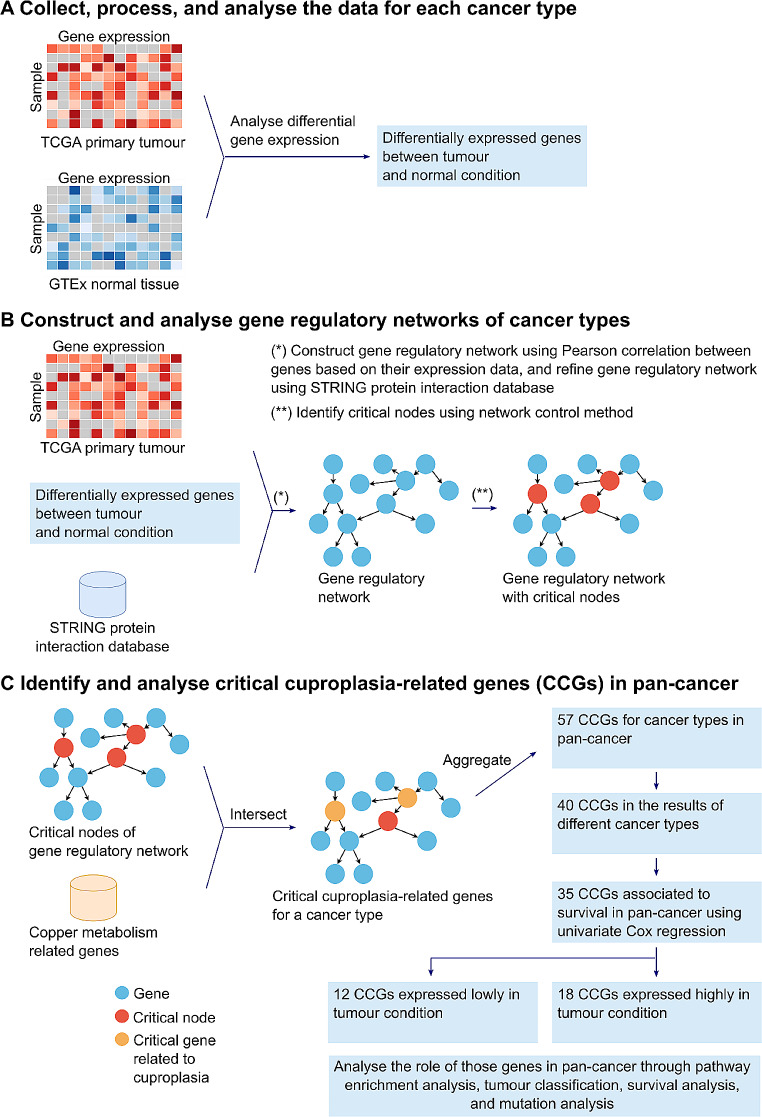
Table 1: Gene regulatory network for each cancer type specifying the number of nodes, edges and critical nodes that make up the gene regulatory network
| Cancer type | Number of nodes | Number of edges | Number of critical nodes |
|---|---|---|---|
| ACC | 2257 | 11,361 | 185 |
| AML | 4935 | 23,601 | 503 |
| BLCA | 3300 | 21,205 | 307 |
| BRCA | 4387 | 25,612 | 432 |
| COAD | 5736 | 47,240 | 581 |
| ESCA | 4177 | 21,570 | 414 |
| GBM | 5879 | 44,964 | 601 |
| KICH | 5193 | 26,799 | 522 |
| KIRC | 5057 | 33,674 | 515 |
| KIRP | 4600 | 25,811 | 474 |
| LGG | 4417 | 25,600 | 461 |
| LIHC | 2537 | 14,324 | 243 |
| LUAD | 4100 | 21,414 | 403 |
| LUSC | 5789 | 44,649 | 549 |
| OVCA | 6612 | 47,400 | 645 |
| PAAD | 4893 | 30,320 | 510 |
| PCPG | 3840 | 11,691 | 400 |
| PRAD | 3771 | 18,033 | 371 |
| SKCM | 4546 | 23,085 | 493 |
| STAD | 4077 | 23,764 | 416 |
| THCA | 3413 | 17,283 | 346 |
| UCEC | 5721 | 36,833 | 582 |
| UCS | 3492 | 12,502 | 286 |
Table 2: Critical cuproplasia-related genes identified from the gene regulatory network for each cancer type
| Cancer type | Number of CCGs | CCGs |
|---|---|---|
| ACC | 3 | CDK1, COX17, DBH |
| AML | 12 | SLC11A2, MAP1LC3A, ALB, CDK1, ANG, ANKRD9, AP1S1, ARF1, APC, TMPRSS6, GPC1, LOXL1 |
| BLCA | 4 | CDK1, ATOX1, MAPT, COX17 |
| BRCA | 13 | ALB, ARF1, CASP3, XIAP, GSK3B, AOC3, S100A12, CDK1, FOXO1, JUN, MAP1LC3A, SNCA, SORD |
| COAD | 10 | AP1S1, ALB, APP, CASP3, AOC3, CDK1, PRNP, SNCA, ATP6AP1, F5 |
| ESCA | 9 | ADAM10, ADAM17, GSK3B, CDK1, MAP1LC3A, MAPT, COA6, MT-CO2, STEAP3 |
| GBM | 10 | ALB, CYP1A1, CASP3, ANG, SNCA, MAPT, FOXO1, JUN, CP, MMGT1 |
| KICH | 7 | ALB, BACE1, CASP3, AP1B1, CDK1, TMPRSS6, FOXO1 |
| KIRC | 10 | XIAP, APP, GSK3B, CYP1A1, S100A12, PRNP, JUN, TP53, ATP7A, SP1 |
| KIRP | 8 | TMPRSS6, ALB, XIAP, APP, AP1S1, CASP3, GSK3B, CCND1 |
| LGG | 13 | XIAP, ALB, CASP3, SNCA, CDK1, ATP7A, MT-CO1, CP, CYP1A1, F5, MAP1LC3A, SP1, TP53 |
| LIHC | 4 | CDK1, AP1S1, COA6, PRND |
| LUAD | 8 | AANAT, CYP1A1, CDK1, DBH, AP1S1, AQP1, MT1X, TP53 |
| LUSC | 8 | GSK3B, CYP1A1, MAP1LC3A, JUN, IL1A, SPATA5, SORD, TP53 |
| OVCA | 13 | AP1S1, TMPRSS6, ALB, CASP3, GSK3B, CDK1, SNCA, MT-CO2, COA6, COMMD1, COX17, MT-CO1, SLC11A2 |
| PAAD | 11 | TMPRSS6, ADAM10, APP, BACE1, ALB, CDK1, CASP3, GPC1, F5, F8, SUMF1 |
| PCPG | 10 | AP1S1, AOC3, APP, MAPT, SNCA, CDK1, ATP7A, MAP1LC3A, COX17, GPC1 |
| PRAD | 7 | ALB, ARF1, APP, AP1S1, CDK1, MAPT, XAF1 |
| SKCM | 10 | TMPRSS6, ALB, CDK1, SNCA, MAPT, JUN, MAP1LC3A, HEPH, IL1A, MT1X |
| STAD | 6 | ALB, CDK1, AP1S1, JUN, SP1, SORD |
| THCA | 10 | MAP1LC3A, XIAP, CYP1A1, ALB, CDK1, ATP6AP1, COA6, GSK3B, MT-CO1, TMPRSS6 |
| UCEC | 12 | AP1S1, CASP3, CDK1, AQP1, PARK7, MAPT, XAF1, PRNP, COX17, TP53, SNCA, PRND |
| UCS | 3 | AP1S1, FOXO1, LCAT |
Next, we applied this method to each cancer type and identified the critical cuproplasia-related genes in pan-cancer. We aggregated all the identified CCGs in the 23 cancer types into a single set and removed duplicated genes, resulting in 57 genes (Supplementary Table 5 in Additional file 1, Fig. 1C). Of these 40 genes occurred in multiple cancer types (Fig. 1C). From these genes, we identified ATOX1, which is known to play a functional role as antioxidant against superoxide and hydrogen peroxide (O’Leary et al. ref. 2016) and may play a significant role in cancer carcinogenesis (O’Leary et al. ref. 2016). Furthermore, we identified CCND1, which encodes the protein belonging to the highly conserved cyclin family. Notably, mutations and overexpression of CCND1 alter cell cycle progression and are observed frequently in a variety of human cancers (O’Leary et al. ref. 2016). In addition, CYP1A1 encodes a member of the cytochrome P450 superfamily of enzymes and is associated with lung cancer (O’Leary et al. ref. 2016). CYP1A1 is identified as a CCG in both lung adenocarcinoma (LUAD) and lung squamous cell carcinoma (LUSC), reaffirming our methodology to identify CCGs. We sought to further refine the list of CCGs to identify a potential specific subset of genes whose expression may be prognostic of pan-cancer survival. Univariate Cox proportional hazards regression model based on the 40 genes revealed that 35 genes were significantly associated with survival (p < 0.05; Fig. 1C; Supplementary Table 5 in Additional file 1). Of these 18 genes were up-regulated and 12 down-regulated in tumours compared to matched normal tissue expression (Figs. 1C and 2A; Supplementary Table 5 in Additional file 1). A gene was considered as up-regulated/ down-regulated if it was significantly up-regulated/ down-regulated in most cancer types for which it was identified as a CCG. Unsurprisingly, enrichment analysis showed that the 30 CCGs were involved in biological processes and molecular function related to copper homeostasis, binding and cellular response to copper ions (Fig. 2B). Furthermore, pathway enrichment confirmed the relationship with these genes appearing in pathways in cancer and importantly significantly associated with colorectal and breast cancer (Fig. 2B). These findings confirm the association between the identified CCGs to the progression of cancer and cuproplasia in cancer. Importantly, these results confirm that utilising gene regulatory networks is a powerful methodology to identify novel gene-sets impacting disease.
Cuproplasia-related gene signature predicts patient survival
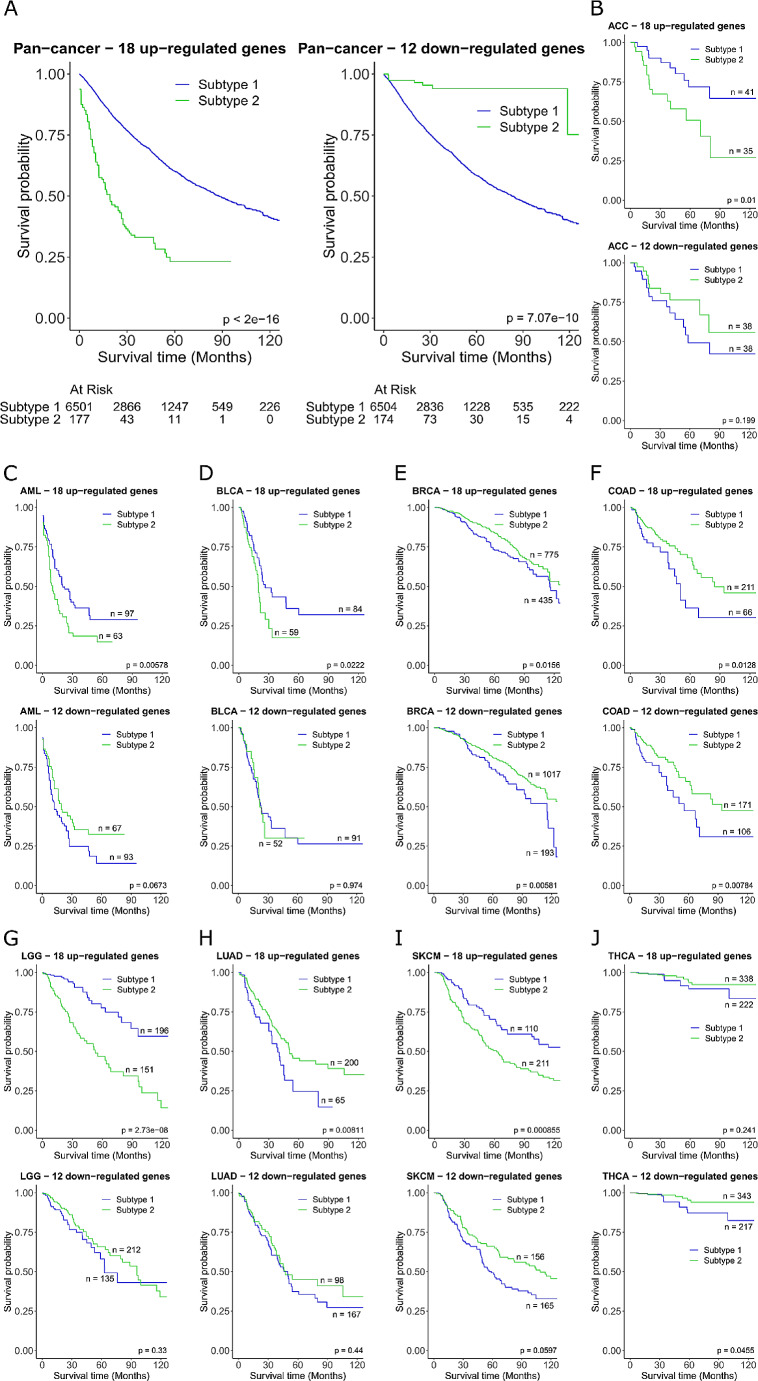
From the gene regulatory network, we created to identify the CCGs, we wanted to determine if the 30 genes could be utilised as potential biomarkers to predict tumour prognosis. To explore this concept further, the 18 up-regulated and 12 down-regulated genes described above (Fig. 2A) were used separately to stratify pan-cancer patients to see if tumour expression profiles inferred a better prognostic outcome. We analysed the 18 up-regulated genes and 12 down-regulated genes independently. Euclidean distance of patients based on the gene expression signature was used for spectral clustering to dichotomise patients into subtype 1 and subtype 2, with the patients in each subtype having similar expression profiles of the gene set. A significant decrease in survival (P < 2e-16) was observed in subtype 2 compared to subtype 1 using the up-regulated genes, and significant increase in survival (P = 7.07e-10) using the down-regulated genes (Fig. 3A). The same approach was then applied individually to the 23 cancer types (Fig. 3B-J, Supplementary Fig. 1 in Additional file 2). Cancer type specific survival analysis was only significant for the 18 gene up-regulated signature in ACC, AML, BLCA, BRCA, COAD, LGG, LUAD, and SKCM, and significant in the 12 gene down-regulated signature in BRCA, COAD, and THCA (Fig. 3B-J). Taken together this shows that the identified gene signatures are only predictive of survival for a subset of cancer types even though the signature can be applied in pan-cancer. However, these results indicate that CCG-related signatures offer a novel tumour classification method in cancer patients, with prognostic power and have the potential to be used as biomarkers.
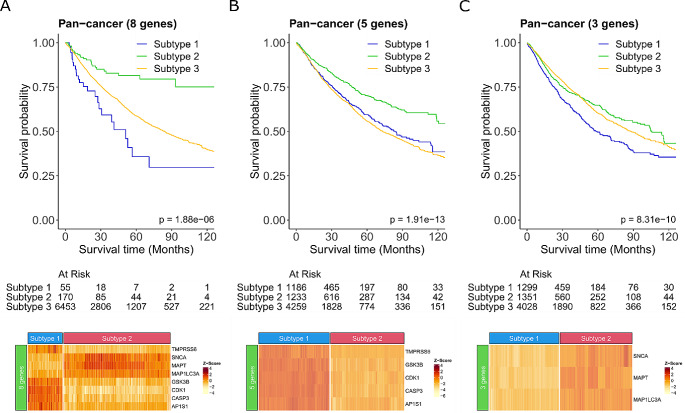
Our initial approach dichotomised patients into two subgroups dependent on the similarity of either the 18 up-regulated or 12 down-regulated CCG-related signatures to infer survival. However, the expression profiles of the CCG-related genes for the two subgroups of patients were not consistent with the expected directionality of gene expression level (Supplementary Fig. 2 in Additional file 2). Therefore, to further understand the relationship of the 30 CCGs identified and survival for use as a potential prognostic biomarker, we needed to further refine the signature to identify those genes that are consistent with the primary tumour expression. We combined the 18 up-regulated and 12 down-regulated genes to identify the specific expression dependent gene combination that most contributes to survival pan-cancer. Tumours were annotated for each of the 30 genes as having either high or low expression using the median expression value across the cohort as the threshold. This resulted in a refined 8 gene pan-cancer specific signature that significantly improved survival (P = 1.88e-06; Fig. 4A). Patients whose tumour had high expression of MAP1LC3A, SNCA, and MAPT and low expression of CDK1, AP1S1, CASP3, TMPRSS6, and GSK3B inferred better overall survival than all other patients (Fig. 4A). Conversely patients who had low expression of MAP1LC3A, SNCA, and MAPT and high expression of CDK1, AP1S1, CASP3, TMPRSS6, and GSK3B, had the poorest overall survival. Further separating the genes into the 5 highly expressed and 3 lowly expressed genes also showed a significant improvement in survival (P = 1.91e-13 and P = 8.31e-10, respectively), however, resulted in poorer survival probability than the combined 8 gene signature (Fig. 4A-C). Based on these findings it is the combination of the 3 down-regulated and 5 up-regulated genes together that make up this novel signature that is more predictive of survival. Thus, our novel 8-gene CCGs could potentially be used to stratify patients prognostically regardless of cancer type. Additionally, we also used sigQC (Dhawan et al. ref. 2019) to systematically evaluate this 8-gene signature (Supplementary Fig. 3 in Additional File 2). The results showed the compactness (i.e., low intra-signature correlation), large proportion of samples with high expression, and variability of the signature genes, indicating the high quality of the gene signature. With the low scoring metrics based on PCA1, mean, and median of the expression of the signature genes, we may not summarise the signature as a single score.
Mutations in critical cuproplasia-related genes are associated with poorer survival
Next, we wanted to observe the impact of mutations on the identified 30 CCGs. Using the TCGA mutation data for the 30 genes we extracted the SNVs and the CNVs for each of the patients across all the cancer types. SNVs were further filtered (see methods) to identify only those mutations that have previously been annotated as pathogenic and thus more likely to be deleterious. A pathogenic mutation was observed in 22 of the CCGs, and only present in 18 of the 23 cancer types analysed (Fig. 5A). Mutations in ATP7A and CP occurred the most frequently, with the highest number of pathogenic mutations occurring in UCEC (Fig. 5A). Mutations were exclusively either missense or nonsense mutations, with some patient samples having more than one SNV in the same gene (Fig. 5B). The mutations predominantly occurred within protein domains and for the top 10 most highly mutated genes, there was no single mutation present but rather span the protein coding region of the entire gene (Supplementary Fig. 4 in Additional file 2). Expanding mutation analysis to include CNVs within the 29 CCGs (MT-CO1 was excluded due to missing data), there was a degree of copy number change observed across all cancer types (Fig. 5C). MAP1LC3A, AQP1, and AP1S1 were consistently amplified across cancer types whilst XAF1, CASP3, and SNCA exhibited copy deletions.
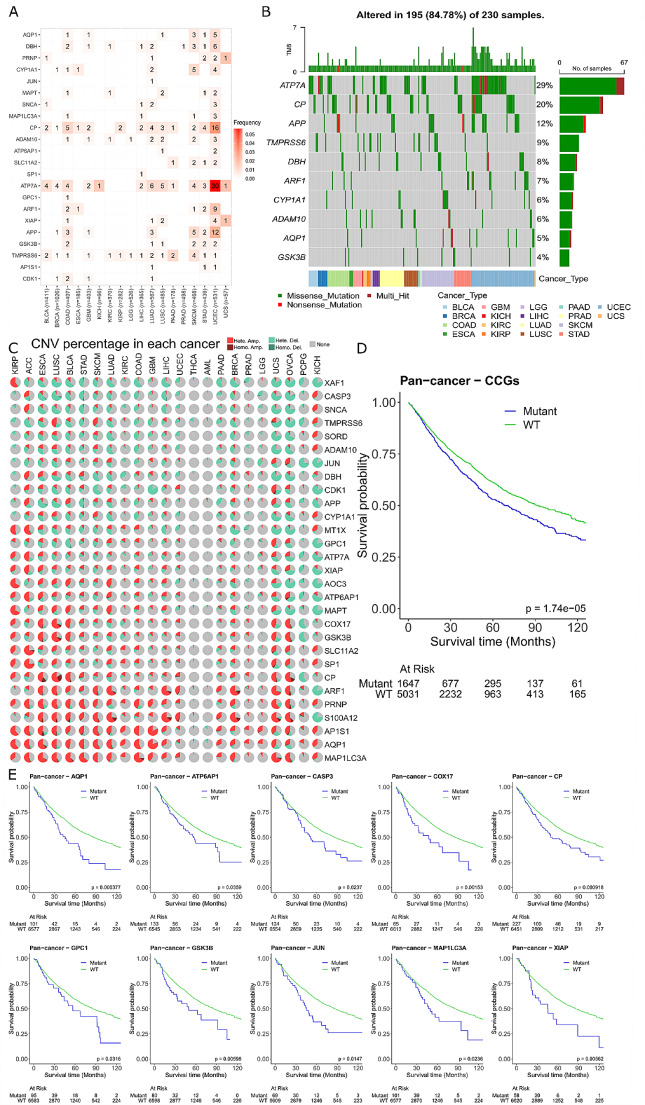
We combined the identified pathogenic SNV and homozygous deletions and amplifications of CNV data together to further understand how the presence of a mutation in the CCGs impacts patient survival. Patients were classified as either mutant or wild type (WT) for at least one of the 30 CCGs and revealed that those patients with a mutation had significantly poorer overall survival (P = 1.74e-05; Fig. 5D). We further separated the survival analysis into individual genes to understand if poorer survival was influenced by a specific gene. We found that 10 genes were significantly associated with poorer survival when a mutation was present (Fig. 5E) and had no effect on survival in 19 genes (Supplementary Fig. 5 in Additional file 2) (MT-CO1 was excluded due to missing data). Of the 10 significant genes associated with survival, it is important to note that only 3 of these genes (MAP1LC3A, GSK3B and CASP3) were identified in the novel 8-gene signature we identified previously (Fig. 4). Taken together this shows the utility of utilising a gene regulatory network to identify CCGs that are associated with survival pan-cancer, and a comprehensive genomic analysis of both mutations and expression is required.
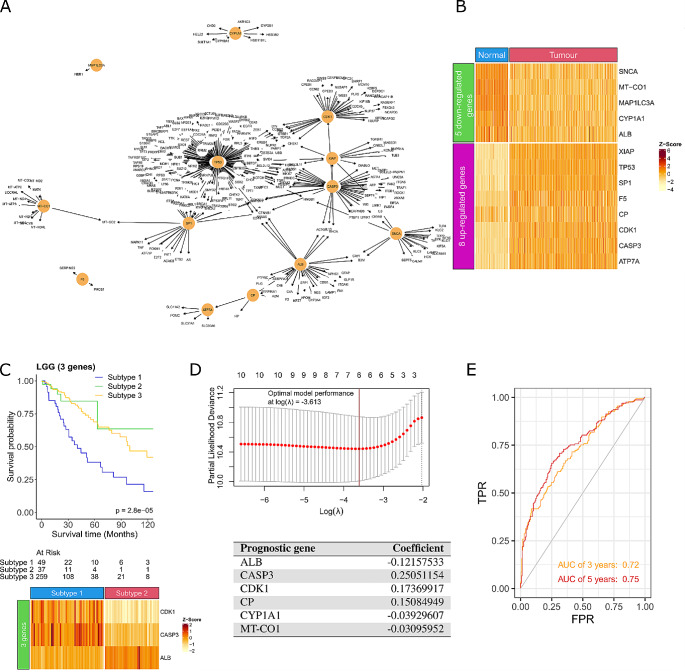
Critical cuproplasia-related genes identify a prognostic risk model for low Grade Glioma
As we showed previously (Fig. 3) whilst the pan-cancer survival analysis of the 30 CCGs showed improved survival, it was only predictive in a subset of cancer types. Therefore, we wanted to apply the same gene regulatory network method developed in Fig. 1 and focus solely on low grade glioma (LGG). We chose to explore LGG as the survival difference of LGG patient subgroups clustered using the 18 up-regulated CCGs was significant (P = 2.73e-8; Fig. 3G) and it is a cancer type already recognised to be impacted by intracellular copper levels (Chen et al. ref. 2022). The LGG gene regulatory network identified an initial 4,417 nodes and 25,600 edges, of which 461 were identified as critical nodes in the network. Intersecting the critical nodes with the 133-copper metabolism related genes (Supplementary Table 3 in Additional file 1) identified a network consisting of 13 CCGs (Fig. 6A). Of these, 8 genes were up-regulated (XIAP, TP53, SP1, F5, CP, CDK1, CASP3, and ATP7A) and 5 genes were down-regulated (SNCA, MT-CO1, MAP1LC3A, CYP1A1, and ALB) in LGG samples compared to matched normal brain tissue (Fig. 6B). Interestingly, CASP3 and CYP1A1 were previously identified to be related to glioma and used to predict the survival for glioma patients (Chao et al. ref. 2022; Liu et al. ref. 2022b), the high expression of CDK1 is associated with the malignant progression in glioma (Chen et al. ref. 2007; Teng et al. ref. 2022), and mutations in MT-CO1 contribute to brain tumours (Kaneva et al. ref. 2021). We further refined this list to identify a LGG specific biomarker signature that is predictive of response. A 3-gene signature (2 up-regulated CDK1, CASP3 and 1 down-regulated ALB) was identified, and patients who had high expression of ALB and low expression of CDK1 and CASP3 had significantly better survival (P = 2.8e-05; Fig. 6C). We also verified this signature on another dataset (i.e., CGGA) (Supplementary Fig. 6 in Additional file 2). Interestingly, we discovered that the signature worked in the expected manner (i.e., the signature could be used to classify LGG patients into different groups with significant difference in survival). Next, we wanted to see if we could generate a risk prediction model from the 13 CCGs to predict survival in LGG patients. Univariate Cox regression was applied to the 13 genes and identified 10 genes as potential risk factors related to survival (P < 0.05; Supplementary Table 6 in Additional file 1). LASSO regression was then applied to the 10 significant genes which identified ALB, CASP3, CDK1, MT-CO1, CP, and CYP1A1 as prognostic (Fig. 6D). The optimal model performance was achieved with these 6 genes, implying that these genes can be used to build the risk score model (Fig. 6D). We validated the risk score model on another dataset from the Chinese Glioma Genome Atlas (CGGA), resulting in an area under the curve value of 0.72 after 3 years and 0.75 after 5 years (Fig. 6E). Importantly, the 3-gene signature identified are also prognostic in the risk score model (CDK1, CASP3 and ALB). Taken together, the validation dataset provides the supporting evidence that the 6 identified CCGs in LGG has the potential to be a prognostic biomarker for LGG patients.
Discussion
In this study, a novel framework based on gene regulatory networks was proposed to evaluate cuproplasia-related genes across 23 cancer types. Utilising publicly available data from TCGA primary tumours, we constructed a gene regulatory network. This identified 30 CCGs that were enriched in pathways involved in cancer progression, immune evasion and apoptosis. As the identified CCGs play critical roles in cancer development, these genes could be used as potential biomarkers for tumour classification. Therefore, survival analysis identified a refined novel 8-gene signature significantly associated with prognosis. As copper is a well-known micronutrient which is essential for the metabolism of cancer cells and the role of copper in LGG has been previously reported (Bao et al. ref. 2022), we applied our methodology to LGG and identified a risk score model consisting of 6 cuproplasia-related genes to be predictive of survival. Understanding the role of copper and cuproplasia in cancer development is important for selecting patients who can benefit from copper chelation therapy and designing novel and effective combination treatments to reduce drug resistance. We can then utilise this knowledge to design suitable treatment plans for patients to maximise their treatment outcomes.
The novel 8-gene signature we identified consisted of CDK1, AP1S1, CASP3, MAP1LC3A, SNCA, TMPRSS6, MAPT, and GSK3B. Although these genes are known for their important roles in various malignancies and are associated with poor survival (Guven et al. ref. 2021; Huang et al. ref. 2011; Liu et al. ref. 2022a; Mete et al. ref. 2020; Sofi et al. ref. 2022; Zheng et al. ref. 2022; Zhou et al. ref. 2022), this is the first paper indicating their connection with the dysregulation of copper levels in cancer patients. It is important to highlight that our identified CCGs have been confirmed to be involved in a wide range of biological processes supporting tumour progression and immune evasion processes. The specific processes related to the identified CCGs include autophagy, cell cycle regulation, cell proliferation, kinase signalling pathways, immune infiltration and immune checkpoint regulation.
Copper has been previously demonstrated as an essential regulator of autophagy, specifically regulating autophagic kinase activity. This self-degradation process in which the cell recycles cytoplasmic constituents has been previously linked to cancer formation and progression. Here, we further strengthen the link between copper and autophagy with our gene-signature highlighting MAP1L3CA, CDK1, CASP3 and SNCA, all of which possess involvement in autophagic processes. Importantly, SNCA has also been shown to play a potential role in pathological processes in lung adenocarcinoma (Zhang et al. ref. 2022), ovarian cancer (Bruening et al. ref. 2000), breast cancer (Bruening et al. ref. 2000), colorectal tumour (Ye et al. ref. 2010), melanoma (Turriani et al. ref. 2017), and brain cancer (Kawashima et al. ref. 2000), highlighting the strength of this gene-signature across distinct tumour types. Kinase signalling pathways play a large role in nearly all cellular processes, and copper has a documented strong influence on these pathways. Our gene-signature also reflects this influence, with CDK1 dysregulation a hallmark of cell cycle dysregulation, and GSK3B dysregulation observed in homeostatic dysfunction, both of which constitute key hallmarks of malignancies. In particular, the abnormal expression and activity of GSK3B has been demonstrated to influence metabolic and immune evasion signalling. Specifically, recent investigations demonstrated that activation of AKT by EGFR suppresses GSK3B activity through Ser9 phosphorylation and this induced PD-L1 destabilization (Li et al. ref. 2016). Consistently, we previously demonstrated that copper chelation therapy inhibited GSK3B phosphorylation and in turn induced downregulation of PD-L1 and increased anti-cancer immune response (Rouaen et al. ref. 2022; Voli et al. ref. 2020). In regards to immune processes, high expression of AP1S1 in tumours was negatively correlated with immune infiltrating cells (Zheng et al. ref. 2022), and low expression of SNCA was correlated to low levels of immune infiltration (Zhang et al. ref. 2022), indicating that these genes play a key role in the anti-cancer immune response and immune evasion mechanism. AP1S1 also plays a crucial role in clathrin coat assembly and mediates trafficking between the trans-Golgi network, endosomes and the plasma membrane. AP1S1 has an important role in regulating copper accumulation and homeostasis in cells (Martinelli et al. ref. 2013). CASP3 is a key mediator of apoptosis during cellular exposure to cytotoxic drugs, radiotherapy, or immunotherapy (Zhou et al. ref. 2018). Given the important roles of these genes in tumour formation and development, the use of therapeutic strategies targeting copper could have a strong effect on these genes and improve the prognosis of patients affected by different types of tumours.
According to our findings, cancer patients with low expression of MAP1LC3A, SNCA, and MAPT and high expression of CDK1, AP1S1, CASP3, TMPRSS6, and GSK3B have poor overall survival while patients with high expression of MAP1LC3A, SNCA, and MAPT and low expression of CDK1, AP1S1, CASP3, TMPRSS6, and GSK3B have good overall survival. Thus, we may improve the survival chance of patients with low expression of MAP1LC3A, SNCA, and MAPT and high expression of CDK1, AP1S1, CASP3, TMPRSS6, and GSK3B if we can control the expression of these genes.
Copper chelation therapy was developed to treat Wilson’s disease which is a genetic disease with an excess accumulation of copper in liver and brain. In our previous studies, we discovered that copper chelation therapy may result in regulating the expression of genes. For example, copper chelation downregulates transcriptomic expression of EMT markers and transcription factors in cancer cell lines (Poursani et al. ref. 2023), or copper chelation therapy inhibited GSK3B phosphorylation and in turn induced downregulation of PD-L1 and increased anti-cancer immune response (Rouaen et al. ref. 2022; Voli et al. ref. 2020). Thus, we may use copper chelation therapy and/or other therapies to target the signature genes to regulate their expression in cancer patients. As a result, by using our signature we can select patients to be treated with copper chelation therapy to maximise their potential beneficial effects in term of improved survival.
Our study proposed a novel network-based method for identifying cuproplasia-related gene signatures for cancer patients, and our main analyses were for pan-cancer. However, since cancer types have different morphologies and clinical outcomes, they might have different causes and gene signatures. Additionally, our method can be applied to other datasets or a specific cancer type. In particular, we have chosen LGG as it is a diverse group of primary brain tumours that often arise in young patients and generally have an indolent course with longer-term survival in comparison with high-grade gliomas and other aggressive cancer types. Thus, besides the pan-cancer signature, we also applied our method to the data of LGG patients for identifying a gene signature which was for them, illustrating the capability and flexibility of our proposed method in the application.
As a result, the pan-cancer signature included 8 genes CDK1, AP1S1, CASP3, MAP1LC3A, SNCA, TMPRSS6, MAPT, and GSK3B, and the LGG signature included 3 genes CDK1, CASP3, and ALB. It is understandable that the pan-cancer signature does not include all the genes of the LGG signature, because some genes may play critical roles in a specific cancer type such as LGG but in the context of pan-cancer, they may not be as important as other genes. However, as you can see in the results there are two genes (i.e., CDK1 and CASP3) which are in the signatures of both pan-cancer and LGG, indicating that these two genes are important not only in LGG but also in other cancer types.
Since our proposed method used the gene expression data of patients from 23 cancer types, the identified pan-cancer signature included the information of these cancer types. However, due to the imbalance of the number of patients among the cancer types, a potential bias might occur in the results. We examined this issue by reducing the prevalence of breast cancer samples (i.e., we only used a half number of breast cancer patients, including 606/1212 randomly selected patients), and we identified a new signature including 7 genes CDK1, AP1S1, CASP3, MAP1LC3A, SNCA, MAPT, and GSK3B (Supplementary Fig. 7 in Additional file 2). In general, this signature was similar to the previous one, and these 7 genes were included in the 8-gene signature. Furthermore, the new signature can also be used to cluster patients into different groups with significant difference in survival. Thus, although the potential bias might be not significant with the prevalence of samples in some cancer type, to minimise the bias when using our proposed method, we may need to consider having a balance of the number of samples among cancer types.
Another limitation of our proposed method is that we used the STRING protein interaction database to construct gene regulatory networks for each of the 23 cancer types. We wanted to include only interactions which occurred between proteins as they were the most translatable interactions to pathway signalling. However, this selection might eliminate potential interactions that may occur such as RNA-RNA interactions since not all RNAs is translated to protein expression. As a future work for improving our proposed method, instead of using the STRING protein interactions only we may consider including both protein-protein interactions and RNA-RNA interactions for building gene regulatory networks.
Conclusions
In this paper, we conducted for the first time a comprehensive pan-cancer analysis for genes involved in cuproplasia using a novel framework. An 8-gene signature related to cuproplasia was identified as a potential biomarker for predicting cancer patients’ survival. These findings provide novel insights into the effects of genes involved in cuproplasia on the molecular regulatory mechanisms of cancer development. Furthermore, the identified cuproplasia-related genes can be used by clinicians to understand which patients can benefit from using copper chelation therapy and identify novel combinatorial therapeutic strategies.
Supplementary Materials
- Additional file 1. Supplementary table 1 The 23 cancer types utilised in our analysis with corresponding number of samples obtained from TCGA (‘TCGA primary tumour’) and GTEx (‘GTEx normal tissue’). Supplementary Table 2. Copper related gene sets from the Molecular Signatures Database. Supplementary Table 3. 133-gene list of copper-metabolism related genes. Supplementary Table 4. Numbers of differentially expressed genes (DEGs) in cancer types. Supplementary Table 5. Sets of critical cuproplasia-related genes. Supplementary Table 6. Univariate Cox regression analysis for 13 CCGs identified in LGG. (XLSX)
- Additional file 2. Supplementary Fig. 1 Survival curves for patient groups identified by using critical cuproplasia-related genes (CCGs). The survival analysis has been done by using the 18 up-regulated CCGs and the 12 down-regulated CCGs for each cancer type. The survival curves are presented in (A) ESCA, (B) GBM, (C) KICH, (D) KIRC, (E) KIRP, (F) LIHC, (G) LUSC, (H) OVCA, (I) PAAD, (J) PCPG, (K) PRAD, (L) STAD, (M) UCEC, and (N) UCS. Supplementary Fig. 2. Expression profiles of CCG-related genes. Heatmap of the (A) 18 up-regulated and (B) 12 down-regulated genes of patients as classified by Euclidean distances using gene expression values into 2 groups. Supplementary Fig. 3. Systematic evaluation of cuproplasia-related pan-cancer gene signature using sigQC. The radar plot in the centre shows the summary of the evaluation for the cuproplasia-related pan-cancer gene signature. The outer ring includes plots used to evaluate for standardisation, scoring metrics, compactness (i.e., intra-signature correlation), signature gene expression, and variability of the signature genes. These plots are located around the radar plot and are summarised by numeric values on the radar plot. The radar plot illustrates all the metrics of the signature in the pan-cancer dataset. Supplementary Fig. 4. Mutation location of the top 10 mutated genes. Lollipop diagram for the top 10 genes with the most pathogenic single nucleotide variants (SNVs). (A)ATP7A, (B), CP, (C)APP, (D)TMPRSS6, (E)DBH, (F)ARF1, (G)CYP1A1, (H)ADAM10, (I)AQP1, and (J)GSK3B. The x-axis is the amino acid location with the corresponding protein domains annotated. The y-axis is the number of mutations. The colours of the circles correspond to the type of mutation (Missense; green, Nonsense; red). The number beside the variant classification indicates the total number of mutations. Supplementary Fig. 5. Survival analysis of mutant CCGs pan-cancer. (A) ADAM10, (B) AOC3, (C) AP1S1, (D) APP, (E) ARF1, (F) ATP7A, (G) CDK1, (H) CYP1A1, (I) DBH, (J) MAPT, (K) MT1X, (L) PRNP, (M) S100A12, (N) SLC11A2, (O) SNCA, (P) SORD, (Q) SP1, (R) TMPRSS6, and (S) XAF1. Supplementary Fig. 6. Cuproplasia-related LGG gene signature in the CGGA dataset Survival curve (A) and gene expression heatmap (B) for the 3-gene signature most predictive of survival. Subtype 1 patients have high expression of CDK1 and CASP3 and low expression of ALB. Subtype 2 patients have low expression of CDK1 and CASP3 and high expression of ALB. Subtype 3 are all other patients. Supplementary Fig. 7. Cuproplasia-related gene signatures as potential biomarkers for survival prediction. Survival curves (top) and gene expression heatmaps (bottom) for cancer patients with (A) 8-gene signature when using the data of all pan-cancer patients, consisting of CDK1, AP1S1, CASP3, MAP1LC3A, SNCA, TMPRSS6, MAPT, and GSK3B. Subtype 1 are patients with low expression of MAP1LC3A, SNCA, and MAPT and high expression of CDK1, AP1S1, CASP3, TMPRSS6, and GSK3B. Subtype 2 are patients with high expression MAP1LC3A, SNCA, and MAPT and low expression of CDK1, AP1S1, CASP3, TMPRSS6, and GSK3B. Subtype 3 are all other patients. (B) 7-gene signature when using the data of pan-cancer patients and a half number of breast cancer patients only, consisting of CDK1, AP1S1, CASP3, MAP1LC3A, SNCA, MAPT, and GSK3B. Subtype 1 are patients with low expression of MAP1LC3A, SNCA, and MAPT and high expression of CDK1, AP1S1, CASP3, and GSK3B. Subtype 2 are patients with high expression MAP1LC3A, SNCA, and MAPT and low expression of CDK1, AP1S1, CASP3, and GSK3B. Subtype 3 are all other patients. (PDF)
References
- JH Bao, WC Lu, H Duan, YQ Ye, JB Li, WT Liao, YC Li, YP Sun. Identification of a novel cuproptosis-related gene signature and integrative analyses in patients with lower-grade gliomas. Front Immunol, 2022. [DOI | PubMed]
- P Blanche, JF Dartigues, H Jacqmin-Gadda. Estimating and comparing time-dependent areas under receiver operating characteristic curves for censored event times with competing risks. Stat Med, 2013. [DOI | PubMed]
- W Bruening, BI Giasson, AJ Klein-Szanto, VM Lee, JQ Trojanowski, AK Godwin. Synucleins are expressed in the majority of breast and ovarian carcinomas and in preneoplastic lesions of the ovary. Cancer, 2000. [DOI | PubMed]
- B Chao, F Jiang, H Bai, P Meng, L Wang, F Wang. Predicting the prognosis of glioma by pyroptosis-related signature. J Cell Mol Med, 2022. [DOI | PubMed]
- H Chen, Q Huang, DZ Zhai, J Dong, AD Wang, Q Lan. [CDK1 expression and effects of CDK1 silencing on the malignant phenotype of glioma cells]. Zhonghua Zhong Liu Za Zhi, 2007. [PubMed]
- EY Chen, CM Tan, Y Kou, Q Duan, Z Wang, GV Meirelles, NR Clark, A Ma’ayan. Enrichr: interactive and collaborative HTML5 gene list enrichment analysis tool. BMC Bioinformatics, 2013. [DOI | PubMed]
- B Chen, X Zhou, L Yang, H Zhou, M Meng, L Zhang, J Li. A cuproptosis activation scoring model predicts neoplasm-immunity interactions and personalized treatments in glioma. Comput Biol Med, 2022. [DOI | PubMed]
- P de Bie, P Muller, C Wijmenga, LW Klomp. Molecular pathogenesis of Wilson and Menkes disease: correlation of mutations with molecular defects and disease phenotypes. J Med Genet, 2007. [DOI | PubMed]
- A Dhawan, A Barberis, W-C Cheng, E Domingo, C West, T Maughan, JG Scott, AL Harris, FM Buffa. Guidelines for using sigQC for systematic evaluation of gene signatures. Nat Protoc, 2019. [DOI | PubMed]
- J Friedman, T Hastie, R Tibshirani. Regularization paths for generalized Linear models via Coordinate Descent. J Stat Softw, 2010. [DOI | PubMed]
- EJ Ge, AI Bush, A Casini, PA Cobine, JR Cross, GM DeNicola, QP Dou, KJ Franz, VM Gohil, S Gupta, SG Kaler, S Lutsenko, V Mittal, MJ Petris, R Polishchuk, M Ralle, ML Schilsky, NK Tonks, LT Vahdat, L Van Aelst, D Xi, P Yuan, DC Brady, CJ Chang. Connecting copper and cancer: from transition metal signalling to metalloplasia. Nat Rev Cancer, 2022. [DOI | PubMed]
- MJ Goldman, B Craft, M Hastie, K Repečka, F McDade, A Kamath, A Banerjee, Y Luo, D Rogers, AN Brooks, J Zhu, D Haussler. Visualizing and interpreting cancer genomics data via the Xena platform. Nat Biotechnol, 2020. [DOI | PubMed]
- X Guan, N Lu, J Zhang. The combined prognostic model of copper-dependent to predict the prognosis of pancreatic cancer. Front Genet, 2022. [DOI | PubMed]
- M Guven, M Mete, DC Trabulus, E Ozoran, D Erhan. Association of TMPRSS6 polymorphisms with hematologic parameters, histopathological data and breast cancer risk in Turkish population. Meta Gene, 2021. [DOI]
- Q Huang, F Li, X Liu, W Li, W Shi, FF Liu, B O’Sullivan, Z He, Y Peng, AC Tan, L Zhou, J Shen, G Han, XJ Wang, J Thorburn, A Thorburn, A Jimeno, D Raben, JS Bedford, CY Li. Caspase 3-mediated stimulation of tumor cell repopulation during cancer radiotherapy. Nat Med, 2011. [DOI | PubMed]
- NM Ioannidis, JH Rothstein, V Pejaver, S Middha, SK McDonnell, S Baheti, A Musolf, Q Li, E Holzinger, D Karyadi, LA Cannon-Albright, CC Teerlink, JL Stanford, WB Isaacs, J Xu, KA Cooney, EM Lange, J Schleutker, JD Carpten, IJ Powell, O Cussenot, G Cancel-Tassin, GG Giles, RJ MacInnis, C Maier, CL Hsieh, F Wiklund, WJ Catalona, WD Foulkes, D Mandal, RA Eeles, Z Kote-Jarai, CD Bustamante, DJ Schaid, T Hastie, EA Ostrander, JE Bailey-Wilson, P Radivojac, SN Thibodeau, AS Whittemore, W Sieh. REVEL: an Ensemble Method for Predicting the pathogenicity of rare missense variants. Am J Hum Genet, 2016. [DOI | PubMed]
- Y Jiang, Z Huo, X Qi, T Zuo, Z Wu. Copper-induced tumor cell death mechanisms and antitumor theragnostic applications of copper complexes. Nanomed (Lond), 2022. [DOI]
- K Kaneva, K O’Halloran, P Triska, X Liu, D Merkurjev, M Bootwalla, A Ryutov, JA Cotter, D Ostrow, JA Biegel, X Gai. The spectrum of mitochondrial DNA (mtDNA) mutations in pediatric CNS tumors. Neurooncol Adv, 2021. [DOI | PubMed]
- M Kawashima, SO Suzuki, K Doh-ura, T Iwaki. Alpha-synuclein is expressed in a variety of brain tumors showing neuronal differentiation. Acta Neuropathol, 2000. [DOI | PubMed]
- MV Kuleshov, MR Jones, AD Rouillard, NF Fernandez, Q Duan, Z Wang, S Koplev, SL Jenkins, KM Jagodnik, A Lachmann, MG McDermott, CD Monteiro, GW Gundersen, A Ma’ayan. Enrichr: a comprehensive gene set enrichment analysis web server 2016 update. Nucleic Acids Res, 2016. [DOI | PubMed]
- C-W Li, S-O Lim, W Xia, H-H Lee, L-C Chan, C-W Kuo, K-H Khoo, S-S Chang, J-H Cha, T Kim, JL Hsu, Y Wu, J-M Hsu, H Yamaguchi, Q Ding, Y Wang, J Yao, C-C Lee, H-J Wu, AA Sahin, JP Allison, D Yu, GN Hortobagyi, M-C Hung. Glycosylation and stabilization of programmed death ligand-1 suppresses T-cell activity. Nat Commun, 2016. [DOI | PubMed]
- L Li, L Li, Q Sun. High expression of cuproptosis-related SLC31A1 gene in relation to unfavorable outcome and deregulated immune cell infiltration in breast cancer: an analysis based on public databases. BMC Bioinformatics, 2022. [DOI | PubMed]
- A Liberzon, C Birger, H Thorvaldsdóttir, M Ghandi, JP Mesirov, P Tamayo. The Molecular signatures database (MSigDB) hallmark gene set collection. Cell Syst, 2015. [DOI | PubMed]
- Y-Y Liu, J-J Slotine, A-L Barabási. Controllability of complex networks. Nature, 2011. [DOI | PubMed]
- X Liu, Y Wang, H Ji, K Aihara, L Chen. Personalized characterization of diseases using sample-specific networks. Nucleic Acids Res, 2016. [DOI | PubMed]
- C-J Liu, F-F Hu, M-X Xia, L Han, Q Zhang, A-Y Guo. GSCALite: a web server for gene set cancer analysis. Bioinformatics, 2018. [DOI | PubMed]
- X Liu, Y Li, Z Qian, Z Sun, K Xu, K Wang, S Liu, X Fan, S Li, Z Zhang, T Jiang, Y Wang. A radiomic signature as a non-invasive predictor of progression-free survival in patients with lower-grade gliomas. NeuroImage: Clin, 2018. [DOI | PubMed]
- Liu X, Wu H, Liu Z (2022a) An Integrative Human Pan-cancer Analysis of Cyclin-Dependent Kinase 1 (CDK1). Cancers (Basel) 14. 10.3390/cancers14112658
- Y Liu, J Xiang, Y Liao, G Peng, C Shen. Identification of tryptophan metabolic gene-related subtypes, development of prognostic models, and characterization of tumor microenvironment infiltration in gliomas. Front Mol Neurosci, 2022. [DOI | PubMed]
- J Lonsdale, J Thomas, M Salvatore, R Phillips, E Lo, S Shad, R Hasz, G Walters, F Garcia, N Young, B Foster, M Moser, E Karasik, B Gillard, K Ramsey, S Sullivan, J Bridge, H Magazine, J Syron, J Fleming, L Siminoff, H Traino, M Mosavel, L Barker, S Jewell, D Rohrer, D Maxim, D Filkins, P Harbach, E Cortadillo, B Berghuis, L Turner, E Hudson, K Feenstra, L Sobin, J Robb, P Branton, G Korzeniewski, C Shive, D Tabor, L Qi, K Groch, S Nampally, S Buia, A Zimmerman, A Smith, R Burges, K Robinson, K Valentino, D Bradbury, M Cosentino, N Diaz-Mayoral, M Kennedy, T Engel, P Williams, K Erickson, K Ardlie, W Winckler, G Getz, D DeLuca, D MacArthur, M Kellis, A Thomson, T Young, E Gelfand, M Donovan, Y Meng, G Grant, D Mash, Y Marcus, M Basile, J Liu, J Zhu, Z Tu, NJ Cox, DL Nicolae, ER Gamazon, HK Im, A Konkashbaev, J Pritchard, M Stevens, T Flutre, X Wen, ET Dermitzakis, T Lappalainen, R Guigo, J Monlong, M Sammeth, D Koller, A Battle, S Mostafavi, M McCarthy, M Rivas, J Maller, I Rusyn, A Nobel, F Wright, A Shabalin, M Feolo, N Sharopova. The genotype-tissue expression (GTEx) project. Nat Genet, 2013. [DOI | PubMed]
- D Martinelli, L Travaglini, CA Drouin, I Ceballos-Picot, T Rizza, E Bertini, R Carrozzo, S Petrini, P de Lonlay, M El Hachem, L Hubert, A Montpetit, G Torre, C Dionisi-Vici. MEDNIK syndrome: a novel defect of copper metabolism treatable by zinc acetate therapy. Brain, 2013. [DOI | PubMed]
- B McAuslan, W Reilly. Endothelial cell phagokinesis in response to specific metal ions. Exp Cell Res, 1980. [DOI | PubMed]
- M Mete, DC Trabulus, CK Talu, E Ozoran, T Mutlu, B Tekin, M Guven. An investigation of the relationship between TMPRSS6 gene expression, genetic variants and clinical findings in breast cancer. Mol Biol Rep, 2020. [DOI | PubMed]
- F Michniewicz, F Saletta, J Rouen, D Ziegler, O Vittorio. DIPG-83. USING. Neurooncology, 2020. [DOI]
- F Michniewicz, F Saletta, JRC Rouaen, RV Hewavisenti, D Mercatelli, G Cirillo, FM Giorgi, T Trahair, D Ziegler, O Vittorio. Copper: an intracellular Achilles’ Heel allowing the targeting of epigenetics, kinase pathways, and cell metabolism in Cancer therapeutics. ChemMedChem, 2021. [DOI | PubMed]
- F Michniewicz, F Saletta, T Watkinson, D Mercatelli, FM Giorgi, J Bell, M Tsoli, D Ziegler, O Vittorio. Abstract 5716: using copper chelating agents to simultaneously target epigenetic mechanisms and receptor tyrosine kinase (RTK) signaling in diffuse intrinsic pontine glioma (DIPG). Cancer Res, 2022. [DOI]
- NA O’Leary, MW Wright, JR Brister, S Ciufo, D Haddad, R McVeigh, B Rajput, B Robbertse, B Smith-White, D Ako-Adjei, A Astashyn, A Badretdin, Y Bao, O Blinkova, V Brover, V Chetvernin, J Choi, E Cox, O Ermolaeva, CM Farrell, T Goldfarb, T Gupta, D Haft, E Hatcher, W Hlavina, VS Joardar, VK Kodali, W Li, D Maglott, P Masterson, KM McGarvey, MR Murphy, K O’Neill, S Pujar, SH Rangwala, D Rausch, LD Riddick, C Schoch, A Shkeda, SS Storz, H Sun, F Thibaud-Nissen, I Tolstoy, RE Tully, AR Vatsan, C Wallin, D Webb, W Wu, MJ Landrum, A Kimchi, T Tatusova, M DiCuccio, P Kitts, TD Murphy, KD Pruitt. Reference sequence (RefSeq) database at NCBI: current status, taxonomic expansion, and functional annotation. Nucleic Acids Res, 2016. [DOI | PubMed]
- VVH Pham, L Liu, CP Bracken, GJ Goodall, Q Long, J Li, TD Le. CBNA: a control theory based method for identifying coding and non-coding cancer drivers. PLoS Comput Biol, 2019. [DOI | PubMed]
- VVH Pham, L Liu, CP Bracken, GJ Goodall, J Li, TD Le. DriverGroup: a novel method for identifying driver gene groups. Bioinformatics, 2020. [DOI | PubMed]
- VVH Pham, L Liu, CP Bracken, T Nguyen, GJ Goodall, J Li, TD Le. pDriver: a novel method for unravelling personalized coding and miRNA cancer drivers. Bioinformatics, 2021. [DOI | PubMed]
- EM Poursani, D Mercatelli, P Raninga, JL Bell, F Saletta, FV Kohane, DP Neumann, Y Zheng, JRC Rouaen, TR Jue, FT Michniewicz, P Schadel, E Kasiou, M Tsoli, G Cirillo, S Waters, T Shai-Hee, R Cazzoli, M Brettle, I Slapetova, M Kasherman, R Whan, F Souza-Fonseca-Guimaraes, L Vahdat, D Ziegler, JG Lock, FM Giorgi, K Khanna, O Vittorio. Copper chelation suppresses epithelial-mesenchymal transition by inhibition of canonical and non-canonical TGF-β signaling pathways in cancer. Cell Bioscience, 2023. [DOI | PubMed]
- EL Que, DW Domaille, CJ Chang. Metals in neurobiology: probing their chemistry and biology with molecular imaging. Chem Rev, 2008. [DOI | PubMed]
- ME Ritchie, B Phipson, D Wu, Y Hu, CW Law, W Shi, GK Smyth. Limma powers differential expression analyses for RNA-sequencing and microarray studies. Nucleic Acids Res, 2015. [DOI | PubMed]
- JR Rouaen, D Mercatelli, F Saletta, EM Poursani, JE Murray, N Tedla, FM Giorgi, O Vittorio. Abstract 5214: copper chelation overcomes the immunosuppressive tumor microenvironment in neuroblastoma. Cancer Res, 2022. [DOI]
- C Sen, S Khanna, M Venojärvi, P Trikha, E Ellison, T Hunt, S Roy. Copper-Induced Vascular endothelial growth factor expression and Wound Healing. American journal of physiology. Heart Circ Physiol, 2002. [DOI]
- S Sofi, U Mehraj, H Qayoom, S Aisha, A Almilaibary, M Alkhanani, MA Mir. Targeting cyclin-dependent kinase 1 (CDK1) in cancer: molecular docking and dynamic simulations of potential CDK1 inhibitors. Med Oncol, 2022. [DOI | PubMed]
- EI Solomon, UM Sundaram, TE Machonkin. Multicopper oxidases and oxygenases. Chem Rev, 1996. [DOI | PubMed]
- Q Song, R Zhou, F Shu, W Fu. Cuproptosis scoring system to predict the clinical outcome and immune response in bladder cancer. Front Immunol, 2022. [DOI | PubMed]
- A Subramanian, P Tamayo, VK Mootha, S Mukherjee, BL Ebert, MA Gillette, A Paulovich, SL Pomeroy, TR Golub, ES Lander, JP Mesirov. Gene set enrichment analysis: a knowledge-based approach for interpreting genome-wide expression profiles. Proc Natl Acad Sci U S A, 2005. [DOI | PubMed]
- D Szklarczyk, AL Gable, D Lyon, A Junge, S Wyder, J Huerta-Cepas, M Simonovic, NT Doncheva, JH Morris, P Bork, LJ Jensen, CV Mering. STRING v11: protein-protein association networks with increased coverage, supporting functional discovery in genome-wide experimental datasets. Nucleic Acids Res, 2019. [DOI | PubMed]
- Tang S, Zhao L, Wu X-B, Wang Z, Cai L-Y, Pan D, Li Y, Zhou Y, Shen Y (2022) Identification of a Novel cuproptosis-related gene signature for Prognostic Implication in Head and Neck squamous carcinomas. Cancers, p 14
- Teng C, Zhu Y, Li Y, Dai L, Pan Z, Wanggou S, Li X (2022) Recurrence- and Malignant Progression-Associated biomarkers in low-Grade Gliomas and their roles in Immunotherapy. 13. 10.3389/fimmu.2022.899710
- Therneau TM, Grambsch PM (2000) Modeling Survival Data: extending the Cox Model. Springer
- T Tsang, CI Davis, DC Brady. Copper biology. Curr Biol, 2021. [DOI | PubMed]
- Turriani E, Lázaro DF, Ryazanov S, Leonov A, Giese A, Schön M, Schön MP, Griesinger C, Outeiro TF, Arndt-Jovin DJ, Becker D (2017) Treatment with diphenyl–pyrazole compound anle138b/c reveals that α-synuclein protects melanoma cells from autophagic cell death. Proceedings of the National Academy of Sciences 114: E4971-E4977. 10.1073/pnas.1700200114
- F Voli, E Valli, L Lerra, K Kimpton, F Saletta, FM Giorgi, D Mercatelli, JRC Rouaen, S Shen, JE Murray, A Ahmed-Cox, G Cirillo, C Mayoh, PA Beavis, M Haber, JA Trapani, M Kavallaris, O Vittorio. Intratumoral Copper modulates PD-L1 expression and influences Tumor Immune Evasion. Cancer Res, 2020. [DOI | PubMed]
- B Wang, AM Mezlini, F Demir, M Fiume, Z Tu, M Brudno, B Haibe-Kains, A Goldenberg. Similarity network fusion for aggregating data types on a genomic scale. Nat Methods, 2014. [DOI | PubMed]
- Y Wang, T Qian, G You, X Peng, C Chen, Y You, K Yao, C Wu, J Ma, Z Sha, S Wang, T Jiang. Localizing seizure-susceptible brain regions associated with low-grade gliomas using voxel-based lesion-symptom mapping. Neurooncology, 2015. [DOI]
- JN Weinstein, EA Collisson, GB Mills, KR Shaw, BA Ozenberger, K Ellrott, I Shmulevich, C Sander, JM Stuart. The Cancer Genome Atlas Pan-cancer analysis project. Nat Genet, 2013. [DOI | PubMed]
- Z Xie, A Bailey, MV Kuleshov, DJB Clarke, JE Evangelista, SL Jenkins, A Lachmann, ML Wojciechowicz, E Kropiwnicki, KM Jagodnik, M Jeon, A Ma’ayan. Gene Set Knowledge Discovery with Enrichr. Curr Protocols, 2021. [DOI]
- Q Ye, TF Wang, YF Peng, J Xie, B Feng, MY Qiu, LH Li, AG Lu, BY Liu, MH Zheng. Expression of alpha-, beta- and gamma-synuclein in colorectal cancer, and potential clinical significance in progression of the disease. Oncol Rep, 2010. [PubMed]
- X Yu, J Zhang, S Sun, X Zhou, T Zeng, L Chen. Individual-specific edge-network analysis for disease prediction. Nucleic Acids Res, 2017. [DOI | PubMed]
- X Zhang, Z Wu, K Ma. SNCA correlates with immune infiltration and serves as a prognostic biomarker in lung adenocarcinoma. BMC Cancer, 2022. [DOI | PubMed]
- Z Zhao, K-N Zhang, Q Wang, G Li, F Zeng, Y Zhang, F Wu, R Chai, Z Wang, C Zhang, W Zhang, Z Bao, T Jiang. Chinese Glioma Genome Atlas (CGGA): a Comprehensive Resource with functional genomic data from Chinese glioma patients. Genom Proteom Bioinform, 2021. [DOI]
- D Zheng, W Fu, L Jin, X Jiang, W Jiang, Y Guan, R Hao. The overexpression and clinical significance of AP1S1 in breast Cancer. Cancer Manag Res, 2022. [DOI | PubMed]
- M Zhou, X Liu, Z Li, Q Huang, F Li, C-Y Li. Caspase-3 regulates the migration, invasion and metastasis of colon cancer cells. Int J Cancer, 2018. [DOI | PubMed]
- Z Zhou, S Xu, L Jiang, Z Tan, J Wang. A systematic Pan-cancer analysis of CASP3 as a potential target for Immunotherapy. Front Mol Biosci, 2022. [DOI | PubMed]