A pancancer analysis of the clinical and genomic characteristics of multiple primary cancers
Abstract
Multiple primary cancer (MPC) denotes individuals with two or more malignant tumors occurring simultaneously or successively. Herein, a total of 11,000 pancancer patients in TCGA database (1993–2013) were divided into MPC or non-MPC groups based on their history of other malignant tumors. The incidence of MPC has risen to 8.5–13.1% since 2000. Elderly individuals, males, early-stage cancer patients, and African Americans and Caucasians are identified as independent risk factors (p < 0.0001). Non-MPC patients exhibit significantly longer overall survival (OS) and disease-free survival (DFS) (p = 0.0038 and p = 0.0014). Age (p < 0.001) and tumor staging at initial diagnosis (p < 0.001) contribute to this difference. In our center, MPC was identified in 380 out of 801 tumor events based on SEER criteria. The peak occurrence of secondary primary was about 1–5 years after the first primary tumor, with a second small peak around 10–15 years. Multiple tumors commonly occur in the same organ (e.g., breast and lung), constituting 12.6%. Certain cancer types, notably skin cutaneous melanoma (SKCM), exhibit significantly higher tumor mutational burden (TMB) in the MPC group (17.31 vs. 6.55 mutations/MB, p < 0.001), with high TMB associated with improved survival (p < 0.001). High TMB in MPC may serve as a predictor for potential immunotherapy application.
Article type: Research Article
Affiliations: grid.16821.3c0000 0004 0368 8293Department of Oncology, State Key Laboratory of Systems Medicine for Cancer, Renji Hospital, Shanghai Jiao Tong University School of Medicine, Shanghai, China
License: © The Author(s) 2024 CC BY 4.0 Open Access This article is licensed under a Creative Commons Attribution 4.0 International License, which permits use, sharing, adaptation, distribution and reproduction in any medium or format, as long as you give appropriate credit to the original author(s) and the source, provide a link to the Creative Commons licence, and indicate if changes were made. The images or other third party material in this article are included in the article’s Creative Commons licence, unless indicated otherwise in a credit line to the material. If material is not included in the article’s Creative Commons licence and your intended use is not permitted by statutory regulation or exceeds the permitted use, you will need to obtain permission directly from the copyright holder. To view a copy of this licence, visit http://creativecommons.org/licenses/by/4.0/.
Article links: DOI: 10.1038/s41598-024-52659-3 | PubMed: 38287125 | PMC: PMC10825147
Relevance: Moderate: mentioned 3+ times in text
Full text: PDF (7.0 MB)
Introduction
Multiple primary cancer (MPC) refers to the presence of two or more malignant tumors in the same or different organs or tissues simultaneously or successively. These tumors, pathologically and histologically considered cancers from different primary sites, are mainly distinguishing them from tumor recurrence and metastasis1. MPC can be classified into synchronous multiple primary cancer (SMPC) or metachronous multiple primary cancer (MMPC) based on the time interval between the second tumor and the primary tumor. The diagnosis of MPC has evolved, and two main criteria, established by the Surveillance Epidemiology and End Results (SEER) Program and the International Association of Cancer Registries and International Agency for Research on Cancer (IACR/IARC) organization, are commonly used in studies2. Differences in these criteria include the understanding of the primary site and the definition of SMPC and MMPC2. In this study, we utilized SEER as the main diagnostic criteria.
At present, the incidence of multiple primary tumors in different studies ranges from 1.63 to 10.9%1,3–6. The risk of developing multiple primary tumors increases with a longer follow-up duration, reaching 4.3%, 7.7%, and 12.4% over an average follow-up period of 5, 10, and 20 years, respectively7. This heightened risk is primarily associated with age, as evidenced by a significant increase in incidence from 1% for a 30-year-old person to 18% for a 70-year-old person8. Individual with a history of cancer face a 14% increased risk of getting another primary tumor compared to the general population9. The risk of tumor recurrence varies depending on the type of first primary tumor, with a 1% recurrence risk for primary liver cancer and 16% for primary bladder cancer10. Factors influencing the incidence of multiple primary tumors include the location of the first primary tumor, age at initial diagnosis, environmental exposure factors, genetic factors, and previous treatment1.
Herein, we analyzed clinical and genomic data from large-scale sequencing data in The Cancer Genome Atlas (TCGA) database to enhance understanding and identify effective strategies for preventing and managing multiple primary tumors, ultimately improving prognosis and therapeutic methods.
Materials and methods
Data acquisition
We accessed the latest TCGA data stored in the Genomic Data C commons (GDC) through its website (https://portal.gdc.cancer.gov/repository) by selecting Maf format files, resulting in 132 mutation files from 33 different types of cancer. We specifically selected MuTect series files and downloaded tools provided by the GDC to aid in downloading the appropriate files.
Data processing and analysis
Data processing and analysis in this study were performed using the following packages in R (Version 4.2.0): ggplot, readr, dplyr, survminer, and survival.
In the consolidated datasets of 33 cancer types in TCGA database, screening was performed according to HISTORY_OTHER_MALIGNANCY, resulting in 10,016 effective cases. HISTORY_OTHER_MALIGNANCY was defined as “Yes”, “Yes, History of Prior Malignancy”, or “Yes, History of Synchronous/Bilateral Malignancy” for multiple primary malignancy group (n = 974), as “No” for non-multiple primary malignancy group (n = 9042). The age, sex, race, and pathological stage were statistically described to compare their differences. The pathological staging was based on the AJCC_PATHOLOGIC_TUMOR_STAGE divided into stages I-IV, and the individuals classified as stage 0 and unable staging X were removed.
Survival analysis was performed based on OS_STATUS and DFS_STATUS. There were 9619 effective cases for overall survival, comprising 919 MPC cases and 8700 non-MPC cases. Data from 8290 patients with disease-free survival (DFS) were obtained, including 783 MPC patients and 7507 non-MPC patients.
Cases enrolled in our center
Multiple cases of primary tumors diagnosed at the Renji Hospital, Shanghai Jiao Tong University School of Medicine from January 2017 to December 2022 were included. The diagnostic criteria for MPC followed the SEER project. A total of 380 patients were recruited and followed up. Collected information included sex, age, location, pathological diagnosis, and time of diagnosis of the first, second, and later primary tumors. This was an observational study approved by the Ethics Committee of Renji Hospital Affiliated to Shanghai Jiao Tong University School of Medicine, and written informed consent was obtained from every patient. All authors confirmed that all methods of this study were performed in accordance with the relevant guidelines and regulations.
Statistical methods
Statistical analysis was conducted by R (Version 4.2.0). T tests were used to compare the means of continuous variables with normally distributed continuous variables between two groups, while the Wilcoxon rank sum test was utilized for continuous variables with non-normal distribution. The chi-square test or Fisher’s exact test was applied to compare different classification variables. The survival analysis of the groups was performed by Kaplan‒Meier survival curves, and Cox regression and logistic regression were used for statistical tests. A significance level of p < 0.05 was considered statistically significant.
Ethics declarations
The study was approved by the Ethics Committee of Renji Hospital Affiliated to Shanghai Jiao Tong University School of Medicine (Shanghai, China) (Approval number: RA-2022-650), and written informed consent was obtained from every patient. All authors confirmed that all methods of this study were performed in accordance with the relevant guidelines and regulations.
Results
Incidence of multiple primary cancer
We first assessed the proportion of patients with MPC diagnosed in TCGA database from 1993 to 2013 (Fig. 1A). The incidence of MPC was at a low level before 2000, fluctuating between 0 and 5.9%. Since 2000, however, the incidence has consistently stayed around 10%, ranging from 8.5 and 13.1%. Further analysis revealed that a significant increase in the proportion of MPC after 2000 accounting for 9.98% (907/9090) compared to an incidence of 3.17% (12/378) before 2000 (12/378) (p < 0.001) (Fig. 1B). In addition, the occurrence of MPC varied significantly among different tumor types, ranging from 0 to 27.3% (Fig. 1C,D). The specific data are shown in Table 1. Notably, bladder cancer (26.46%, 109/412) had a significantly high proportion of patients with previous malignant tumors, aligning with previous reports9.
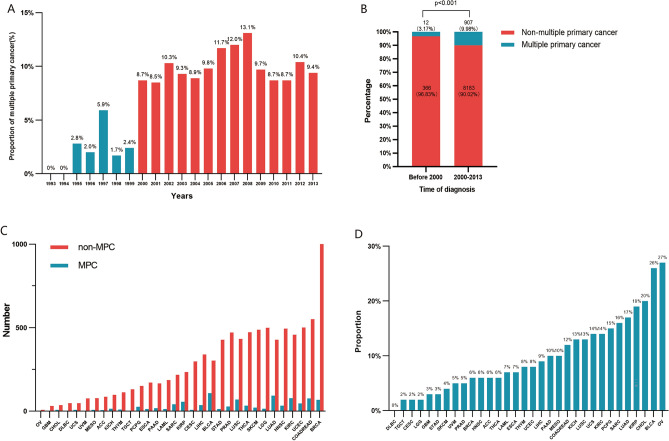
Table 1: Number of patients of multiple primary cancer and non-multiple primary cancer.
| Primary site | MPC n (%) | Non-MPC n (%) | OR (95% CI) | p-val |
|---|---|---|---|---|
| PAN-CANCER | 974 (9.72%) | 9042 (90.28%) | ∕ | ∕ |
| ACC (adrenocortical carcinoma) | 6 (6.52%) | 86 (93.48%) | 0.65 (0.23–1.47) | 0.378 |
| BLCA (bladder urothelial carcinoma) | 109 (26.46%) | 303 (73.54%) | 3.63 (2.86–4.59) | 0.000 |
| BRCA (breast invasive carcinoma) | 68 (6.20%) | 1028 (93.80%) | 0.59 (0.45–0.76) | 0.000 |
| CESC (cervical squamous cell carcinoma and endocervical adenocarcinoma) | 8 (2.61%) | 299 (97.39%) | 0.24 (0.10–0.49) | 0.000 |
| CHOL (cholangiocarcinoma) | 9 (20%) | 36 (80%) | 2.33 (0.99–4.95) | 0.037 |
| COADREAD (colorectal adenocarcinoma) | 77 (12.28%) | 550 (87.72%) | 1.33 (1.02–1.70) | 0.031 |
| DLBC (lymphoid neoplasm diffuse large b-cell lymphoma) | 0 (0%) | 48 (100%) | 0 (0–0.74) | 0.013 |
| ESCA (esophageal carcinoma) | 14 (7.57%) | 171 (92.43%) | 0.76 (0.40–1.31) | 0.380 |
| GBM (glioblastoma multiforme) | 1 (3.12%) | 31 (96.88%) | 0.30 (0.01–7.80) | 0.363 |
| HNSC (head and neck squamous cell carcinoma) | 33 (6.25%) | 495 (93.75%) | 0.61 (0.41–0.87) | 0.005 |
| KICH (kidney chromophobe) | 15 (13.27%) | 98 (86.73%) | 1.43 (0.77–2.48) | 0.200 |
| KIRC (kidney renal clear cell carcinoma) | 78 (14.53%) | 459 (85.47%) | 1.63 (1.25–2.10) | 0.000 |
| KIRP (kidney renal papillary cell carcinoma) | 56 (19.24%) | 235 (80.76%) | 2.29 (1.66–3.10) | 0.000 |
| LAML (acute myeloid leukemia) | 14 (7%) | 186 (93%) | 0.69 (0.37–1.20) | 0.227 |
| LGG (brain lower grade glioma) | 15 (2.91%) | 500 (97.09%) | 0.27 (0.15–0.45) | 0.000 |
| LIHC (liver hepatocellular carcinoma) | 37 (9.02%) | 340 (90.19%) | 1.01 (0.69–1.43) | 0.929 |
| LUAD (lung adenocarcinoma) | 93 (17.82%) | 429 (82.18%) | 2.12 (1.66–2.69) | 0.000 |
| LUSC (lung squamous cell carcinoma) | 70 (13.92%) | 433 (86.08%) | 1.54 (1.17–2.01) | 0.002 |
| MESO (mesothelioma) | 9 (10.34%) | 78 (89.66%) | 1.07 (0.47–2.15) | 0.855 |
| OV (ovarian serous cystadenocarcinoma) | 3 (27.27%) | 8 (72.72%) | 3.49 (0.60–14.56) | 0.084 |
| PAAD (pancreatic adenocarcinoma) | 19 (10.27%) | 166 (89.73%) | 1.06 (0.62–1.72) | 0.802 |
| PCPG (pheochromocytoma and paraganglioma) | 27 (15.08%) | 152 (84.92%) | 1.67 (1.06–2.54) | 0.021 |
| PRAD (prostate adenocarcinoma) | 29 (5.8%) | 471 (94.2%) | 0.56 (0.37–0.82) | 0.002 |
| SARC (sarcoma) | 42 (16.09%) | 219 (83.91%) | 1.82 (1.26–2.55) | 0.001 |
| SKCM (skin cutaneous melanoma) | 22 (4.68%) | 448 (95.32%) | 0.44 (0.27–0.68) | 0.000 |
| STAD (stomach adenocarcinoma) | 14 (3.16%) | 429 (96.84%) | 0.29 (0.16–0.50) | 0.000 |
| TGCT (testicular germ cell tumors) | 3 (2.24%) | 131 (97.76%) | 0.21 (0.04–0.63) | 0.001 |
| THCA (thyroid carcinoma) | 34 (6.76%) | 473 (94.63%) | 0.66 (0.45–0.94) | 0.017 |
| THYM (thymoma) | 10 (8.06%) | 114 (91.94%) | 0.81 (0.38–1.56) | 0.647 |
| UCEC (uterine corpus endometrial carcinoma) | 47 (8.58%) | 501 (91.42%) | 0.86 (0.62–1.18) | 0.374 |
| UCS (uterine carcinosarcoma) | 8 (14.04%) | 49 (85.96%) | 1.52 (0.62–3.25) | 0.260 |
| UVM (uveal melanoma) | 4 (5%) | 76 (95%) | 0.49 (0.13–1.30) | 0.185 |
MPC multiple primary cancer, Non-MPC non-multiple primary cancer, OR odds ratio, 95% CI 95% confidence interval, p-val p-value, n number.
General clinical characteristics
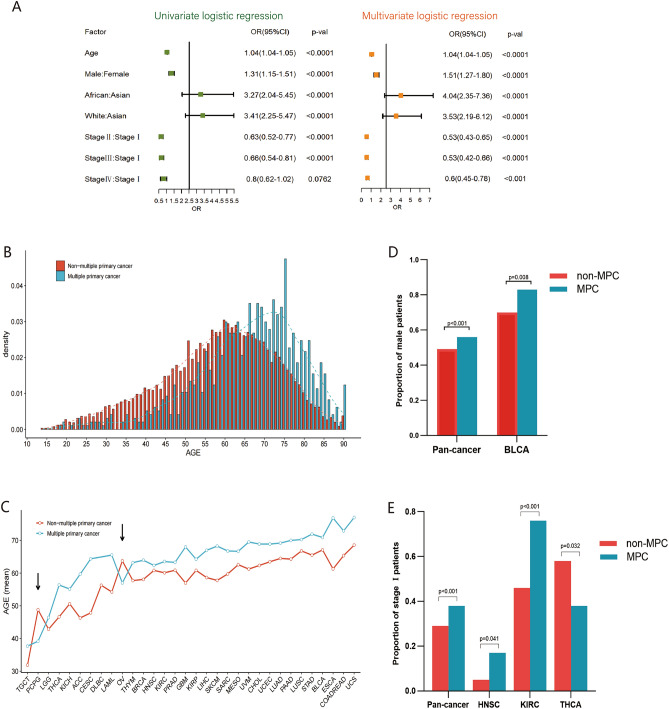
Clinical characteristics indicated significant differences in age, sex, race, and American Joint Committee on Cancer (AJCC) pathological stage between MPC and non-MPC patients in TCGA database (Table 2). Patients with MPC were older, and male patients had a higher probability of MPC than those with the primary tumor (66.00 vs. 58.39 years and 56.06% vs. 49.26%, both p < 0.001), and the proportion of MPC patients in Asia was significantly lower than that of non-MPC patients (2.47% vs. 7.91%, p < 0.001). Regarding pathological staging, the patients in stage I had a significantly higher incidence of MPC compared to non-MPC patients (38.02% vs. 29.14%, p < 0.001), while Stage II or IV patients had similar incidences of MPC, suggesting a correlation between these variables. Multivariate logistic regression analysis suggested that older age, blacks, whites, and the male population had a significantly higher risk of MPC (p < 0.001) (Fig. 2A). Patients with MPC were most likely in the early stage (p < 0.001) (Fig. 2A).
Table 2: Clinical characteristics of multiple primary cancer and non-multiple primary cancer in The Cancer Genome Atlas (TCGA) database.
| Variables | Total (n = 10,016) | MPC (n = 974) | Non-MPC (n = 9042) | p-val |
|---|---|---|---|---|
| Age mean ± SD | 59. 13 ± 14.57 | 66.00 ± 13. 12 | 58.39 ± 14.53 | < 0.001 |
| Gender n (%) | < 0.001 | |||
| Male | 5000 (49.92%) | 546 (56.06%) | 4454 (49.26%) | |
| Female | 5016 (50.08) | 428 (43.94) | 4588 (50.74%) | |
| Race n (%) | < 0.001 | |||
| Asian | 643 (7.38%) | 21 (2.47%) | 622 (7.91%) | |
| Black | 876 (10.06%) | 87 (10.22%) | 789 (10.04%) | |
| White | 7193 (82.56%) | 743 (87.31%) | 6450 (82.05) | |
| Stage n (%) | < 0.001 | |||
| I | 2069 (30.10%) | 281 (38.02%) | 1788 (29.14%) | |
| II | 2213 (32.19%) | 200 (27.06%) | 2013 (32.81%) | |
| III | 1749 (25.44%) | 164 (22.19%) | 1585 (25.84%) | |
| IV | 843 (12.26%) | 94 (12.72%) | 749 (12.21%) | |
MPC multiple primary cancer, Non-MPC non-multiple primary cancer, p-val p-value, n number, SD standard deviation.
Age
In the pancancer cohort, the age of onset for MPC tended to be higher than the non-MPC cohort (Fig. 2B). While the onset age varied across different tumor types in MPC, the majority showed higher onset ages compared to that of non-MPC, with most occurring around 5–10 years later (significant differences observed in 20 of the tumor types) (Fig. 2C). Some tumor types, like cervical cancer (16.54 years) and esophageal cancer (15.59 years), exhibited age differences of more than 15 years, indicating a large distinction of age characteristics between MPC and non-MPC. Ovarian cancer (OV) and pheochromocytoma and paraganglioma (PCPG) among MPC had a lower onset age (indicated by the arrow in Fig. 2C), with statistically significant differences for PCPG (p = 0.005). In the case of young patients with PCPG, their onset may be associated with a genetic correlation of tumor syndrome11. Thus, while older age remains a primary factor in increased susceptibility to MPC, mutations of key genes may be the main pathogenic factor of MPC in specific tumor types.
Gender
In the pancancer cohort, the male‒female ratio of MPC was 1.28:1, resembling previous reports6. Among MPC patients, 56% (546/974) were males, significantly higher than 49% (4454/9042) in the non-MPC group (p < 0.001) (Fig. 2D). The sex differences in different tumors were not as pronounced as age differences. Excluding gender-specific tumors, the ratio of male to female in MPC was higher than non-MPC in 15 out of 26 remaining tumors, with bladder cancer showing a statistically significant difference (5.06:1 vs. 2.37:1, p = 0.008) (Fig. 2D).
Stage
The proportion of patients with stage I and stage II-IV tumors of MPC and non-MPC was opposite (Table 2). MPC patients exhibited a higher proportion of stage I tumors (38.02%) compared to the non-MPC population (29.14%) (p < 0.001) in the pancancer cohort (Fig. 2E). Further analysis showed a significant difference between stage I patients with MPC and non-MPC in certain cancer types, including head and neck squamous cell carcinoma (HNSC), renal clear cell carcinoma (KIRC), and thyroid cancer (THCA) (p = 0.041, p < 0.001, and p = 0.032, respectively) (Fig. 2E). Although we initially hypothesized that the higher proportion of stage I patients with MPC might result from more regular follow-up and screening, this was not observed in cancers like breast, colorectal, and lung carcinomas (p > 0.05). Notably, thyroid cancer with a relatively good prognosis and typically detectable through early screening, exhibited a higher percentage of stage II-IV in the MPC population (p < 0.05) (Fig. 2E), suggesting the need for further investigation into the specific mechanisms contributing to these findings.
Survival analysis
In this study, patients with MPC were based on a history of previous malignant tumors, using the time of onset of malignancy as a starting point to compare survival change. Non-MPC cases had significantly better overall survival (OS) and disease-free survival (DFS) than MPC cases (p = 0.0038 and p = 0.0014, respectively) (Fig. 3A,B). The median OS was 78.1 months (95% CI 67.1–99.9 months) in MPC compared to 103.5 months (95% CI 96.8–112.5 months) in non-MPC with a median DFS of 73.9 months and 97.2 months, respectively (Fig. 3A,B). Among different tumors, most MPC patients exhibited inferior survival to non-MPC patients, with some differences reaching statistical significance, such as DFS in lung squamous carcinoma (LUSC), colorectal cancer (COADREAD), and testicular germ cell tumor (TGCT) (p < 0.05) (Fig. 3C–E). Moreover, in the cohort of thyroid cancer (THCA), the OS was significantly lower in patients with MPC (p = 0.0013) (Fig. 3F). Potentially linked to the patient’s first primary tumor given the long-term survival associated with thyroid cancer itself.
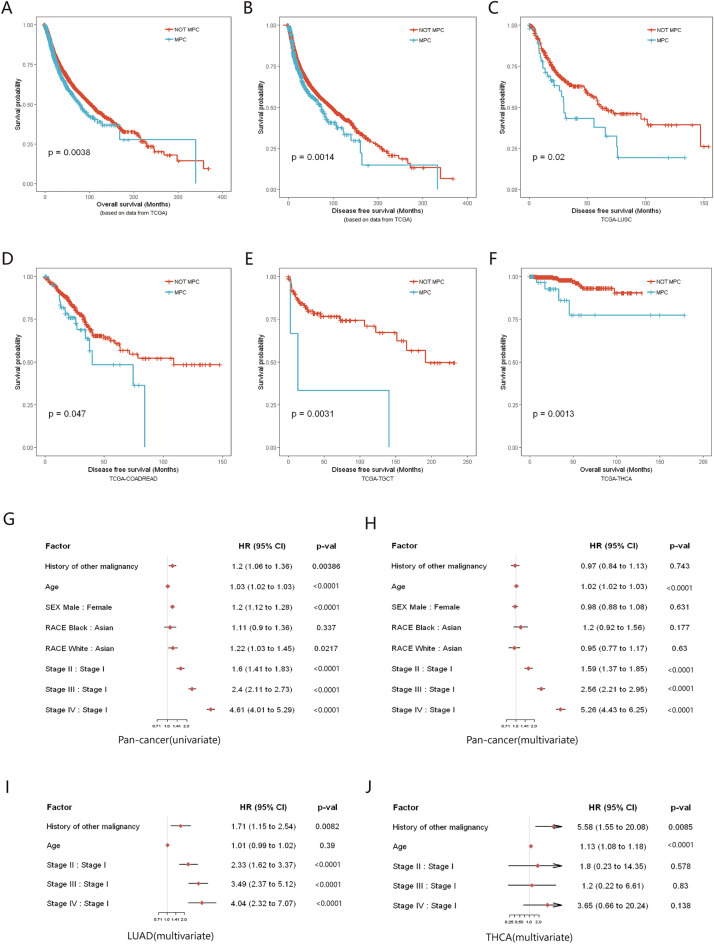
Univariate regression analysis indicated that a history of other malignancies affected the total survival of patients (HR 1.2, 95% CI 1.06–1.36, p = 0.0039), while it was no longer an independent risk factor for total patient survival in multivariate analysis (HR 0.97, 95% CI 0.84–1.13, p = 0.743) (Fig. 3G,H). In fact, age (HR 1.02, 95% CI 1.02–1.03, p < 0.0001) and tumor staging (stage II–IV compared with stage I, HR 1.59, 2.56 and 5.26, respectively; all p < 0.0001) were the main factors affecting survival in pancancer cohort. Exceptionally, a history of other malignancies in lung adenocarcinoma (LUAD) and thyroid cancer (THCA) significantly reduced OS in patients (p = 0.0082 and p = 0.0085, respectively) (Fig. 3I,J). In particular, for thyroid cancer, patient survival is primarily determined by the first primary cancer (HR 5.58, 95% CI 1.55–20.08).
Synchronous and metachronous primary cancers
While the TCGA data provided a comprehensive overview, limitations in information about the location and time of onset of patients’ history of other malignancies hindered the estimation of synchronous and metachronous multiple primary cancers. To address this gap, we incorporated data from 380 MPC cases in our medical center, comprising 801 tumor events with an average of 2.12 primary tumors in each patient. According to the SEER diagnostic criteria, 90 patients were identified as SMPC, and 290 patients as MMPC (Table 3). The average age of MMPC diagnosis (occurrence of the second primary tumor) was 63.00 ± 8.97 years, significantly different from SMPC (56.81 + 11.55) (p < 0.0001). The median interval between the first and second tumors in MMPC was 74.48 months, with the peak of secondary primary cancer (SPC) approximately 1–5 years from the first primary tumor and a second small peak around 10–15 years (Fig. 4A).
Table 3: Clinical characteristics of multiple primary cancer enrolled in our medical center.
| Variable | Total (n = 380) | Synchronous (n = 90) | Metachronous (n = 290) |
|---|---|---|---|
| Age (mean ± SD) | |||
| First primary cancer | 58.49 ± 11.40 | 63.96 ± 8.97 | 56.81 ± 11.55 |
| Second primary cancer | 63.23 ± 8.96 | 64.01 ± 8.96 | 63.00 ± 8.97 |
| Gender n (%) | |||
| Male | 207 (53.7%) | 61 (67.8%) | 143 (49.3%) |
| Female | 176 (46.3%) | 29 (32.2%) | 147 (50.7%) |
| Number of primary tumors n (%) | |||
| 2 primary tumors | 343 (90.3%) | 85 (94.4%) | 258 (89.0%) |
| 3 primary tumors | 33 (8.7%) | 5 (5.5%) | 28 (9.7%) |
| More than 3 | 4 (1.1%) | 0 (0%) | 4 (1.4%) |
| Interval between 2 primary tumors (months) median (IQR) | 56.97 (48.54–65.56) | 0.53 (0.38–0.69) | 74.48 (63.88–85.81) |
n number, SD standard deviation, IQR interquartile range.
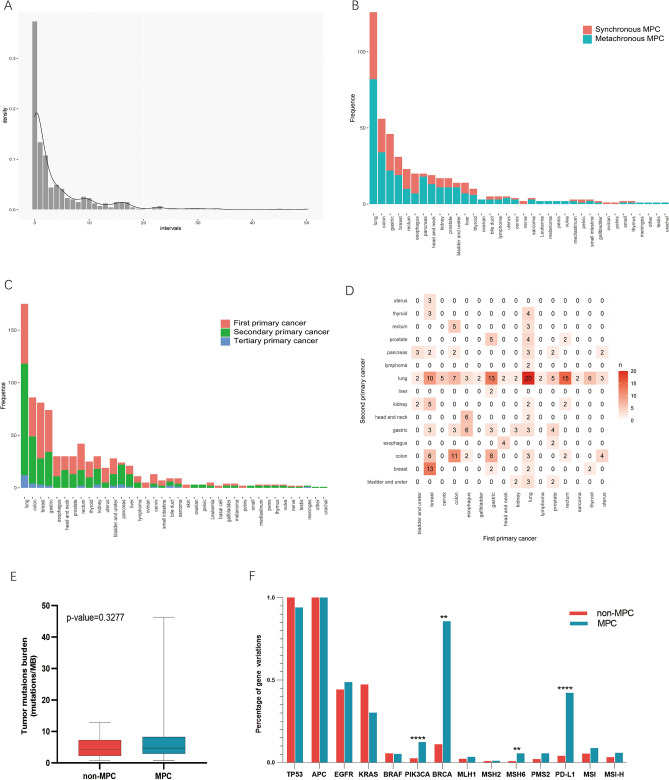
Examining the distribution of SMPC and MMPC across various cancer sites, we observed that 65% (13/20) of esophagus cancer patients had SMPC, significantly higher than that of other tumors (p = 0.02), while 90% (18/20) of pancreas tumors were metachronous (p = 0.0089) (Fig. 4B). The difference in other cancers did not reach statistical significance (p > 0.05). Time sequence differences in tumor onset were also noted across sites (Fig. 4C). The percentage of SPC in pancreas and lung cancer exceeded that in other tumors (p < 0.0001) (Fig. 4C).
Further exploring the correlation between the first and second primary tumors, we identified common combinations such as lung-lung (20 cases), rectum-lung (15 cases), gastric-lung (13 cases), and breast-breast cancers (13 cases) (Fig. 4D). In various combinations, the second and first primary tumors in the same organ or system were the most frequent, constituting 48/380 (12.6%) of cases, similar to previous findings5.
Genomic characteristics
MPC has significant higher tumor mutation burden than non-MPC
Although major mutant genes did not significantly differ between MPC and non-MPC in various tumors locations, a higher prevalence of gene mutations was evident in MPC. Notably, bladder urothelial carcinoma (BLCA) and skin cutaneous melanoma (SKCM) were more prone to occur as multiple primary cancers (Fig. 5A,B).
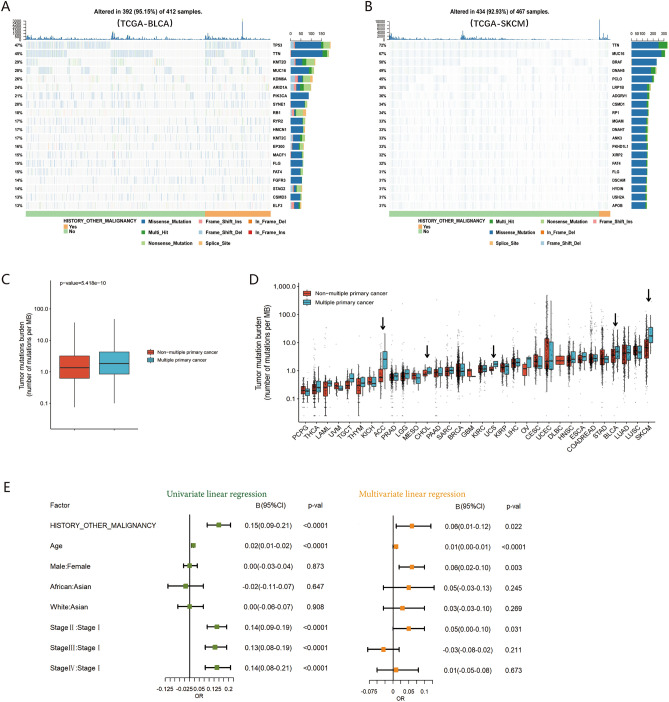
Analysis of the pancancer datasets indicated that the median tumor mutation burden (TMB) with 1.84 mutations/MB (IQR 0.85–4.27) in MPC was significantly higher than that in non-MPC with 1.35 mutations/MB (IQR 0.63–3.20) (p < 0.0001) (Fig. 5C). The differences in TMB here, while statistically significant, are not clinically meaningful. Immunotherapy typically shows limited activity when TMB is less than 2 mutations/MB. In our cohort, there was no significant difference in TMB between MPC (median TMB = 4.30, 32 cases) and non-MPC (median TMB = 4.70, 43 cases) (p > 0.05) (Fig. 4E), maybe primarily attributed to the limited number of cases.
Among 32 different cancers, except for diffuse large B cell lymphoma (DLBC) due to lack of data, 65% (20/31) of the remaining cancer types had a higher mutation load in MPC with a statistically significant difference in five cancers, namely, adrenocortical carcinoma (ACC), cholangiocarcinoma (CHOL), uterine sarcoma (UCS), bladder urothelial carcinoma (BLCA), and skin cutaneous melanoma (SKCM) (all p < 0.05) (Fig. 5D). These findings suggest that a higher TMB when a second or later primary tumor occurs is likely to be a common phenomenon in MPC.
Multivariate analysis revealed a significant correlation between a history of other primary malignancies and a high mutation load with log (TMB + 1) as the dependent variable (B = 0.06, 95% CI 0.01–0.12, p = 0.022) (Fig. 5E). This independent effect may partly be attributed to genetically related tumor syndrome or the influence of radiotherapy and chemotherapy on the treatment of the first primary tumor.
Mutant gene features in multiple primary tumors
Previous studies reported that mutation of mismatch repair (MMR) genes and the polymerase-epsilon (POLE) gene leads to a significant increase in TMB. The tumor with mismatch repair deficiency (dMMR) and POLE gene mutations exhibit higher TMB, with a further increase when both the MMR and POLE genes are mutated (Fig. 6A). This trend holds across various mutation loads in specific tumors adrenocortical carcinoma (ACC), uterine sarcoma (UCS), bladder urothelial carcinoma (BLCA), and skin cutaneous melanoma (SKCM), irrespective of MPC or non-MPC status (Fig. 6B).
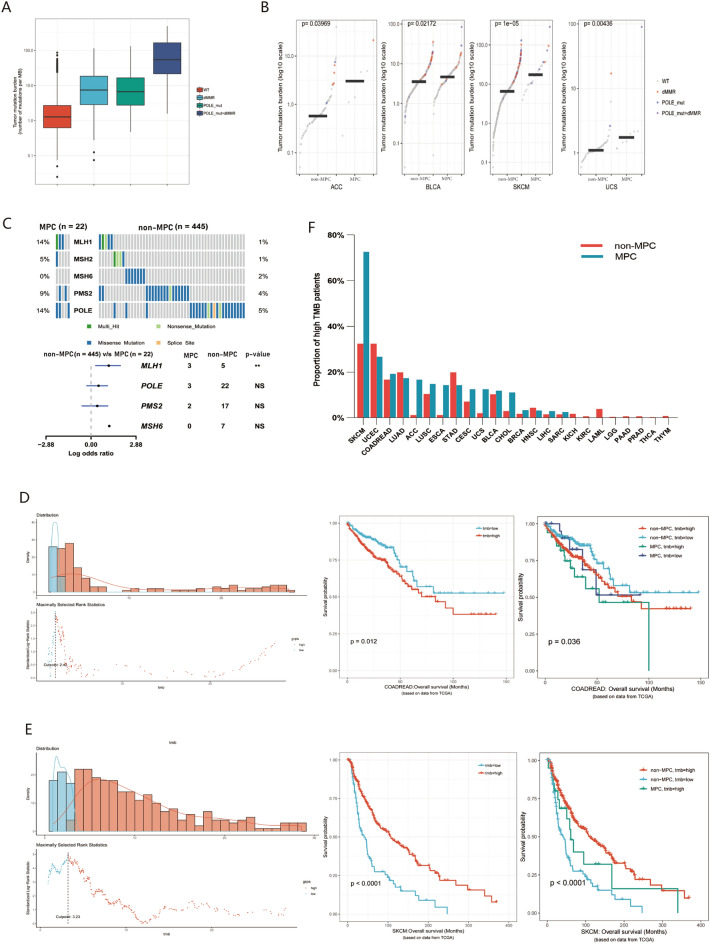
Next, we investigated the mutation ratio of common somatic gene variations in clinical patients between MPC and non-MPC (Fig. 4F). In our cohort, the percentage of gene variations of PIK3CA, BRCA, MSH6 and programmed cell death ligand 1 (PD-L1) (CPS > 1) in MPC was significantly higher than that of non-MPC (p < 0.01 or p < 0.0001) (Fig. 4F). Also, we observed a noticeable increase in microsatellite instability-high (MSI) or MSI-high (MSI-H) patients with MPC than non-MPC (8.8% vs 5.4%, 5.9% vs 3.2%) (Fig. 4F), although not statistically significant. Furthermore, the mutation rate of the MLH1 gene in MPC was significantly higher than that in non-MPC (14% vs. 1%, p < 0.05) in TCGA-SKCM, but there was no significant difference in the POLE and PMS2 genes (Fig. 6C). Similarly significant results were not identified in other tumors.
Tumor mutation burden and prognosis in multiple primary tumors
To assess the clinical value of MPC and TMB, both were analyzed as prognostic indicators affecting OS. Combined with the standards in the published literature12, > 100 mutations/exome (equivalent to > 2.5 mutations/MB in this study) in TCGA database is the cutoff value of high mutation load for pancancer analysis. The cutoff value for high mutation load was determined based on TMB distribution across different cancers. The impact of mutation load on prognosis varied significantly among different tumors. For the colorectal cancer cohort, the optimal cutoff value was 2.42 mutations/MB, and higher TMB was associated with worse overall survival (Fig. 6D). Nevertheless, in skin cutaneous melanoma (SKCM) with an optimal cutoff of 3.23 mutations/MB, patients with higher TMB had better survival (Fig. 6E). Given the positive response to immune checkpoint inhibitors (ICIs) treatment in individuals with high TMB in recent studies, further research is needed to explore the optimal cutoff value of TMB in various cancers for immunotherapy.
Additionally, we integrated the difference in the proportion of patients with high TMB between the MPC and non-MPC groups. In SKCM, a high mutation load was as high as 72.7%, compared to only 32.4% in the non-MPC group, showing a significant difference between the two groups (p < 0.001) (Fig. 6F). Similarly, 14.3% of patients with secondary primary esophageal cancer (ESCA) had a high mutation load, while 1.2% were in non-MPC patients (p = 0.03) (Fig. 6F). No significant difference was observed in other cancers. Thus, the history of other tumors conveniently obtained by medical history inquiry, could serve a predictor of potential effectiveness for immunotherapy, particularly in SKCM patients.
Discussion
The survival time of cancer patients worldwide is increasing, and the number of patients with MPC has increased in recent decades3,5,13, with a high incidence of 8.5–13.1% since 2020 reported in the study. Compared to the general population, cancer survivors are at much higher risk of SPC and have a poor prognosis3,5. The potential risk factors for MPC may include genetic factors, exposure to lifestyle, hormonal factors, immunodeficiency, infection, carcinogenesis of previous iatrogenic treatment, and even the synergistic effect among the above factors13–17. And some cancers in same or different sites always share common risk factors but experience different degrees of exposure. In recent decades, research has identified the genetic features of many types of tumors, indicating that approximately 100 genes are prone to one or more cancers when various mutations occur14. Consequently, a clear correlation always exists between the occurrence of multiple primary cancers and high genetic mutation load in certain cancers.
Elderly age, male, early tumors, and African black race and white race were independent risk factors for MPC reported in the study. Elderly age itself is the most important risk factor for any kind of cancer, which may be related to the cumulative effect of a variety of risk factors in the long term. The present study also found that some young cancer patients had a high incidence of MPC (such as PCPG and OV), which may be closely related to genetic susceptibility or cancer syndromes11,16. The some patients with MPC (especially skin cutaneous melanoma and KIRC) was always found in stage I, suggesting that follow-up was crucial for early detection of the second primary tumor. Except for gender-specific cancers, male cancer patients have a significantly higher incidence of MPC, especially BLCA, mainly due to that smokers are four times more likely to develop bladder cancer than people who never smoke18. A previous study has reported that ethnic differences in MPC may be related to genetic and environmental differences3.
The age at diagnosis of first primary cancer (FPC) in SMPC patients is notably younger, averaging approximately 10 years less than that in MMPC patients19,20. In MMPC, the incidence peak of SPC gradually decreases within 1–5 years after the diagnosis of FPC, with a second smaller peak emerging around 10–15 years. Studies have identified a strong correlation between specific types of first and second primary cancer5. For instance, Swiss men and women with oropharyngeal cancer face a 20-fold and 40-fold increased risk of subsequent diagnoses of pharynx cancer and a 16-fold and 30-fold increased risk of developing second primary esophageal cancer, respectively5. The combination of FPC and SPC in lung and breast cancer is statistically more significant than in other cancer types (p < 0.0001)3. Additionally, bladder cancer is one of the most common SPC, especially when the FPC is renal pelvis and ureter cancer2. In summary, gaining a deeper understanding of the clinical characteristics of multiple primary tumors emphasizes the importance of reasonable follow-up for the benefit of cancer patients.
At present, cancer immunotherapy is undergoing rapid development, and TMB has emerged as an important indicator of immunotherapy responsiveness in certain cancers21. Pancancer data analysis revealed a significantly higher median TMB of 1.84 mutations/MB in MPC compared to non-MPC at 1.35 mutations/MB (p < 0.001). While statistically significant, these differences may lack clinical significance. In most clinical trials, patients with high TMB (> 10 mutations/MB) significantly benefit from immunotherapy22. However, specific cancer types within the MPC group, exhibit significantly higher TMB (> 10 mutations/MB), especially SKCM that reaching a median of 17.31 mutations/MB, in contrast to the non-MPC group at 6.55 mutations/MB. Moreover, targeted agents and immunotherapy significantly optimize outcomes in melanoma, and the median OS of patients with advanced melanoma increased from approximately 9 months before 2011 to at least 2 years23. And a high TMB is associated with a clear survival benefit in SKCM. Therefore, a high TMB in MPC may indicate a potential population for immunotherapy.
The present study is subject to several limitations stemming from the retrospective analysis of MPC in registered TCGA database patients. The unavailability of cancer types and diagnostic times for a history of other malignancies prevented the examination of clinical and genomic characteristics of SMPC and MMPC. Despite supplementing data from our medical center, the small sample size hinders the ability to draw normative conclusions, especially without concurrent collection of epidemiological data from the general population. Despite these limitations, the study’s results can serve as a supplementary reference for relevant research.
Conclusions
In conclusion, MPC is not uncommon and always leads to patients’ poor survival. Some characteristics of MPC requires special attention, encompassing age, gender, staging, race, peaks in the incidence and correlations of location. And MPC always has a higher TMB than non-MPC and associated with a clear survival benefit in certain cancers. A more profound understanding of MPC characteristics is essential for formulating appropriate diagnostic and therapeutic strategies, as well as implementing follow-up protocols in clinical practice.
References
- A Vogt. Multiple primary tumours: Challenges and approaches, a review. ESMO Open, 2017. [DOI | PubMed]
- A Coyte, DS Morrison, P McLoone. Second primary cancer risk—The impact of applying different definitions of multiple primaries: Results from a retrospective population-based cancer registry study. BMC Cancer, 2014. [DOI | PubMed]
- P Tanjak. Risks and cancer associations of metachronous and synchronous multiple primary cancers: A 25-year retrospective study. BMC Cancer, 2021. [DOI | PubMed]
- N Donin. Risk of second primary malignancies among cancer survivors in the United States, 1992 through 2008. Cancer, 2016. [DOI | PubMed]
- A Feller. Correction to: The relative risk of second primary cancers in Switzerland: A population-based retrospective cohort study. BMC Cancer, 2020. [DOI | PubMed]
- M Utada, Y Ohno, M Hori, M Soda. Incidence of multiple primary cancers and interval between first and second primary cancers. Cancer Sci., 2014. [DOI | PubMed]
- 7.Karaholios, E. E. et al. Second Primary Cancers in Victoria (2013).
- LAG Ries. SEER Cancer Statistics Review, 1975–2005, 2008
- 9.C F: Cancer Facts & Figures 2009. ConcerOrg (2009).
- MJ Hayat, N Howlader, ME Reichman, BK Edwards. Cancer statistics, trends, and multiple primary cancer analyses from the surveillance, epidemiology, and end results (SEER) Program. The Oncologist, 2007. [DOI | PubMed]
- KL Melmon, SW Rosen. Lindau’s disease. Review of the literature and study of a large kindred. Am. J. Med., 1964. [DOI | PubMed]
- O Pich. The mutational footprints of cancer therapies. Nat. Genet., 2019. [DOI | PubMed]
- C Cybulski, S Nazarali, SA Narod. Multiple primary cancers as a guide to heritability. Int. J. Cancer, 2014. [DOI | PubMed]
- B Vogelstein, KW Kinzler. Cancer genes and the pathways they control. Nat. Med., 2004. [DOI | PubMed]
- MH Tan. Lifetime cancer risks in individuals with germline PTEN mutations. Clin. Cancer Res., 2012. [DOI | PubMed]
- MC King, JH Marks, JB Mandell. Breast and ovarian cancer risks due to inherited mutations in BRCA1 and BRCA2. Science, 2003. [DOI | PubMed]
- SEM van de Ven. Increased risk of second primary tumours in patients with oesophageal squamous cell carcinoma: A nationwide study in a Western population. United Eur. Gastroenterol. J., 2021. [DOI]
- MG Cumberbatch, M Rota, JW Catto, C La Vecchia. The role of tobacco smoke in bladder and kidney carcinogenesis: A comparison of exposures and meta-analysis of incidence and mortality risks. Eur. Urol., 2016. [DOI | PubMed]
- M Ławniczak. Synchronous and metachronous neoplasms in gastric cancer patients: A 23-year study. World J. Gastroenterol., 2014. [DOI | PubMed]
- SW Kim. Multiple primary cancers involving lung cancer at a single tertiary hospital: Clinical features and prognosis. Thoracic Cancer, 2015. [DOI | PubMed]
- DJ McGrail. High tumor mutation burden fails to predict immune checkpoint blockade response across all cancer types. Ann. Oncol., 2021. [DOI | PubMed]
- A Marabelle. Association of tumour mutational burden with outcomes in patients with advanced solid tumours treated with pembrolizumab: Prospective biomarker analysis of the multicohort, open-label, phase 2 KEYNOTE-158 study. The Lancet Oncol., 2020. [DOI | PubMed]
- JJ Luke, KT Flaherty, A Ribas, GV Long. Targeted agents and immunotherapies: Optimizing outcomes in melanoma. Nat. Rev. Clin. Oncol., 2017. [DOI | PubMed]