Structural insights into the complex of oncogenic KRas4BG12V and Rgl2, a RalA/B activator
Abstract
The work reports the KRas4BG12V oncogenic mutation alters the binding kinetics with Rgl2, a RalA/B activator, and the V12 resides at the KRas4B(G12V)•Rgl2 complex interface in the crystal structure.
Affiliations: https://ror.org/04h699437Department of Molecular and Cell Biology, University of Leicester , Leicester, UK; https://ror.org/00ws30h19Department of Chemistry, Tokyo Metropolitan University , Hachioji, Japan; https://ror.org/04h699437Leicester Institute of Structure and Chemical Biology, University of Leicester , Leicester, UK; https://ror.org/04h699437Department of Chemistry, University of Leicester , Leicester, UK
License: © 2023 Tariq et al. CC BY 4.0 This article is available under a Creative Commons License (Attribution 4.0 International, as described at https://creativecommons.org/licenses/by/4.0/).
Article links: DOI: 10.26508/lsa.202302080 | PubMed: 37833074 | PMC: PMC10576006
Relevance: Moderate: mentioned 3+ times in text
Full text: PDF (10.1 MB)
Introduction
Ras belongs to a family of small G protein that switches between two states, GDP-bound form (RasGDP) and GTP-bound form (RasGTP), and regulates a wide range of cellular activities (ref. Cox & Der, 2010). Guanine nucleotide exchange factors (GEFs), typically activated by growth factor signalling, mediate the conversion of RasGDP to RasGTP, whereas the GTP-bound status lasts only transiently as the intrinsic GTPase activity, aided by the GTPase-activating proteins, hydrolyses the bound GTP into GDP (ref. Vetter & Wittinghofer, 2001). Ras acts as a signalling hub where the RasGTP, but not RasGDP, physically interacts with multiple Ras effectors, which then transmits the signal to downstream molecules, including ERK, Akt, and small G proteins RalA and RalB (ref. Simanshu et al, 2017).
There are three human RAS genes, KRAS, NRAS, and HRAS, and as KRAS is alternatively spliced at exon 4, the three RAS genes produce four Ras isoforms KRas4A, KRas4B, NRas, and HRas (ref. Castellano & Santos, 2011). Among them, KRAS4B typically represents more than half of all RAS transcripts (ref. Newlaczyl et al, 2017). The Catalogue Of Somatic Mutations In Cancer (COSMIC) shows that about 25% of all cancers carry mutations in RAS genes, and KRAS is responsible for about 70% of these mutations (COSMIC, v.95). Hence, it is vital to obtain more insights into how the oncogenic KRas signalling leads to cancers.
Extensive earlier biochemical studies revealed that oncogenic Ras mutations cause a reduction of the GTP hydrolysis rate, generating an increased population of RasGTP (ref. Gibbs et al, 1984; ref. McGrath et al, 1984; ref. Manne et al, 1985; ref. Der et al, 1986; ref. Bollag & McCormick, 1991; ref. Scheffzek et al, 1997). This likely leads to an overactivation of the downstream signalling pathways and therefore is considered the major cause of the KRas oncogenicity. In addition, recent biochemical, structural, and molecular modelling studies indicate that oncogenic Ras mutations affect the interaction kinetics with the effector molecules and may trigger a biased overactivation of a set of effectors (ref. Smith & Ikura, 2014; ref. Hunter et al, 2015; ref. Mazhab-Jafari et al, 2015; ref. Pantsar et al, 2018). Therefore, obtaining more insights into the Ras-effector interaction mechanisms are essential to understand the oncogenic Ras–mediated tumorigenesis process.
Effector molecules that have been shown to interact with Ras all carry a domain consisting of an ubiquitin-fold structure, although the primary sequences of these domains show a limited homology (ref. Kiel & Serrano, 2006). They are classified into three categories according to Uniprot PROSITE-ProRule annotation based on their primary sequences; Ras-associating (RA) (PRU00166), Ras-binding domain (RBD) (PRU002262), and phosphatidylinositol 3-kinase Ras-binding domain (PI3K-RBD) (PRU00879). In this study, we follow these annotations.
Among Ras effectors, Raf kinase and PI3K, which triggers ERK and Akt signalling, respectively, have attracted much attention, especially because they were found not only to be activated by oncogenic Ras but also to be able to carry oncogenic mutations themselves (ref. Chalhoub & Baker, 2009; ref. Maurer et al, 2011). However, accumulating evidence suggests that the misregulation of Ral GTPases, RalA, and RalB, rather than ERK and Akt signalling pathways, may act as the initial trigger of oncogenic Ras–induced tumorigenesis. For example, in the oncogenic K-ras(G12D) knock-in mouse model, although neoplastic and developmental defects were observed, hyper-activation of ERK or Akt was undetected (ref. Tuveson et al, 2004). In humans, ERK hyper-activation is often missing in cancer cell lines and tissues with oncogenic RAS mutations, whereas RalA and RalB are essential in oncogenic Ras–induced cell proliferation, motility, and tumorigenesis (ref. Miller et al, 1997; ref. Luo & Sharif, 1999; ref. Yip-Schneider et al, 1999, ref. 2001; ref. Lim et al, 2005, ref. 2006; ref. Campbell et al, 2007; ref. Zago et al, 2018). Therefore, a biased misregulation of the Ral GTPases may be the critical feature behind Ras oncogenicity. Indeed, nuclear magnetic resonance (NMR)-based effector competition assays suggested the intriguing possibility that the oncogenic Ras molecules may develop an altered effector preference, leading to a biased hyperactivation of RalA (ref. Smith & Ikura, 2014).
Activation of RalA and RalB is mediated by guanine nucleotide exchange factors (RalGEFs). There are eight RalGEFs reported for humans, and four of them, RALGDS, Rgl1, Rgl2, and Rgl3, have a Ras-association (RA) domain responsible for Ras-binding (ref. Apken & Oeckinghaus, 2021). RALGDS was the first to be identified as a Ras effector among these RalGEFs and is by far the most studied (ref. Neel et al, 2011). RALGDS is one of the first effector molecules that was crystallised together with an active Ras; rat RALGDS was co-crystalised with human HRas harbouring an E31K mutation, which helped complex formation (ref. Huang et al, 1998). Meanwhile, a recent modelling approach, integrating proteomic data of Ras, its 56 effectors and their interaction affinities, predicts that Rgl2 would generate the highest concentration of Ras:effector complex among RalGEFs in 28 out of 29 healthy human tissues (ref. Catozzi et al, 2021). Furthermore, Rgl2 plays a critical role in oncogenic Ras–induced tumour phenotypes (ref. Vigil et al, 2010), and overexpression of the Rgl2RA interferes with Ras-mediated signaling, likely by competitively titrating active Ras molecules (ref. Peterson et al, 1996; ref. Fischer et al, 2003).
Human Rgl2 and its mouse homologue, Rlf, were initially identified through yeast two-hybrid screenings and were shown to interact with Ras through the RA domain in vitro (ref. Esser et al, 1998; ref. Ferro et al, 2008; ref. O’Gara M et al, 1997; ref. Peterson et al, 1996; ref. Wolthuis et al, 1996). Furthermore, in vivo interaction of Rgl2 and Ras was reported in a BioID-based proteomics study where Rgl2 was among other proximal interactors identified using HRas.G12V expressed in bladder cancer cells (ref. Kovalski et al, 2019). In addition, the full-length Rlf was shown to interact with HRas.G12V and acted as a RalGEF when expressed in COS-7 cells (ref. Wolthuis et al, 1997). However, the Ras:Rgl2 complex interface at an atomic level has not been explored. Furthermore, whether oncogenic mutations influence the interaction kinetics or not is unclear, making it difficult to appreciate the impact of an oncogenic mutation in activating the RalGEF signalling branch that plays an essential role in the oncogenic Ras-mediated tumorigenesis.
To address the question, we examined the mode of interaction between human KRas4B and the RA of Rgl2 (Rgl2RA) in this report. We observed a change in the interaction kinetics between KRas4B and the Rgl2RA upon the introduction of the G12V oncogenic mutation. Our crystal structure of KRas4BG12V:Rgl2RA complex shows a heterotetramer formation, highly similar to the reported HRasE31K:RALGDSRA complex, but distinct from other Ras:effector complexes, including Ras:Raf1. Interestingly, in our structure, the G12V oncogenic mutation is located at the dimer interface of KRas4BG12V with its homodimeric partner. Our findings provide an interesting possibility that KRas4BG12V oncogenicity might be contributed by the altered interaction kinetics with Rgl2.
Results
The G12V oncogenic mutation causes a change in the interaction kinetics between the KRas4B and the Rgl2RA
Throughout this study, we used recombinant bacteria constructs of human KRas4B lacking the C-terminal hyper-variable region and the Rgl2RA consisting of amino acids 643–740 of human Rgl2 (Fig S1A). The binding of Rgl2RA and KRas4BG12V was confirmed for the active KRas4BG12V loaded with a non-hydrolysable GTP analogue (Guanosine-5′-[(β,γ)-imido]triphosphate [GMPPNP]), but not with the GDP-loaded KRas4BG12V, by GST-pulldown assays (Fig S1B). To examine whether the binding mode of Rgl2RA differs between KRas4BWT and KRas4BG12V, the binding kinetics were measured by biolayer interferometry (BLI). We noticed that both KRas4BWT and KRas4BG12V, purified at 4°C at all times, retained GTP as the major bound guanine nucleotide. In addition, in our hands, the efficacy of GMPPNP loading could vary between samples, whereas the efficacy of GTP loading was highly reproducible. We also confirmed that the KRas4BWT and KRas4BG12V samples that were subjected to the incubation condition of the BLI assay (20°C for 30 min) were still associated with GTP (Fig 1A). Therefore, we loaded the samples with GTP and used these GTP-bound samples for the BLI experiment so that we could minimize possible artefacts caused by GMPPNP.
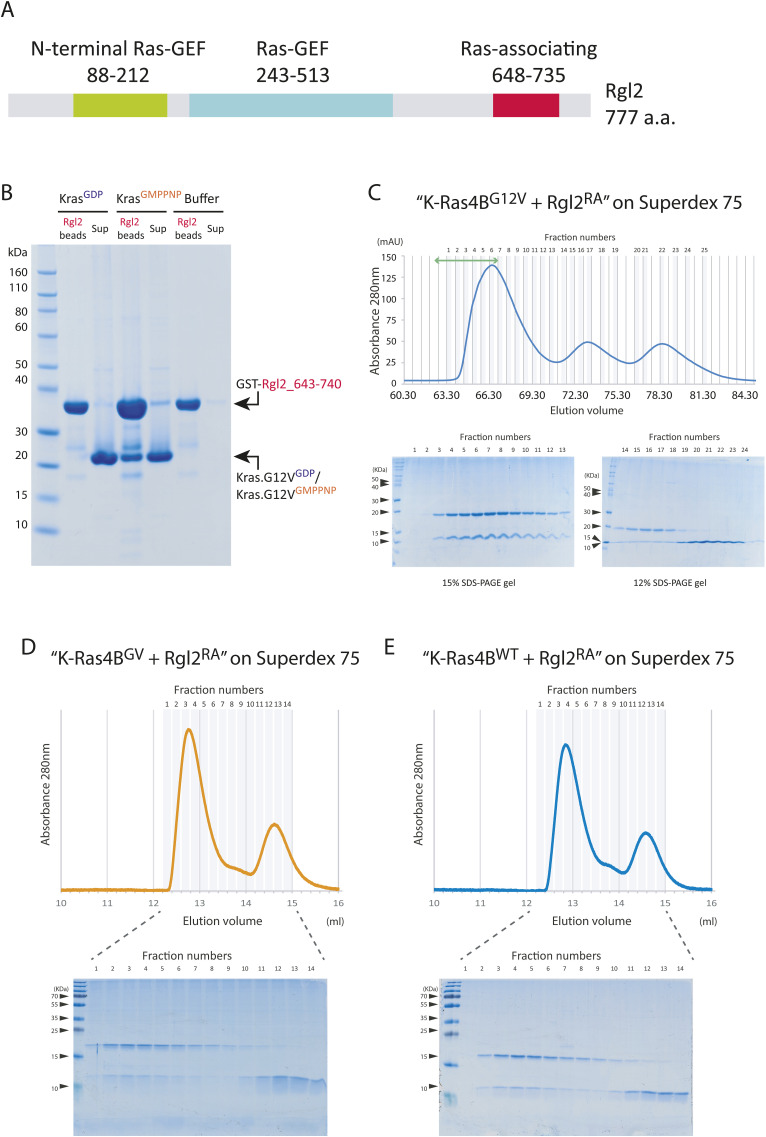
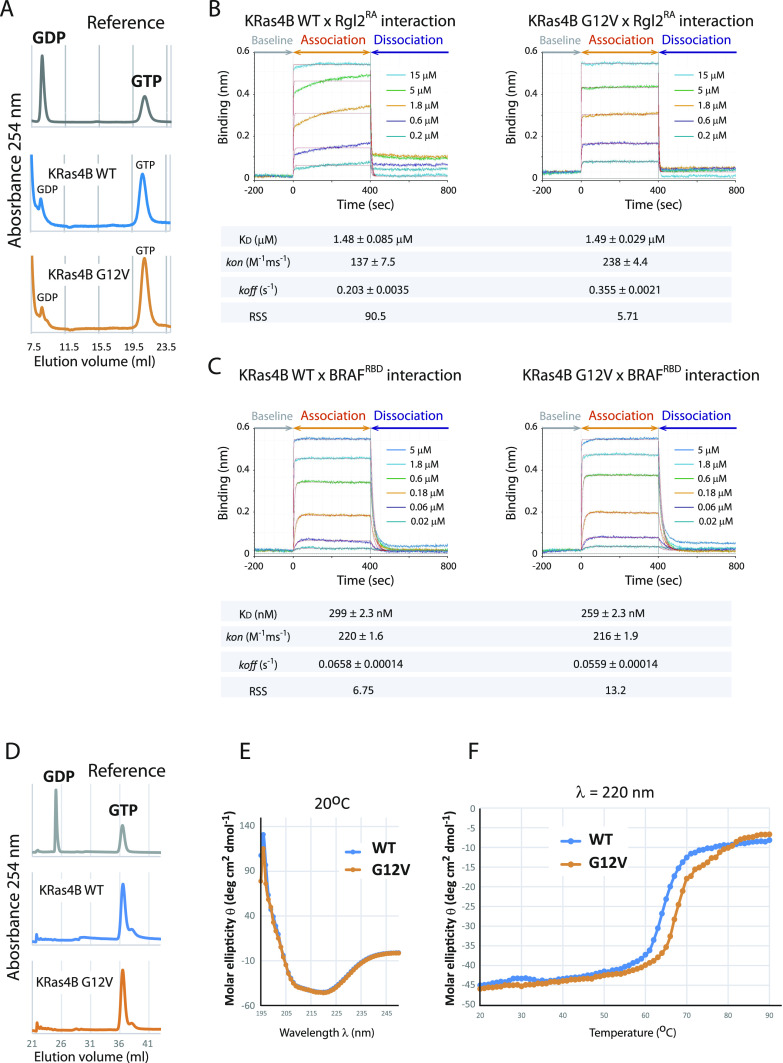
The sensorgram curves representing the on/off kinetics between KRas4B and Rgl2RA were distinct when using the KRas4BWT or KRas4BG12V proteins (Fig 1B). When the KRas4B–Rgl2RA-binding kinetics results were model-fitted using a 1:1 binding model, the kon and koff values were larger in the case of the G12V mutant, indicating more dynamic interaction between the G12V mutant and Rgl2RA (Fig 1B). Meanwhile, the KD values were comparable between the KRas4BWT (about 1.48 μM) and KRas4BG12V (about 1.49 μM) (Fig 1B), and the elution profiles of the size exclusion chromatography (SEC) showed little difference between the wildtype and the G12V mutant (Fig S1D and E).
Interestingly, the KRas4BWT–Rgl2RA sensorgram curve was more consistent with a 2:1 heterogeneous binding model fitting or a 1:2 bivalent binding model fitting (Data Analysis HT Software, Sartorius), as indicated by the improvement of the residual sum of squares (RSS) value; from about 90.5 (the 1:1 model, Fig 2B) to about 1.05 (the 2:1 model, Fig S2A) or 1.85 (the 1:2 model, Fig S2A). Therefore, the KRas4BWT–Rgl2RA interaction does not correspond to a simple 1:1 binding mode. In contrast, for the KRas4BG12V–Rgl2RA sensorgram curve, the RSS values for the 1:1 and the 2:1 model fittings were comparable; about 5.71 for the 1:1 model (Fig 1B) and about 4.40 for the 2:1 model (Fig S2B). Furthermore, in the 2:1 heterogeneous model, “Binding type 2” represents 95–100% of the whole population, where the values for the KD, kon, and koff are all similar to the ones deduced from the 1:1 binding model (Fig S2B). These results strongly indicate that the binding of the KRas4BG12V–Rgl2RA complex is compatible with a 1:1 binding.
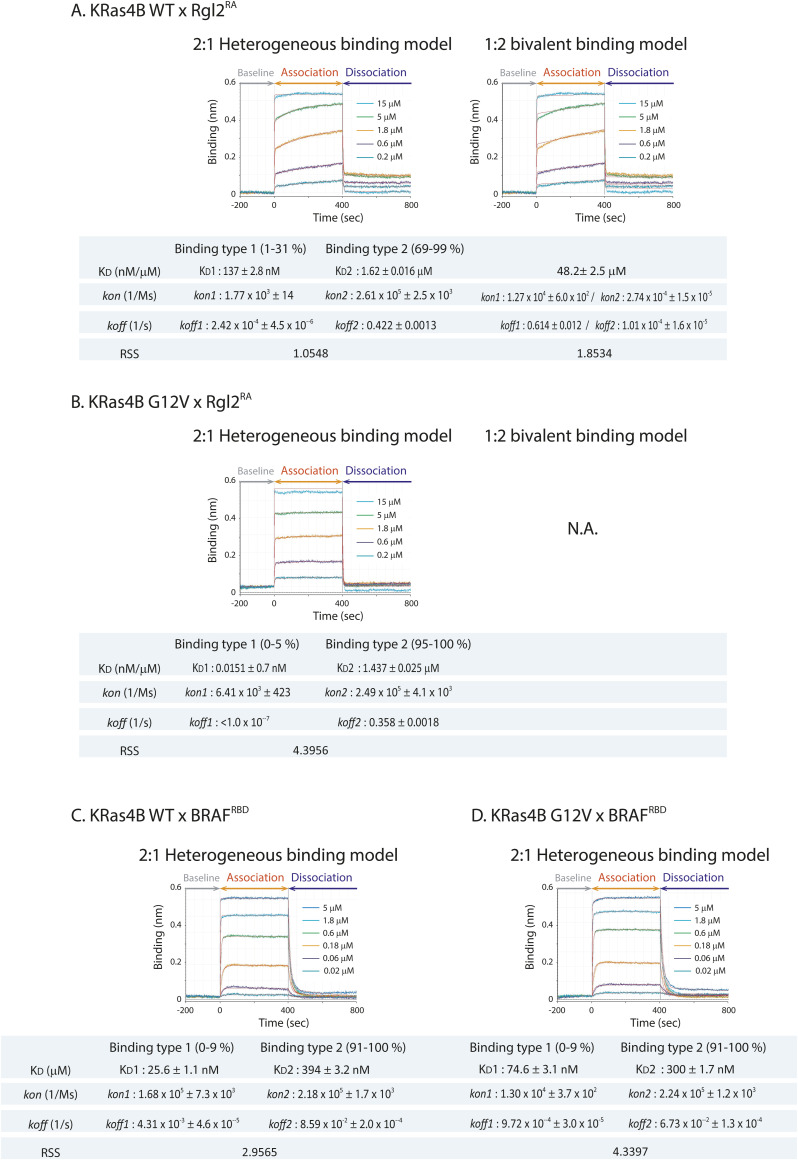
The difference in kinetics of binding observed for KRas4BWT and KRas4BG12V mutant with Rgl2RA contrasts with the on/off kinetics for KRas4BWT and KRas4BG12V mutant with BRAFRBD, a well-established Ras effector. In that case, BRAFRBD interacted with both the wildtype and the G12V mutant in a similar manner (Fig 1C). The fitting using a 1:1 binding model was adequate for both KRas4BWT and KRas4BG12V cases (the RSS values are about 6.75 and 13.2, respectively, Fig 1C) and the 2:1 binding model only marginally improved the fitting (the RSS values are about 2.96 and 4.34, respectively, Fig S2C).
These results indicate that the G12V oncogenic mutation may impact more significantly on the Rgl2-mediated signalling pathway and highlight the distinct binding mode of KRas4BWT and KRas4BG12V mutant to Rgl2RA compared with BRAFRBD.
The circular dichroic (CD) spectra for KRas4BWT and KRas4BG12V samples across the increasing temperature from 20°C to 90°C showed improved structural stability for KRas4BG12V, which might contribute to the altered binding kinetics towards Rgl2RA (Fig 1D–F).
A 2:2 tetramer of KRas4BG12V:Rgl2RA complex in the crystal structure
We conducted crystallization trials to obtain structural insights into the KRas4B:Rgl2RA complex. To purify the complex, a mixture of GMPPNP-loaded KRas4B and Rgl2RA was applied onto a size-exclusion column. The major elution peak corresponded to the co-elution of KRas4BG12V and Rgl2RA as a complex, and, as expected, the complex eluted earlier than KRas4BG12V or Rgl2RA alone (Fig S1C).
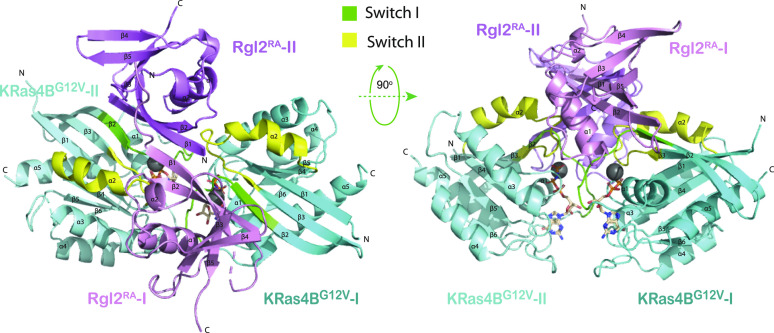
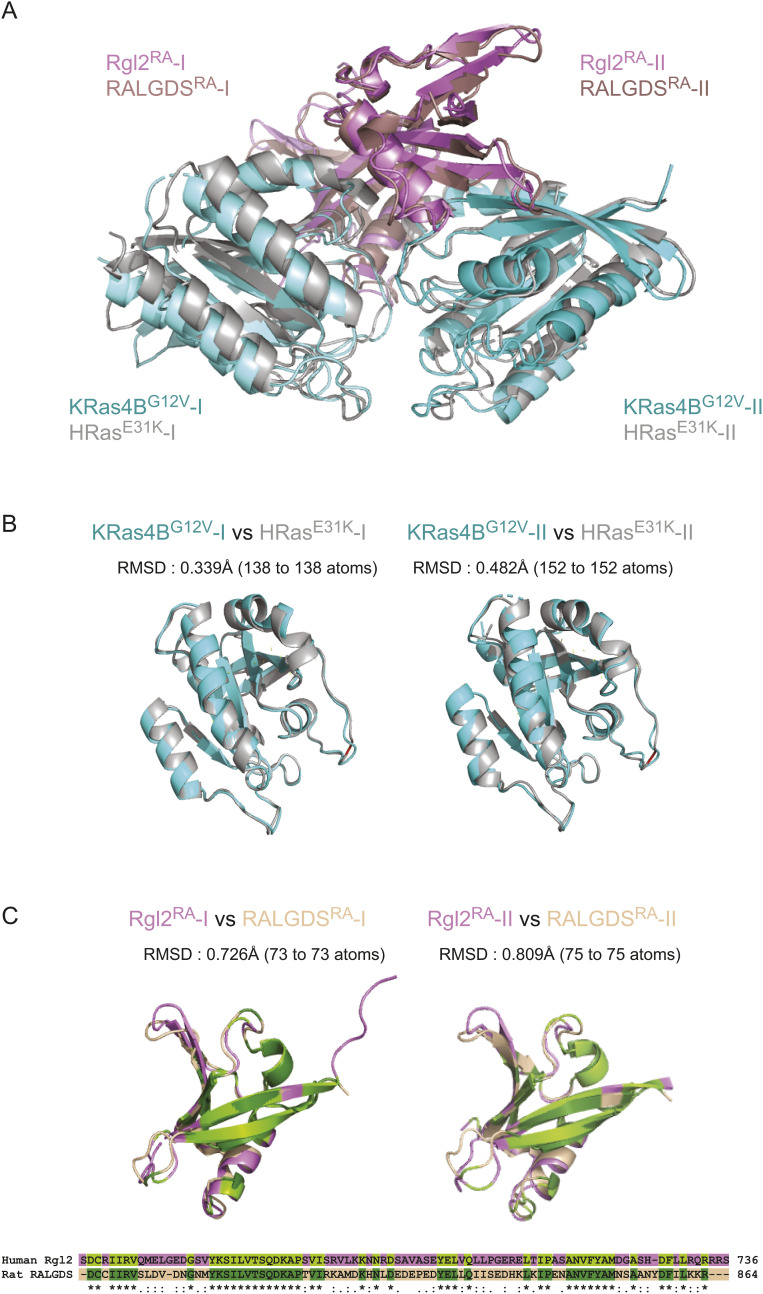
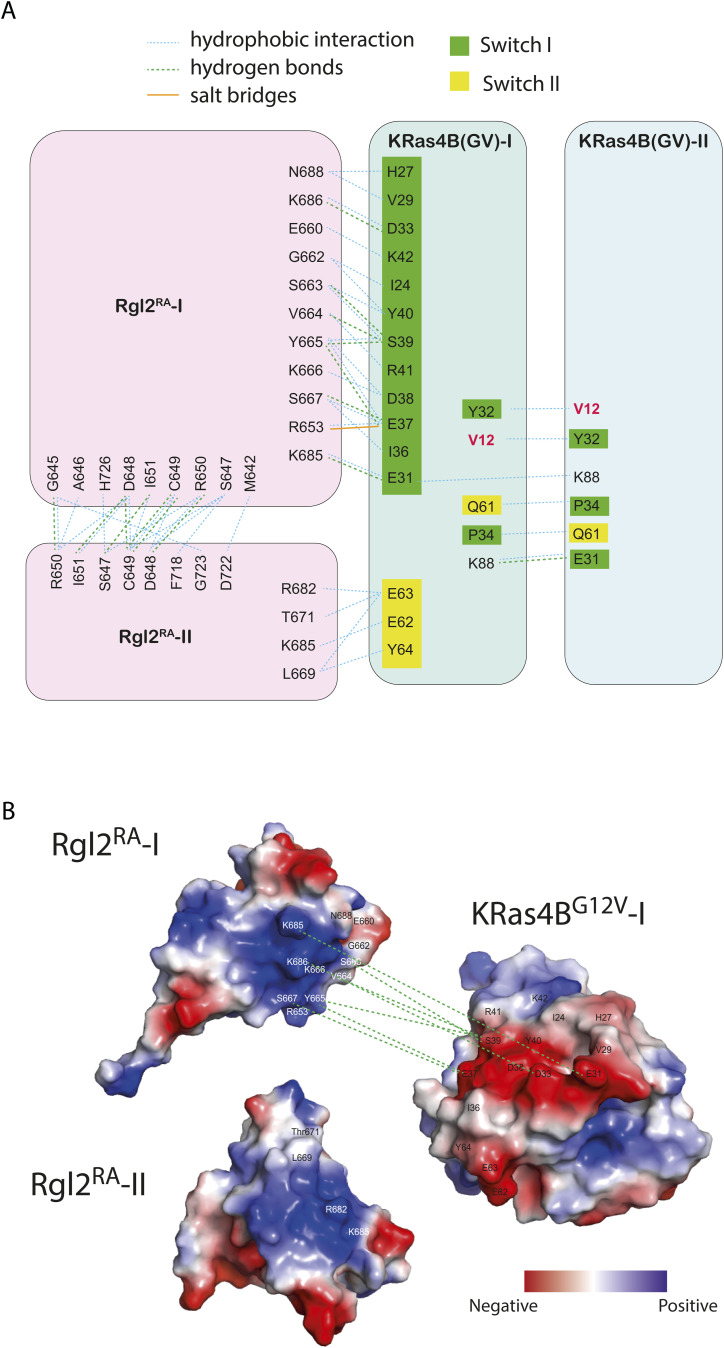
Crystals of the KRas4BG12V:Rgl2RA complex were obtained which diffracted at a resolution of 3.07 Å (Table 1). The phase was solved by molecular replacement using the structure of the human HRasE31K:rat RALGDSRA complex (PDB ID 1LFD) (ref. Huang et al, 1998). The space group was assigned to P1211 with four proteins per asymmetric unit (two molecules of KRasG12V and two molecules of Rgl2RA) arranged as a tetramer (Fig 2). The overall arrangement of KRas4BG12V:Rgl2RA crystal structure is similar to HRasE31K:RALGDSRA crystal structure (PDB ID 1LFD [ref. Huang et al, 1998]) (Fig S3A–C). The complex forms a 2:2 heterotetramer where β2 (within switch I) of KRasG12V and β2 of Rgl2RA generate a continuously extended β-sheet, along with interaction at switch II of the same KRasG12V molecule with the second Rgl2RA molecule (Figs 3A–C and 4A and B). In both KRas4BG12V:Rgl2RA and HRasE31K:RALGDSRA cases, the Ras–Ras interface is formed within the region spanning amino acids 1–90 where KRas4BG12V and HRasE31K share 100% amino acid sequence identity except for the point mutations G12V and E31K. The KRas4BG12V:Rgl2RA heterotetramer complex is stabilized by a network of hydrogen bonds and hydrophobic interactions (summarized in Fig S4A), leading to complimentary surface charges (Fig S4B).
Table 1.: Data collection and refinement statistics for human KRas4BG12V:Rgl2RA complex.
| Wavelength | 0.9795 |
|---|---|
| Resolution range | 28.68–3.071 (3.18–3.071) |
| Space group | P 32 2 1 |
| Unit cell | 77.843 77.843 163.728 90 90 120 |
| Total reflections | 106,507 (7,598) |
| Unique reflections | 11,107 (949) |
| Multiplicity | 9.6 (8.0) |
| Completeness (%) | 98.22 (86.51) |
| Mean I/sigma(I) | 11.15 (1.64) |
| Wilson B-factor | 95.59 |
| R-merge | 0.1313 (0.6732) |
| R-meas | 0.1389 (0.7159) |
| R-pim | 0.04474 (0.2379) |
| CC1/2 | 0.998 (0.957) |
| CC* | 1 (0.989) |
| Reflections used in refinement | 11,065 (936) |
| Reflections used for R-free | 582 (41) |
| R-work | 0.2367 (0.3229) |
| R-free | 0.3204 (0.3572) |
| CC (work) | 0.943 (0.897) |
| CC (free) | 0.851 (0.486) |
| Number of non-hydrogen atoms | 4,116 |
| Macromolecules | 4,050 |
| Ligands | 66 |
| Solvent | 0 |
| Protein residues | 514 |
| RMS (bonds) | 0.007 |
| RMS (angles) | 1.40 |
| Ramachandran favored (%) | 95.22 |
| Ramachandran allowed (%) | 3.98 |
| Ramachandran outliers (%) | 0.80 |
| Rotamer outliers (%) | 0.89 |
| Clashscore | 14.47 |
| Average B-factor | 113.50 |
| Macromolecules | 113.74 |
| Ligands | 98.55 |
Statistics for the highest-resolution shell are shown in parentheses.
KRasG12V:Rgl2RA interface
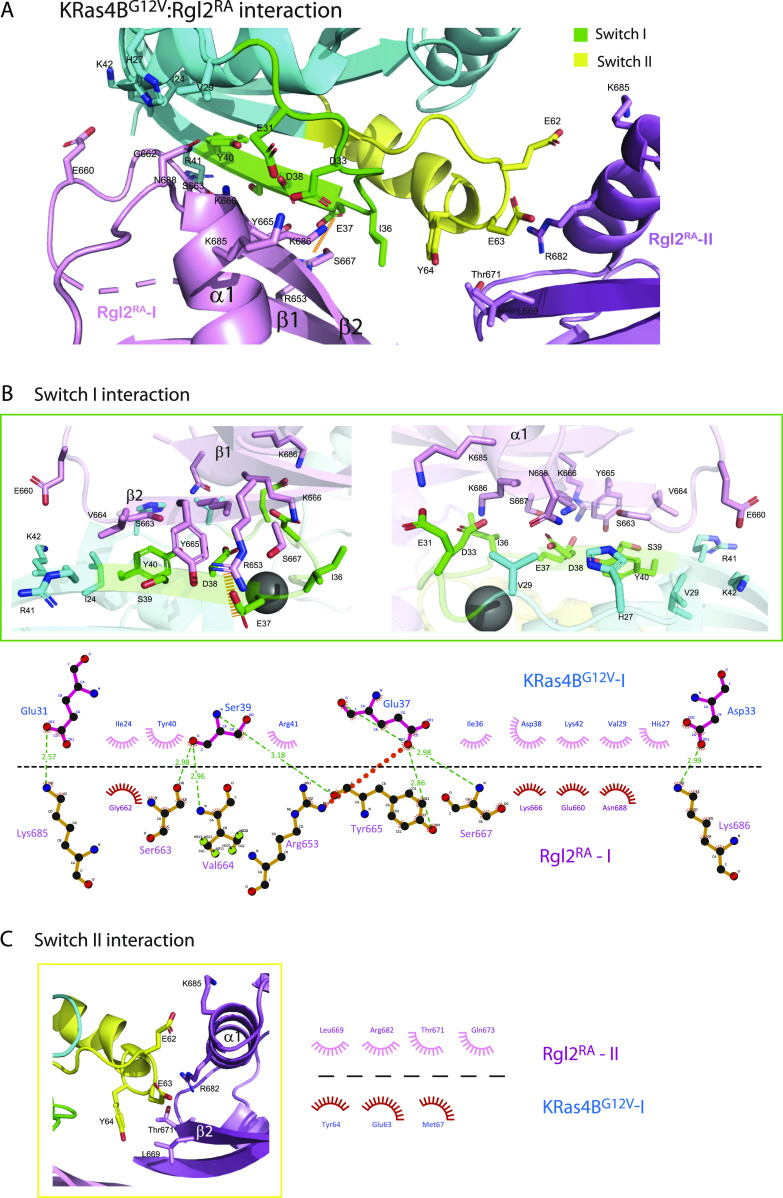
KRas4BG12V residues within the switch I interact with residues in β1, β2, and α1 of Rgl2RA. These interactions include a salt bridge between E37 of KRas4BG12V switch I and R653 of Rgl2RA (Fig 3A and B). The switch II of the same KRas4BG12V molecule also contributes to the complex formation by interacting with the second Rgl2RA through residues in β2 and α1 (Fig 3A and C).
KRasG12V: KRasG12V interface
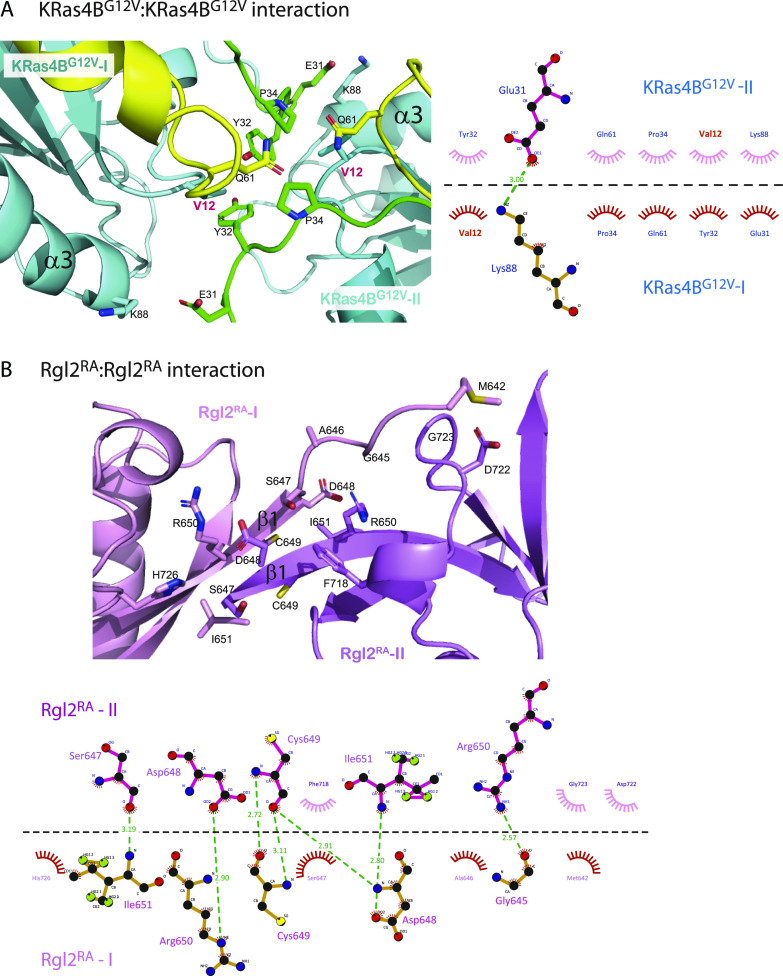
Meanwhile, two KRas4BG12V molecules have direct contact through switch I, switch II, and α3 (Figs 4A and S4A). Importantly, the V12 residue of the oncogenic G12V mutation is in the proximity of the ring of Y32 of the neighbouring KRas4BG12V, contributing to the KRas4BG12V: KRas4BG12V interface, increasing the hydrophobic pocket.
Rgl2RA:Rgl2RA interface
The β1 of both Rgl2RA molecules run anti-parallel to each other, interacting through various hydrophobic interactions and hydrogen bonds at both side-chain and backbone levels (Figs 4B and S4A).
Solution NMR analyses of the KRas4BG12V:Rgl2RA complex
The KRas4BG12V:Rgl2RA complex was furthermore analyzed in solution by NMR. First, the solution structure of free Rgl2RA was determined by solution NMR (Fig S5A) (Table 2). As expected, the structure adopts the ββαββαβ ubiquitin-fold structure, a common feature for the RA/RBDs (ref. Kiel & Serrano, 2006). Overall, it is similar to the structure of Rlf, the mouse homologue of human Rgl2 (PDB ID 1RLF) (ref. Esser et al, 1998) (Fig S5B). The solution structure of free Rgl2RA is also very similar to the crystal structure of Rgl2RA in the KRas4BG12V:Rgl2RA, indicating that the complex formation causes relatively small structural changes, and the crystal structure likely reflects the physiological Rgl2RA folding (Fig 5A).
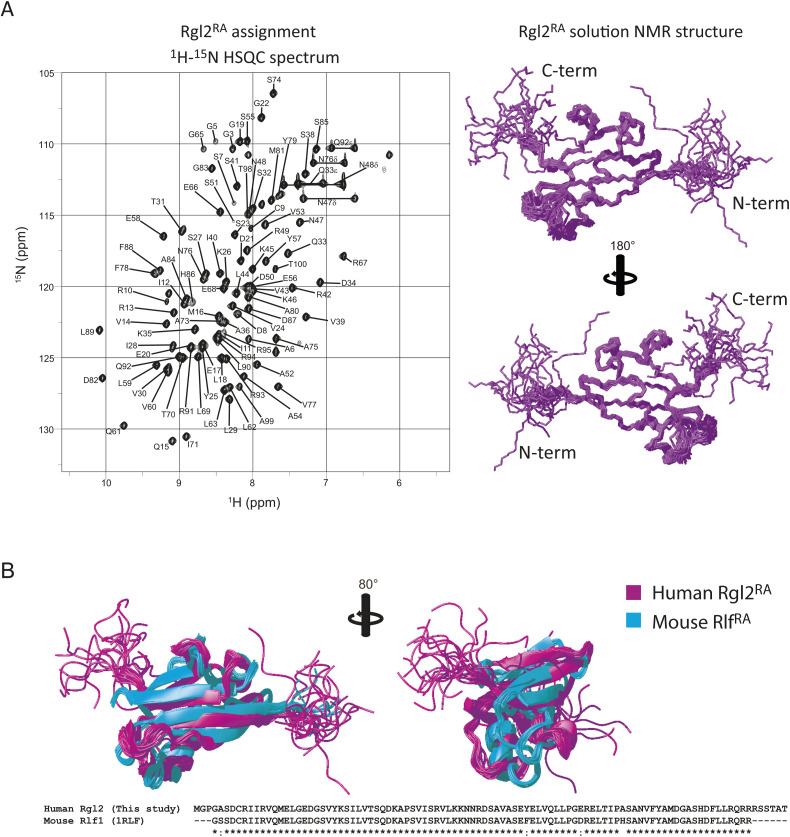
Table 2.: NMR structure statistics for Rgl2tblfn1.
| Quantity | |
|---|---|
| Assigned 1H/13C/15N chemical shifts | 305/256/56 |
| NOE distance restraintstblfn2 | 866/281/777 |
| Max. distance restraint violation (Å) | 0.13 ± 0.01 |
| Deviations from idealised geometry: | |
| Bond lengths (Å) | 0.0138 ± 0.0001 |
| Bond angles (º) | 1.81 ± 0.03 |
| AMBER energy (kcal/mol) | −3624.25 ± 78.09 |
| AMBER vdW energy (kcal/mol) | −279.71 ± 12.49 |
| Ramachandran plot statisticstblfn3 (%) | 89.5/10.5/0.1/0 |
| Backbone RMSD (Å)tblfn4 | 0.42 ± 0.05 |
| All heavy atom RMSD (Å)tblfn4 | 0.84 ± 0.06 |
| Backbone RMSD to the reference (Å)tblfn5 | 0.91 |
| All heavy atom RMSD to the reference (Å)tblfn5 | 1.68 |
a Where applicable, the average value and the SD over the 20 energy-refined conformers obtained by the program OPALp 2.1 in the presence of the experimental restraints. CYANA calculations were started from 100 conformers with random torsion angle values, simulated annealing with 10,000 torsion angle dynamics steps was applied.
b Short/medium/long-range distance restraints derived from NOESY spectra.
c Percentage of residues in the most favoured/additionally allowed/generously allowed/disallowed regions of the Ramachandran plot according the program PROCHECK.
d RMSD to the mean structure for residues 649–657, and 665–732.
e RMSD between the closest structure to the reference among the ensemble conformations and the reference structure (the crystal structure of the KRas4BG12V:Rgl2 complex).
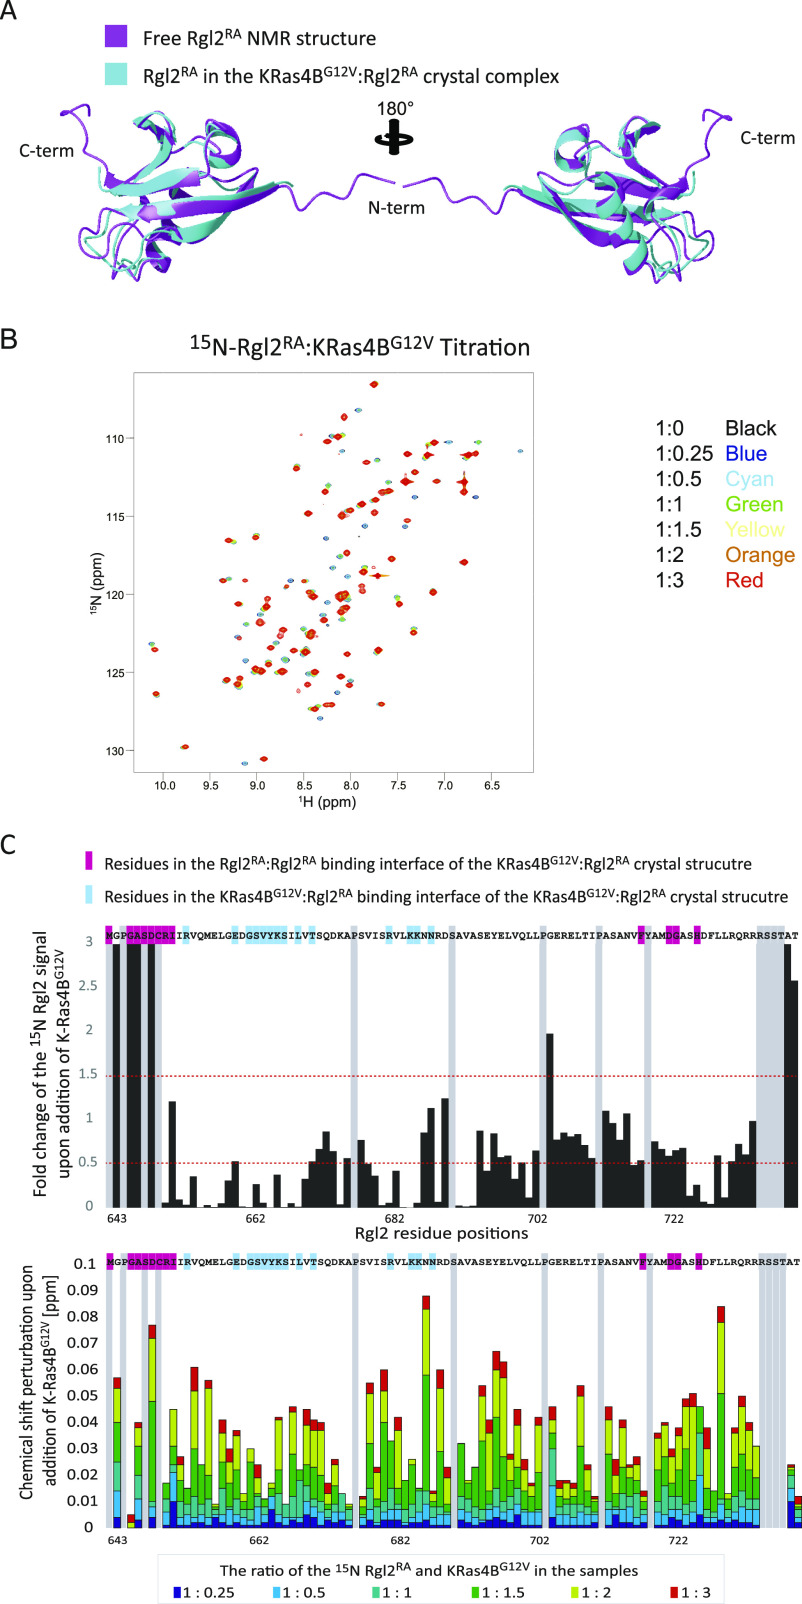
The KRas4BG12V:Rgl2RA complex was next analyzed in solution by NMR chemical shift perturbation. Two-dimensional (2D) 15N–1H-heteronuclear single quantum coherence (HSQC) spectra were measured for the 15N-labelled Rgl2RA sample in the absence or presence of an increasing amount of non-labelled KRas4BG12V (Fig 5B and C). Chemical shift perturbations were observed for many of the Rgl2RA residues, in agreement with KRas4BG12V:Rgl2RA complex formation in solution. Most of the Rgl2RA residues at the KRas4BG12V:Rgl2RA and Rgl2RA:Rgl2RA interfaces in the crystal structure showed greater changes (either decreased or increased) in their NMR signal intensities and in chemical shift perturbation, indicating their participation in the complex formation and supporting the heterodimer interface observed in the crystal structure (Fig 5B and C). Signals from the Rgl2RA residues in β1 at the N-terminal end (642–649) display the largest changes. This is in agreement with the KRas4BG12V:Rgl2RA heterotetramer crystal structure where the highly flexible N-terminal region of free Rgl2RA (Fig S5A) becomes rigid through interaction with another Rgl2 molecule in the heterotetramer (Fig 4B). In addition, the overall decrease in the NMR signals is compatible with the formation of a relatively large complex such as the KRas4BG12V:Rgl2RA heterotetramer complex (62 kD). Meanwhile, the titration experiment showed that the chemical shift changes were not fully saturated in most of the Rgl2RA residues when the Rgl2RA:KrasG12V molar ratio was 1:1 or even 1:2 (Fig 5C), suggesting that the stoichiometry is more complex than simple 1:1, possibly due to the heterotetramer formation.
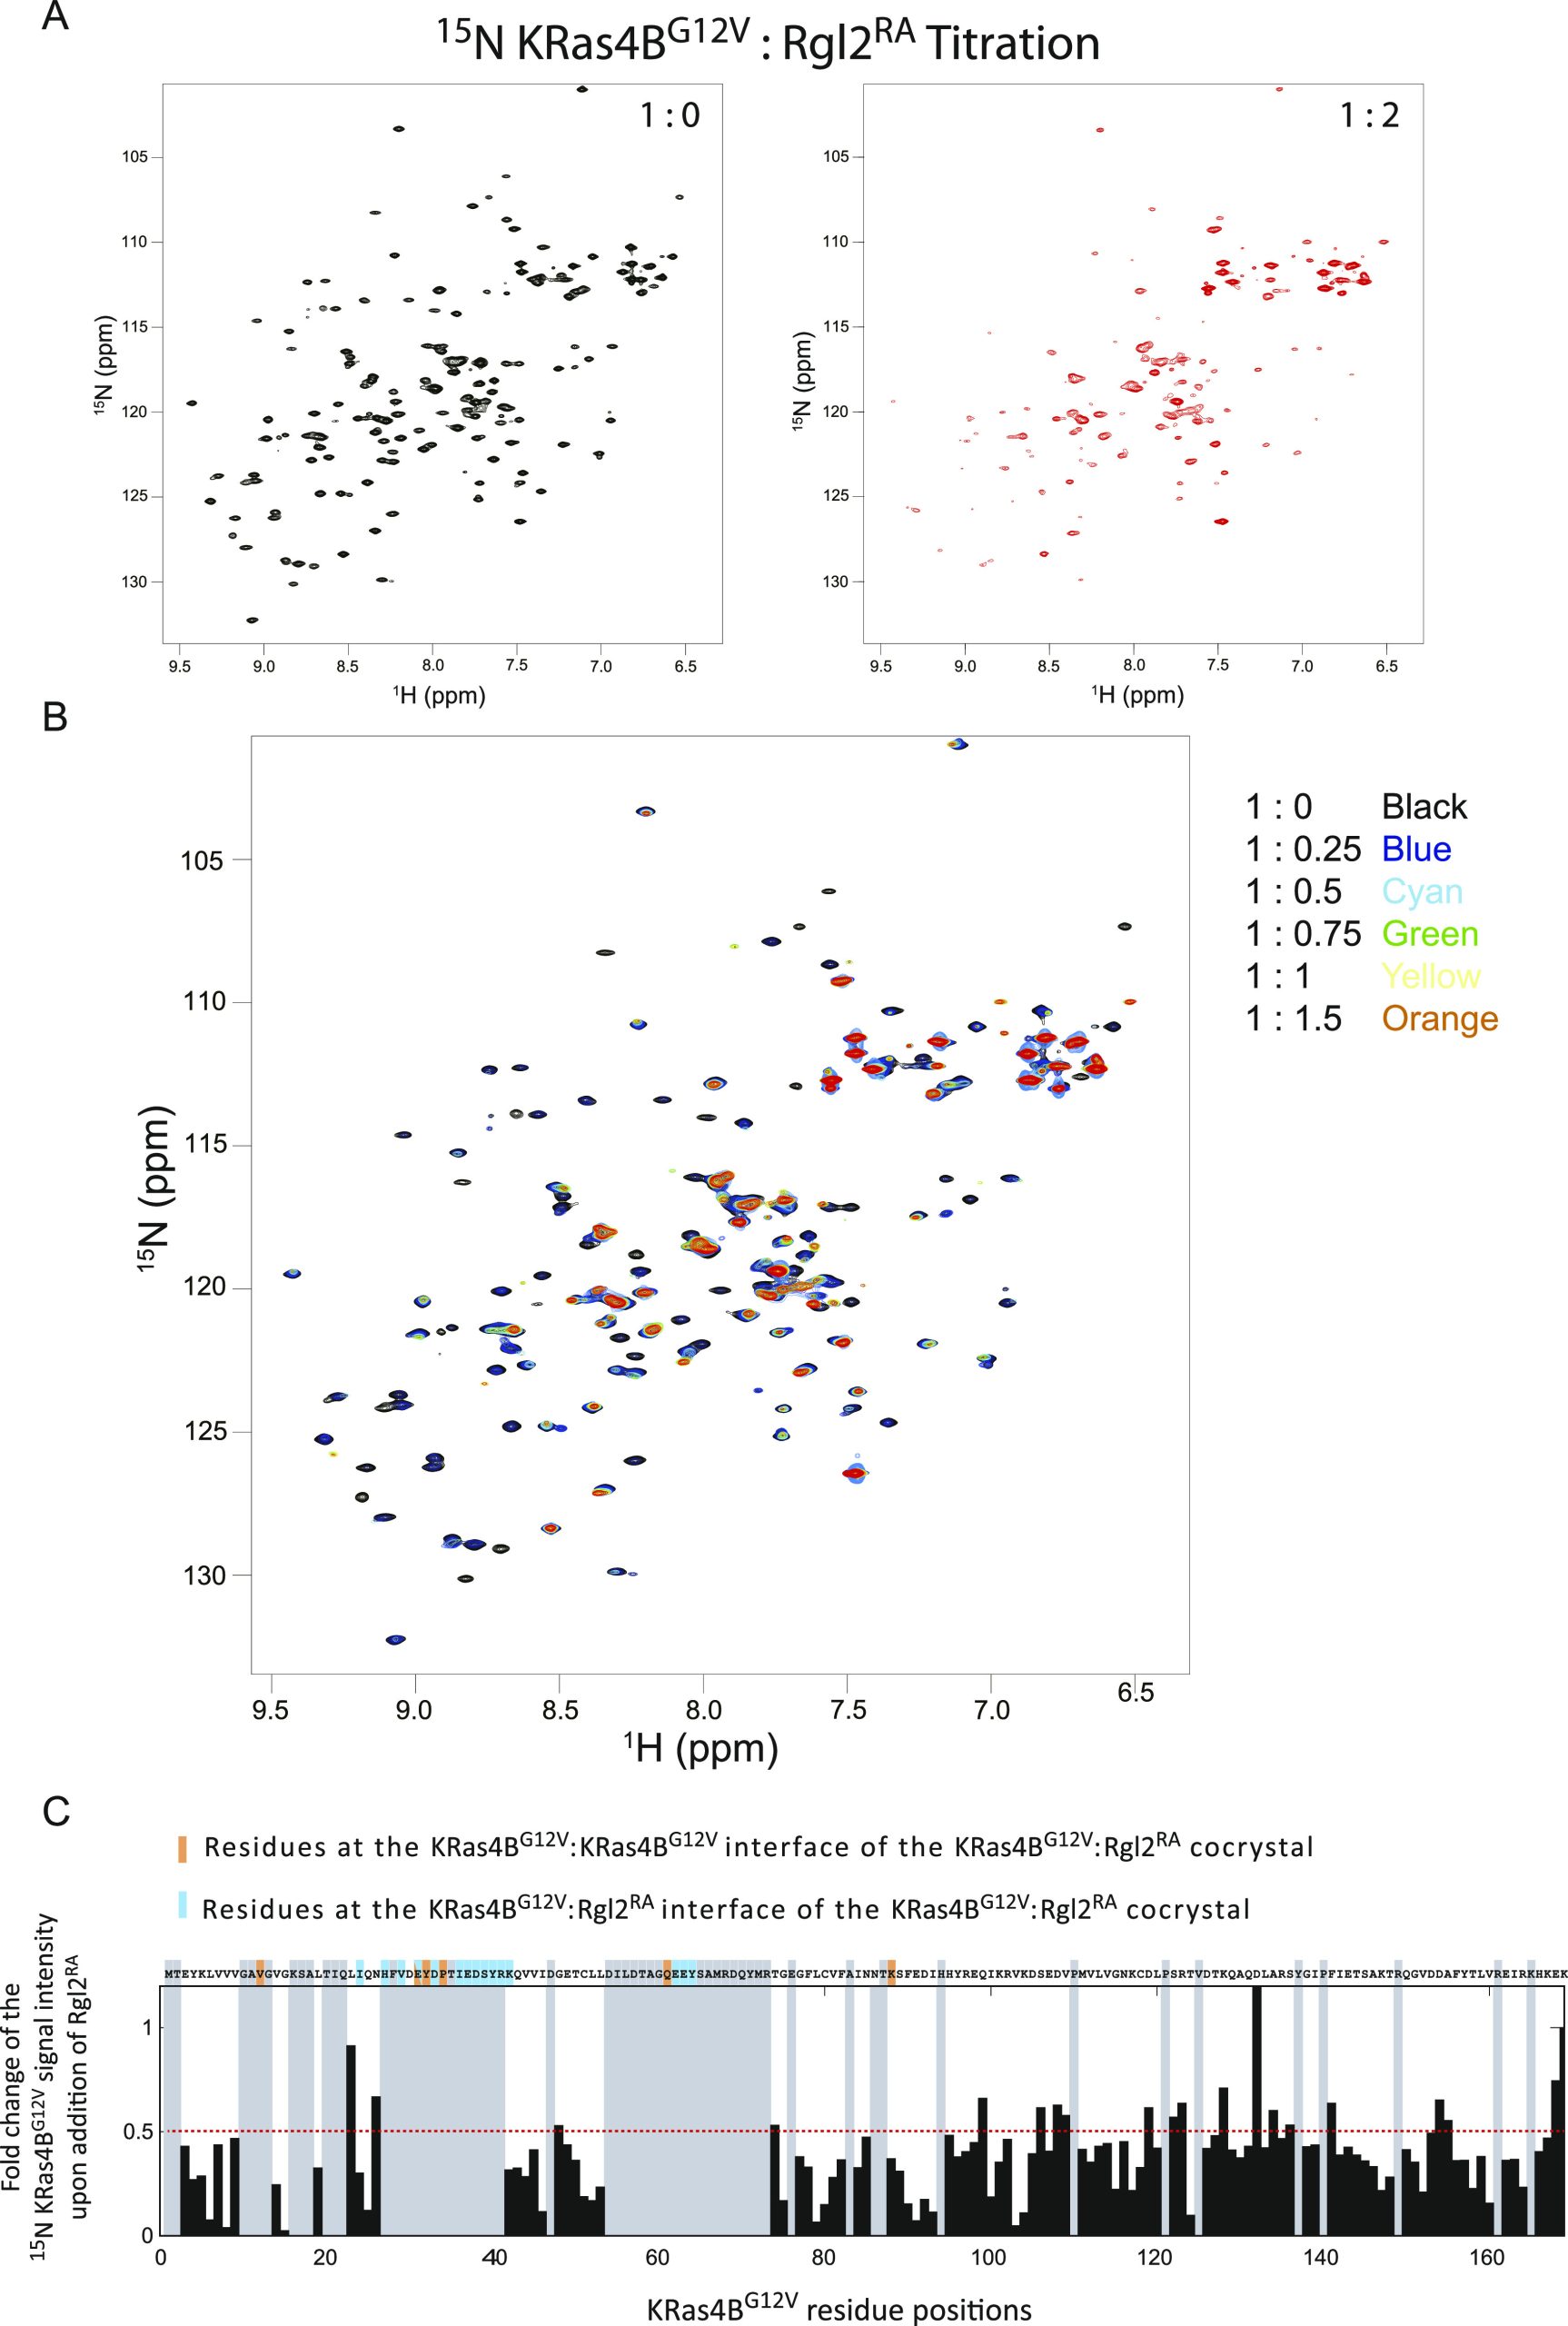
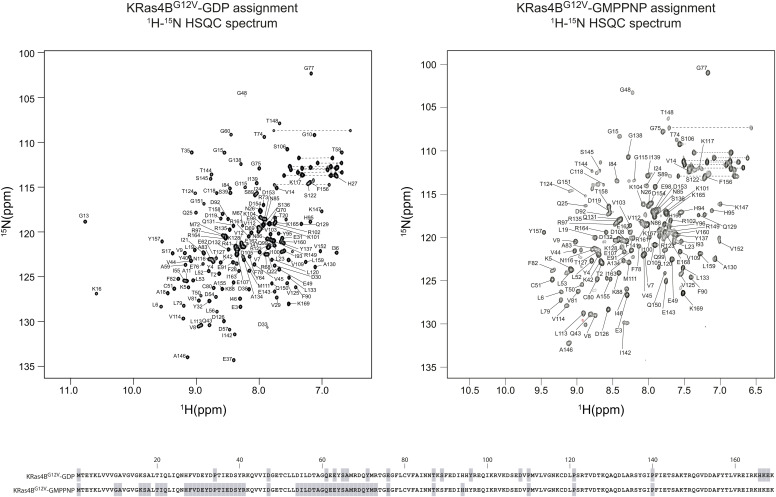
We next examined the NMR chemical shift perturbation of KRas4BG12V in solution in the absence or presence of non-labelled Rgl2RA (Fig 6). When loaded with GMPPNP, the number of detectable peaks of the 15N-labelled KRas4BG12V signal is substantially decreased compared with the number of signals obtained from the GDP-loaded sample (Fig S6) as previous studies reported (ref. Ito et al, 1997; ref. Menyhard et al, 2020). Consequently, unfortunately, most of the KRas4BG12V residues at the KRas4BG12V:Rgl2RA complex interface could not be detected (Fig 6A and B), except for K42 and K88, both of which showed substantially decreased signal intensities upon Rgl2RA addition, in agreement with their expected participation in the complex formation (Fig 6C). Furthermore, the addition of Rgl2RA leads to a decrease of most of the KRas4BG12V signals further suggesting formation of a relatively large complex, like the heterotetramer.
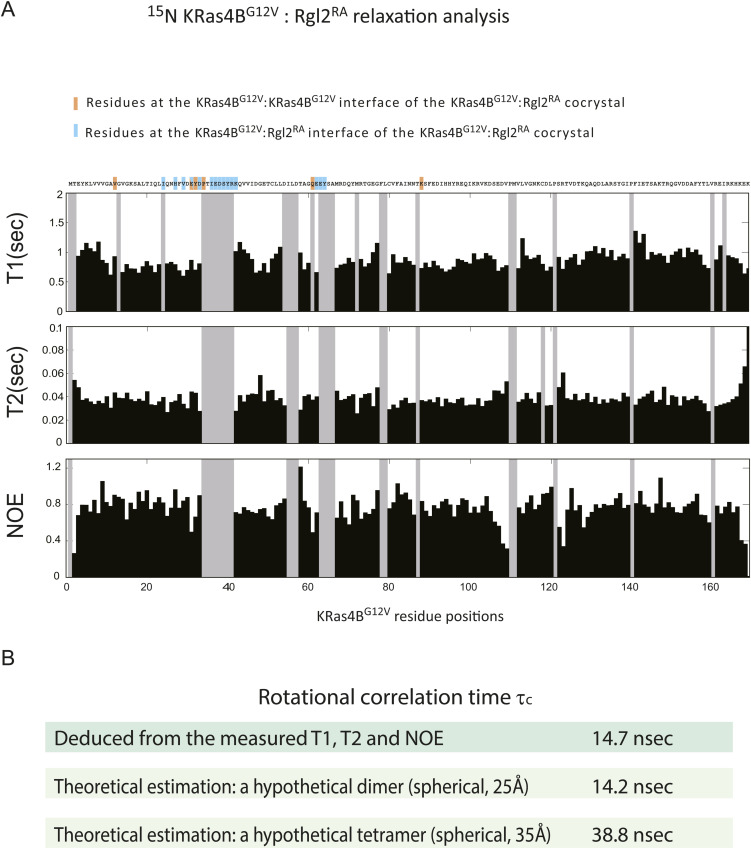
To estimate the size of the complex, we conducted NMR relaxation measurements. The 15N longitudinal (T1) and transverse (T2) relaxation times, and the steady-state heteronuclear {1H}-15N NOE of 2H/13C/15N- labelled KRas4BG12V, mixed with non-labelled Rgl2RA, was measured with TROSY-based pulse schemes (Fig S7A) (ref. Lakomek et al, 2012). The overall rotational correlation time τc deduced from the measured T1, T2, and NOE was ∼14.7 nsec. Meanwhile, the τc values estimated theoretically for the dimer and the tetramer were ∼14.2 and 38.8 nsec when we assumed that they were spherical and the radii of gyration were 25 and 35 Å, respectively (Fig S7B). These results suggest that the status of the KRas4BG12V–Rgl2RA complex in solution may be closer to the heterodimer structure. However, because of the crystal structures are ellipsoidal rather than spherical, and an equilibrium-like exchange process between the heterodimer and heterotetramer, or transient tetramer formation, may occur, furthermore NMR relaxation measurements and detailed analysis would be needed to more accurately predict the complex status.
Mass photometry indicates the presence of a heterotetramer of KRas4BG12V:Rgl2RA complex
To address the question of whether KRas4BG12V:Rgl2RA complex can exist as a heterotetramer in solution, we analyzed the complex by mass photometry, a label-free technique that has recently been adapted to measure the mass of biomolecules in solution (ref. Young et al, 2018). Our commercially available instrument (see the Materials and Methods section) can measure masses in the range 30–5,000 kD and is suitable to detect KRas4BG12V:Rgl2RA heterotetramer (62 kD). The KRas4BG12V:Rgl2RA complex was freshly prepared by SEC at 4°C, and the peak fraction that contained both proteins at 1:1 ratio was used for the measurement (Fig 7A). The histogram of the frequency counts for this sample showed a peak corresponding to a biomolecular complex with a molecular weight of 68 kD (Fig 7B). As the expected molecular weight of the KRas4BG12V:Rgl2RA heterotetramer is about 62 KD, the result indicates that at least part of the complex population likely exists as the 2:2 heterotetramer in solution.
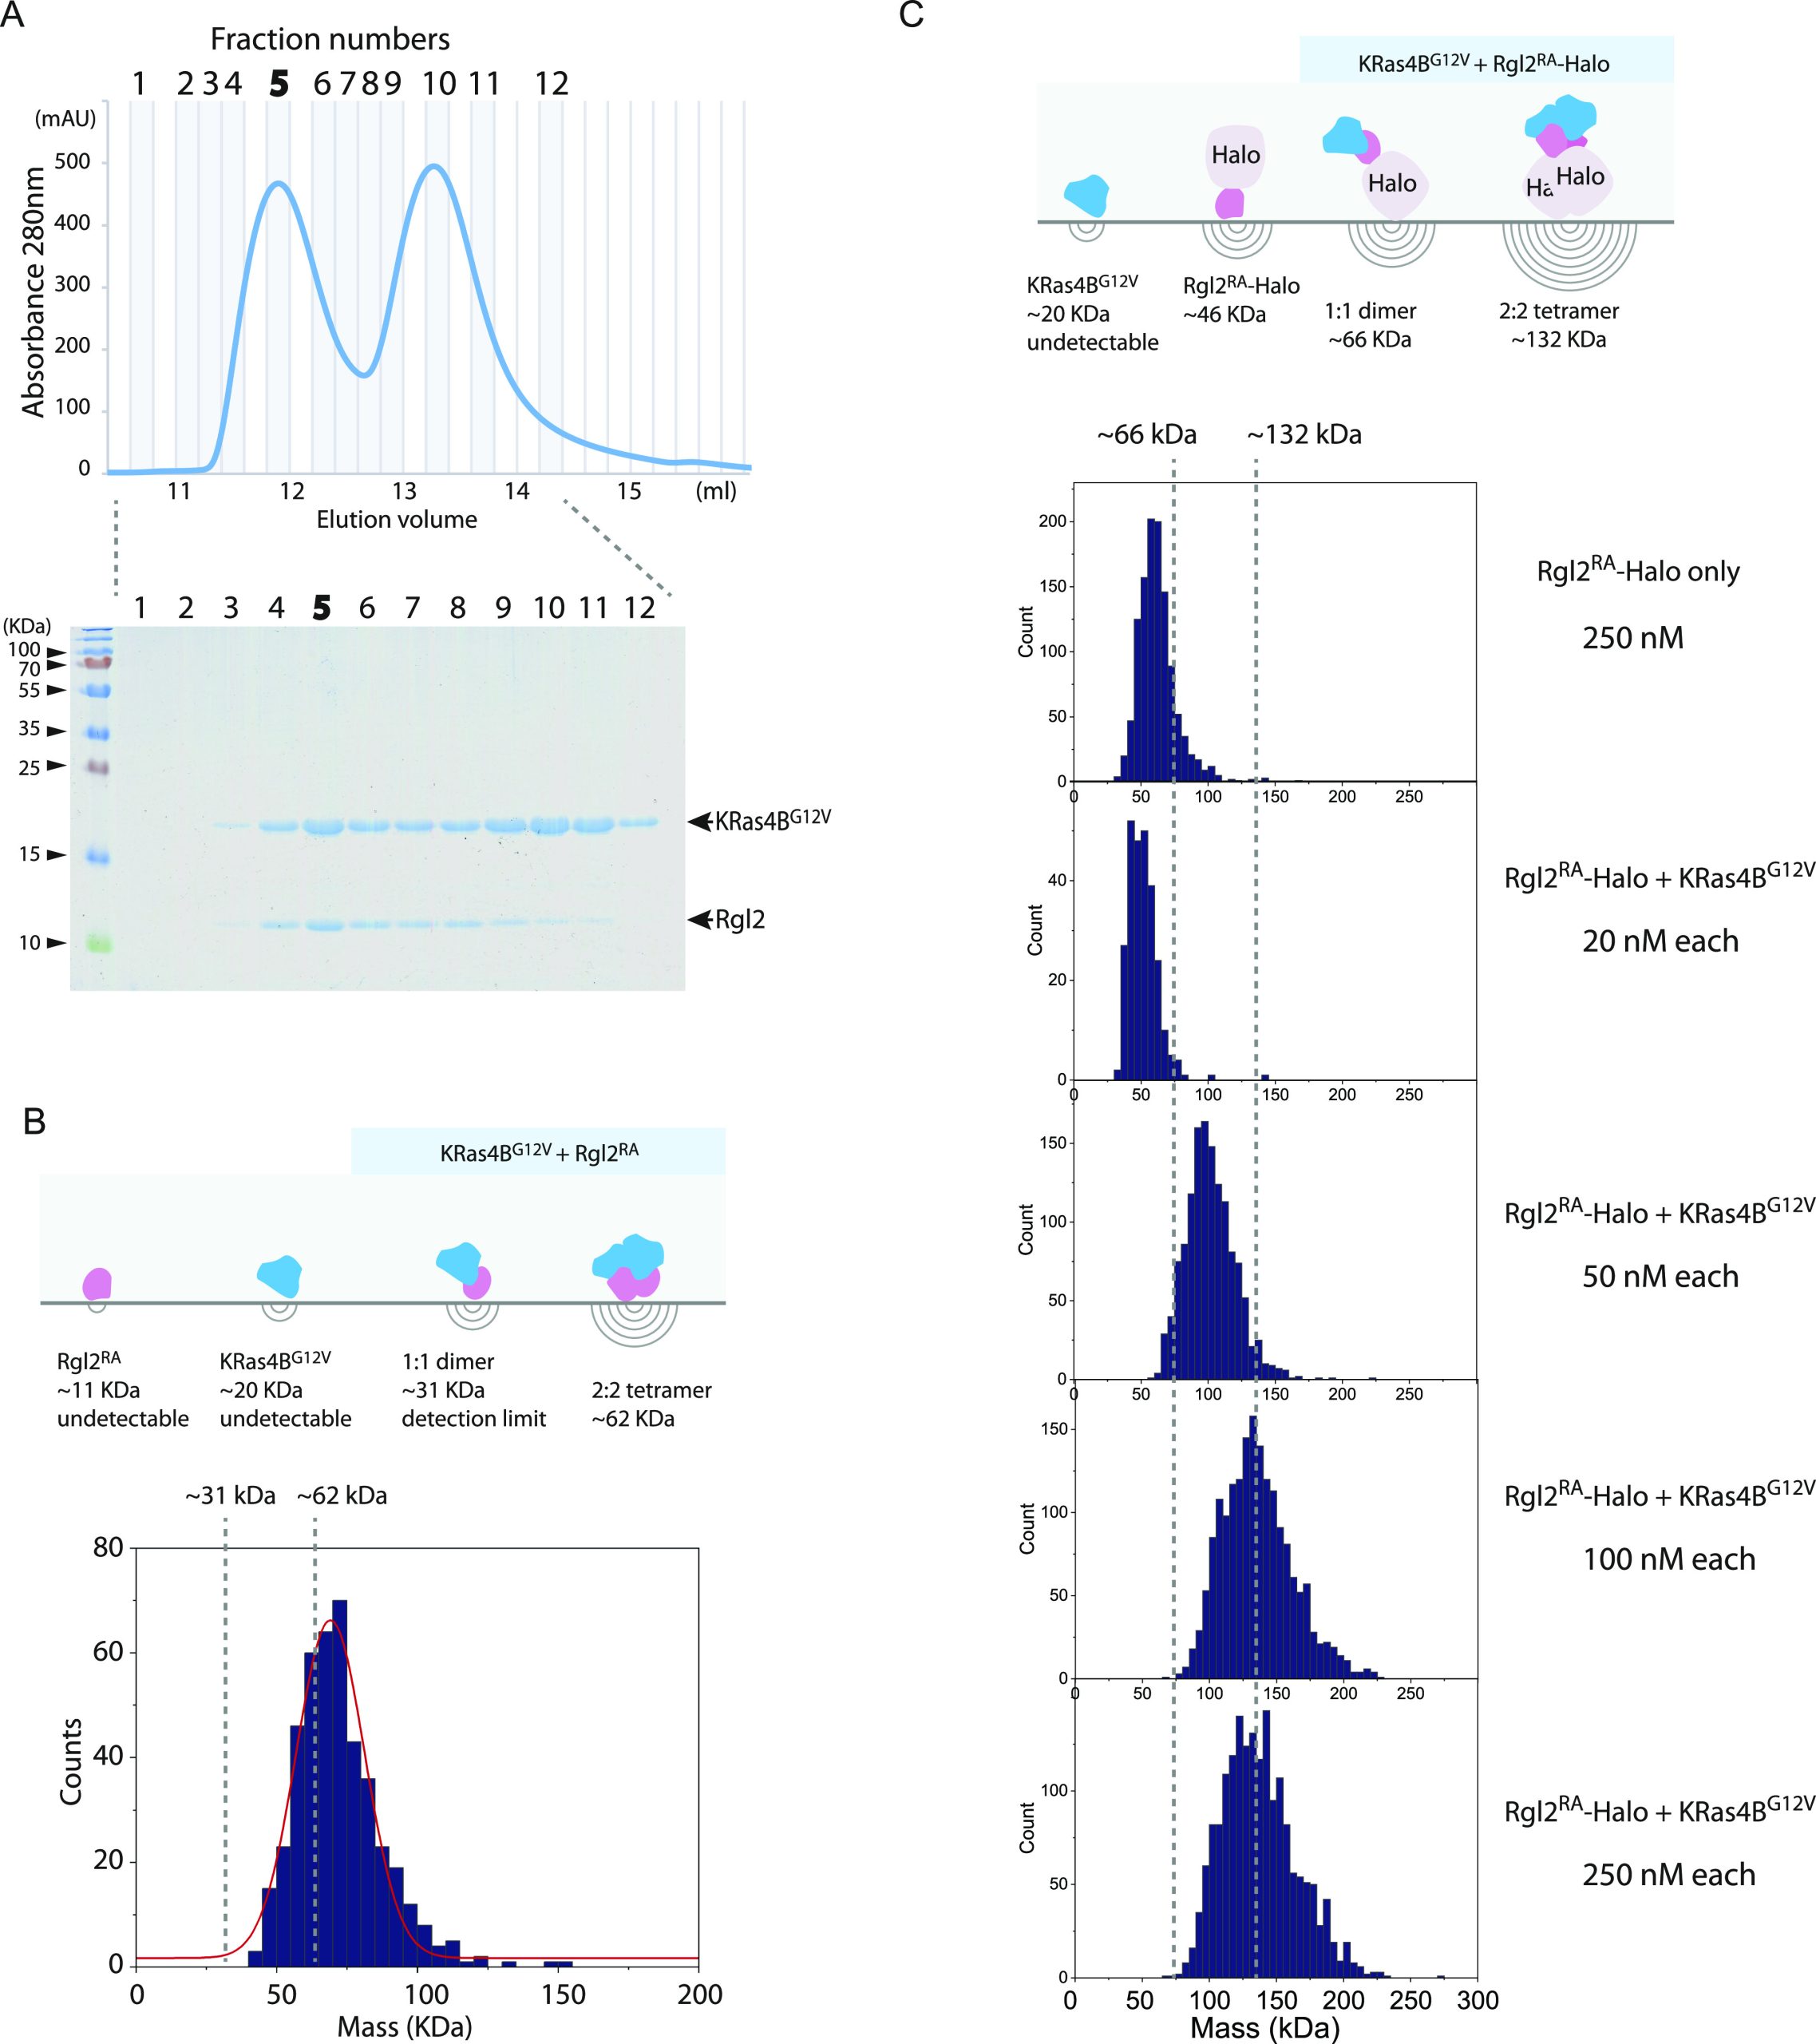
To detect the presence of the heterodimer and the heterotetramer, we examined the complex formation between KRas4BG12V and a Halo-tagged Rgl2RA (Rgl2RA-Halo), where the Halo-tag increased the MW by 35 kD; hence, the heterodimer of KRas4BG12V and Rgl2RA–Halo (expected to be about 66 kD) became within the detection range of the mass photometry instrument. The KRas4BG12V and Rgl2RA–Halo were separately prepared and mixed at a 1:1 M ratio at 2 μM, and the 2 μM premix sample was further diluted to 20, 50, 100, and 250 nM for the measurement (Fig 7C). At 20 nM, the MW was about 50 kD, in a similar range to the Rgl2RA–Halo monomer. At 50 nM, the MW increased to about 90 kD, which may represent the dimer formation. At 100–250 nM, the peak of the MW reached about 130 kD, which corresponded to the 2:2 hetero-tetramer. The result indicated that, under this experimental condition, the KRas4BG12V and Rgl2RA–Halo may form a heterotetramer.
Discussion
We conducted interaction studies of human KRas4B and Rgl2RA to obtain structural insights into the oncogenic Ras–dependent activation of the RalA/B pathway. Our BLI data show that the oncogenic mutation G12V alters the binding kinetics between KRas4B and Rgl2RA. Using X-ray crystallography, we found that KRas4BG12V and Rgl2RA form a heterotetramer and that the oncogenic G12V mutation resides at the interaction surface. Meanwhile, NMR and mass photometry analyses indicate the complex exists in a heterogeneous status in solution.
The KRas4BG12V:Rgl2RA dimer formed through the KRas4BG12V switch I region displays the common features observed in the canonical mode of Ras-effector interaction
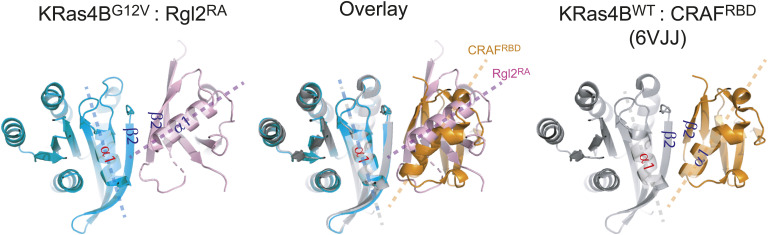
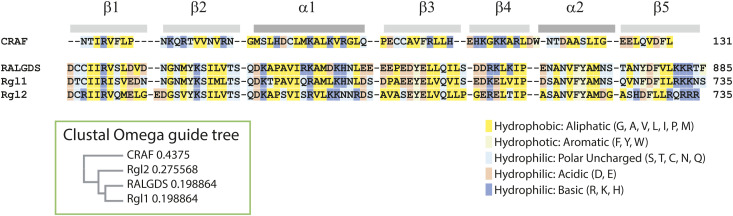
The KRas4BG12V:Rgl2RA contacts involving the KRas4BG12V switch I region share the common structural feature as the canonical Ras-effector interface; the β2 in the switch I region of Ras and β2 of RBD/RA interact to form a parallel β-sheet (Fig S8). However, the KRas4BG12V and Rgl2RA molecules at this contact are situated at a slightly different angle compared with Kras:RBD complexes, such as KRas4BWT:CRAFRBD (PDB ID 6VJJ) (Fig S8). This is consistent with the recent structural evaluation of all available RAS:RA/RBD complex structures (ref. Eves et al, 2022). In this respect, KRas4BG12V:Rgl2RA complex belongs to the “RalGDS-family cluster,” involving HRasE31K:RALGDSRA (PDB:1LFD) and KRasWT/G12V:Rgl1RA (PDB: 7SCW and 7SCX) complexes (ref. Eves et al, 2022), rather than to the “CRAF cluster,” suggesting a structure–function correlation.
The interaction mode between Ras and Rgl2/RALGDS is distinct from other Ras:RBD/RA interactions
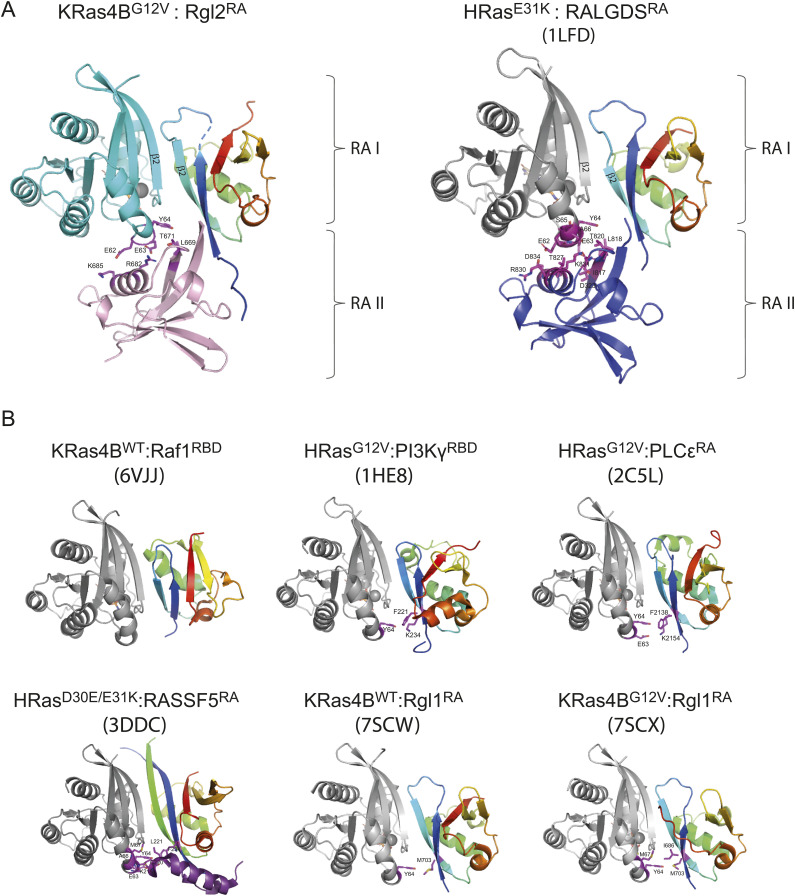
The key contributor of the heterotetramer formation seen in our structure of KRas4BG12V:Rgl2RA, and the previously published HRasE31K:RALGDSRA is the interaction between the switch II region of Ras and the second RBD/RA molecule (Figs 3C and S9A). This feature is distinct from other previously reported Ras:effector crystal structures, where the switch II region is either not participating in the interaction (Ras:CRAFRBD, PDB ID 6VJJ [ref. Tran et al, 2021]) or is interacting with the same RBD that interacts with the switch I region of the same Ras molecule (Ras:PI3KγRBD [PDB ID 1HE8] [ref. Pacold et al, 2000], Ras: PLCεRA [PDB ID 2C5L] [ref. Bunney et al, 2006], Ras:RASSf5RA [PDB ID 3DDC] [ref. Stieglitz et al, 2008]), hence forming a Ras:RA/RBD heterodimer, rather than a heterotetramer (Fig S9B).
One interesting case is a recently reported structural study of Rgl1, yet another RalGEF (ref. Eves et al, 2022). The primary sequences of Rgl1RA, Rgl2RA, and RALGDSRA are distinct but close to each other when compared with CRAFRBD, a representative RBD (Fig S10). The crystal structures of KRas4BWT or KRas4BG12V in complex with Rgl1RA show that Rgl1RA interact with the switch I region of Ras in a highly similar manner as other complexes; the similarity is particularly high when compared with KRas4BG12V:Rgl2RA (this study) and HRasE31K:RALGDSRA (PDB ID 1LFD) (Figs S9B and S11 top row). In addition, Rgl1RA contact the switch II region in a manner similar to PI3KγRBD and PLCεRA (Fig S9B). However, this makes Rgl1RA distinct from other RasGEFs, Rgl2RA, and RalGDSRA, as these establish the switch II contact using the second RA molecule (Figs S9A and S11).
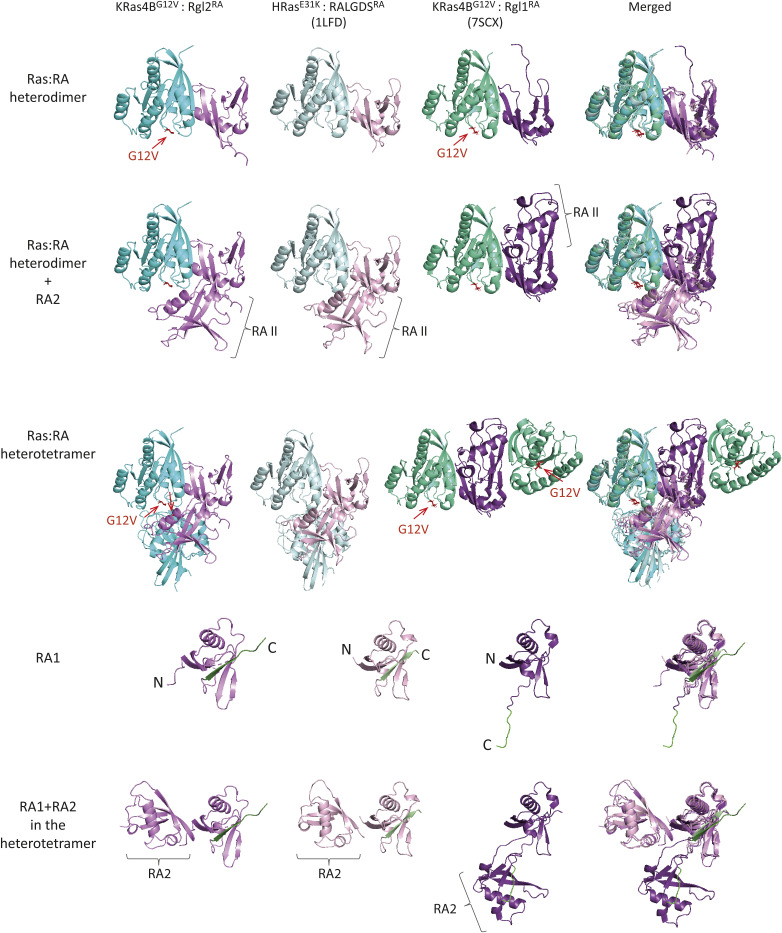
The crystal structure of Rgl1 in complex with KRas4BG12V (PDB ID 7SCX) also suggests a possible heterotetramer formation (ref. Eves et al, 2022). However, the proposed structural arrangements of the KRas4BG12V:Rgl1RA heterotetramer is distinct from the Ras:Rgl2/RALGDS heterotetramers (Fig S11); in the Ras4BG12V:Rgl1RA structure, the heterodimer is mediated by an additional Rgl1RA:Rgl1RA interaction but the two KRasG12V molecules are not in contact with each other. Indeed, the second Rgl1RA associates with the first Rgl1RA through its C-terminal end, which extends into the paired Rgl1RA in a reciprocal manner, causing a “domain swap” of the β5 (ref. Eves et al, 2022) (Fig S11). Consequently, the second KRasG12V in the KRasG12V:Rgl1RA heterotetramer is away from the first KRasG12V molecule, and the G12V mutation is not directly involved in the molecular contacts. In agreement with this structural arrangement, the affinity between KRas and Rgl1RA was reported unaffected by the G12V oncogenic mutation (ref. Eves et al, 2022). This is distinct from the heterotetramer observed in the case of Rgl2RA, where V12 is directly involved in the RAS:RAS interaction, in agreement with the altered binding kinetics of KRasG12V to Rgl2RA in comparison to KRasWT (Figs 4A, S4, and S11).
Oligomerisation of KRas:effector complexes
Accumulating evidence suggests that KRas is capable of forming a dimer in solution even in the absence of effectors (ref. Muratcioglu et al, 2015; ref. Jang et al, 2016; ref. Prakash et al, 2017; ref. Sarkar-Banerjee et al, 2017; ref. Lee et al, 2020, ref. 2021; ref. Packer et al, 2021; ref. Andreadelis et al, 2022; ref. Ingolfsson et al, 2022; ref. Ozdemir et al, 2022). The physiological importance of Ras dimerisation and its potential to be a therapeutic target was highlighted by a G12D-specific inhibitor, BI2852, which may cause artificial dimerisation and block the protein function (ref. Kessler et al, 2019; ref. Tran et al, 2020). Furthermore, Ras forms nanoclusters in the membrane in vivo and in vitro (ref. Prior et al, 2003; ref. Plowman et al, 2005; ref. Weise et al, 2011; ref. Zhou et al, 2014; ref. Lakshman et al, 2019). The modes of these Ras oligomer formations are dependent on various parameters, including membrane lipid compositions, Ras nucleotide binding status, availability of Ras effectors, and the actin cytoskeleton and are expected to be context-dependent.
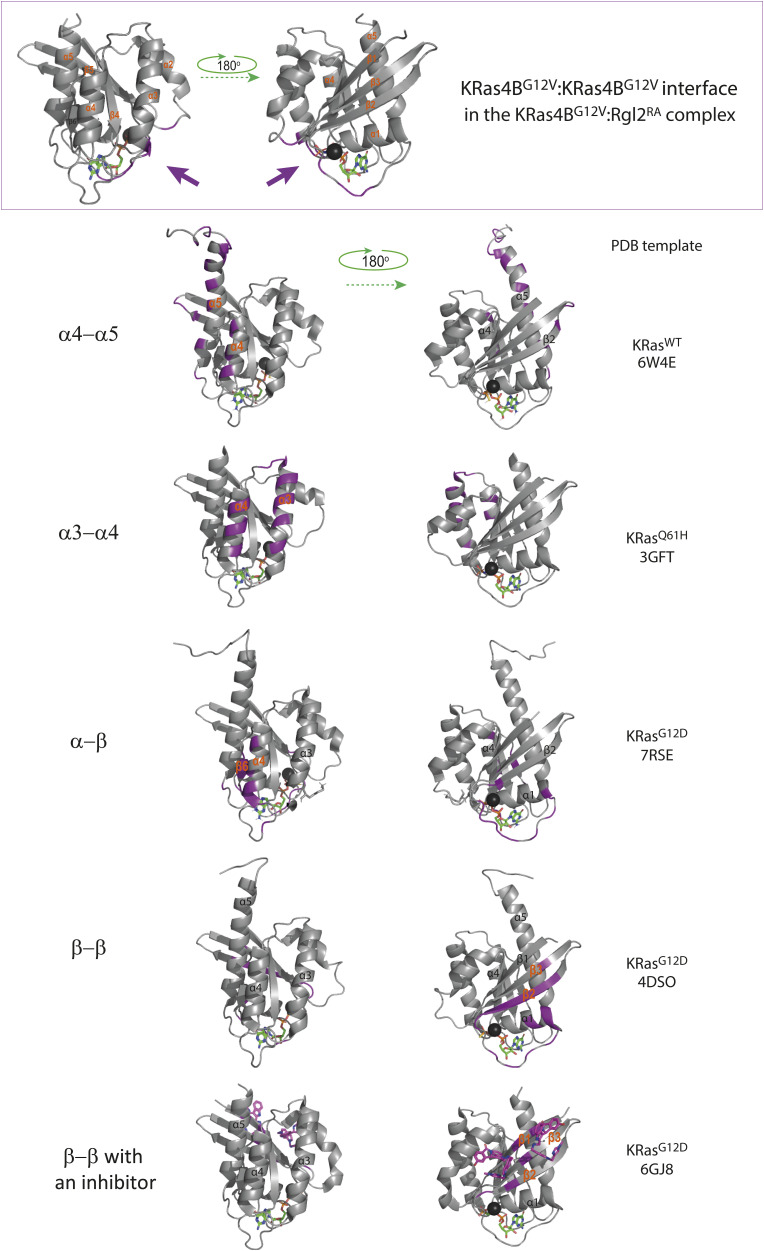
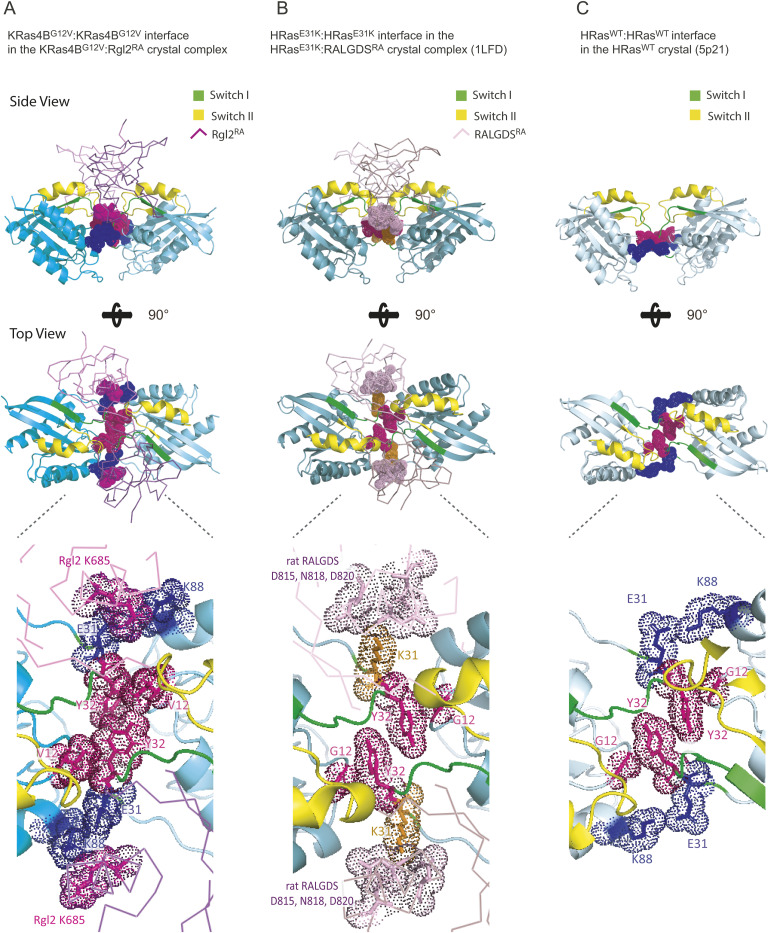
Previously, it has been suggested that Ras in general can form dimers in solution but structural information on these dimers vary and the dimerisation status may therefore be categorised into four classes based on the α helices and β sheets at the interface as follows: (i) α4/α5 (ref. Jang et al, 2016; ref. Prakash et al, 2017; ref. Lee et al, 2020, ref. 2021; ref. Packer et al, 2021; ref. Andreadelis et al, 2022), (ii) α3/α4 (ref. Muratcioglu et al, 2015; ref. Jang et al, 2016; ref. Prakash et al, 2017), (iii) α/β (ref. Lee et al, 2021), and (iv) β/β (ref. Muratcioglu et al, 2015; ref. Jang et al, 2016) (Fig S12). Notably, the KRas4BG12V:KRas4BG12V interface that we observe in the KRas4BG12V:Rgl2RA heterotetramer does not belong to any of these categories and uses the unstructured regions of switch I, switch II, V12 in the P-loop and K88 (Figs 4A and S12), in a similar manner to the HRasE31K:RALGDSRA crystal (PDB ID 1LFD) (ref. Huang et al, 1998). Although this mode of tetramer formation could be an outcome of a crystal-packing artefact (ref. Vetter et al, 1999), it is worth noting that the spatial arrangement of symmetry mates of human HRasWT crystal (PDB ID 5P21) also shows a similar Ras:Ras contact (ref. Pai et al, 1990) (Fig S13C). Therefore, this Ras:Ras contact mode may reflect the intrinsic nature of Ras molecules, which may be stabilized by both KRas4B 12V and Rgl2RA to form the heterotetramer.
Our mass photometry analysis supports a tetramer formation in solution. However, the rotational correlation time from the NMR relaxation experiments was rather close to that estimated from the size of the heterodimer. Furthermore, our SEC-MALS attempt only detected a heterodimer formation (data not shown), indicating that the heterotetramer formation may involve certain environmental conditions or an exchange process, as was the case for the KRasGV:Rgl1RA where tetramerization was observed by SEC only on 6-mo old samples (ref. Eves et al, 2022). Physiological settings, including the presence of the plasma membrane and the full-length effector molecules rather than just the RBD/RA, may stabilize higher-order complex formations.
Possible involvement of V12 in the KRas4B:Rgl2RA complex formation and oncogenicity
The KRas4BG12V:KRas4BG12V interface of the KRas4BG12V:Rgl2RA tetramer complex involves the residue V12, an oncogenic amino-acid substitution occurring in about 28% of mutated KRAS cases (COSMIC). This G12V substitution alters the binding kinetics towards Rgl2RA compared with the wildtype (Fig 1B). In the KRas4BG12V:Rgl2RA tetramer complex, the presence of V12 creates a larger hydrophobic pocket together with Y32, compared with the wildtype case of G12, seen in the HRasWT crystal (PDB ID 5P21) or in the HRasE31K:RALGDSRA crystal (PDB ID 1LFD) (Fig S13A–C). Interestingly, the E31K substitution, used to stabilize the complex in the HRasE31K:RALGDS crystal structure (ref. Huang et al, 1998) (Fig S13B), has been reported in cancer samples with HRAS mutations (COSMIC). Therefore, the capability of Ras mutants to form a stable complex with RalGEFs may be directly linked with Ras oncogenicity. It is interesting to note that in the previously proposed Ras:CRAF heterotetramer complex derived from SAXS data (ref. Packer et al, 2021), the position of residue 12 is relatively distant from the interacting surfaces. An interesting speculation can be that the oncogenic substitution mutations at glycine 12 might have a greater impact on RalGEF-mediated signalling than Raf kinase-mediated signalling, as suggested by previous studies through real-time parallel NMR analyses (ref. Smith & Ikura, 2014). The differences in the KRas4BG12V:Rgl2RA crystal structure (this study) and the Ras:CRAF heterotetramer (ref. Packer et al, 2021) provide possible structural explanations for this observation.
To summarize, our work demonstrates an altered binding kinetics of KRas4BG12V oncogenic mutant with a RalGEF, Rgl2. The G12V mutation resides at the interface of the KRas4BG12V-Rgl2RA co-crystal complex. The information may open the way to target oncogenic KRAS–induced tumorigenesis by novel strategies, including interfering molecules for the newly identified interfaces.
Materials and Methods
Plasmid constructs
The RA of human Rgl2 was obtained by amplifying a cDNA fragment encoding the position 643–740 of the human Rgl2 by PCR with a pair of primers (5′ TACTTCCAATCCATGGGGCCAGGGGCCTCTGATTGCCG 3′) and (5′ TATCCACCTTTACTGTCA TGTAGCAGTAGAGGACCTTCGCCGCTGC 3′) using human cDNA prepared from hTERT RPE-1 cells using GoScript Reverse Transcription System (Promega) following the manufacturer’s instruction. The amplified Rgl2RA fragment was cloned into pLEICS2 vector (PROTEX, University of Leicester), which contains a GST affinity tag and a tobacco etch virus (TEV) protease cleavage site at the N-terminal end of the Rgl2RA, using In-Fusion HD EcoDry enzyme (#638915; Takara Bio), following the manufacturer’s instruction.
A cDNA fragment encoding the position 1–169 (C-terminal truncated) of the human wildtype KRas4B isoform was amplified by PCR with a pair of primers (5′ TACTTCCAATCCATG ACTGAATATAAACTTGTGGTAGTTGGAGCTG 3′) and (5′ TATCCACCTTTACTGTCA CTTTTCTTTATGTTTTCGAATTTCTCGAACTAATGTATAG 3′) using human cDNA prepared from hTERT RPE-1 cells as described above. The produced fragment was cloned in pLeics1 plasmid (PROTEX, University of Leicester), which introduces a His6 tag and a TEV cleavage site at the N-terminus. Site-directed mutagenesis was conducted to introduce the oncogenic G12V mutation using a pair of DNA oligos (5′ AGTTGGAGCTGTTGGCGTAGGCAAGAGTGCC 3′) and (5′ GTCAAGGCACTCTTGCCTACGCCAACAGCTCCAACTAC 3′) by following the QuikChange method (Agilent Technologies).
The RBD of human BRAF was obtained by amplifying a cDNA fragment encoding the position 151–232 of the human BRAF by PCR with a pair of primers (5′ TACTTCCAATCCATGTCACCACAAAAACCTATCGTTAGAGTCTTCCTGCC 3′) and (5′ TATCCACCTTTACTGTCAAAGTGGAACATTCTCCAACACTTCCACATGCAATTC 3′) using human cDNA prepared from hTERT RPE-1 cells as described above. The produced fragment was cloned into pLEICS2 vector (PROTEX, University of Leicester) as described above.
The Rgl2RA–Halo construct was prepared using the above-described GST–Rgl2RA construct by amplifying the DNA fragment encoding GST–Rgl2RA by PCR using a pair of primers primers (5′ AGGAGATATACATATGTCCCCTATACTAGGTTATTGGAAAATTAAGGG 3′) and (5′ CAGTACCGATTTCGGATCCTGTAGCAGTAGAGGACCTTCGCCG 3′) and inserting the PCR product into pLEICS90 vector (PROTEX, University of Leicester) that adds a Halo tag (ref. Los et al, 2008) at the C-terminal end.
Protein expression
DE3 Rosetta cells (Novagen) carrying expression plasmids were grown at 37°C in TY media until OD600 reached about 0.6. Then protein expression was induced by adding isopropyl β-D-1-thiogalactopyranoside to a final concentration of 0.5 mM and keeping the culture at 18°C overnight in a shaking incubator. Cells were collected by centrifugation and resuspended in either Sl1 buffer (Tris 20 mM [pH 7.65], NaCl 150 mM, 5 mM imidazole) for His-tagged KRas or in PBS–NaCl buffer (237 mM NaCl, 2.7 mM KCl, 8 mM Na2HPO4, and 2 mM KH2PO4, pH 7.4) for Rgl2RA and BRAFRBD. The cell suspensions were then stored at −80°C.
Protein expression of stable isotope labelling KRas4BG12V and RA of Rgl2 for NMR measurement
The gene encoding human KRas4BG12V and Rgl2RA were constructed into the expression vector pGHL9 and pLEICS2 over-expressed in Escherichia coli (E.coli) strain BL21 (DE3) and Rosetta, respectively. Uniformly, 13C, 15N-labeled protein was obtained by growing bacteria at 37°C in M9 minimal media, containing (13C6)-glucose and 15NH4Cl (Isotec) as the sole carbon and nitrogen source, supplemented with 20 mM MgSO4, 0.1 mM CaCl2, 0.4 mg/ml thiamin, 20 µM FeCl3, salt mix (4 µM ZnSO4, 0.7 µM CuSO4, 1 µM MnSO4, 4.7 µM H3BO3), and 50 mg/l ampicilin. KRas4BG12V NMR sample was prepared essentially as described previously (ref. Ito et al, 1997). Protein expression of Rgl2RA was induced by adding 119 mg/l isopropyl β-D-1-thiogalactopyranoside at an OD 600 nm of 0.5. After 18 h of further growth, cells were harvested and washed with a pH 7.5 lysis buffer (50 mM Tris–HCl, 25% sucrose, and 0.01% NP-40). Uniformly 15N-labeled KRas4BG12V and Rgl2RA were produced by the identical steps unless growing cells in M9 medium containing (12C6)-glucose and 15NH4Cl (Isotec).
Purification of GST-tagged Rgl2RA, Rgl2RA-Halo, and BRAFRBD
Bacteria cell suspensions were thawed and supplemented with Triton X-100 to a final concentration of 0.1% (vol/vol). Cells were broken by a probe sonicator, and insoluble materials were removed by centrifugation. The supernatant was mixed with glutathione (GSH) beads (#17-0756-01; GE Healthcare) and incubated for 20 min at 4°C. The GSH beads were washed three times with the PBS–NaCl buffer. The GST–Rgl2RA and GST–BRAFRBD fusion proteins were eluted by the elution buffer (50 mM Tris-Cl [pH 8.0], 100 mM NaCl, 5 mM GSH) for BLI experiments. The Rgl2RA and Rgl2RA–Halo were separated from the GST tag through cleavage by TEV protease, which was prepared as previously described (ref. Kapust et al, 2001; ref. Tropea et al, 2009), for structural analysis and mass photometry analysis. The obtained Rgl2RA, Rgl2RA–Halo, or GST–Rgl2RA/GST–BRAFRBD fusion proteins were concentrated using a concentrator (10 KD MWCO, Amicon Ultra centrifugal filters, #UFC901024; Merck) and filtrated using a centrifugal filter unit (Ultrafree, #UFC30GV00; Millipore) before conducting SEC with a gel-filtration column (HiLoad Superdex 75; GE Healthcare) attached to an FPLC system. SEC was carried out in the gel filtration (GF) buffer (20 mM Tris-Cl [pH 7.65], 100 mM NaCl, 5 mM MgCl2, 1 mM Tris (2-carboxyethyl) phosphine [TCEP]).
Purification of His-tagged KRas4B wildtype and oncogenic G12V mutant proteins
Bacteria cell suspensions were supplemented with Triton X-100 to a final concentration of 0.1% (vol/vol). Cells were broken by a probe sonicator and insoluble materials were removed by centrifugation. The soluble cell lysates were applied on an Ni-sepharose excel (#17-3712-01; GE Healthcare), packed in a column of 4 ml bed volume with Sl1 buffer buffer (20 mM Tris, pH 6.5, 150 mM NaCl, 5 mM imidazole). The column was washed with 20 ml of SL1 buffer, then with 20 ml of Sl3 buffer (20 mM Tris, pH 6.5, 150 mM NaCl, 6 mM imidazole) and finally with 15 ml of Sl4 buffer (20 mM Tris, pH 6.5, 150 mM NaCl, 10 mM imidazole). The His-tagged KRas protein was eluted from the column by applying 10 ml of elution buffer (50 mM Tris, pH 7.65, 150 mM NaCl, 200 mM Imidazole), followed by 10 ml of 1 M imidazole. To remove the His6-tag at the N-terminal end, TEV protease, prepared as previously described (ref. Tropea et al, 2009), was added to the elution fraction to about a 2% molar ratio of the His6–KRas4B preparation and incubated overnight at 4°C. The cleaved KRas samples were further purified by SEC using a gel-filtration column (HiLoad Superdex 75; GE Healthcare) in the GF buffer (20 mM Tris–Cl [pH 7.65], 100 mM NaCl, 5 mM MgCl2, 1 mM TCEP). The purified KRas (WT) and KRas(GV) concentrations were determined by absorbance at 280 nm. The extinction coefficient (ε) for KRas (WT) and KRas(GV) was estimated to be 19,685 cm-1 M −1, by taking into account that the bound GTP adds 7765 cm-1 M −1 (ref. Smith & Rittinger, 2002), and the molecular weights (including GTP) were estimated to be 19,856 and 19,898, respectively. Nucleotide exchange of the purified KRas4B wildtype or G12V proteins was carried out essentially as previously described (ref. Ito et al, 1997). The proteins were diluted 10 times by the exchange buffer (20 mM Tris–Cl [pH 7.5] 1 mM EDTA, 1 mM TECP), and the sample was supplemented with EDTA to a final concentration of 5 mM. The sample was mixed with about 10 time molar excess of guanosine 5′-[β,γ-imido]triphosphate (GMMPPNP, G0635; Sigma-Aldrich) or 5′-GTP (G9977; Sigma-Aldrich) or 5′ –GDP (G7127; Sigma-Aldrich). The reaction was incubated at 37°C for 20 min then put it on ice for 20 min. The protein was terminated by adding ice cold MgCl2 to a final concentration of 20 mM. The excess nucleotides were removed by SEC as described below.
Purification of isotope-labelling KRas4BG12V
All the procedures described below were carried out at 4°C unless otherwise stated. All the isotope-labelled KRas4BG12V samples were purified by the same step. The cells dispersed in the lysis buffer were disrupted by sonication for 30 min on ice with hen egg lysozyme (0.1 mg/ml). The cell debris was clarified by centrifugation at 14,000g for 1 h. The supernatant was loaded onto a 25 ml of DEAE-Sepharose Fast Flow (Cytiva) anion exchange equilibrated with buffer A (50 mM Tris–HCl [pH 7.5], 1 mM MgCl2, 1 mM DTT, 0.1 mM APMSF [FUJIFILM Wako]). After washing the column with buffer A until sufficiently low of UV absorption at 280 nm, the KRas4BG12V protein was eluted by linearly increasing the concentration of KCl from 0 to 350 mM with a flow rate of 0.5 ml/min in buffer A. The fractions containing the target protein were concentrated to 5 ml with Amicon Ultra-15 10 kD (Merck). The concentrated sample was loaded onto a 320 ml of HiLoad Superdex 75 (GE Healthcare Life Science) gel filtration with a flow rate of 0.8 ml/min using FPLC systems (AKTA pure 25; GE Healthcare Life Science). The 5 ml sample concentrated from the fractions involving the target proteins with Amicon Ultra-15 10 kD was loaded on Resource Q (GE Healthcare Life Science) anion-exchange column equilibrated with buffer A using the FPLC systems. After washing the column with 30 ml of buffer A, KRas4BG12V was eluted by KCl, the KRas4BG12V protein was eluted by linearly increasing the concentration of KCl from 0 to 350 mM with a flow rate of 1 ml/min in buffer A. The purification of isotope labelled Rgl2RA was performed by the same step described above. The purity of the KRas4BG12V and Rgl2RA samples in each step was confirmed by SDS–PAGE. Protein concentrations were determined by Nano Drop 2000 (Thermo Fisher Scientific) measuring UV absorption at 280 nm. KRas4BG12V samples for NMR measurements were concentrated and dissolved in NMR buffer A (90% 1H2O/10% 2H2O containing 20 mM Tris–HCl [pH 7.5], 100 mM NaCl, 5 mM MgCl2, 1 mM β-mercaptoethanol). Rgl2RA samples for NMR measruments were NMR buffer B (90% 1H2O/10% 2H2O containing 1 mM Na2HPO4-NaH2PO4 [pH 7.4], 150 mM NaCl).
KRas4B–Rgl2RA and KRas4B–BRAFRBD binding measurements using BLI
Octet R8 (Sartorius) was used for BLI assays of KRas4B (G12V or WT) and Rgl2RA and BRAFRBD interactions. Anti-GST biosensors (#18-5096; Sartorius) were used to immobilise GST-Rgl2RA (provided as a 0.7 μM solution in the binding reservoir well, the concentration was determined by absorbance at 280 nm using the following values; the extinction coefficient (ε) 48,820 cm-1 M −1, and the molecular weight 37,495.18), GST–BRAFRBD (encoding BRAF a.a. 151–232, N-terminally fused with GST, provided as a 0.7 μM solution in the binding reservoir well, the concentration was determined by absorbance at 280 nm using the following values; the extinction coefficient (ε) 56,840 cm-1 M −1, and the molecular weight 36,024.95). The baseline was stabilised in GF buffer (20 mM Tris, pH 7.65, 100 mM NaCl, 5 mM MgCl2, 1 mM TCEP) for 200 s. As a negative control, GST only (provided as a 0.7 μM solution in the binding reservoir well) was used. The association of KRas4B was measured for 400 s in five or six serial dilutions concentrations. For Rgl2RA binding, the KRas concentrations ranged from 200 nM to 15 μM, and for BRAFRBD binding, the KRas concentrations ranged from 20 nM to 5 μM. The dissociation steps were measured in fresh GF buffer for 400 s. For each assay, a biosensor immobilised with GST only and a sample well with only buffer instead of KRas4B (WT/G12V) was set up for double referencing. The experiments were conducted at 20°C. The resulting data were processed using Octet Analysis Studio (ver. 13.0) (Sartorius), and reference biosensor (loaded with GST-only) and reference wells (containing no KRas) were subtracted from sample wells (double reference).
Analysis of bound nucleotide
The nucleotide-binding status of KRas4BWT and KRas4BG12V were examined by denaturating the proteins and detecting the released nucleotides, essentially following the previous studies (ref. Smith & Rittinger, 2002). About 2 nmoles of KRas4B molecules were adjusted to the volume of 200 μl with GF buffer. Add 12.5 μl of 10% perchloric acid to denature and precipitate the protein. The supernatant was neutralised either by 8.75 μl of 4 M CH3COONa, pH 4.0, or 12 μl of 1 M Tris–Cl (pH 8.8). The sample was centrifuged again, and the supernatant was analysed by HPLC using an ion exchange column (Partisil 10 SAX column; Whatman). For the result presented in Fig 1A, the chromatography was run using 0.6 M NH4H2PO4 (buffer B) at a flow rate of 0.8 ml/min. For the result presented in Fig 1D, the column was first equilibrated with 10 mM NH4H2PO4 (buffer A), and the column was run under the following gradient condition with 0.6 M NH4H2PO4 (buffer B) at a flow rate of 0.8 ml/min. Step 1: 100% buffer A (0% buffer B) for 11 min, step 2: a gradient increase to 40% buffer B over 6 min, step 3: a gradient increase to 50% buffer B over 23 min, step 4: a gradient increase to 100% buffer B over 1 min, step 5: 100% buffer B for 19 min, step 6: a gradient decrease to 0% buffer B (100% buffer A) over 1 min, and Step 7: 100% Buffer A for 14 min. The nucleotides were detected by 254 nm absorption. As a reference control, 1 μl of 10 mM GTP or GDP was diluted to 200 μl GF buffer and was processed in the same manner as protein samples.
Crystallography
The purified and GMPPNP-loaded KRas4B (G12V) and Rgl2RA were mixed in the GF buffer and the complex was purified on SEC using a gel-filtration column (HiLoad Superdex 75; GE Healthcare). The peak fractions containing both proteins in the 1:1 ratio were collected and concentrated to set up crystallization screenings. Crystals of KRas4B (G12V) and Rgl2RA were obtained using sitting-drop vapour diffusion at room temperature, with 100 nl of protein (11.6 mg/ml) against 100 nl of crystallisation buffer (0.2 M sodium/potassium phosphate, ph 7.5, 0.1 M HEPES, pH 7.5, 22.5% vol/vol PEG Smear Medium [Molecular Dimensions MD2-100-259], 10% vol/vol glycerol). The crystals were frozen in liquid nitrogen with 20% glycerol as cryoprotectant. Data were collected at Diamond beamline I04. AIMLESS (ref. Evans & Murshudov, 2013) was used for data reduction before obtaining Phaser solution using the HRas–RALGDSRA complex structure (PDB ID 1LFD) as search model with PhaserMR (ref. McCoy et al, 2007). The structure was built using multiple rounds of refinements using PDBredo, REFMAC, PHENIX, and COOT (ref. Emsley et al, 2010; ref. Murshudov et al, 2011; ref. Joosten et al, 2014; ref. Torices & Munoz-Pajares, 2015). The coordinates of the complex have been deposited to the Protein Data Bank (PDB) under access code 8B69.
Circular dichroism (CD) spectroscopy
KRas4B(WT) and (G12V) proteins at a concentration of 20 μM were prepared in the CD buffer (50 mM phosphate [pH 7.6], 1.5 mM Tris [pH 7.6], 5 mM MgSO4, 7.5 mM NaCl, 0.375 mM MgCl2), placed in a quartz cuvette of 0.1 cm path length, and CD spectra were recorded at wavelengths ranging from 195 to 250 nm using a Chirascan-plus CD spectrometer (Applied Photophysics) at 20°C. The melting curves of these proteins were examined at 220 nm at temperatures ranging from 20°C to 90°C. Measurements were conducted at 1°C increment.
NMR spectroscopy
KRas4BG12V NMR sample was prepared essentially as described previously (ref. Ito et al, 1997). The bacteria expression plasmid for HRas was modified to encode KRas4BG12V by site-directed mutagenesis and used to produce KRas4BG12V. Loading of a GTP analogue, GMPPNP (Jena Bioscience) was conducted essentially as previously described (ref. Ito et al, 1997). Rgl2RA sample was prepared as described above. All NMR samples were measured in 20 mM Tris–Cl (pH 7.65), 100 mM NaCl, 5 mM MgCl2, and 0.1% β-mercaptoethanol at 303 K. All spectra were analysed with the CcpNmr Analysis 2.5.1 software. Backbone chemical shifts of KRas4BG12V and Rgl2 have been deposited to the BioMagResBank with accession ID 34754 and PDB with accession ID 8AU4, respectively.
All NMR experiments were performed at 25°C probe temperature in a triple-resonance cryoprobe fitted with a z-axis pulsed field gradient coil, using Bruker AVANCE III HD 600 MHz spectrometers. All spectra were processed with the Azara software package (ref. Boucher, 2010). For the 3D data, the two-dimensional maximum entropy method (2D MEM) or quantitative maximum entropy (ref. Hamatsu et al, 2013) was applied to obtain resolution enhancement for the indirect dimensions. All NMR spectra were visualized and analyzed using the CcpNmr Analysis 2.5.0 software (ref. Vranken et al, 2005). All of the 3D triple-resonance experiments used for the assignments of KRas4B and Rgl2RA were performed on 13C/15N samples in NMR buffer A and B, respectively. The backbone 1HN, 13C’, and 15N for KRas4B and Rgl2RA, and side-chain 13C⍺ and 13Cβ resonance assignments for Rgl2RA were achieved by analyzing six types of 3D triple-resonance experiments, HNCO, HN(CA)CO, HNCA, HN(CO)CA, CBCANNH, and CBCA(CO)NNH. 3D HBHA(CBCACO)NH, H(CCCO)NH, (H)CC(CO)NH, HCCH-COSY, and HCCH-TOCSY experiments on the 13C/15N -labeled Rgl2RA were performed for side-chain 1H and 13C resonance assignments. A 15 ms 13C isotropic mixing time was used for the (H)CC(CO)NH, H(CCCO)NH, and HCCH-TOCSY experiments. For the collection of NOE-derived distance restraints of Rgl2RA, 3D 15N-separated and 3D 13C-separated NOESY-HSQC spectra were measured on the 13C/15N -labeled Rgl2RA. A 100 ms NOE mixing period was used for the 3D NOESY experiments. All 2D and 3D NMR data were recorded using the States-TPPI protocol for quadrature detection in indirectly observed dimensions. Water flip-back 1H pulses and the WATERGATE pulse sequence were used for solvent suppression in the experiments performed on 15N-labeled and 13C/15N-labeled samples, whereas presaturation and gradient-spoil pulses were used for 13C-labeled samples.
A series of 2D 1H-15N HSQC spectra were measured for titration experiments of 15N-labelled KRas4BG12V within the presence of non-labelled Rgl2RA. The experiments were performed in the NMR buffer at 25°C, and the peptide concentration was increased stepwise (for the 15N-KRas4BG12V/Rgl2RA, its molar ratio of 1:0.25, 1:0.5, 1:0.75, 1:1, 1:1.5, and 1:2 were used, whereasfor the 15N-Rgl2RA/KRas4BG12V, its molar ratio of 1:0.25, 1:0.5, 1:1, 1:1.5, 1:2, and 1:3 were used). The mean chemical shift difference Δδave for each amino acid was calculated as ([Δδ1HN]2 + [Δδ15N]2)1/2 where Δδ1HN and Δδ15N are the chemical shift differences (Hz) between KRas4BG12V or Rgl2RA on their own and the proteins in the presence of the other side.
NMR structure calculation
Intra-residual and long-range NOEs were automatically assigned by the program CYANA with the use of automated NOE assignment and torsion angle dynamics (ref. Güntert & Buchner, 2015). The peak position tolerance was set to 0.03 ppm for the 1H dimension and to 0.3 ppm for the 13°C and 15 N dimensions. Hydrogen-bond and dihedral angle restraints were not used. CYANA calculations were started from 100 conformers with random torsion angle values, simulated annealing with 50,000 torsion angle dynamics steps was applied. The 20 conformers with the lowest final target-function values of CYANA were selected and optimised with OPALp 2.1 (ref. Luginbühl et al, 1996; ref. Koradi et al, 2000) using the AMBER force field (ref. Cornell et al, 1995; ref. Ponder & Case, 2003).
NMR relaxation experiment
The longitudinal relaxation times (T1), the transverse relaxation times (T2), and the steady-state heteronuclear {1H}-15N NOEs were measured at 25°C using uniformly 2H/13C/15N-labeled KRas4BG12V with non-labelled Rgl2RA on a Bruker Avance III HD 600 MHz spectrometer equipped with a cryogenic H/C/N triple-resonance probe head. Each experiment was acquired in a pseudo 3D manner. Eight relaxation delays in the range 20–1,800 ms and eight delays between 8.7–139 ms were used for the T1 and T2 experiments, respectively. NOE ratios were obtained from intensities in experiments recorded with (1 s relaxation delay followed by 10 s saturation) and without (relaxation delay of 11 s) saturation. The overall rotational correlation time, effective correlation times, and order parameters were obtained by the program relax 5.0. with spectral density functions as defined by the Lipari-Szabo model-free approach. A theoretical rotational correlation time (τc) was calculated by the Stokes-Einstein-Debye relation,
where η is the viscosity, reff is the effective hydrodynamic radius of a molecule, kB is the Boltzmann constant, and T is the temperature. The rotational correlation time of the KRas4BG12V:Rgl2RA complex was estimated with T = 298.0 K, η = 0.890 mPa, and reff = 27.1 Å.
Mass photometry measurement
For KRas4BG12V and Rgl2RA complex formation, freshly purified KRas4BG12V and Rgl2RA were mixed in GF buffer, concentrated to about 500 μl using a concentrator (Amicon Ultra centrifugal filters, #UFC901024; Merck), and loaded to a gel-filtration column (HiLoad Superdex 75; GE Healthcare). The peak fractions containing both proteins in the 1:1 ratio were collected and the concentration was estimated by OD280 and the predicted extinction coefficient of 24,155 M−1cm−1. The sample was diluted to 40 nM in the GF buffer and a 20 μl aliquot was subjected to mass photometry immediately after the dilution (OneMP, Refeyn). For KRas4BG12V and Rgl2RA–Halo complex formation, both proteins were separately purified by SEC as described above and mixed at the 1:1 ratio to generate a premix 2 μM sample, which was further diluted to 20, 50, 100, and 250 nM before the measurement.
The measurement was carried out in conventional microscope cover glass (Marienfeld, no 1.5 H) cleaned by rinsing with deionized water (´5) and isopropanol (5) followed by drying under a N2 flow, using a silicon gasket (Grace Bio-labs) to confine the sample. Adsorption of individual molecules of complex was detected across an imaging area of 10.8 μm by 2.9 mm.
Video recordings from interferometric scattering microscopy for a duration of 60 s were obtained and the single events corresponding to surface adsorption of the complex were identified using AcquireMP software (Refeyn). Data analysis was performed using DiscoverMP software (Refeyn) and OriginPro 2021 (OriginLab).
Graphical representation of protein structures
Protein structure images were generated using PyMol (The PyMOL Molecular Graphics System, Version 1.2r3pre, Schrödinger, LLC). Electrostatic surface charge potential images were produced using PyMol vacuum electrostatics function. Amino acid residues in the interaction surfaces of protein complexes in a PDB format were predicted using LIGPLOT (ref. Wallace et al, 1995).
Data Availability
Structural statistics and coordinates for the KRAS4BG12V–Rgl2RA crystal structure and the NMR Rgl2RA structure are available at PDB with the IDs 8B69 and 8AU4, respectively.
Supplementary Materials
References
- Membrane composition and Raf[CRD]-Membrane attachment are driving forces for K-Ras4B dimer stability.. J Phys Chem B, 2022. [DOI | PubMed]
- The RAL signaling network: Cancer and beyond.. Int Rev Cell Mol Biol, 2021. [DOI | PubMed]
- Differential regulation of rasGAP and neurofibromatosis gene product activities.. Nature, 1991. [DOI | PubMed]
- Azara, v2.8.. 2010
- Structural and mechanistic insights into ras association domains of phospholipase C epsilon.. Mol Cell, 2006. [DOI | PubMed]
- K-Ras promotes growth transformation and invasion of immortalized human pancreatic cells by Raf and phosphatidylinositol 3-kinase signaling.. Cancer Res, 2007. [DOI | PubMed]
- Functional specificity of ras isoforms: So similar but so different.. Genes Cancer, 2011. [DOI | PubMed]
- Predicted “wiring landscape” of Ras-effector interactions in 29 human tissues.. NPJ Syst Biol Appl, 2021. [DOI | PubMed]
- PTEN and the PI3-kinase pathway in cancer.. Annu Rev Pathol, 2009. [DOI | PubMed]
- A second generation force field for the simulation of proteins, nucleic acids, and organic molecules.. J Am Chem Soc, 1995. [DOI]
- Ras history: The saga continues.. Small GTPases, 2010. [DOI | PubMed]
- Biological and biochemical properties of human rasH genes mutated at codon 61.. Cell, 1986. [DOI | PubMed]
- Features and development of coot.. Acta Crystallogr D Biol Crystallogr, 2010. [DOI | PubMed]
- Structure determination of the Ras-binding domain of the Ral-specific guanine nucleotide exchange factor Rlf.. Biochemistry, 1998. [DOI | PubMed]
- How good are my data and what is the resolution?. Acta Crystallogr D Biol Crystallogr, 2013. [DOI | PubMed]
- Structures of RGL1 RAS-association domain in complex with KRAS and the oncogenic G12V mutant.. J Mol Biol, 2022. [DOI | PubMed]
- G-protein binding features and regulation of the RalGDS family member, RGL2.. Biochem J, 2008. [DOI | PubMed]
- The ras-binding domain of ral GDS-like protein-2 as a ras inhibitor in smooth muscle cells.. Biochem Biophys Res Commun, 2003. [DOI | PubMed]
- Intrinsic GTPase activity distinguishes normal and oncogenic ras p21 molecules.. Proc Natl Acad Sci U S A, 1984. [DOI | PubMed]
- Combined automated NOE assignment and structure calculation with CYANA.. J Biomol NMR, 2015. [DOI | PubMed]
- High-resolution heteronuclear multidimensional NMR of proteins in living insect cells using a baculovirus protein expression system.. J Am Chem Soc, 2013. [DOI | PubMed]
- Structural basis for the interaction of ras with RalGDS.. Nat Struct Biol, 1998. [DOI | PubMed]
- Biochemical and structural analysis of common cancer-associated KRAS mutations.. Mol Cancer Res, 2015. [DOI | PubMed]
- Machine learning-driven multiscale modeling reveals lipid-dependent dynamics of RAS signaling proteins.. Proc Natl Acad Sci U S A, 2022. [DOI | PubMed]
- Regional polysterism in the GTP-bound form of the human c-Ha-Ras protein.. Biochemistry, 1997. [DOI | PubMed]
- Membrane-associated ras dimers are isoform-specific: K-ras dimers differ from H-ras dimers.. Biochem J, 2016. [DOI | PubMed]
- The PDB_REDO server for macromolecular structure model optimization.. IUCrJ, 2014. [DOI]
- Tobacco etch virus protease: Mechanism of autolysis and rational design of stable mutants with wild-type catalytic proficiency.. Protein Eng, 2001. [DOI | PubMed]
- Drugging an undruggable pocket on KRAS.. Proc Natl Acad Sci U S A, 2019. [DOI | PubMed]
- The ubiquitin domain superfold: Structure-based sequence alignments and characterization of binding epitopes.. J Mol Biol, 2006. [DOI | PubMed]
- Point-centered domain decomposition for parallel molecular dynamics simulation.. Comput Phys Commun, 2000. [DOI]
- The functional proximal proteome of oncogenic ras includes mTORC2.. Mol Cell, 2019. [DOI | PubMed]
- Measurement of 15N relaxation rates in perdeuterated proteins by TROSY-based methods.. J Biomol NMR, 2012. [DOI | PubMed]
- Quantitative biophysical analysis defines key components modulating recruitment of the GTPase KRAS to the plasma membrane.. J Biol Chem, 2019. [DOI | PubMed]
- Two distinct structures of membrane-associated homodimers of GTP- and GDP-bound KRAS4B revealed by paramagnetic relaxation enhancement.. Angew Chem Int Ed Engl, 2020. [DOI | PubMed]
- Oncogenic KRAS G12D mutation promotes dimerization through a second, phosphatidylserine-dependent interface: A model for KRAS oligomerization.. Chem Sci, 2021. [DOI | PubMed]
- Activation of RalA is critical for Ras-induced tumorigenesis of human cells.. Cancer Cell, 2005. [DOI | PubMed]
- Divergent roles for RalA and RalB in malignant growth of human pancreatic carcinoma cells.. Curr Biol, 2006. [DOI | PubMed]
- HaloTag: A novel protein labeling technology for cell imaging and protein analysis.. ACS Chem Biol, 2008. [DOI | PubMed]
- The new program OPAL for molecular dynamics simulations and energy refinements of biological macromolecules.. J Biomol NMR, 1996. [DOI | PubMed]
- Stable expression of activated Ki-Ras does not constitutively activate the mitogen-activated protein kinase pathway but attenuates epidermal growth factor receptor activation in human astrocytoma cells.. Int J Oncol, 1999. [DOI | PubMed]
- Ha-ras proteins exhibit GTPase activity: Point mutations that activate ha-ras gene products result in decreased GTPase activity.. Proc Natl Acad Sci U S A, 1985. [DOI | PubMed]
- Raf kinases in cancer-roles and therapeutic opportunities.. Oncogene, 2011. [DOI | PubMed]
- Oncogenic and RASopathy-associated K-RAS mutations relieve membrane-dependent occlusion of the effector-binding site.. Proc Natl Acad Sci U S A, 2015. [DOI | PubMed]
- Phaser crystallographic software.. J Appl Crystallogr, 2007. [DOI | PubMed]
- Comparative biochemical properties of normal and activated human ras p21 protein.. Nature, 1984. [DOI | PubMed]
- Structural impact of GTP binding on downstream KRAS signaling.. Chem Sci, 2020. [DOI | PubMed]
- RalGDS functions in Ras- and cAMP-mediated growth stimulation.. J Biol Chem, 1997. [DOI | PubMed]
- GTP-dependent K-ras dimerization.. Structure, 2015. [DOI | PubMed]
- REFMAC5 for the refinement of macromolecular crystal structures.. Acta Crystallogr D Biol Crystallogr, 2011. [DOI | PubMed]
- The RalGEF-ral effector signaling network: The road less traveled for anti-ras drug discovery.. Genes Cancer, 2011. [DOI | PubMed]
- Quantification of spatiotemporal patterns of Ras isoform expression during development.. Sci Rep, 2017. [DOI | PubMed]
- Characterization of the Ras binding domain of the RalGDS-related protein, RLF.. Biochem Biophys Res Commun, 1997. [DOI | PubMed]
- Ras multimers on the membrane: Many ways for a heart-to-heart conversation.. Genes (Basel), 2022. [DOI | PubMed]
- Raf promotes dimerization of the Ras G-domain with increased allosteric connections.. Proc Natl Acad Sci U S A, 2021. [DOI | PubMed]
- Crystal structure and functional analysis of Ras binding to its effector phosphoinositide 3-kinase gamma.. Cell, 2000. [DOI | PubMed]
- Refined crystal structure of the triphosphate conformation of H-ras p21 at 1.35 A resolution: Implications for the mechanism of GTP hydrolysis.. EMBO J, 1990. [DOI | PubMed]
- Assessment of mutation probabilities of KRAS G12 missense mutants and their long-timescale dynamics by atomistic molecular simulations and Markov state modeling.. PLoS Comput Biol, 2018. [DOI | PubMed]
- Identification of a novel RalGDS-related protein as a candidate effector for Ras and Rap1.. J Biol Chem, 1996. [DOI | PubMed]
- H-ras, K-ras, and inner plasma membrane raft proteins operate in nanoclusters with differential dependence on the actin cytoskeleton.. Proc Natl Acad Sci U S A, 2005. [DOI | PubMed]
- Force fields for protein simulations.. Adv Protein Chem, 2003. [DOI | PubMed]
- Computational and biochemical characterization of two partially overlapping interfaces and multiple weak-affinity K-Ras dimers.. Sci Rep, 2017. [DOI | PubMed]
- Direct visualization of Ras proteins in spatially distinct cell surface microdomains.. J Cell Biol, 2003. [DOI | PubMed]
- Spatiotemporal analysis of K-ras plasma membrane interactions reveals multiple high order homo-oligomeric complexes.. J Am Chem Soc, 2017. [DOI | PubMed]
- The ras-RasGAP complex: Structural basis for GTPase activation and its loss in oncogenic ras mutants.. Science, 1997. [DOI | PubMed]
- Fast, scalable generation of high-quality protein multiple sequence alignments using Clustal Omega.. Mol Syst Biol, 2011. [DOI | PubMed]
- RAS proteins and their regulators in human disease.. Cell, 2017. [DOI | PubMed]
- Integrated RAS signaling defined by parallel NMR detection of effectors and regulators.. Nat Chem Biol, 2014. [DOI | PubMed]
- Preparation of GTPases for structural and biophysical analysis.. Methods Mol Biol, 2002. [DOI | PubMed]
- Novel type of Ras effector interaction established between tumour suppressor NORE1A and Ras switch II.. EMBO J, 2008. [DOI | PubMed]
- PHENIX: An R package to estimate a size-controlled phenotypic integration index.. Appl Plant Sci, 2015. [DOI | PubMed]
- The small molecule BI-2852 induces a nonfunctional dimer of KRAS.. Proc Natl Acad Sci U S A, 2020. [DOI | PubMed]
- KRAS interaction with RAF1 RAS-binding domain and cysteine-rich domain provides insights into RAS-mediated RAF activation.. Nat Commun, 2021. [DOI | PubMed]
- Expression and purification of soluble His(6)-tagged TEV protease.. Methods Mol Biol, 2009. [DOI | PubMed]
- Endogenous oncogenic K-ras(G12D) stimulates proliferation and widespread neoplastic and developmental defects.. Cancer Cell, 2004. [DOI | PubMed]
- The guanine nucleotide-binding switch in three dimensions.. Science, 2001. [DOI | PubMed]
- Structural and biochemical analysis of Ras-effector signaling via RalGDS.. FEBS Lett, 1999. [DOI | PubMed]
- Aberrant overexpression of the Rgl2 Ral small GTPase-specific guanine nucleotide exchange factor promotes pancreatic cancer growth through Ral-dependent and Ral-independent mechanisms.. J Biol Chem, 2010. [DOI | PubMed]
- The CCPN data model for NMR spectroscopy: Development of a software pipeline.. Proteins, 2005. [DOI | PubMed]
- LIGPLOT: A program to generate schematic diagrams of protein-ligand interactions.. Protein Eng, 1995. [DOI | PubMed]
- Membrane-mediated induction and sorting of K-Ras microdomain signaling platforms.. J Am Chem Soc, 2011. [DOI | PubMed]
- RalGDS-like factor (Rlf) is a novel Ras and Rap 1A-associating protein.. Oncogene, 1996. [PubMed]
- Stimulation of gene induction and cell growth by the Ras effector Rlf.. EMBO J, 1997. [DOI | PubMed]
- Lack of elevated MAP kinase (Erk) activity in pancreatic carcinomas despite oncogenic K-ras expression.. Int J Oncol, 1999. [DOI | PubMed]
- Pancreatic tumor cells with mutant K-ras suppress ERK activity by MEK-dependent induction of MAP kinase phosphatase-2.. Biochem Biophys Res Commun, 2001. [DOI | PubMed]
- Quantitative mass imaging of single biological macromolecules.. Science, 2018. [DOI | PubMed]
- RalB directly triggers invasion downstream Ras by mobilizing the Wave complex.. Elife, 2018. [DOI | PubMed]
- Signal integration by lipid-mediated spatial cross talk between Ras nanoclusters.. Mol Cell Biol, 2014. [DOI | PubMed]