
A comparison of advertised versus actual cannabidiol (CBD) content of oils, aqueous tinctures, e-liquids and drinks purchased in the UK
Abstract
Background:
Cannabidiol (CBD)-containing products are sold widely in consumer stores, but concerns have been raised regarding their quality, with notable discrepancies between advertised and actual CBD content. Information is limited regarding how different types of CBD products may differ in their deviation from advertised CBD concentrations. Therefore, CBD concentrations were quantified and compared in aqueous tinctures, oils, e-liquids and drinks.
Methods:
Products (13 aqueous tinctures, 29 oils, 10 e-liquids and 11 drinks) were purchased online in the UK. CBD concentrations were quantified in aqueous tinctures, oils and e-liquids via high performance liquid chromatography (HPLC), and in drinks via gas chromatograhy-mass spectrometry (GC-MS).
Results:
Measured concentrations fell −25.7 ± 17.3, −6.1 ± 7.8, −6.9 ± 4.6 and − 0.03 ± 0.06 mg/mL below advertised concentrations for aqueous tinctures, oils, e-liquids and drinks, respectively (medians ± interquartile ranges; p < .05). Oils deviated relatively less (−19.0 ± 14.5%) from advertised concentrations than e-liquids (−29.2 ± 10.2%), aqueous tinctures (−51.4 ± 41.4%) and drinks (−65.6 ± 36.5%; p < .01), whilst e-liquids deviated less than aqueous tinctures and drinks (p < .05), and deviation was not different between aqueous tinctures and drinks (p = .19). Only 5/63 (8%) products had measured concentrations within 10% of advertised concentrations.
Discussion:
Similarly to previous studies, few products had measured CBD concentrations within 10% of advertised concentrations, with most falling below advertised concentrations. All individual product types deviated from advertised concentrations, with oils deviating least. These findings may be indicative of poor manufacturing standards, or that CBD undergoes degradation in consumer products. This reinforces concerns over quality of CBD-containing consumer products and may highlight the need for improved regulation of such products.
Article type: Case Report
Keywords: Cannabidiol, Product label, Accuracy, United Kingdom
Affiliations: grid.6571.50000 0004 1936 8542School of Sport, Exercise and Health Sciences, Loughborough University, Loughborough, Leicestershire UK; Bridge Farm Group, Spalding, Lincolnshire UK
License: © The Author(s) 2023 CC BY 4.0 Open Access This article is licensed under a Creative Commons Attribution 4.0 International License, which permits use, sharing, adaptation, distribution and reproduction in any medium or format, as long as you give appropriate credit to the original author(s) and the source, provide a link to the Creative Commons licence, and indicate if changes were made. The images or other third party material in this article are included in the article’s Creative Commons licence, unless indicated otherwise in a credit line to the material. If material is not included in the article’s Creative Commons licence and your intended use is not permitted by statutory regulation or exceeds the permitted use, you will need to obtain permission directly from the copyright holder. To view a copy of this licence, visit http://creativecommons.org/licenses/by/4.0/.
Article links: DOI: 10.1186/s42238-023-00183-y | PubMed: 37438849 | PMC: PMC10339496
Relevance: Relevant: mentioned in keywords or abstract
Full text: PDF (1.0 MB)
Introduction
Cannabidiol (CBD) is one of over 100 phytocannabinoids present in the cannabis plant, but is unique in its availability as an ‘over the counter’ product in the UK, the USA and many European nations. Consumer demand for CBD has grown rapidly due to beliefs that it may help manage specific medical conditions, such as epilepsy, and/or improve outcomes relating to general health and wellbeing (Moltke and Hindocha ref. 2021). Numerous types of CBD-containing products are now available, including oil- or aqueous-based tinctures, e-liquids, drinks, edibles, and topical creams/gels. However, analyses of CBD-containing products have raised concerns regarding their quality, with discrepancies between advertised and actual CBD content, and contamination with other, illicit cannabinoids (Grafinger et al. ref. 2020; Gurley et al. ref. 2020; Poklis et al. ref. 2019; Liebling et al. ref. 2020; Bonn-Miller et al. ref. 2017; Pavlovic et al. ref. 2018; Mazzetti et al. ref. 2020). For example, of 29 CBD-oils purchased within the UK, only 11 (38%) fell within 10% of their advertised CBD content (Liebling et al. ref. 2020), concurring with similar analyses from other nations (Grafinger et al. ref. 2020; Gurley et al. ref. 2020; Bonn-Miller et al. ref. 2017; Pavlovic et al. ref. 2018; Mazzetti et al. ref. 2020). However, there is currently limited information regarding the extent to which various different types of CBD products deviate from their advertised CBD content, which would have important implications for informing consumer choices. Therefore, the present study assessed CBD concentrations in a broader range of products than has previously been examined within the UK, including oil- and aqueous-based tinctures, e-liquids and drinks.
Methods
Study design
Sixty-three products from 40 brands (13 aqueous tinctures, 29 oils, 10 e-liquids and 11 drinks) were analysed for CBD concentration. More products were not analysed due to monetary costs. Health food stores and online CBD specialists are the first and second most common locations to purchase CBD products in the UK (Community Research and 2CV ref. 2019). Only one aqueous tincture and no e-liquids were found to be available from major UK-based health food retailers. Therefore, aqueous tinctures and e-liquids were purchased online after searching keywords such as ‘CBD aqueous drops’ and ‘CBD vape’; the first 13 and 10 suitable products found, respectively, were purchased. For each aqueous tincture and e-liquid identified, an oil product was purchased from the same brand at the most similar advertised CBD concentration available (no oil was available to match one aqueous tincture). This enabled the comparison of oils versus e-liquids and aqueous tinctures, whilst potentially eliminating different companies’ manufacturing standards as a confounding factor. Because most aqueous tinctures, e-liquids and their paired oils were purchased from online retailers, additional oil products were purchased online from major UK health food retailers to provide a more representative sample of oils purchased by UK consumers (Community Research and 2CV ref. 2019). All drinks were purchased online from major UK health food retailers. Products were analysed in a blinded fashion.
Product analysis
CBD and cannabidiolic acid (CBDA) concentrations were quantified in aqueous tinctures, oils and e-liquids via high performance liquid chromatography (HPLC) with a Raptor ARC-18 LC reverse phase column (2.7 μm, 150 mm × 4.6 mm; Restek, PA, USA) using ultraviolet detection (228 nm). Reported CBD concentrations using HPLC reflect the combination of measured CBD and theoretic conversion of CBDA to CBD (Wang et al. ref. 2016). Samples were analysed in singular except for a random subsample of nine products, analysed in duplicate; mean coefficient of variation = 0.17%. CBD concentrations were quantified in drinks via gas chromatography-mass spectrometry (GC-MS) using an Agilent 7890A (CA, USA) Gas Chromatograph coupled to an Agilent 5975C Mass Spectrometer, with an HP-5MS column (30 m, 0.25 mm, 0.25 μm). CBD concentrations quantified using GC-MS represent combined CBD and CBDA, as CBDA is decarboxylated upon injection into the gas chromatograph. All concentrations were calculated by comparing the peak area of a cannabinoid standard of known concentration (Cerilliant®, TX, USA) to the samples. HPLC and GC-MS analysis conditions are displayed in Table 1.
Table 1: HPLC and GC-MS settings for quantification of cannabidiol (CBD) concentrations
| Parameter | Specification |
|---|---|
| HPLC column temperature | 30°C |
| HPLC flow rate | 1.5 mL/min |
| HPLC analysis time | 10 min |
| HPLC injection volume | 5 µL |
| HPLC mobile phase conditions | Mobile phase A: aqueous ammonium formate (5mM)/formic acid (0.1%)Mobile phase B: acetonitrile/formic acid (0.1%)Isocratic, 25% mobile phase A |
| GC-MS carrier gas | Hydrogen at 1 mL/min |
| GC-MS inlet temperature | 200°C |
| GC-MS injection volume: | 1 µL at 50:1 split ratio |
| GC-MS temperature programme | 60°C and held for 2 min, increasing to 300°C at 8°C/min and held for 10 min |
| GC-MS ion source temperature | 230°C |
| GC-MS mass analyzer temperature | 150°C |
| GC-MS analysis time | 42 min |
| GC-MS scan range | 40–600 m/z at 1 Hz |
HPLC High-performance liquid chromatography, GC-MS Gas chromatography-mass spectrometry
Cannabinoids were extracted by diluting products to 1 mg/mL for HPLC analysis, or 0.001 mg/mL for GC-MS analysis, based on advertised CBD concentrations. Oils, e-liquids and highly viscous aqueous tinctures were diluted mass/mass in 50:50 isopropyl alcohol (IPA):methanol, except for two products that failed to fully dissolve in IPA:methanol, so were diluted in 100% IPA. Drinks and other aqueous solutions were diluted mass/volume in 100% methanol, then homogenised with an ultrasonic homogeniser (20 W; 50% amplitude; H7 probe) and the supernatant filtered (0.22 μm). Products for HPLC analysis were then diluted a further 10-fold in methanol (i.e., to 0.1 mg/mL, based on advertised concentrations). The HPLC assay precision is ≤5.5% for CBD and ≤4.6% for CBDA. The GC-MS assay precision is ≤3.6%. The HPLC assay accuracy is 95–112% (0.001–0.15 mg/mL) for CBD and 99–102% (0.001–0.005) for CBDA. The GC-MS assay accuracy is 97–116% (0.0001–0.001 mg/mL). GC-MS was applied to drinks as this method has a lower quantifiable range, outlined above, which was necessary to quantifiy the lower CBD concentrations in drinks versus. other product types (the quantifiable concentration ranges do not correspond to reported CBD product concentrations as products were diluted during cannabinoid extraction). The pH of drinks was measured using a SciQuip pH meter (PHS-25CW/3BW, Newtown, UK), calibrated with pH 4.00 and 7.00 solution. The electrode was rinsed with deionised water between samples.
Statistical analysis
Advertised and measured CBD concentrations were compared for each product type using Wilcoxon signed-rank tests due to non-normal data distributions (Shapiro-Wilk test p < .05 and histograms shaped non-normally). Relative discrepancies between advertised and actual concentrations were compared between product types using one-way ANOVAs for unequal variance on rank-transformed scores (Zimmerman and Zumbo ref. 1993). If significant, post hoc comparisons were made using t-tests for unequal variance on rank-transformed scores with a Holm-Bonferroni correction (Zimmerman and Zumbo ref. 1993). This approach was selected due to unequal sample sizes and violations to both normality and homogeneity of variance (Levene’s test on mediansp < .05). Comparisons between oils and brand-matched aqueous tinctures and e-liquids were made using an independent samples t-test or Mann-Whitney U test, depending on data normality. Relationships between variables were examined using Spearman’s ranks or Pearson’s correlations, depending on data normality. All statistical tests were two-tailed, significance accepted at p < .05, performed in SPSS-25 (IBM, NY, USA).
Results
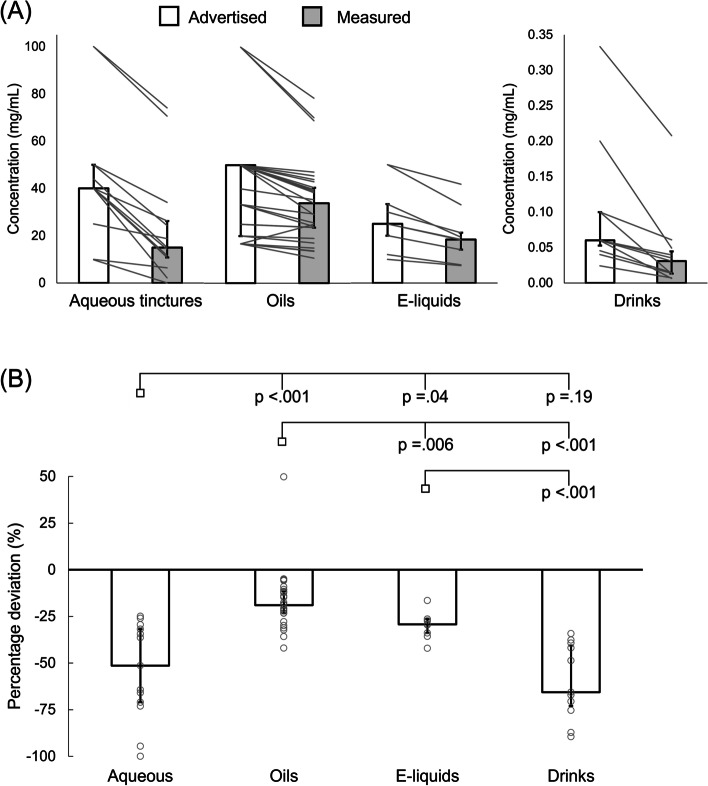
Measured CBD concentrations fell −25.7 ± 17.3, −6.1 ± 7.8, −6.9 ± 4.6 and −0.03 ± 0.06 mg/mL below advertised concentrations for aqueous tinctures, oils, e-liquids and drinks, respectively (median ± interquartile range [IQR]; p < .001 for all products; Fig. 1). Only 5/29 oils had measured concentrations within 10% of that advertised, and all other products fell >10% below advertised, except for a single oil that was 50% greater than advertised (Fig. 1). Relative deviation from advertised concentrations differed depending on product type (p < .001 for ANOVA main effect) and was less for oils versus all other product types (p < .01 for all comparisons), less for e-liquids versus aqueous tinctures (p = .04) and drinks (p < .01), but was not different between aqueous tinctures and drinks (p = .19; Fig. 1). Median (± IQR) relative deviations from advertised concentrations were −51.4 ± 41.4%, −19.0 ± 14.5%, −29.2 ± 10.2%, and −65.6 ± 36.5% for aqueous tinctures, oils, e-liquids and drinks, respectively (Fig. 1). Median (± IQR) measured and advertised CBD concentrations for the entire dataset were 19.2 ± 30.7 mg/mL and 33.3 ± 33.3 mg/mL, respectively (median difference: −6.6 ± 12.3 mg/mL [−29.5 ± 23.1%]; p < .001). Mean (± standard deviation [SD]) pH of drinks was 4.0 ± 0.8.
When comparing brand-matched oils and aqueous tinctures, absolute and relative discrepancies between measured and actual CBD concentrations were (mean ± SD) −12.7 ± 10.2 mg/mL and −20.4 ± 10.9% for oils, versus −24.3 ± 8.9 mg/mL and −51.5 ± 23.7% for aqueous tinctures. Relative discrepancies were greater for aqueous tinctures (p = .01). For brand matched oils and e-liquids, absolute discrepancies between advertised and measured CBD concentrations were (median ± IQR) −4.6 ± 9.0 mg/mL and −6.6 ± 6.3 mg/mL. When comparing relative discrepancies, deviation from advertised concentration (mean ± SD) was less for oils (−19.1 ± 11.9%) than e-liquids (−31.0 ± 7.7%; p = .03).
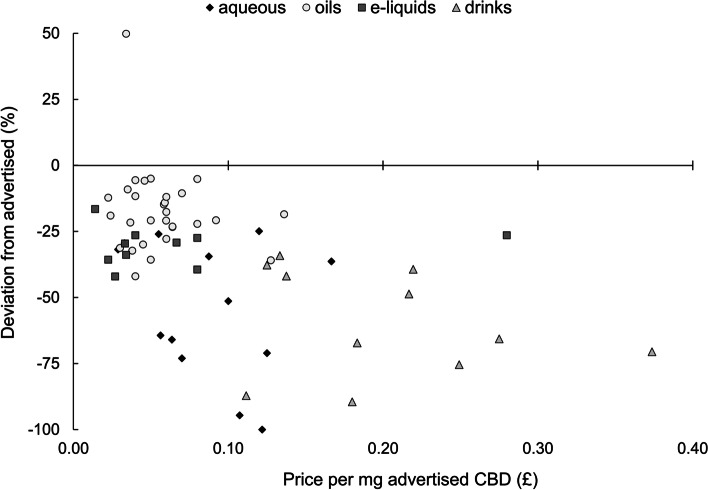
There was no linear relationship between price (normalised to advertised CBD concentration) and relative discrepancy between measured and advertised CBD concentration for aqueous tinctures (R = −.26), oils (R = −.10), e-liquids (R = .11) or drinks (R = −.24; p > .05 for all products; Fig. 2). These variables demonstrated a negative relationship when examining all products together (R = −.48, p < .001), but this was driven by systematic differences between product types, e.g., oils deviating less than drinks, whilst simultaneously costing less per mg CBD.
Discussion
Measured CBD concentrations of a broad range of UK-based products fell, on average, substantially below what was advertised, with only 5/63 (8%) products within 10% of advertised concentrations. The median deviations from advertised concentrations (−66 to −19%) were substantially greater than the measurement error associated with HPLC and GC-MS analysis, reinforcing concerns surrounding CBD products within the UK, whereby CBD consumers may consistently fail to achieve their desired CBD dose. Furthermore, the likelihood of achieving a desired dose may be dependent on product type, with oils deviating least from advertised concentrations. However, observed deviation is seemingly independent of product price.
The proportion of products measured within 10% of advertised concentration (8%) is at the lower end of previous analyses, in which ~ 10–40% of products have met this target (Grafinger et al. ref. 2020; Liebling et al. ref. 2020; Bonn-Miller et al. ref. 2017; Pavlovic et al. ref. 2018; Mazzetti et al. ref. 2020), including 38% in a UK-based analysis of 29 oils (Liebling et al. ref. 2020). The greater deviation from advertised concentrations in e-liquids, aqueous tinctures and drinks, which have more rarely or never been included in such analyses, reduced the proportion of products meeting this cut-off, which was 17% (5/29) for oils. Systematic differences in analytical techniques may also contribute to some minor variation between studies. Nevertheless, available evidence consistently suggests that only a minority of products contain CBD concentrations within acceptable limits of what is advertised.
The lesser deviation from advertised concentrations by oils in this study supports Bonn-Miller et al. (Bonn-Miller et al. ref. 2017), who observed that oils were less frequently mislabelled than e-liquids in a sample of US products (22/40 versus 21/24). Such findings may help inform consumer choice when purchasing CBD products. However, without repeat analyses, it is unclear how much CBD concentrations vary between batches of individual products, and so whether products that deviate more/less than others do so consistently. Available market research data suggest poor consumer awareness regarding CBD product quality. The consistent over-labelling of CBD concentrations in products is contradictory to findings that most UK consumers believe that the CBD product(s) they purchase are ‘high quality’ and contain CBD concentrations equivalent to what is advertised (Community Research and 2CV ref. 2019). Despite this, perceived product quality is the primary factor in determining consumer choice of CBD product (Community Research and 2CV ref. 2019).
It is unclear whether deviations from advertised CBD concentrations are due to discrepancy at the point of manufacture, or degradation afterwards. CBD in e-liquids can degrade 15–20% over 30 days when exposed to natural light or constant 37°C temperature (Mazzetti et al. ref. 2020), suggesting that degradation may contribute to the discrepancies observed. Furthermore, variable rates of degradation in different solutions (Sørensen and Hasselstrøm ref. 2018; Kosović et al. ref. 2021) could potentially contribute to differences observed between product types. The lesser discrepancies observed in oils versus brand-matched e-liquids and aqueous tinctures indicate that this may be the case, as manufacturing standards would likely be comparable between products of the same seller. The tendency for greater discrepancies in aqueous products may suggest that CBD is more unstable when dissolved in water than in oils or substances such as propylene glycol, while the acidic pH of drinks may have exacerbated degradation in those products (Yangsud et al. ref. 2021).
Conclusions
The over-labelling of CBD concentrations within UK products highlights the need for improved product standards, which may necessitate clearer legislative guidance on acceptable tolerance limits for advertised CBD concentrations. The magnitude of deviation from advertised CBD concentrations differed between product types but was not related to product price, with CBD-oils deviating less than aqueous tinctures, e-liquids and drinks. Future research may seek to determine rates of CBD degradation in consumer products, and within-product variability in labelling accuracy. Furthermore, CBD used in research investigating its psychological or physiological affects should be analysed to confirm that CBD concentrations are appropriate.
References
- MO Bonn-Miller, MJE Loflin, BF Thomas, JP Marcu, T Hyke, R Vandrey. Labeling accuracy of cannabidiol extracts sold online. JAMA, 2017. [DOI | PubMed]
- Community Research and 2CV: Consumer Research Report on Cannabidiol (CBD) Extracts. Food Standards Agency. 2019. https://www.food.gov.uk/sites/default/files/media/document/cbd-consumer-research-report-october-2019_0.pdf. Accessed 20 July 2021.
- KE Grafinger, S Krönert, A Broillet, W Weinmann. Cannabidiol and tetrahydrocannabinol concentrations in commercially available CBD E-liquids in Switzerland. Forensic Sci Int., 2020. [DOI | PubMed]
- BJ Gurley, TP Murphy, W Gul, LA Walker, M ElSohly. Content versus label claims in cannabidiol (CBD)-containing products obtained from commercial outlets in the state of Mississippi. J Diet Suppl, 2020. [DOI | PubMed]
- E Kosović, D Sýkora, M Kuchař. Stability study of cannabidiol in the form of solid powder and sunflower oil solution. Pharmaceutics, 2021. [DOI | PubMed]
- JP Liebling, NJ Clarkson, BW Gibbs, AS Yates, SE O’Sullivan. An analysis of over-the-counter cannabidiol products in the United Kingdom. Cannabis Cannabinoid Res, 2020. [DOI | PubMed]
- C Mazzetti, E Ferri, M Pozzi, M Labra. Quantification of the content of cannabinol in commercially available e-liquids and studies on their thermal and photo-stability. Sci Rep, 2020. [DOI | PubMed]
- J Moltke, C Hindocha. Reasons for cannabidiol use: a cross-sectional study of CBD users, focusing on self-perceived stress, anxiety, and sleep problems. J Cannabis Res, 2021. [DOI | PubMed]
- R Pavlovic, G Nenna, L Calvi, S Panseri, G Borgonovo, L Giupponi. Quality traits of “cannabidiol oils”: cannabinoids content, terpene fingerprint and oxidation stability of european commercially available preparations. Molecules, 2018. [DOI | PubMed]
- JL Poklis, HA Mulder, MR Peace. The unexpected identification of the cannabimimetic, 5F-ADB, and dextromethorphan in commercially available cannabidiol e-liquids. Forensic Sci Int, 2019. [DOI | PubMed]
- LK Sørensen, JB Hasselstrøm. The effect of antioxidants on the long-term stability of THC and related cannabinoids in sampled whole blood. Drug Test Anal, 2018. [DOI | PubMed]
- M Wang, YH Wang, B Avula, MM Radwan, AS Wanas, J van Antwerp. Decarboxylation study of Acidic Cannabinoids: a Novel Approach using Ultra-High-Performance Supercritical Fluid Chromatography/Photodiode Array-Mass Spectrometry. Cannabis Cannabinoid Res, 2016. [DOI | PubMed]
- J Yangsud, S Santasanasuwan, P Ahkkarachinoreh, A Maha, F Madaka, J Suksaeree. Stability of cannabidiol, ∆9-tetrahydrocannabinol, and cannabinol under stress conditions. Adv Tradit Med, 2021. [DOI]
- DW Zimmerman, BD Zumbo. Rank transformations and the power of the Student t test and Welch t’ test for non-normal populations with unequal variances. Can J Exp Psychol Can Psychol, 1993. [DOI]