
Acute human exposure assessment to tetrahydrocannabinol (Δ9‐THC)
Abstract
Delta‐9‐tetrahydrocannabinol (Δ9‐THC) is a naturally occurring psychoactive compound derived from the hemp plant Cannabis sativa. In 2015, EFSA established an acute reference dose (ARfD) of 1 μg/kg body weight (bw) for Δ9‐THC and assessed acute dietary exposure from milk and dairy products. This resulted at the most 3% and 13% of the ARfD for adults and toddlers, respectively. Following the European Commission Recommendation 2016/2115 on the monitoring of the presence of Δ9‐THC in food and the issuing of a new mandate, EFSA assessed the acute human exposure to Δ9‐THC. ‘Standard’ food categories were used as proxies for consumption of hemp and hemp‐based products. Twelve independent scenarios based on single food categories were considered and acute exposure was assessed for consumption days only for all age groups excluding infants. Occurrence data for Total‐Δ9‐THC (588 samples in total) were used for this assessment up to the highest reliable percentile for each food category. The EFSA ARfD of 1 μg/kg bw was exceeded in the adult high consumers of most considered hemp and hemp‐containing products, under the lower‐bound (LB) and upper‐bound (UB) scenario. At the UB, acute exposure in adult high consumers was estimated based on the highest reliable percentile of occurrence, for Hemp seeds (P95, up to 9 μg/kg bw), Hemp oil (P95, up to 21 μg/kg bw), Tea (Infusion) (P95, up to 208 μg/kg bw), Breakfast cereals (P50, up to 1.3 μg/kg bw), Pasta (Raw) (P75, up to 6.4 μg/kg bw), Bread and rolls (P75, up to 1.3 μg/kg bw), Bread and rolls from hemp flour (P90, up to 4.1 μg/kg bw), Cereal bars (P50, up to 0.3 μg/kg bw), Fine bakery wares (P75, up to 5.1 μg/kg bw), Chocolate (Cocoa) products (P75, up to 1.1 μg/kg bw), Energy drinks (P75, up to 0.2 μg/kg bw), Dietary supplements (P75, up to 9.9 μg/kg bw), Beer and beer‐like beverages (P90, up to 41 μg/kg bw). The use of proxies for the consumption of hemp and hemp‐containing products, the limited number of occurrence data and the analytical limitations in the quantification of Δ9‐THC represent the most important sources of uncertainty. Overall, exposure estimates presented in this report are expected to represent an overestimation of acute exposure to Δ9‐THC in the EU.
Article type: Research Article
Keywords: Tetrahydrocannabinol, delta‐9‐tetrahydrocannabinol, Δ9‐, acute human exposure assessment
License: © 2020 European Food Safety Authority. EFSA Journal published by John Wiley and Sons Ltd on behalf of European Food Safety Authority. CC BY-ND 4.0 This is an open access article under the terms of the http://creativecommons.org/licenses/by-nd/4.0/ License, which permits use and distribution in any medium, provided the original work is properly cited and no modifications or adaptations are made.
Article links: DOI: 10.2903/j.efsa.2020.5953 | PubMed: 32626501 | PMC: PMC7008849
Relevance: Relevant: mentioned in keywords or abstract
Full text: PDF (4.6 MB)
Summary
In 2015, the EFSA Panel on Contaminants in the Food Chain (CONTAM Panel) established an acute reference dose (ARfD) of 1 μg/kg body weight (bw) for Δ9‐tetrahydrocannabinol (Δ9‐THC) in its scientific opinion on risks for human health related to the presence of tetrahydrocannabinol (THC) in milk and other food of animal origin (EFSA, 2015). In 2015, EFSA estimated acute dietary exposure only from milk and dairy products. Acute exposure to ∆9‐THC through the consumption of milk and dairy products resulted at the most in 3% and 13% of the ARfD of 1 μg/kg bw for adults and toddlers, respectively. Considering the limitations of the 2015 exposure assessment, the Commission Recommendation (EU) 2016/2115, invited Member States and food business operators to monitor the presence of Δ9‐THC, its precursors and other cannabinoids in food and to provide these data to EFSA. In October 2018, an official request was issued by the European Commission asking the EFSA Evidence Management Unit (DATA Unit) for an acute dietary exposure assessment to Δ9‐THC taking into account the new occurrence data available in the EFSA database and the updated comprehensive food consumption database. In addition, EFSA was requested to provide an overview of the available occurrence data on the precursors of Δ9‐THC and other cannabinoids in food together with information on their co‐occurrence with Δ9‐THC. By the end of December 2018, the EFSA database contained 1,866 analytical results on Δ9‐THC and other cannabinoids in food. There is documented uncertainty associated with the exact quantification of Δ9‐THC in food due to analytical methods, extraction efficiency as well as in relation to conversions related to food processing. For instance methods based on capillary gas chromatography with flame ionisation (GC‐FID) (as the official method prescribed by EC No 1122/2009) are not able to differentiate the psychoactive Δ9‐THC from its non‐psychoactive precursors delta‐9‐tetrahydrocannabinolic acids A (Δ9‐THCA‐A) and B (Δ9‐THCA‐B). In the absence of a preliminary separation step (such as a derivatisation with silanes), gas chromatography coupled with mass spectrometry (GC–MS)‐based methods are thus not specific for Δ9‐THC. In contrast, liquid chromatography (LC)‐based methods are specific for Δ9‐THC. The analytical method used for the sample preparation and analysis therefore dictates the specificity for the results reported for Δ9‐THC. Considering this, all analytical results reported as ‘Δ9‐THC’ were therefore carefully evaluated in relation to the applied analytical method. After applying the exclusion criteria and a careful reclassification of analyte according to analytical method, a total of 1,547 analytical results were available in the final data set, with 1,303 analytical results submitted by national organisations and 244 by industry). Most of the samples (n = 427) were on ‘pure’Δ9‐THC (defined as data submitted on Δ9‐THC and produced with LC‐based methods); 237 on ‘Sum of delta‐9‐Tetrahydrocannabinol and delta‐9‐Tetrahydrocannabinolic Acid’ (Sum Δ9‐THC/Δ9‐THCA) (data reported on Δ9‐THC and analysed either by GC‐based methods or unknown methods), on cannabidiol (208) and cannabinol (167). Samples were collected from 2000 until 2018, with most of the samples collected from 2016 onward. Data were provided on a variety of hemp and hemp‐based products although the amount of data of food of animal origin remained poor. Most of the analytical results reported from governmental organisations were from samples collected in Germany, Italy and the Czech Republic; industry reported samples from Germany and Romania. Considering the limited number of samples reported for ‘pure’Δ9‐THC and Sum Δ9‐THC/Δ9‐THCA, and the fact that both categories referred, although with a different extent of uncertainty, to Δ9‐THC, the two sets of data were merged into a unique group referred as ‘Total‐Δ9‐THC’ and used to perform acute exposure assessment.
The occurrence data used to assess acute exposure to Total‐Δ9‐THC was finally composed of 588 samples (covering 13 hemp and hemp‐derived products). Compared to the EFSA opinion published in 2015 (EFSA, 2015), there was an increase of the number of samples as well as the number of food categories that could be used for exposure assessment to Δ9‐THC.
The latest version of the EFSA Comprehensive European Food Consumption Database (Comprehensive Database) updated in 2018, containing results from a total of 60 different dietary surveys carried out in 25 different Member States across age classes was used. Given the limited amount of data on individual consumption of hemp and hemp‐based products, it was decided to use proxies based on ‘standard’ food categories and to calculate acute dietary exposure.
Based on the occurrence data, 12 independent scenarios were considered, based on single food categories and acute exposure was assessed for all age groups, with the only exclusion of infants across European population groups. Occurrence data for Total‐Δ9‐THC were used for the acute exposure assessment up to the highest reliable percentile. Mean occurrence values were not considered representative of the distributions because in most of the cases they were positively skewed.
Acute dietary exposure was assessed at the upper bound (UB) and lower bound (LB) for Total‐Δ9‐THC for consumers only of the following hemp and hemp‐derived products:
- ‘Hemp oil’ (n = 125, at the UB occurrence level P50 = 1,890, up to P95 = 17,000 μg Total‐Δ9‐THC/kg);
- ‘Hemp seeds’ (n = 127, at the UB P50 = 390, up to P95 = 3,960 μg Total‐Δ9‐THC/kg);
- ‘Tea (Infusion)’ (n = 119, at the UB P50 = 140, up to P95 = 6,467 μg Total‐Δ9‐THC/kg);
- ‘Bread and rolls’ (‘as such’ n = 14, at the UB P50 = 85, up to P75 = 190 μg Total‐Δ9‐THC/kg) and as ‘Bread and rolls from hemp flour’ (n = 49, at the UB P50 86; up to P90 597 μg Total‐Δ9‐THC/kg);
- ‘Pasta (Raw)’ (n = 18, at the UB P50 = 310, up to P75 = 1,000 μg Total‐Δ9‐THC/kg);
- ‘Breakfast cereals’ (n = 7, at the UB P50 = 200 μg Total‐Δ9‐THC/kg);
- ‘Cereal bars’ (n = 5, at the UB P50 = 200 μg Total‐Δ9‐THC/kg);
- ‘Fine bakery wares’ (n = 24, at the UB P50 = 65, up to P75 = 776 μg Total‐Δ9‐THC/kg);
- ‘Chocolate (Cocoa) products’ (n = 19, at the UB P50 = 200, up to P75 = 400 μg Total‐Δ9‐THC/kg);
- ‘Energy Drinks’ (n = 25, at the UB P50 = 3, up to P75 = 15 μg Total‐Δ9‐THC/kg);
- ‘Beer and beer‐like beverages’ (n = 30, at the UB P50 = 14, up to P90 = 635 μg Total‐Δ9‐THC/kg);
- ‘Dietary supplements’ (n = 26, at the UB P50 = 1,115, up to P75 = 19,800 μg Total‐Δ9‐THC/kg).
Mean and high (P95) exposure estimates based on different percentiles (up the highest reliable one) of occurrence were assessed. For the scenario on ‘Hemp oil’: at the P95 occurrence level for the high consumers, at the UB the acute exposure to Total‐Δ9‐THC in ‘adults’ ranged from 3 to 21 μg/kg bw and in ‘other children’ from 7 to 59 μg/kg bw. For the scenario on ‘Hemp seeds’: at the P95 occurrence level for the high consumers, acute exposure to Total‐Δ9‐THC ranged at the UB from 1.1 to 2.9 μg/kg bw in ‘other children’ and from 2.3 to 9 μg/kg bw in ‘adults’. For the scenario on ‘Tea (Infusion)’: at the highest reliable occurrence percentile (P95) for high consumers, the acute exposure ranged from 40 to 208 μg Total‐Δ9‐THC /kg bw in adults (UB). For the scenario on ‘Bread and Rolls’: acute exposure was estimated up to the P75 occurrence level (14 samples) for ‘Bread and Rolls’ (as such) and up to the P90 occurrence level for ‘Bread and rolls from hemp flour’ (49 samples). In adults, exposure to Total‐Δ9‐THC for the high consumers was 0.3–1.3 (LB–UB) μg/kg bw in ‘bread and rolls’ vs. 1.15–1.15 μg/kg bw (LB–UB) in ‘Bread and rolls from hemp flour’ at the P75 occurrence level. The difference was mainly due to the elevated amount of left‐censored data (71%) in the category ‘Bread and rolls’ (as such). For the scenario on ‘Dietary supplements’: 26 samples were available and acute exposure was estimated up to the P75 occurrence level. At this percentile, for high consumers the exposure to Total‐Δ9‐THC varied between 1.5 and 9.9 (UB) μg/kg bw in adults. For the scenario on ‘Pasta (Raw)’: only 18 samples were available and acute exposure was estimated up to the P75 occurrence level. At this percentile for high consumers at the UB, exposure varied between 1.2 and 6.4 in adults μg Total‐Δ9‐THC /kg bw. For the scenario on ‘Breakfast cereals’: exposure was estimated up to the P50 occurrence level (7 samples). At this percentile, the exposure for high consumers ranged from 0.18 to 1.27 (at the UB) Total‐Δ9‐THC μg/kg bw in adults. For the scenario on ‘Cereal bars’: exposure was estimated only for the P50 occurrence level (5 samples). At this percentile, acute exposure to Total‐Δ9‐THC ranged from 0.19 to 0.27 (at the UB) μg/kg bw in adults with high consumption. For the scenario on ‘Fine bakery wares’: exposure was estimated up to the P75 occurrence level (24 samples). At this occurrence percentile, the exposure to Total‐Δ9‐THC in adults, for high consumers ranged from 1.7 to 5.1 μg/kg bw at the UB. For the scenario on ‘Chocolate (Cocoa) products’: acute exposure was estimated up to the P75 occurrence level (19 samples). At this occurrence percentile, the exposure to Total‐Δ9‐THC in adults, for high consumers ranged from 0.37 to 1.07 μg/kg bw at the UB. For the scenario on ‘Energy drinks’: acute exposure was estimated up to the P75 occurrence level (25 samples). For high consumers at the P75 of occurrence, exposure in adults varied between 0.14 and 0.25 (UB) μg/kg bw. For the scenario on ‘Beer and Beer‐Like Beverages’: acute exposure was estimated up to the P90 occurrence level (30 samples). At this percentile, the acute exposure to Total‐Δ9‐THC at the UB, for high adult consumers varied from 7 to 41 μg/kg bw. Overall exposure estimates were in line with those performed by the BfR (2018). The EFSA ARfD of 1 μg/kg bw was exceeded at the UB in adult consumers for most of the hemp and hemp‐derived products. Main sources of uncertainty in current exposure assessment are represented by: (i) the use of proxies of hemp and hemp‐based products on consumers of ‘standard’ food categories, (ii) the limited occurrence data set used to feed the exposure scenarios (ranging from 5 up to 127 per food category) represents a source of uncertainty related to the representativity of the data set, (iii) well‐known methodological limitations in the exact determination of ∆9‐THC levels in different foods due to a number of factors (variable selectivity towards ∆9‐THC of different analytical methods (e.g. GC‐based vs. LC‐based; the extraction efficiency of ∆9‐THCA‐A and ∆9‐THC for different food types and methods; conversion of ∆9‐THCA‐A into ∆9‐THC during food processing and cooking)). In the present report, a 100% conversion of ∆9‐THCA‐A into ∆9‐THC was considered, however an attempt to assess exposure to ‘pure’Δ9‐THC was carried out in order to evaluate the level of conservativeness of this assumption. Overall, the inclusion of occurrence data on Sum Δ9‐THC/Δ9‐THCA reduced the exposure estimates and its uncertainty since more samples were available for the assessment. Considering all the above‐mentioned factors, exposure estimates presented in this report are expected to represent an overestimation of the acute exposure to Δ9‐THC in ‘single food’ scenarios on consuming days. It would be desirable to encourage further research to obtain sensitive, validated (including interlaboratory validation) and Δ9‐THC specific methods to be translated to reliable official methods. Studies on the stability of Δ9‐THC, as well as on the conversion of Δ9‐THCA during food processing, including cooking, are required using state‐of‐the‐art Δ9‐THC specific methods. Data providers and, in general, the scientific community working in the field, should be encouraged to avoid the misclassification and the submission to EFSA of data on Total‐Δ9‐THC (based on unspecific GC methods) as ‘Δ9‐THC’. Member states should be encouraged to collect and submit to EFSA more occurrence data (based on selective methods) for Δ9‐THC in food and especially of animal origin, including dairy products, eggs and meat of animals fed with hemp and hemp‐derived products. Consumption data on hemp‐derived products are needed to refine the exposure scenarios.
Introduction
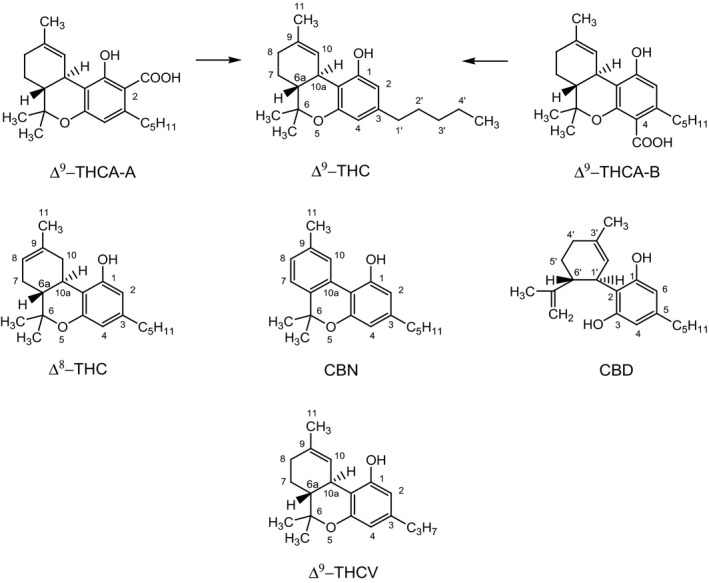
Tetrahydrocannabinol, or delta‐9‐tetrahydrocannabinol (Δ9‐THC), is derived from the hemp plant Cannabis sativa. There are four stereoisomers of Δ9‐THC: (‐)‐trans‐Δ9‐THC and (+)‐trans‐Δ9‐THC, (‐)‐cis‐Δ9‐THC and (+)‐cis‐Δ9‐THC, of which (‐)‐trans‐Δ9‐THC is the only one naturally occurring and the primary psychoactive compound derived from C. sativa. The non‐psychoactive precursors are the delta‐9‐tetrahydrocannabinolic acids A and B, or 2‐COOH‐Δ9‐THC (Δ9‐THCA‐A) and 4‐COOH‐Δ9‐THC (Δ9‐THCA‐B), respectively. The precursors are predominantly present in the growing and harvested plant, whereas Δ9‐THC generally occurs at low concentrations. When heated, the precursors are rapidly converted to ∆9‐THC as a result of decarboxylation (EFSA, 2015). Figure 1 shows the chemical structures of Δ9‐THC and the two precursors Δ9‐THCA‐A and Δ9‐THCA‐B.
In the European Union (EU), varieties of hemp that are cultivated and used for feed must be listed in the EU’s ‘Common Catalogue of Varieties of Agricultural Plant Species’. According to Regulation (EU) No 1307/20131, the maximum content of THC in these varieties is limited to 0.2 % (w/w). The determination of Δ9‐THC in hemp plants used/grown for feed is prescribed by Commission Regulation (EC) No 1122/2009,2 based on capillary gas chromatography with flame ionisation detection (GC‐FID). However, this official analytical method is not able to differentiate between Δ9‐THC and its precursors (EFSA, 2015).
THC is currently not regulated under any EU regulation for food. Capillary gas chromatography coupled with mass spectrometry (GC–MS), following liquid–liquid extraction or solid phase microextraction, is the method of choice for the determination of Δ9‐THC and other cannabinoids in hemp‐containing food products. A separate determination of Δ9‐THC and its precursor acids is possible by derivatisation, such as silylation of the extract prior to gas chromatography (GC) analysis or by liquid chromatography–tandem mass spectrometry (LC–MS/MS) (EFSA, 2015).
In 2015, the EFSA Panel on Contaminants in the Food Chain (CONTAM Panel) published a scientific opinion on risks for human health related to the presence of THC in milk and other food of animal origin. Although the assessment focussed on Δ9‐THC and the risks to human health through dietary exposure, other cannabinoids such as delta‐8‐tetrahydrocannabinol (Δ8‐THC), cannabinol (CBN), cannabidiol (CBD) and delta‐9‐tetrahydrocannabivarin (Δ9‐THCV) were also considered in the case of potential interactions with Δ9‐THC (chemical structures are presented in Figure 1).
The CONTAM Panel considered central nervous system (CNS) effects and increased heart rate, which were noted at low Δ9‐THC dose levels in humans, as relevant for the risk assessment. As these effects occurred within a short time after dose administration, an acute reference dose (ARfD) was established. The dose of 2.5 mg Δ9‐THC per day, corresponding to 0.036 mg Δ9‐THC/kg body weight (bw) per day for a person with a body weight of 70 kg, was regarded as the lowest‐observed‐adverse‐effect level (LOAEL), in both single and repeated uses. By applying an overall uncertainty factor (UF) of 30 (using an UF of 3 for extrapolation from the LOAEL to a no‐observed‐adverse‐effect level (NOAEL) and a UF of 10 for interindividual differences) an ARfD of 1 μg Δ9‐THC/kg bw was established.
From data on repeated dose toxicity in rodents, the CONTAM Panel identified a lowest 10% lower confidence limit of the benchmark dose (BMDL10) of 0.73 mg Δ9‐THC/kg bw per day for the increased length in oestrus cycle as a reference point (RP) for the possible establishment of a tolerable daily intake (TDI). A difference of approximately 700 times was observed between this RP and the ARfD of 1 μg Δ9‐THC/kg bw. Therefore, the CONTAM Panel concluded that ensuring that exposure is below the ARfD would also protect against possible effects of repeated exposure and that establishing a TDI was not necessary (EFSA, 2015).
Almost no data were available for milk or other food of animal origin. Therefore, acute dietary exposure from milk and dairy products was estimated by combining different scenarios for the presence of ∆9‐THC in hemp seed‐derived feed material, the transfer rate from feed to milk, the daily milk yield, the daily feed consumption and the human consumption of these products. Dietary exposure through consumption of animal tissues and eggs could not be estimated due to a lack of data on the potential transfer and fate of ∆9‐THC. Analytical data which gave clearly defined levels of Δ9‐THC in hemp seed‐derived feed materials were provided by the European Industrial Hemp Association (EIHA) and the Swiss Federal Food Safety and Veterinary Office (FSVO) and were considered in the assessment. For adults and toddlers, acute exposure to ∆9‐THC through the consumption of milk and dairy products resulting from the use of hemp seed‐derived feed materials, ranged between 0.001 to 0.03 μg/kg bw per day and 0.006 to 0.13 μg/kg bw per day, respectively. These exposure estimates are at the most 3% and 13% of the ARfD of 1 μg/kg bw for adults and toddlers, respectively (EFSA, 2015).
The CONTAM Panel concluded that the estimates of dietary exposure to ∆9‐THC via consumption of milk and dairy products resulting from the use of hemp seed‐derived feed materials, were unlikely to pose a health concern (EFSA, 2015).
Background and Terms of Reference as provided by the requestor
In 2015, EFSA Panel on Contaminants in the Food Chain (CONTAM) adopted a Scientific Opinion on the risks for human health related to the presence of tetrahydrocannabinol (THC) in milk and other food of animal origin.3 Tetrahydrocannabinol, more precisely delta‐9‐tetrahydrocannabinol (Δ9‐THC) is the most relevant constituent of the hemp plant Cannabis sativa. EFSA established an acute reference dose (ARfD) of 1 μg Δ9‐THC/kg bw. The exposure estimates in the opinion indicated that the exposure related to the presence of Δ9‐THC in milk and dairy products was at the most 3% and 13% of the ARfD of 1 μg/kg bw in adults and toddlers, respectively. The CONTAM Panel concluded therefore that these estimates of dietary exposure to ∆9‐THC are unlikely to pose a health concern. Only limited data on the presence of Δ9‐THC in food of animal origin are available and limited data are available from the transfer rate from feed to food of animal origin. Therefore, there is a need to have more data on the presence in food of animal origin, of which evidence is available that the food of animal origin is produced by animals being fed with feed containing hemp or hemp derived feed materials. Furthermore, there were also limited occurrence data available on the presence of Δ9‐THC in hemp‐derived foods and foods containing hemp or hemp‐derived ingredients. Given the levels found in these foods and the regulatory levels applicable to certain hemp‐derived foods in certain Member States, combined with an increasing consumption of such food, it can be reasonably assumed that the human exposure to Δ9‐THC from these foods is higher than the exposure from milk and dairy products and more general food of animal origin. Commission Recommendation (EU) 2016/2115 recommends to Member States and food business operators to monitor the presence of Δ9‐tetrahydrocannabinol, its precursors and other cannabinoids in food and to provide these data to EFSA on a regular basis and by the latest by October 2018. It is appropriate taking into account the availability of these occurrence data and the updated comprehensive food consumption database, to perform an updated acute exposure assessment to Δ9‐THC.
In addition, a detailed overview of the available occurrence data on the precursors of Δ9‐THC and other cannabinoids in food, together with information on their co‐occurrence with Δ9‐THC, would be appropriate.
Terms of Reference
In accordance with Art. 31 (1) of Regulation (EC) No 178/2002 the Commission asks EFSA for an acute dietary exposure assessment to Δ9‐tetrahydrocannabinol (Δ9‐THC) hereby taking into account:
- occurrence data available in the EFSA database;
- the updated comprehensive food consumption database.
In addition, EFSA is requested to provide an overview of the available occurrence data on the precursors of Δ9‐THC and other cannabinoids in food together with information on their co‐occurrence with Δ9‐THC.
Previous exposure assessments to Δ9‐THC
BfR Opinion No 034/2018
Based on the fact that various hemp‐containing foods are available on the market, in 2018, The German Federal Institute for Risk Assessment (BfR, 2018) has assessed the risk of psychogenic and pharmacological effects for all population groups, including children, through the consumption of hemp‐containing foods containing customary levels of THC. The BfR concluded that the consumption of hemp‐containing foods can lead to an exceedance of the ARfD of 1 μg/kg bw established by EFSA (2015). In the view of the BfR ‘It is possible, that doses of ∆9‐THC which lie within the range of medically used doses of ≥ 2.5 mg per person and day are ingested through the consumption of hemp‐containing foods. Pharmacological effects must therefore be expected in cases of this kind’. Restrictions in the ability to drive or operate a dangerous piece of machinery may result from the consumption of foods containing hemp. This applies in particular to high consumers of products of this kind.
FSANZ
The Food Standards Australia New Zealand (FSANZ) has assessed the dietary exposure to Δ9‐THC and CBD from foods containing low THC hemp seed in 2017 within the “Proposal P1042 for ‘Low THC Hemp Seeds as Food’” to develop a food regulatory measure to permit the sale of food derived from the seeds of low delta 9‐THC varieties of Cannabis sativa (FSANZ, 2017a). The chronic exposure assessment is included in the supporting document ‘Updated estimates of dietary exposure to 9‐tetrahydrocannabinol (THC) and cannabidiol (CBD) from foods containing low THC hemp seed (at Approval) – Proposal P1042 – Low THC Hemp Seeds as Food’ (FSANZ, 2017b). FSANZ calculated the potential exposure to THC assuming levels equal to the proposed maximum levels (ML) for THC in low THC hemp seed foods. Estimates were compared to a TDI for THC of 6 μg/kg bw in order to assess if the MLs previously proposed for THC are sufficiently protective of consumers. Previous dietary exposure estimates for Australia and New Zealand were updated to incorporate more current national nutrition survey data. The updated dietary exposure assessment confirmed that using the most up‐to‐date available food consumption data, no Australian and New Zealand population groups examined would exceed the TDI for THC at the mean and 90th percentile of estimated dietary exposure. Chronic dietary exposure estimates ranged between 5 and 26% of the TDI of 6 μg/kg bw. FSANZ also highlighted that the dietary exposure to THC was lower than that reported previously, likely because of changes in food consumption patterns. FSANZ exposure estimates were based on conservative assumptions and were postulated to be overestimates.
Data and methodology
Data collection and validation
Occurrence data in food for Δ9‐THC and related compounds were gathered by EFSA within the call for continuous collection of chemical contaminants occurrence data in food and feed that is issued from May until October every year. In order to generate more occurrence data, the European Commission adopted Recommendation 2016/21154 on the monitoring of the presence of Δ9‐THC, its precursors and other cannabinoids in food and data related to this Recommendation were also submitted within the annual data collection.5 European national authorities and similar bodies, research institutions, academia, food business operators and other stakeholders were invited to submit analytical data on THC and cannabinoids.
The data submission followed the requirements of the EFSA Guidance on Standard Sample Description for Food and Feed (EFSA, 2010b); occurrence data were managed following the EFSA standard operational procedures (SOPs) on ‘Data collection and validation’ and on ‘Data analysis of food consumption and occurrence data’.
At the time of the data extraction6 a total of 1,866 analytical results on the occurrence of cannabinoids (Table 1) in food were available in the EFSA database. Most analytical results were submitted on Δ9‐THC, sampling year spanned from 2000 to 2018. Out of 1,866 a total of 272 analytical results were submitted by industry.7
Table 1: Chemical Occurrence Data in the EFSA Chemical Occurrence Database before data cleaninga
| Substance | Abbreviation | Number of samples |
|---|---|---|
| Sum of Tetrahydrocannabinols | 205 | |
| delta‐9‐Tetrahydrocannabinol | Δ9‐THC | 684 |
| delta‐8‐Tetrahydrocannabinol | Δ8‐THC | 191 |
| Cannabidiol | CBD | 249 |
| Cannabinol | CBN | 235 |
| THC and related substances | 2 | |
| delta‐9‐Tetrahydrocannabinolic Acid | Δ9‐THCA | 163 |
| Tetrahydrocannabivarol | 1 | |
| Tetrahydrocannabivarin | 51 | |
| Cannabigerolic acid | 32 | |
| Cannabigerol | 20 | |
| Cannabidiolic acid | 21 | |
| Sum of cannabidiol and cannabidiolic acid | 12 |
a Classification of cannabinoid compounds under the EFSA Terminology for PARAM – European Food Safety Authority. (2019). Harmonized terminology for scientific research [Data set]. Zenodo. https://doi.org/10.5281/zenodo.2554064
Data cleaning and analysis
To ensure an appropriate quality of the data used for the exposure assessment, the initial data set was evaluated by applying several data cleaning and validation steps, in line with the EFSA SOPs.8 Different parameters were carefully checked, including for example, ‘Sampling strategy’, ‘Sampling year’, ‘Sampling country’, ‘Analytical methods’, ‘Reporting unit’, ‘Limit of detection’ and the codification of samples under FoodEx classification. Table A.2 of Annex A reports in detail modifications applied for data cleaning; some of those key points and assumptions are also highlighted below.
During the data cleaning process, special attention was dedicated to the ‘Analytical methods’ used. As described in Section 1, methods based on capillary GC‐FID (as the official method prescribed by EC No 1122/2009) are not able to differentiate the psychoactive Δ9‐THC from its non‐psychoactive precursors, Δ9‐THCA‐A and Δ9‐THCA‐B. Δ9‐THCA undertakes a chemical decarboxylation to Δ9‐THC in the GC injector (Figure 1). In the absence of a preliminary separation step (such as a derivatisation with silanes), GC–MS based methods are thus not specific for Δ9‐THC. In contrast, LC‐based methods are specific for Δ9‐THC. The analytical method used for the sample preparation and analysis therefore dictates the specificity for the results reported for Δ9‐THC.
Having considered the problem of possible misreporting of Δ9‐THC data, all data providers who reported data for Δ9‐THC with an analytical method as ‘not specified’ or ‘unknown’, or GC–MS based, were systematically asked via a written clarification request to provide details on analytics to gain information on specificity. After several clarification requests, it emerged that some of the data reported as Δ9‐THC were not produced with specific methods and it was decided to reclassify them as ‘Sum of delta‐9‐Tetrahydrocannabinol and delta‐9‐Tetrahydrocannabinolic Acid’ (Sum Δ9‐THC/Δ9‐THCA). Moreover, data reported as Δ9‐THC were as well reclassified as ‘Sum of delta‐9‐Tetrahydrocannabinol and delta‐9‐Tetrahydrocannabinolic Acid’ when analytical methods were reported as ‘not specified’, ‘unknown’ or ‘GC–MS based’ and when data providers did not reply to clarification requests.
On the contrary, all the data analysed with LC–MS, LC–MS/MS‐ and LC‐UV‐based methods were considered specific for Δ9‐THC and the classification was kept as ‘pure’Δ9‐THC. Data providers were also asked to give details on the actual identity of occurrence reported as ‘Sum of Tetrahydrocannabinols’ and when possible, a reclassification was performed as Sum Δ9‐THC/Δ9‐THCA.
An accurate check of the food matrix classification was performed, and re‐classification operated in several cases in light of open text food description (‘Prodtext’) or following clarification requests. In general, all products reported in the current report and in the EFSA database were assumed to be intended to be consumed as food. Among others, food samples reported under category ‘Vegetables and vegetable products (including fungi)’, ‘leafy vegetables’ and ‘Other foods (foods which cannot be included in any other group)’ related to hemp flowers (reported as for instance ‘inflorescence’ or ‘cannabis bloom’) were reclassified as ‘Tea and herbs for infusions (Solid)’ in the FoodEx classification system. One sample reported under the category ‘Animal Fat’ was a ghee sample specified by the data provider to be ‘clarified butter containing 95% anhydrous butter fat and Herba hemp min 5%’. Four samples classified as oilseeds with no specific mention to C. sativa, were not merged with cannabis oil or seeds, since the THC levels were over 8,000 and 2,000 times, respectively, lower than the content in oil and seeds.
Sampling country was also considered during data cleaning; industry reported five analytical results related to samples collected in Canada. Those data were eliminated since they were assumed not to be relevant for the EU market.
During data cleaning, attention was given to the reported limits of detection (LODs) and limits of quantification (LOQs) in relation to the food matrix. High LOQs can affect the quality of the data used for exposure assessment, especially when a large number of left‐censored values are reported in certain food categories. Analytical methods used for the determination of cannabinoids in food were mostly GC–MS or LC–MS based; for three analytical results, a GC‐FID‐based method with a LOQ of 100,000 μg/kg was reported for Δ9‐THC, and these records were excluded from the analysis. In the case of ‘pure’Δ9‐THC, a large variability in the reported LOQs was found with LOQs ranging from 0.004 to 6,000 μg/kg, depending on the analytical platform and the food matrix. However, the LOQ of 6,000 μg/kg for ‘pure’Δ9‐THC was reported for ‘HPLC with standard detection methods’ used for the analysis of two Austrian samples classified as ‘pastry and cakes’, which were deleted from the data set since they were flagged as suspect samples. The quality criteria detailed in the EFSA guideline (EFSA, 2018) on the ‘Use of LOQ cut‐off values for dietary exposure to chemical contaminants’ was used to define cut‐off values for Sum Δ9‐THC/Δ9‐THCA and for ‘pure’Δ9‐THC. A cut‐off value of 5,000 μg/kg was applied on hemp oil both for Sum Δ9‐THC/Δ9‐THCA and for ‘pure’Δ9‐THC. This was based on the guidance value of 5 mg/kg for total Δ9‐THC in use in Germany (BgVV 07/2000),9 since EU maximum levels are currently not defined. Based on this cut‐off, 17 analytical results for ‘pure’Δ9‐THC related to the category ‘hemp oil’ (of which 16 were left‐censored) with LOQs of 5,000 μg/kg were eliminated. In addition, the difference between the average LB/UB concentrations vs. the expected expanded uncertainty was evaluated for all food groups (at the level 2 of FoodEx1) presenting a number of samples greater than 5. Based on this analysis, the maximum LOQ reported of 3,000 μg/kg was used as a cut‐off value on ‘pure’Δ9‐THC for the category ‘hemp seeds’. This LOQ was much higher than the rest of the LOQs associated with this type of matrix for ‘pure’Δ9‐THC (a median LOQ of 50 μg Δ9‐THC/kg and P75 of 100 μg/kg). Consequently, nine samples (of which eight were left‐censored) were excluded. In all other food categories, LOQs varied between 0.017 and 300 μg/kg; therefore, no further cut‐offs were considered.
A max LOQ of 30,000 μg/kg was reported for Sum Δ9‐THC/Δ9‐THCA and this was associated with one quantified sample of ‘Tea and herbs for infusions (Solid)’ having a measured value as high as 140,500 μg/kg. Therefore, the method was fit‐for‐purpose. For other analysed substances, the median LOQ ranged from 0.004 up to 100 μg/kg. A very high LOQ of 170,000 μg/kg was reported for CBD but was associated with a positive sample of ‘Biscuits (cookies)’ having a concentration of 300,000 μg/kg.
Attention was paid to data reported as suspect samples. Summary statistics for the suspect samples deleted is reported in Annex A (Table A.3). Most of the suspect samples were reported for Sum Δ9‐THC/Δ9‐THCA and on a variety of foods, most of them sampled in Germany. The highest values were reported on a sample classified as ‘Tea and herbs for infusions (Solid)’ reported with a content of CBD and delta‐9‐THC of 1,670,000 and 200,000 μg/kg, respectively. As they may lead to an overestimation of the contamination levels, results reported as ‘Suspect sampling’ (n = 29) were excluded from further analysis.
The left‐censored data (results below LOD or LOQ) were treated by the substitution method as recommended in the ‘Principles and Methods for the Risk Assessment of Chemicals in Food’) (WHO/IPCS, 2009). The same method is indicated in the EFSA scientific report ‘Management of left‐censored data in dietary exposure assessment of chemical substances’ (EFSA, 2010a). The guidance suggests that the LB and UB approach should be used for chemicals likely to be present in the food (e.g. naturally occurring contaminants and nutrients). The LB is obtained by assigning a value of zero (minimum possible value) to all samples reported as lower than the LOD (< LOD) or LOQ (< LOQ). The UB is obtained by assigning the numerical value of LOD to values reported as < LOD and LOQ to values reported as < LOQ (maximum possible value), depending on whether LOD or LOQ is reported by the laboratory. The outcome of the data analysis is presented in Section 2.
Consumption data
The EFSA Comprehensive European Food Consumption Database (Comprehensive Database) provides a compilation of national information on food consumption at individual level. Details on how the Comprehensive Database is used are published in the Guidance of EFSA (EFSA, 2011b). The food consumption data gathered by EFSA in the Comprehensive Database are the most complete and detailed data currently available at EU level. The latest version of the Comprehensive Database updated in 2018 contains results from a total of 60 different dietary surveys carried out in 25 different Member States covering 119,458 individuals. The age classes considered are the following:
- Infants: < 12 months old;
- Toddlers: ≥ 12 months to < 36 months old;
- Other children: ≥ 36 months to < 10 years old;
- Adolescents: ≥ 10 years to < 18 years old;
- Adults: ≥ 18 years to < 65 years old;
- Elderly: ≥ 65 years to < 75 years old;
- Very elderly: ≥ 75 years old.
Four additional surveys included in the comprehensive database provide information on specific population groups: ‘Pregnant women’ (15–45 years old for Latvia; 17–46 years for Portugal) and ‘Lactating women’ (28–39 years old for Greece; 18–45 years for Estonia). When for one country and age class two different dietary surveys were available, only the most recent survey was used. Dietary surveys and the number of subjects available for acute exposure assessment to THC (43 surveys from 25 countries) are described in Table A.1 of Annex A. Consumption data were collected using single or repeated 24‐h or 48‐h dietary recalls or dietary records covering from 3 to 7 days per subject. Because of the differences in the methods used for data collection, direct country‐to‐country comparisons are misleading. Detailed information on the different dietary surveys available in the Comprehensive Database can be found on the dedicated page of the EFSA website.10
Food classification
Consumption data were classified according to the FoodEx classification system (EFSA, 2011a). FoodEx is a food classification system developed by EFSA in 2009 with the objective of simplifying the linkage between occurrence and food consumption data when assessing the exposure to hazardous substances. It contains 20 main food categories (first level), which are further divided into subgroups having 140 items at the second level, 1,261 items at the third level and reaching about 1,800 endpoints (food names or generic food names) at the fourth level. For the purpose of this assessment, the category ‘Hemp seed (Cannabis sativa)’ was further specified with the addition of three subcategories hemp seeds, hemp oil and hemp flour that were used for three independent exposure assessments.
Acute dietary exposure assessment methodology11
Acute exposure to total‐Δ9‐THC (Tot‐Δ9‐THC) for consuming days was estimated by matching food consumption data with occurrence data using 12 scenarios based on proxies of consumption of hemp and hemp‐based products (Table 2).
Table 2: Linkage table to match food consumption and occurrence data and assumptions made
| Scenario | Occurrence ‐ Food category | Consumption category used as proxy | Assumptions |
|---|---|---|---|
| Seed Oil | Hemp oil | Seed oils | The consumption of ‘Seed oils’ was used as a proxy of consumption of ‘hemp oil’ |
| Seeds | Hemp seeds | Oil seeds | The consumption of ‘oil seeds’ excluding ‘soya beans and similar’ and ‘peanut and similar’ was used as a proxy of consumption of ‘hemp seeds’ |
| Bread and rolls | Bread and rolls | Bread and rolls | |
| Bread and rolls from hemp flour | Hemp flour | Bread and rolls | Hemp flour was assumed to represent 25% of the content of flour present in bread and rolls (that is 70% according to the raw primary commodity (RPC) model (EFSA, 2019) |
| Pasta (Raw) | Pasta (Raw) | Pasta (Raw) | |
| Breakfast cereals | Breakfast cereals | Breakfast cereals | |
| Cereal bars | Cereal bars | Cereal bars | In the category cereal bars, one ‘snack bar sample made of resins, dates, sunflower oil and hemp seeds’ was included assuming a similar consumption pattern. The same applied to 4 more samples classified as snack food and specified to be bars |
| Fine bakery wares | Fine bakery wares | Fine bakery wares | |
| Chocolate (Cocoa) products | Chocolate (Cocoa) products | Chocolate (Cocoa) products | |
| Energy Drinks | Non‐alcoholic beverages (excluding milk‐ based beverages) | Energy Drinks | The consumption of ‘Energy Drinks’ was used as a proxy of category ‘Non‐alcoholic beverages (excluding milk‐ based beverages)’ |
| Tea (Infusion) | ‘Tea and herbs for infusions (Solid)’ | Tea (Infusion) | Samples classified as ‘Tea and herbs for infusions (Solid)’ were upon application of a dilution factor of 75 derived from the EFSA report on ‘harmonisation of dilution factorsa to be used in the assessment of dietary exposure’ reclassified under category ‘Tea infusions’ |
| Tea (Infusion) | |||
| Beer and beer‐like beverages | Beer and beer‐like beverages | Beer and beer‐like beverages | |
| Dietary supplements | Dietary supplements | Dietary supplements |
a Internal report on the harmonisation of dilution factors to be used in the assessment of dietary exposure, available at https://zenodo.org/record/1256085#.Xbf2MehKiUk
Given the limited amount of data on specific consumption of hemp and hemp‐based products in the EFSA comprehensive database, proxies based on ‘standard’ food categories were used to calculate acute dietary exposure for some specific food groups under scenarios. Food categories used for exposure assessment were derived from Level 2 of the FoodEx1 classification with some adjustments as described in Table 2 (more specific matches can be found in Table B.1 of Annex B).
As an example, for scenario seed oil, the individual food consumption data from different European population groups were extracted from the EFSA Comprehensive Database for the category ‘Seed oil’ (FoodEx1) and used as a proxy for consumption of ‘hemp oil’. Then occurrence data for ‘hemp oil’ were combined to individual consumption data for ‘seed oils’ and subcategories (such as Rape seed oil, Soya bean oil, refined Maize oil) and used to calculate exposure as described below.
In the case of scenario ‘Seeds’: the occurrence data on hemp seeds were matched to ‘oil seeds’ excluding ‘soya beans and similar’ and ‘peanut and similar’ as a proxy of consumption.
In the category ‘cereal bars’, one ‘snack bar sample made of resins, dates, sunflower oil and hemp seeds’ was included assuming a similar consumption pattern as well as four more samples classified as ‘snack food’ and specified to be bars.
In the category ‘Bread and Rolls’, two independent acute exposure assessments were calculated: one based on the 14 samples reported in this category (reported as ‘Bread and rolls’) and the other based on the 49 samples reported on hemp flour (reported as ‘Bread and rolls from hemp flour’). To do so, it was assumed that 25% of flour (disaggregation into primary ingredients according to the raw primary commodity (RPC) model (EFSA, 2019) was made of hemp flour (FSANZ, 2017b); therefore, assuming a 100% carry‐over of Δ9‐THC, the content of Tot‐Δ9‐THC in bread and rolls was calculated (Annex B.1).
In category ‘Non‐alcoholic beverages (excepting milk‐based beverages)’, 25 samples were reported; from Prodtext samples were detailed to be mostly drink with hemp; since no further specification was provided, it was assumed those drinks to be comparable to energy drinks and therefore the named FoodEx 2 category was used as a proxy of consumption.
The use of consumption data of ‘standard’ food categories as a proxy for hemp‐based products seems more relevant for adolescents and adults population groups but the consumption of hemp based products cannot be excluded for ‘toddlers’ and ‘other children’. Exposure was therefore assessed and presented for all age groups, with the only exclusion being ‘infants’.
Average and high (P95) exposure were calculated for different countries and population groups, when the number of consumption days was sufficient to allow the calculation of reliable statistics (i.e. at least 60 days for the P95).
Acute exposure was assessed independently for each food category; the consumption amount for consuming days (standardised by the individual’s body weight) was multiplied with occurrence statistics for Tot‐Δ9‐THC up to the highest reliable percentile (i.e. P50, P75, P90 and P95). The reliability of high percentiles is related to the number of observations (subjects/consumers or samples) used to calculate them. Percentiles calculated on a limited number of observations should be treated with caution as the results may not be statistically robust. A clear indication concerning the minimum number of observations necessary to estimate a given percentile cannot be found in the literature. Different options can be used, none of them being a widely accepted standard. The non‐parametric method proposed by EFSA (2011b) was used to establish the minimum number of subjects for which percentiles can be considered as reliable and consequently used in the assessment of exposure (Table 3). Food consumption statistics or occurrence data with less than 5 subjects/observations should not be used for the assessment of exposure unless no other information is available (EFSA, 2011b).
Table 3: Highest reliable percentile based on the minimum number of subjects/samples
| Minimum number of observations (subjects/samples) | Highest reliable percentile |
|---|---|
| 5 | 50th percentile |
| 12 | 75th percentile |
| 30 | 90th percentile |
| 61 | 95th percentile |
| 181 | 97.5th percentile |
| 299 | 99th percentile |
Exposure scenarios were only calculated for food categories having a number of observations equal to or higher than 5 and/or a sufficient number of non‐left‐censored data. Exposure was estimated using both the LB and UB approach. Analyses were carried out using the SAS Statistical Software (SAS enterprise guide 9.4).
Assessment
Occurrence data on Δ9‐THC and other cannabinoids in food
Data collection summary
By the end of December 2018, an initial data set of 1,866 analytical results on cannabinoids in food was available in the EFSA database. Out of them 272 were submitted by industry and the rest from national authorities.
After a careful data cleaning procedure (Section 1.4.2 Data cleaning and analysis), a total of 1,547 analytical results were available in the final data set for ‘pure’Δ9‐THC and other cannabinoids. Of these occurrence data, 1,303 were submitted by national organisations and 244 by industry12 as shown in Tables 4 and 5, respectively. Most of the data available in the final data set were on ‘pure’Δ9‐THC,13 on Sum Δ9–THC/Δ9‐THCA, on cannabidiol and cannabinol.
Table 4: Number of analytical results on chemical occurrence after data cleaning in relation to sampling country, as submitted by governmental organisations
| Substance | Total | Austria | Belgium | Switzerland | Czech Republic | Germany | France | Croatia | Italy | Luxembourg | Netherlands |
|---|---|---|---|---|---|---|---|---|---|---|---|
| ‘pure’Δ9‐THC& | 344 | 7 | . | 133 | 55 | 42 | 16 | . | 55 | 15 | 21 |
| Δ9‐THCA | 73 | . | . | . | 32 | . | . | . | 20 | . | 21 |
| Sum Δ9‐THC/Δ9‐THCA$ | 237 | . | 44 | . | . | 156 | . | 37 | . | . | . |
| delta‐8‐Tetrahydrocannabinol | 137 | . | . | . | 59 | 7 | 16 | . | 55 | . | . |
| Cannabidiol | 208 | 2 | . | . | 56 | 42 | 16 | . | 56 | 15 | 21 |
| Cannabinol | 165 | . | . | . | 32 | 44 | 16 | . | 37 | 15 | 21 |
| THC and related substances | 2 | 2 | . | . | . | . | . | . | . | . | . |
| Tetrahydrocannabivarol | 1 | . | . | . | 1 | . | . | . | . | . | . |
| Tetrahydrocannabivarin | 51 | . | . | . | 29 | . | . | . | 22 | . | . |
| Cannabigerolic acid | 32 | . | . | . | 12 | . | . | . | 20 | . | . |
| Cannabigerol | 20 | . | . | . | . | . | . | . | 20 | . | . |
| Cannabidiolic acid | 21 | . | . | . | . | . | . | . | 21 | . | . |
| Sum of cannabidiol and cannabidiolic acid | 12 | . | . | . | 12 | . | . | . | . | . | . |
| Total | 1,303 | 11 | 44 | 133 | 288 | 291 | 64 | 37 | 306 | 45 | 84 |
& Based on LC‐based methods.
$ Analysed either by GC‐based methods or unknown methods.
Table 5: Number of analytical results on chemical occurrence after data cleaning in relation to sampling country, as submitted by industry
| Substance | Total | Germany | Romania |
|---|---|---|---|
| ‘pure’Δ9‐THC& | 83 | 57 | 26 |
| Δ9‐THCA | 80 | 55 | 25 |
| Sum of Tetrahydrocannabinols | 81 | 55 | 26 |
| Total | 244 | 167 | 77 |
& Based on LC‐ based methods.
All data were reported in whole weight. Recovery was not reported in most of the cases, but when reported varied between 92% and 123%. Samples were collected from 2000 to 2018, with most of the samples collected from 2016 onward. Details of sample collection are reported in Table A.4 of Annex A). When considering sampling country (Table 4), most of the analytical results reported from governmental organisations were from samples coming from Germany, Italy and the Czech Republic; industry reported samples from Germany and Romania as shown in Table 5.
Occurrence data by food category
Most of the results were reported in the category ‘Oilseeds’ (according to level 2 of FoodEx1 classification) (Figure 2). A full description of the number of samples, per food category and percentage of left‐censored data per substance in food for all the food categories can be found in A.5 of Annex A. Within ‘Oilseeds’, most of the results were reported for ‘Hemp seed (Cannabis sativa)’, and in particular for seeds (n = 354), oil (n = 235) and flour (n = 143).
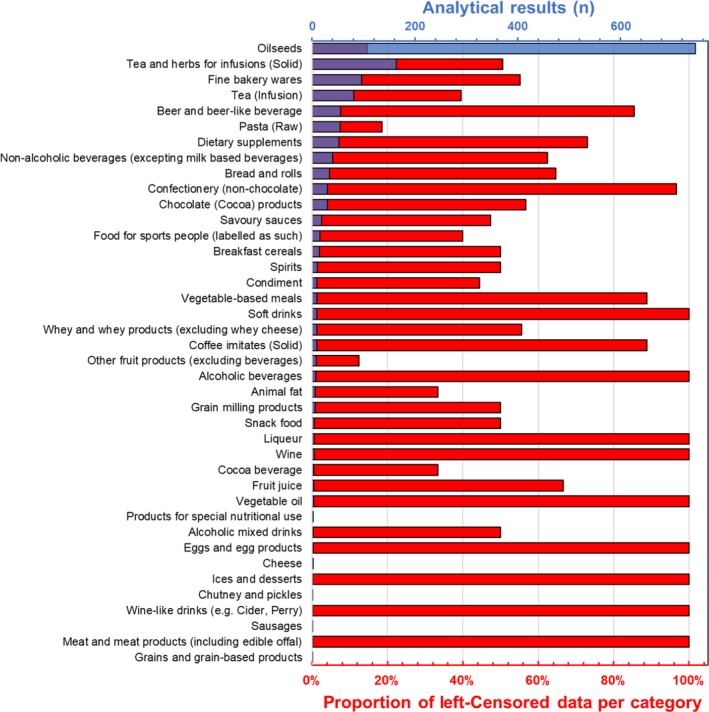
Other well represented categories were ‘Tea and herbs for infusions (Solid)’ (n = 164), ‘Fine bakery wares’ (n = 96), Tea (Infusion) (n = 81) and Beer and beer‐like beverages (n = 55), although the last had a large number of left‐censored results.
For ‘pure’Δ9‐THC, a limited number of analytical results, mostly left censored, were reported for the categories ‘Bread and rolls’, ‘Confectionery (non‐chocolate)’, ‘Wine’, ‘Soft drinks’, ‘Fruit juice’, ‘Liqueur’, ‘Vegetable oil’, ‘Alcoholic beverages’, ‘Coffee imitates (Solid)’, ‘Ices and desserts’, ‘Meat and meat products (including edible offal)’; for Sum Δ9‐THC/Δ9‐THCA, a limited number of analytical results, mostly left censored, were reported for the categories (level 4) ‘Carbohydrate‐electrolyte solutions for sports people’, ‘Soft drinks’, ‘Beer and beer‐like beverages’, ‘Beer, regular’, ‘Marzipan’, ‘Multigrain bread’, ‘Wine‐like drinks (e.g. Cider, Perry)’.
Analytical methods
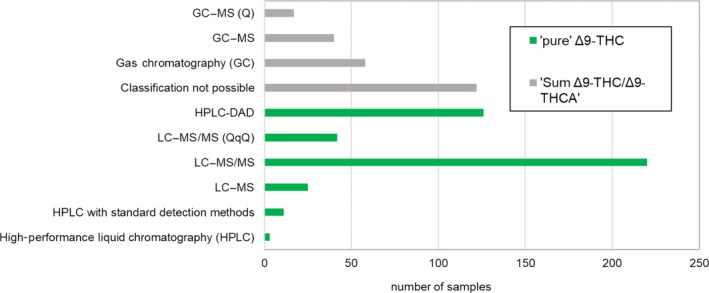
Analytical methods used for the determination of cannabinoids in food were mostly GC or LC‐MS based. As described in Section 1.4.2, data submitted under category Δ9‐THC were carefully reclassified into ‘pure’Δ9‐THC or Sum Δ9‐THC/Δ9‐THCA after acquiring or deriving information on method specificity. Therefore, all ‘pure’Δ9‐THC results (n = 427) present in the clean occurrence data set, were based on LC‐based methods and therefore specific, while the ones classified as Sum Δ9‐THC/Δ9‐THCA (n = 237) were analysed either by GC‐based methods or unknown methods (Figure 3).
The descriptive statistics of LODs and LOQs for all the analytes in the clean database according to analytical method can be found in Table A.6 (of Annex A). For ‘pure’Δ9‐THC, median LOQs ranged from 0.5 to 260 μg/kg depending on analytical platform; the median LOQ reported for ‘pure’Δ9‐THC and HPLC‐DAD (diode‐array detector) was 200 μg/kg, which in line with the published data (125–250 ng/mL) for the same method in a range of cannabinoids (De Backer et al., 2009). Median LOQs for ‘pure’Δ9‐THC were as low as 0.2 and 2 μg/kg for LC–MS and LC–MS/MS. Median LOQs for Sum Δ9‐THC/Δ9‐THCA ranged from 2 to 300 μg/kg depending on the method (as in Table A.6 of Annex A).
LOQs and LODs also varied in relation to food matrices. A detailed description for all the analytes can be found in Table A.7 of Annex A, while summary statistics on selected food groups (having more than 5 analytical results) can be found in Table 6.
Table 6: Distribution of the reported LOQs (μg/kg) in the analysis of delta‐9‐Tetrahydrocannabinol (‘pure’Δ9‐THC) and Sum of delta‐9‐Tetrahydrocannabinol and delta‐9‐Tetrahydrocannabinolic Acid (Sum Δ9‐THC/Δ9‐THCA) in selected food commodities after applying the LOQ cut‐offs
| ‘pure’Δ9‐THC | |||||||
|---|---|---|---|---|---|---|---|
| Food* | n | Left‐censored | Min | P25 | P50 | P75 | Max |
| Bread and rolls | 9 | 100% | 17 | 200 | 250 | ||
| Pasta (Raw) | 17 | 76% | 17 | 20 | 200 | 200 | 270 |
| Breakfast cereals | 6 | 50% | 0.5 | 10 | 200 | ||
| Fine bakery wares | 22 | 45% | 1 | 2 | 10 | 10 | 930 |
| Tea and herbs for infusions (Solid) | 30 | 40% | 0.004 | 0.1 | 0.3 | 2 | 20 |
| Oilseeds (hemp flour) | 36 | 8% | 0.5 | 2 | 100 | 100 | 200 |
| Oilseeds (hemp oil) | 55 | 4% | 0.5 | 100 | 100 | 100 | 1000 |
| Oilseeds (hemp seeds) | 90 | 13% | 0.017 | 6 | 50 | 100 | 150 |
| Chocolate (Cocoa) products | 13 | 69% | 0.5 | 13.5 | 200 | 200 | 1000 |
| Confectionery (non‐chocolate) | 8 | 100% | 2 | 10 | 100 | ||
| Tea (Infusion) | 60 | 30% | 50 | 200 | 200 | 200 | 900 |
| Beer and beer‐like beverages | 22 | 77% | 0.017 | 1 | 17 | 200 | 200 |
| Spirits | 8 | 50% | 1 | 1 | 200 | ||
| Dietary supplements | 10 | 0 | 0.1 | 55 | 200 | ||
| Sum Δ9‐THC/Δ9‐THCA | |||||||
| Food* | n | Left‐censored | Min | P25 | P50 | P75 | Max |
| Grain milling products | 6 | 50% | 1 | 150 | 150 | ||
| Tea and herbs for infusions (Solid) | 15 | 13% | 2 | 2 | 5,100 | 10,000 | 30,000 |
| Oilseeds (hemp flour) | 13 | 15% | 100 | 150 | 225 | 300 | 1000 |
| Oilseeds (hemp oil) | 70 | 27% | 0.4 | 300 | 1010 | 1250 | 2630 |
| Oilseeds (hemp seeds) | 37 | 16% | 0.2 | 15 | 150 | 300 | 300 |
| Chocolate (Cocoa) products | 6 | 33% | 15 | 150 | 200 | ||
| Non‐alcoholic beverages (excepting milk based beverages) | 20 | 60% | 0.2 | 0.91 | 1.5 | 2.63 | 2.63 |
| Tea (Infusion) | 14 | 71% | 0.2 | 0.91 | 1 | 2.5 | 300 |
| Beer and beer‐like beverages | 8 | 75% | 0.29 | 1 | 2 | ||
| Dietary supplements | 16 | 0 | 1 | 25 | 125 | 150 | 150 |
| Food for sports people (labelled as such) | 9 | 89% | 0.91 | 0.91 | 2.5 | ||
LOQ: limit of quantification; P25: 25th percentile; P50: 50th percentile; P75: 75th percentile.
* Categories based on level 2 of FoodEx 1 classification system with some refinements for oilseeds category.
The max LOQ of 30,000 μg/kg reported for ‘Sum Δ9‐THC/Δ9‐THCA’ was already discussed in Section 1.4.2. Moreover, although for the category ‘Sum Δ9‐THC/Δ9‐THCA’ an LOQ as high as 10,000 μg/kg was reported in the category ‘Tea and herbs for infusions (Solid)’, four of the five pertained samples were quantified and not reported as suspect samples.
Δ9‐THC and other cannabinoids in hemp (‘Cannabis sativa’) seeds, oil and flour
After data cleaning, a total of 733 results on hemp ‘Cannabis sativa’ were in the database on different substances. Data were on hemp seeds, hemp oil and on hemp flour. Data reported as ‘Sum of Tetrahydrocannabinols’, ‘Sum of cannabidiol and cannabidiolic acid’ and on ‘THC and related substances’ do not provide information on occurrence of single cannabinoids in food and therefore were not used for considerations on occurrence and co‐occurrence of cannabinoids in hemp. Therefore they are not described further in the present report.
A final data set of 650 analytical results on hemp ‘Cannabis sativa’ was then available (Table A.8 of Annex A). Out of them, 163 analytical results were submitted by industry and 487 by governmental organisations. A large part of the results were reported on Δ9‐THC (n = 181) and on Sum Δ9‐THC/Δ9‐THCA (n = 121) followed by Δ9‐THCA (n = 109), CBD (n = 91), CBN (n = 86), and Δ8‐THC (n = 34). Less than 10 results for category hemp ‘Cannabis sativa’ were reported for cannabindiolic acid, cannabigerol, cannabigerolic acid and tetrahydrocannabivarin.
Table 7 shows a focus on ‘pure’Δ9‐THC in hemp, based on different matrices (oil, flour and seeds).
Table 7: Descriptive statistics of occurrence of ‘pure’Δ9‐THC in hemp ‘Cannabis sativa’ in relation to data provider (μg/kg)
| Processing | Data provider | Scenario | N | LC | P25 | P50 | P75 | P90 | P95 | Max |
|---|---|---|---|---|---|---|---|---|---|---|
| Flour | Governmental | UB | 21 | 10% | 331 | 443 | 960 | 4,380 | 1,0000 | 11,300 |
| Industry | UB | 15 | 7% | 190 | 470 | 950 | 1,010 | 1,390 | 1,390 | |
| Governmental | LB | 21 | 10% | 331 | 443 | 960 | 4,380 | 10,000 | 11,300 | |
| Industry | LB | 15 | 7% | 190 | 470 | 950 | 1,010 | 1,390 | 1,390 | |
| Oil | Governmental | UB | 23 | 9% | 1,000 | 1,881 | 13,000 | 28,000 | 30,000 | 33,000 |
| Industry | UB | 32 | 0% | 1,205 | 1,540 | 2,360 | 3,140 | 3,440 | 4,100 | |
| Governmental | LB | 23 | 9% | 1,000 | 1,881 | 13,000 | 28,000 | 30,000 | 33,000 | |
| Industry | LB | 32 | 0% | 1,205 | 1,540 | 2,360 | 3,140 | 3,440 | 4,100 | |
| Seeds | Governmental | UB | 54 | 11% | 150 | 470 | 1,100 | 3,960 | 13,000 | 26,7000 |
| Industry | UB | 36 | 17% | 110 | 222 | 525 | 980 | 2,280 | 2,510 | |
| Governmental | LB | 54 | 11% | 98 | 470 | 1,100 | 3,960 | 13,000 | 26,7000 | |
| Industry | LB | 36 | 17% | 110 | 222 | 525 | 980 | 2,280 | 2,510 |
LB: lower bound; UB: upper bound; P25: 25th percentile; P50: 50th percentile; P75: 75th percentile; P90: 90th percentile; P95: 95th percentile.
In both data sets, a minor amount of left‐censored data was reported. Some higher values were reported in the governmental data set compared to the ones submitted by industry for the three matrices; nevertheless, the median values of the two groups did not differ much. The content of ‘pure’Δ9‐THC reported in the governmental high samples is biologically plausible. For hemp seeds, for instance, the P95 of Δ9‐THC was 13 mg/kg which is higher but compatible with the one of 7.4 mg/kg reported and used by BfR in its risk assessment (BfR, 2018). The maximum ‘pure’Δ9‐THC content reported for hemp seeds in the EFSA database was 267 mg/kg, that is, in the same order of magnitude as compared to the one reported by the BfR (105 mg/kg). This sample was not considered as an outlier to be excluded since: (i) it was not suspect, (ii) it was analysed with a suitable method (LC–MS), (iii) it was reported and sampled in 2018 in the Czech Republic (from a manufacturing site) and (iv): the second highest hemp seeds sample (with a content of 241 mg/kg) was reported by the same data provider and was coming from the same manufacturer. Samples of seeds with high ‘pure’Δ9‐THC content were also sampled in Luxembourg; the sampling site was retail and seeds were from organic production. The ‘pure’Δ9‐THC contents in these seeds samples were 13 and 12.5 mg/kg, respectively. All of these hemp seeds with higher ‘pure’Δ9‐THC content appeared to be plausible as on the EU market in different EU countries. For hemp oil, two samples from Switzerland with a high content of ‘pure’Δ9‐THC were reported, with a content of 33 and 30 mg/kg. These values appeared quite low compared to the maximum reported in the BfR report (BfR, 2018) of 232.8 mg/kg and were therefore also not excluded. Two samples with high content of ‘pure’Δ9‐THC were also present in the category hemp flour (11.3 and 10 mg/kg) sampled in 2015 in a retail point in Luxembourg, samples being analysed with LC–MS with a LOQ of 0.5 μg/kg. Levels found in samples appeared to be plausible and were thus considered to be available/marketed in several EU countries.
The median ‘pure’Δ9‐THC concentration in hemp flour was 443 vs. 470 μg/kg in governmental and industrial samples, respectively. The median ‘pure’Δ9‐THC content in hemp oil reported by governmental organisations was 1,881 μg/kg vs. 1,540 μg/kg reported by industry. Finally, median ‘pure’Δ9‐THC content in seeds was 470 vs. 222 μg/kg for, respectively, the governmental and the industry data. For all the above‐mentioned statistics, LB estimates were equal to the UB as in Table 7.
Considering all the mentioned factors and the limited amount of data on occurrence of Δ9‐THC, it was decided to merge the data provided by industry and governmental organisations.
For the Sum Δ9‐THC/Δ9‐THCA results from 60 hemp oil samples were provided with a median content of 1,410 and 2,000 μg/kg (LB–UB). The maximum was 232.8 mg/kg, provided by Germany and also quoted in the BfR report (BfR, 2018). Very little data (less than 4 observations) in the category hemp (Cannabis sativa) were reported for tetrahydrocannabivarin, cannabigerolic acid, cannabigerol, cannabidiolic acid and tetrahydrocannabivarin.
For CBD, 54 hemp seeds samples were reported (6% left censored) with a median content of 94 and 107 μg/kg (LB–UB) and a mean of 23,804 and 123,807 μg/kg (LB–UB), showing a positively skewed distribution. The highest content of CBD in hemp seeds (4,447,000 μg/kg) was reported in a sample from CZ sampled in 2018. Twenty analytical results for CBD were reported in hemp flour (5% left censored) with a median of 2,610 (LB = UB) μg/kg. The maximum reported in this category was 83,410 μg/kg from Italy and sampled in 2017. Only 17 results of CBD were reported for hemp oil (6% left‐censored), with a median CBD content of 5,900 (LB = UB) μg/kg and a maximum of 75,000 μg/kg reported and originating from Italy. Further descriptive statistics on other cannabinoids in hemp (Cannabis sativa) can be found in Table A.8.
Occurrence data in food other than hemp seeds, oil and flour
Upon exclusion of data on ‘Sum of Tetrahydrocannabinols’, ‘Sum of cannabidiol and cannabidiolic acid’ and ‘THC and related substances’, 789 analytical results for categories different from ‘hemp seeds (Cannabis sativa)’ were present in the database (Table A.8 of Annex B).
When considering data reported for ‘pure’Δ9‐THC and ‘Sum Δ9‐THC/Δ9‐THCA’, most of the samples were reported in the category ‘Tea (Infusion)’ (n = 60) and ‘Tea and herbs for infusions (Solid)’ (n = 30). For ‘pure’Δ9‐THC, respectively, 30% and 40% of these data were left‐censored. The mean ‘pure’Δ9‐THC content was 2,121–2,159 (LB–UB) μg/kg for ‘Tea (Infusion)’and 82,905–82,908 (LB–UB) μg/kg for the ‘Sum Δ9‐THC/Δ9‐THCA’. Twenty‐two samples reported for ‘Beer and beer‐like beverages’ were mainly left‐censored (77%), with a mean ‘pure’Δ9‐THC content of 261–303 (LB–UB) μg/kg. Twenty‐two samples in the category ‘Fine bakery wares’ (45% left censored) were reported with a mean ‘pure’Δ9‐THC content of 12,048 and 12,144 (LB–UB) μg/kg. Twenty samples of ‘Non‐alcoholic beverages (excluding milk‐based beverages)’ (60% left‐censored) were reported with a mean content for the ‘Sum Δ9‐THC/Δ9‐THCA’ of 7 and 8 (LB–UB) μg/kg. The ‘Sum Δ9‐THC/Δ9‐THCA’ was also reported for 16 samples of ‘dietary supplements’ (0% left‐censored) with a mean content of 4,567 (LB = UB) μg/kg. More details on other food categories can be found in Annex B‐Table A.8. Among others, only very few results on samples of animal origin were reported including 2 samples of ‘Cheese’ for ‘pure’Δ9‐THC with a content of 300 (LB = UB) μg/kg. One sample in the category ‘Animal fat’ that was confirmed to be ‘clarified butter containing 95% anhydrous butter fat with ‘hemp min 5%’ had a content of ‘pure’Δ9‐THC of 6,850 μg/kg.
For the other cannabinoids limited data were available, with only for the category ‘Fine bakery wares’, 10 or more samples being reported for delta‐8‐THC (100% left‐censored), Cannabinol (54% left‐censored), and cannabidiol (5% left‐censored). For the category ‘Tea and herbs for infusions (Solid)’, results on 10 or more samples were reported for delta‐8‐THC (96% left‐censored), delta‐9‐THCA (40% left‐censored), Tetrahydrocannabivarin (90% left‐censored), Cannabinol (71% left‐censored) and Cannabidiol (27% left‐censored).
For cannabidiol, data were reported for 28 Food Categories (other than hemp) with the highest mean values reported for ‘Dietary supplements’, ‘Tea (Infusion)’, ‘Tea and herbs for infusions (Solid)’, ‘Animal fat’ and ‘Fine bakery wares’. More data and details can be found in Table A.8 of Annex A.
Co‐occurrence
In order to explore the co‐occurrence of Δ9‐THC with the main cannabinoids, only results on ‘pure’Δ9‐THC (produced with LC‐based methods) were considered. Two food matrices were considered, because of the larger amount of samples in which several of the analytes were reported: ‘Hemp seeds’ and ‘Tea and herbs for infusions (Solid)’.
Hemp Seeds
After exclusion of data on the Sum Δ9‐THC/Δ9‐THCA, a total of 279 results could be considered on 90 samples of hemp seeds. Co‐occurrence of cannabinoids was explored in pairs and results are shown in Annex A, Table A.10_1, 2 and 3.
When Δ9‐THC was analysed together with either cannabidiol (54 samples), cannabinol (51 samples) or Δ9‐THCA (58 samples), both compounds were quantified in 89%, 90% and 84% of the cases, respectively. Hemp seed samples in which Δ9‐THC was not quantified were rarely positive for cannabinol (4%) and Δ9‐THCA (2%), and never for cannabidiol.
Tea and herbs for infusions (Solid)
After exclusion of data on the Sum Δ9‐THC/Δ9‐THCA, a total of 142 results could be considered in the Category ‘Tea and herbs for infusions (Solid)’ on 30 samples. Co‐occurrence of cannabinoids was explored in pairs and results are shown in Annex A (Tables A.11_1, 2 and 3).
When Δ9‐THC was analysed together with either Cannabidiol (30 samples), Cannabinol (24 samples) and delta‐9‐THCA (10 samples), both of compounds were quantified in 60%, 29% and 40% of the cases, respectively. Results should be taken with care because the number of observations is quite small.
Occurrence data used for exposure assessment to Total‐Δ9‐THC and definition of exposure scenarios
In ‘Hemp (Cannabis sativa)’ the occurrence of Δ9‐THC reported as ‘pure’Δ9‐THC was in the same order of magnitude as the Sum Δ9‐THC/Δ9‐THCA (Annex A.8 of Annex A), in each of the three matrices (seeds, oil, flour). In the case of hemp flour, the mean reported content of ‘pure’Δ9‐THC and Sum Δ9‐THC/Δ9‐THCA was similar (1,220 vs. 1,633 μg/kg at the UB). In the case of hemp oil the mean for ‘pure’Δ9‐THC was lower than the mean for Sum Δ9‐THC/Δ9‐THCA (4,192 vs. 8,100 μg/kg at the UB). For hemp seeds, on the contrary, the ‘pure’Δ9‐THC (n = 90; average 6,514 μg/kg at the UB) was much higher than the content of Sum Δ9‐THC/Δ9‐THCA (n = 37; average = 1,113 μg/kg at the UB). The higher mean values in hemp seeds seem to be determined by a limited number of samples with a high content of Δ9‐THC. Nevertheless, considering the small number of samples per food group, and the fact that no repeated measurements or systematic method comparison was run on the same samples, it is difficult to draw conclusions on the possible overestimation/underestimation of Δ9‐THC in data belonging to the category Sum Δ9‐THC/Δ9‐THCA. In the case of the matrix ‘Tea and herbs for infusions (Solid)’, the mean content at the UB for Sum Δ9‐THC/Δ9‐THCA was 70,516 μg/kg (n = 15) vs. 82,908 μg/kg for ‘pure’Δ9‐THC (n = 30). Therefore, considering the limited number of samples reported for ‘pure’Δ9‐THC and Sum Δ9‐THC/Δ9‐THCA, and the fact that both categories referred (although with a different extent of uncertainty) to Δ9‐THC, it was decided to merge these data into a unique group called Total‐Δ9‐THC (data reported in Annex A, Table A.9).
Occurrence data for Total‐Δ9‐THC (UB in Table 8, LB in Table B.2 Annex B) both at the UB and LB up to the highest reliable percentile (see section 1.4.5, Table 3), were used for exposure assessment in 12 independent scenarios. The selection of scenarios was based on the quality and quantity of data: categories with fully left‐censored occurrence data and if reported amount was less than 5 were not considered for the assessment of exposure.
Table 8: Occurrence data for assessing exposure to Total‐Δ9‐THC across different scenarios (μg/kg) at the UB
| Exposure category | Processing | N | Mean | P50 | P75 | P90 | P95 |
|---|---|---|---|---|---|---|---|
| Hemp | Oil | 125 | 6,381 | 1,890 | 4,260 | 8,800 | 17,000 |
| Hemp | Seeds | 127 | 4,940 | 390 | 880 | 2,400 | 3,960 |
| Bread and rolls | 14 | 103 | 85 | 190 | |||
| Bread and rolls | Bread and rolls from hemp flour | 49 | 233 | 86 | 168 | 597 | |
| Pasta (Raw) | 18 | 495 | 310 | 1,000 | |||
| Breakfast cereals | 7 | 859 | 200 | ||||
| Cereal bars | 5 | 1,410 | 200 | ||||
| Fine bakery wares | 24 | 11,153 | 65 | 776 | |||
| Chocolate (Cocoa) products | 19 | 2,512 | 200 | 400 | |||
| Energy drinks | 25 | 85 | 3 | 15 | |||
| Tea (Infusion)$ | 119 | 1,487 | 140 | 880 | 3,900 | 6,467 | |
| Beer and beer‐like beverages | 30 | 223 | 14 | 100 | 635 | ||
| Dietary supplements | 26 | 313,857 | 1,115 | 19,800 |
UB: upper bound; P50: 50th percentile; P75: 75th percentile; P90: 90th percentile; P95: 95th percentile.
$ Samples classified as ‘Tea and herbs for infusions (Solid)’ were upon application of a dilution factor of 75 derived from the EFSA report on ‘harmonisation of dilution factors to be used in the assessment of dietary exposure’ reclassified and included in category ‘Tea (Infusions)’.
Results of acute dietary exposure assessment to Total‐Δ9‐THC
Acute dietary exposure to Total‐Δ9‐THC is presented here for 12 scenarios, each of them related to different hemp and hemp‐based products. Mean and high (P95) exposure estimates based on different percentiles of occurrence are presented below whereas those based on mean occurrence levels are only reported in Annex B.3 and B.4. As discussed in Sections 1.4.2 and 2.1.4, mean occurrence values were not representative of the occurrence distributions since in most of the cases these were positively skewed.
Scenario on Hemp oil
In the case of ‘Hemp oil’, 125 samples were available and acute exposure was estimated up to the P95 occurrence level. Table 9 describes results at the UB of the exposure assessment to Total‐Δ9‐THC for different population groups across Europe, from ‘Toddlers’ to ‘Very elderly’. Estimates for the LB scenario did not differ much from the UB ones and are reported in Table B.3 of Annex B under Food as ‘seed oil from hemp’. Results of the LB exposure assessment for different European population groups are reported in Table B.4 of Annex B.
Table 9: Summary of exposure to Total‐Δ9‐THC for ‘Hemp oil’ across different population and age groups in Europe (μg/kg bw) at the upper bound
| UB | ||||||||
|---|---|---|---|---|---|---|---|---|
| Population class | Toddlers | Other children | Adolescents | Adults | Elderly | Very elderly | ||
| Mean consumption | Occurrence | Surveys (n) | 15 | 20 | 19 | 22 | 20 | 16 |
| P50 | Min | 0.17 | 0.23 | 0.08 | 0.13 | 0.13 | 0.06 | |
| Max | 1.94 | 2.67 | 1.50 | 1.03 | 1.01 | 1.01 | ||
| P75 | Min | 0.39 | 0.52 | 0.18 | 0.30 | 0.28 | 0.14 | |
| Max | 4.38 | 6.02 | 3.38 | 2.32 | 2.27 | 2.28 | ||
| P90 | Min | 0.80 | 1.07 | 0.38 | 0.61 | 0.59 | 0.29 | |
| Max | 9.04 | 12.44 | 6.98 | 4.79 | 4.68 | 4.72 | ||
| P95 | Min | 1.55 | 2.07 | 0.74 | 1.18 | 1.14 | 0.57 | |
| Max | 17.47 | 24.04 | 13.49 | 9.25 | 9.04 | 9.11 | ||
| High (P95) consumption | Occurrence | Surveys (n) | 8 | 16 | 16 | 21 | 12 | 6 |
| P50 | Min | 0.70 | 0.79 | 0.50 | 0.35 | 0.38 | 0.55 | |
| Max | 4.49 | 6.54 | 3.78 | 2.36 | 2.47 | 2.49 | ||
| P75 | Min | 1.57 | 1.78 | 1.13 | 0.78 | 0.85 | 1.24 | |
| Max | 10.12 | 14.75 | 8.52 | 5.33 | 5.57 | 5.61 | ||
| P90 | Min | 3.25 | 3.67 | 2.33 | 1.62 | 1.76 | 2.57 | |
| Max | 20.90 | 30.46 | 17.60 | 11.00 | 11.51 | 11.58 | ||
| P95 | Min | 6.27 | 7.10 | 4.50 | 3.13 | 3.40 | 4.97 | |
| Max | 40.37 | 58.85 | 34.00 | 21.25 | 22.23 | 22.37 | ||
bw: body weight; P50: 50th percentile; P75: 75th percentile; P90: 90th percentile; P95: 95th percentile.
For the high consumers, at the P95 occurrence level the acute exposure to Total‐Δ9‐THC in adults ranged from 3 to 21 μg/kg bw at the UB and in ‘other children’ from 7 to 59 μg/kg bw. These values are in line with the acute exposure estimates performed by the BfR (BfR, 2018) of 19 μg/kg bw in adults and 50 μg/kg bw in children at the P95 occurrence level.
Scenario on Hemp seeds
In the case of ‘Hemp seeds’, 127 samples were available and acute exposure was estimated up to the P95 occurrence level. Exposure to Total‐Δ9‐THC at the UB for the ‘hemp seeds’ is reported in Table 10 while, also in this case, LB can be found in Table B.3.
Table 10: Summary of exposure to Total‐Δ9‐THC for ‘Hemp seeds’ across different population and age groups in Europe (μg/kg bw) at the upper bound
| UB | ||||||||
|---|---|---|---|---|---|---|---|---|
| Population class | Toddlers | Other children | Adolescents | Adults | Elderly | Very elderly | ||
| MEAN consumption | Occurrence | Surveys (n) | 11 | 19 | 19 | 23 | 19 | 14 |
| P50 | Min | 0.04 | 0.04 | 0.02 | 0.07 | 0.03 | 0.03 | |
| Max | 0.34 | 0.78 | 0.52 | 0.39 | 0.38 | 0.35 | ||
| P75 | Min | 0.09 | 0.09 | 0.04 | 0.17 | 0.06 | 0.08 | |
| Max | 0.76 | 1.77 | 1.17 | 0.88 | 0.86 | 0.79 | ||
| P90 | Min | 0.25 | 0.24 | 0.10 | 0.46 | 0.15 | 0.21 | |
| Max | 2.09 | 4.81 | 3.20 | 2.41 | 2.34 | 2.15 | ||
| P95 | Min | 0.41 | 0.40 | 0.17 | 0.75 | 0.25 | 0.35 | |
| Max | 3.44 | 7.94 | 5.28 | 3.98 | 3.86 | 3.55 | ||
| High (P95) consumption | Occurrence | Surveys (n) | 1 | 2 | 1 | 12 | 2 | 0 |
| P50 | Min | 0.43 | 0.10 | 0.04 | 0.23 | 0.20 | – | |
| Max | 0.43 | 0.28 | 0.04 | 0.89 | 0.54 | – | ||
| P75 | Min | 0.96 | 0.24 | 0.09 | 0.51 | 0.46 | – | |
| Max | 0.96 | 0.64 | 0.09 | 2.00 | 1.21 | – | ||
| P90 | Min | 2.63 | 0.64 | 0.26 | 1.39 | 1.26 | – | |
| Max | 2.63 | 1.74 | 0.26 | 5.45 | 3.29 | – | ||
| P95 | Min | 4.33 | 1.06 | 0.43 | 2.29 | 2.08 | – | |
| Max | 4.33 | 2.87 | 0.43 | 9.00 | 5.43 | – | ||
bw: body weight; P50: 50th percentile; P75: 75th percentile; P90: 90th percentile; P95: 95th percentile.
For the high consumers at the P75 of occurrence the ARfD is reached and exceeded in adults and in the elderly. At the P95, exposure to Total‐Δ9‐THC ranged at the UB from 1.06 to 2.87 μg/kg bw in Other children and from 2.29 to 9.00 μg/kg bw in adults. These values are in line with the exposure estimates performed by the BfR (BfR, 2018) for adults of 8.41 μg/kg bw at the P95. Results of the exposure assessment across surveys for different European population groups are reported in B.4 of Annex B.
Scenario on Tea (Infusion)
In the case of ‘Tea (Infusion)’14 , 119 samples were available and acute exposure was estimated up to the P95 occurrence level. Acute exposure estimates to Total‐Δ9‐THC at the UB for the ‘tea infusions’ are reported in Table 11. Estimates for LB scenario did not differ much from the UB ones and can be found in Table B.3. Results of the exposure assessment across surveys for different European population groups are reported in B.4 of Annex B.
Table 11: Summary of exposure to Total‐Δ9‐THC for ‘Tea (Infusion)’ across different population and age groups in Europe (μg/kg bw) at the Upper Bound
| UB | ||||||||
|---|---|---|---|---|---|---|---|---|
| Population class | Toddlers | Other children | Adolescents | Adults | Elderly | Very elderly | ||
| Occurrence | Surveys (n) | 14 | 21 | 21 | 23 | 20 | 16 | |
| MEAN Consumption | P50 | Min | 0.1 | 0.9 | 0.6 | 0.4 | 0.4 | 0.5 |
| Max | 3.2 | 2.2 | 1.4 | 1.6 | 1.3 | 1.6 | ||
| P75 | Min | 0.9 | 5.7 | 3.6 | 2.8 | 2.7 | 3.1 | |
| Max | 19.9 | 14.0 | 8.6 | 10.3 | 8.3 | 10.2 | ||
| P90 | Min | 3.8 | 25.2 | 16.1 | 12.2 | 12.2 | 13.6 | |
| Max | 88.3 | 62.1 | 38.0 | 45.6 | 36.7 | 45.1 | ||
| P95 | Min | 6.3 | 41.7 | 26.6 | 20.3 | 20.2 | 22.5 | |
| Max | 146.5 | 103.0 | 63.0 | 75.6 | 60.8 | 74.7 | ||
| High (P95) Consumption | Occurrence | Surveys (n) | 8 | 18 | 18 | 23 | 18 | 12 |
| P50 | Min | 2.8 | 1.8 | 1.3 | 0.9 | 1.1 | 1.0 | |
| Max | 9.5 | 5.6 | 3.7 | 4.5 | 3.4 | 3.3 | ||
| P75 | Min | 17.6 | 11.5 | 8.1 | 5.5 | 6.8 | 6.5 | |
| Max | 59.4 | 34.9 | 23.5 | 28.3 | 21.6 | 20.6 | ||
| P90 | Min | 78.0 | 51.0 | 35.9 | 24.4 | 30.0 | 28.6 | |
| Max | 263.3 | 154.8 | 104.0 | 125.4 | 95.9 | 91.4 | ||
| P95 | Min | 129.3 | 84.5 | 59.6 | 40.4 | 49.7 | 47.5 | |
| Max | 436.5 | 256.7 | 172.4 | 208.0 | 159.0 | 151.6 | ||
UB: upper bound; bw: body weight; P50: 50th percentile; P75: 75th percentile; P90: 90th percentile; P95: 95th percentile.
Considering the highest reliable percentile of occurrence (P95), the mean exposure in adults at the UB, varied from 20.3 to 75.6 μg/kg bw, while the high exposure ranged from 40 to 208 μg/kg bw. These values are higher than the 38.1 μg/kg bw estimated by the BfR (BfR, 2018). This difference is probably because in their assessment, the P95 percentile of occurrence was 1.41 mg/kg, while in the present assessment the P95 is 6.5 mg/kg. It should, however, be highlighted that the German occurrence data set used by the BfR included only 23 samples, while the EFSA data set contained 119 samples from different EU countries. Interestingly, the maximum level of The BfR was 5.88 mg/kg that is quite close to the EFSA P95.
Scenarios on Bread and Rolls
Two independent acute exposure assessments were performed for bread and rolls. The first called ‘Bread and Rolls’ was based on the 14 occurrence data reported in category ‘Bread and rolls’ (as such) and acute exposure was estimated up to the P75 occurrence level. The second, called ‘Bread and rolls from hemp flour’ was based on 49 occurrence data reported on hemp flour from which the expected Total‐Δ9‐THC content was calculated assuming a 100% carry‐over and a 25% content of hemp flour as an ingredient (as in section 1.4.5). In this case, an acute exposure was estimated up to the P90 occurrence level. Results for the two scenarios are compared in Table 12 (LB) and Table 13 (UB).
Table 12: Comparative summary of exposure to Total‐Δ9‐THC for scenario ‘Bread and rolls from hemp flour’ and ‘Bread and rolls’ (as such) at the upper bound across different population and age groups in Europe (μg/kg bw)
| LB – Bread and rolls from hemp flour | LB – Bread and rolls | |||||||||||||
|---|---|---|---|---|---|---|---|---|---|---|---|---|---|---|
| Population class | Toddlers | Other children | Adolescents | Adults | Elderly | Very elderly | Toddlers | Other children | Adolescents | Adults | Elderly | Very elderly | ||
| Occurrence | Surveys (n) | 15 | 21 | 21 | 23 | 20 | 16 | 15 | 21 | 21 | 23 | 20 | 16 | |
| MEAN Consumption | P50 | Min | 0.04 | 0.03 | 0.01 | 0.10 | 0.10 | 0.10 | 0.00 | 0.00 | 0.00 | 0.00 | 0.00 | 0.00 |
| Max | 0.57 | 0.52 | 0.37 | 0.28 | 0.26 | 0.27 | 0.00 | 0.00 | 0.00 | 0.00 | 0.00 | 0.00 | ||
| P75 | Min | 0.08 | 0.07 | 0.03 | 0.20 | 0.20 | 0.20 | 0.02 | 0.02 | 0.01 | 0.05 | 0.05 | 0.05 | |
| Max | 1.12 | 1.02 | 0.73 | 0.54 | 0.50 | 0.52 | 0.29 | 0.26 | 0.19 | 0.14 | 0.13 | 0.13 | ||
| P90 | Min | 0.29 | 0.24 | 0.09 | 0.72 | 0.70 | 0.70 | – | – | – | – | – | – | |
| Max | 3.98 | 3.63 | 2.58 | 1.92 | 1.79 | 1.86 | – | – | – | – | – | – | ||
| P95 | Min | – | – | – | – | – | – | – | – | – | – | – | – | |
| Max | – | – | – | – | – | – | – | – | – | – | – | – | ||
| Occurrence | Surveys (n) | 14 | 21 | 21 | 23 | 20 | 14 | 14 | 21 | 21 | 23 | 20 | 14 | |
| High (P95) Consumption | P50 | Min | 0.12 | 0.10 | 0.03 | 0.24 | 0.21 | 0.22 | 0.00 | 0.00 | 0.00 | 0.00 | 0.00 | 0.00 |
| Max | 1.17 | 1.09 | 0.77 | 0.59 | 0.53 | 0.51 | 0.00 | 0.00 | 0.00 | 0.00 | 0.00 | 0.00 | ||
| P75 | Min | 0.23 | 0.19 | 0.07 | 0.48 | 0.42 | 0.43 | 0.06 | 0.05 | 0.02 | 0.12 | 0.11 | 0.11 | |
| Max | 2.29 | 2.14 | 1.51 | 1.15 | 1.03 | 1.00 | 0.59 | 0.55 | 0.39 | 0.30 | 0.26 | 0.26 | ||
| P90 | Min | 0.82 | 0.69 | 0.23 | 1.70 | 1.49 | 1.53 | – | – | – | – | – | – | |
| Max | 8.14 | 7.60 | 5.37 | 4.10 | 3.67 | 3.55 | – | – | – | – | – | – | ||
| P95 | Min | – | – | – | – | – | – | – | – | – | – | – | – | |
| Max | – | – | – | – | – | – | – | – | – | – | – | – | ||
UB: upper bound; bw: body weight; P50: 50th percentile; P75: 75th percentile; P90: 90th percentile; P95: 95th percentile.
Table 13: Comparative summary of exposure to Total‐Δ9‐THC for scenario ‘Bread and rolls from hemp flour’ and ‘Bread and rolls’ (as such) at the upper bound across different population and age groups in Europe (μg/kg bw)
| UB – Bread and rolls from hemp flour | UB – Bread and rolls | |||||||||||||
|---|---|---|---|---|---|---|---|---|---|---|---|---|---|---|
| Population class | Toddlers | Other children | Adolescents | Adults | Elderly | Very elderly | Toddlers | Other children | Adolescents | Adults | Elderly | Very elderly | ||
| Occurrence | Surveys (n) | 15 | 21 | 21 | 23 | 20 | 16 | 15 | 21 | 21 | 23 | 20 | 16 | |
| MEAN Consumption | P50 | Min | 0.04 | 0.03 | 0.01 | 0.10 | 0.10 | 0.10 | 0.04 | 0.03 | 0.01 | 0.10 | 0.10 | 0.10 |
| Max | 0.57 | 0.52 | 0.37 | 0.28 | 0.26 | 0.27 | 0.57 | 0.52 | 0.37 | 0.27 | 0.25 | 0.27 | ||
| P75 | Min | 0.08 | 0.07 | 0.03 | 0.20 | 0.20 | 0.20 | 0.09 | 0.08 | 0.03 | 0.23 | 0.22 | 0.22 | |
| Max | 1.12 | 1.02 | 0.73 | 0.54 | 0.50 | 0.52 | 1.27 | 1.16 | 0.82 | 0.61 | 0.57 | 0.59 | ||
| P90 | Min | 0.29 | 0.24 | 0.09 | 0.72 | 0.70 | 0.70 | – | – | – | – | – | – | |
| Max | 3.98 | 3.63 | 2.58 | 1.92 | 1.79 | 1.86 | – | – | – | – | – | – | ||
| P95 | Min | – | – | – | – | – | – | – | – | – | – | – | – | |
| Max | – | – | – | – | – | – | – | – | – | – | – | – | ||
| Occurrence | Surveys (n) | 14 | 21 | 21 | 23 | 20 | 14 | 14 | 21 | 21 | 23 | 20 | 14 | |
| High (P95) Consumption | P50 | Min | 0.12 | 0.10 | 0.03 | 0.24 | 0.21 | 0.22 | 0.12 | 0.10 | 0.03 | 0.24 | 0.21 | 0.22 |
| Max | 1.17 | 1.09 | 0.77 | 0.59 | 0.53 | 0.51 | 1.16 | 1.08 | 0.77 | 0.58 | 0.52 | 0.51 | ||
| P75 | Min | 0.23 | 0.19 | 0.07 | 0.48 | 0.42 | 0.43 | 0.26 | 0.22 | 0.07 | 0.54 | 0.48 | 0.49 | |
| Max | 2.29 | 2.14 | 1.51 | 1.15 | 1.03 | 1.00 | 2.59 | 2.42 | 1.71 | 1.31 | 1.17 | 1.13 | ||
| P90 | Min | 0.82 | 0.69 | 0.23 | 1.70 | 1.49 | 1.53 | – | – | – | – | – | – | |
| Max | 8.14 | 7.60 | 5.37 | 4.10 | 3.67 | 3.55 | – | – | – | – | – | – | ||
| P95 | Min | – | – | – | – | – | – | – | – | – | – | – | – | |
| Max | – | – | – | – | – | – | – | – | – | – | – | – | ||
UB: upper bound; bw: body weight; P50: 50th percentile; P75: 75th percentile; P90: 90th percentile; P95: 95th percentile.
In adults, under the UB scenario, at the common highest reliable percentile of occurrence (the P75) the mean exposure to Total‐Δ9‐THC ranged from 0.23 to 0.61 μg/kg bw for ‘Bread and rolls’ and from 0.20 to 0.54 μg/kg bw for ‘Bread and rolls from hemp flour’. At the UB, the maximum exposure for high consumers at the P75 of occurrence was 1.31 μg/kg bw for ‘Bread and rolls’ vs. 1.15 μg/kg bw for ‘Bread and rolls from hemp seeds’. However, this similarity was not confirmed at the LB (data in Table 12), where maximum mean exposure at the P75 of occurrence was 0.14 μg/kg bw vs. 0.54 μg/kg bw for the mean exposure and 0.30 μg/kg bw vs. 1.15 μg/kg bw for the high exposure. This is an obvious effect of the gap between LB and UB (43–190 μg/kg) of the P75 reported for the category ‘Bread and rolls’ that results from the elevated amount of left‐censored data for this category (71%) and of the relatively high LOQs. On the contrary, in the category ‘Bread and rolls from hemp flour’, no difference between UB and LB was seen for both P75 (168 μg/kg bw) and P90 (597 μg/kg bw).
Results of the exposure assessment for different European population groups and surveys are reported in B.4 of Annex B.
Scenario on Pasta (Raw)
In the case of ‘Pasta (Raw)’, only 18 samples were available, and exposure was estimated up to the P75 occurrence level. Results of the exposure assessment for Total‐Δ9‐THC at the LB and UB for the ‘Pasta (Raw)’ are reported in Table 14. In adults, at the highest reliable percentile of occurrence (the P75), the mean exposure to Total‐Δ9‐THC ranged from 0.1–0.4 (LB–UB) to 0.9–2.9 (LB–UB) μg/kg bw. The maximum exposure for high consumers at the P75 of occurrence was 1.9–6.4 (LB–UB) μg/kg bw in adults. Results of the exposure assessment for different European population groups and surveys are reported in B.4 of Annex B.
Table 14: Summary of exposure to Total‐Δ9‐THC for ‘Pasta (Raw)’ across different population and age groups in Europe (μg/kg bw) at the upper and lower bound
| LB | UB | |||||||||||||
|---|---|---|---|---|---|---|---|---|---|---|---|---|---|---|
| Population Class | Toddlers | Other children | Adolescents | Adults | Elderly | Very elderly | Toddlers | Other children | Adolescents | Adults | Elderly | Very elderly | ||
| Occurrence | Surveys (n) | 15 | 21 | 21 | 23 | 20 | 15 | 15 | 21 | 21 | 23 | 20 | 15 | |
| MEAN Consumption | P50 | Min | 0.0 | 0.0 | 0.0 | 0.0 | 0.0 | 0.0 | 0.4 | 0.3 | 0.2 | 0.1 | 0.1 | 0.0 |
| Max | 0.0 | 0.0 | 0.0 | 0.0 | 0.0 | 0.0 | 1.9 | 1.6 | 1.3 | 0.9 | 0.8 | 0.7 | ||
| P75 | Min | 0.4 | 0.3 | 0.2 | 0.1 | 0.1 | 0.0 | 1.2 | 1.0 | 0.6 | 0.4 | 0.2 | 0.1 | |
| Max | 1.8 | 1.6 | 1.2 | 0.9 | 0.8 | 0.7 | 6.0 | 5.3 | 4.2 | 2.9 | 2.5 | 2.4 | ||
| P90 | Min | – | – | – | – | – | – | – | – | – | – | – | – | |
| Max | – | – | – | – | – | – | – | – | – | – | – | – | ||
| P95 | Min | – | – | – | – | – | – | – | – | – | – | – | – | |
| Max | – | – | – | – | – | – | – | – | – | – | – | – | ||
| High (P95) Consumption | Occurrence | Surveys (n) | 12 | 19 | 17 | 21 | 13 | 8 | 12 | 19 | 17 | 21 | 13 | 8 |
| P50 | Min | 0.0 | 0.0 | 0.0 | 0.0 | 0.0 | 0.0 | 1.0 | 0.7 | 0.5 | 0.4 | 0.3 | 0.4 | |
| Max | 0.0 | 0.0 | 0.0 | 0.0 | 0.0 | 0.0 | 4.9 | 3.7 | 2.6 | 2.0 | 1.5 | 1.6 | ||
| P75 | Min | 1.0 | 0.7 | 0.5 | 0.4 | 0.3 | 0.4 | 3.2 | 2.2 | 1.5 | 1.2 | 0.9 | 1.2 | |
| Max | 4.7 | 3.6 | 2.5 | 1.9 | 1.4 | 1.6 | 15.8 | 11.8 | 8.3 | 6.4 | 4.8 | 5.2 | ||
| P90 | Min | – | – | – | – | – | – | – | – | – | – | – | – | |
| Max | – | – | – | – | – | – | – | – | – | – | – | – | ||
| P95 | Min | – | – | – | – | – | – | – | – | – | – | – | – | |
| Max | – | – | – | – | – | – | – | – | – | – | – | – | ||
LB: lower bound; UB: upper bound; bw: body weight; P50: 50th percentile; P75: 75th percentile; P90: 90th percentile; P95: 95th percentile.
Scenario on Breakfast cereals
In the case of ‘Breakfast cereals’, only 7 samples were available, and exposure was estimated only for the mean and P50 occurrence levels. Results of the exposure assessment for Total‐Δ9‐THC at the LB and UB for the ‘Breakfast Cereals’ are reported in Table 15. In adults, at the highest reliable percentile of occurrence (the P50) the exposure to Total‐Δ9‐THC for mean consumption ranged from < 0.01–0.08 (LB–UB) until 0.02–0.57 (LB–UB) μg/kg bw. The maximum exposure for high consumers at the P50 of occurrence was 0.05–1.27 (LB–UB) μg/kg bw in adults. Results of the exposure assessment for different European population groups and surveys are reported in B.4 of Annex B.
Table 15: Summary of exposure to Total‐Δ9‐THC for ‘Breakfast cereals’ across different population and age groups in Europe (μg/kg bw) at the lower and upper bound
| LB | UB | |||||||||||||
|---|---|---|---|---|---|---|---|---|---|---|---|---|---|---|
| Population class | Toddlers | Other children | Adolescents | Adults | Elderly | Very elderly | Toddlers | Other children | Adolescents | Adults | Elderly | Very elderly | ||
| Occurrence | Surveys (n) | 15 | 21 | 20 | 23 | 19 | 15 | 15 | 21 | 20 | 23 | 19 | 15 | |
| MEAN Consumption | P50 | Min | 0.01 | 0.01 | < 0.01 | < 0.01 | < 0.01 | < 0.01 | 0.21 | 0.18 | 0.09 | 0.08 | 0.06 | 0.07 |
| Max | 0.03 | 0.03 | 0.01 | 0.02 | 0.03 | 0.02 | 0.76 | 0.80 | 0.35 | 0.57 | 0.65 | 0.43 | ||
| P75 | Min | – | – | – | – | – | – | – | – | – | – | – | – | |
| Max | – | – | – | – | – | – | – | – | – | – | – | – | ||
| P90 | Min | – | – | – | – | – | – | – | – | – | – | – | – | |
| Max | – | – | – | – | – | – | – | – | – | – | – | – | ||
| P95 | Min | – | – | – | – | – | – | – | – | – | – | – | – | |
| Max | – | – | – | – | – | – | – | – | – | – | – | – | ||
| Occurrence | Surveys (n) | 10 | 12 | 18 | 21 | 13 | 7 | 10 | 12 | 18 | 21 | 13 | 7 | |
| P50 | Min | 0.04 | 0.01 | 0.01 | 0.01 | 0.01 | 0.01 | 0.95 | 0.31 | 0.19 | 0.18 | 0.17 | 0.21 | |
| Max | 0.12 | 0.09 | 0.04 | 0.05 | 0.05 | 0.04 | 3.01 | 2.17 | 1.11 | 1.27 | 1.25 | 1.04 | ||
| P75 | Min | – | – | – | – | – | – | – | – | – | – | – | – | |
| Max | – | – | – | – | – | – | – | – | – | – | – | – | ||
| P90 | Min | – | – | – | – | – | – | – | – | – | – | – | – | |
| Max | – | – | – | – | – | – | – | – | – | – | – | – | ||
| P95 | Min | – | – | – | – | – | – | – | – | – | – | – | – | |
| Max | – | – | – | – | – | – | – | – | – | – | – | – | ||
LB: lower bound; UB: upper bound; bw: body weight; P50: 50th percentile; P75: 75th percentile; P90: 90th percentile; P95: 95th percentile.
Scenario on Cereal bars
For ‘Cereal bars’, only 5 samples were available, and exposure was estimated only for mean and P50 occurrence levels. Results of the exposure assessment for Total‐Δ9‐THC at the UB for the ‘Cereal bars’ are reported in Table 16 (results for LB can be found in Table B.3 of Annex B). It should be noted that despite the small number of samples reported in the EFSA database, snacks containing hemp, muesli bars and energy bars (e.g. fruit bars with hemp seeds) were the group of products most frequently found on the German market. These accounted for 22% of the total according to the Mintel data (2012–2017) reported by the BfR in its exposure assessment (BfR, 2018).
Table 16: Summary of exposure to Total‐Δ9‐THC for ‘Cereals bars’ across different population and age groups in Europe (μg/kg bw) at the upper bound
| UB | ||||||||
|---|---|---|---|---|---|---|---|---|
| Population class | Toddlers | Other children | Adolescents | Adults | Elderly | Very elderly | ||
| Occurrence | Surveys (n) | 8 | 16 | 16 | 18 | 13 | 7 | |
| MEAN Consumption | P50 | Min | 0.06 | 0.17 | 0.09 | 0.07 | 0.06 | 0.06 |
| Max | 0.66 | 0.35 | 0.22 | 0.36 | 0.15 | 0.24 | ||
| P75 | Min | – | – | – | – | – | – | |
| Max | – | – | – | – | – | – | ||
| P90 | Min | – | – | – | – | – | – | |
| Max | – | – | – | – | – | – | ||
| P95 | Min | – | – | – | – | – | – | |
| Max | – | – | – | – | – | – | ||
| High (P95) Consumption | Occurrence | Surveys (n) | 1 | 2 | 3 | 4 | 0 | 0 |
| P50 | Min | 0.74 | 0.52 | 0.21 | 0.19 | – | – | |
| Max | 0.74 | 0.79 | 0.31 | 0.27 | – | – | ||
| P75 | Min | – | – | – | – | – | – | |
| Max | – | – | – | – | – | – | ||
| P90 | Min | – | – | – | – | – | – | |
| Max | – | – | – | – | – | – | ||
| P95 | Min | – | – | – | – | – | – | |
| Max | – | – | – | – | – | – | ||
UB: upper bound; bw: body weight; P50: 50th percentile; P75: 75th percentile; P90: 90th percentile; P95: 95th percentile.
Using the P50 occurrence, acute exposure to Total‐Δ9‐THC ranges from 0.19 to 0.27 μg/kg bw in adults with high consumption. Results of the exposure assessment for different European population groups are reported in B.4 of Annex B.
Scenario on Fine bakery wares
For ‘Fine bakery wares’, 24 samples were available, and exposure was estimated up to the P75 occurrence level. Results of the exposure assessment Total‐Δ9‐THC at the LB and UB for the ‘Fine bakery wares’ are reported in Table 17. In adults, at the highest reliable percentile of occurrence (the P75), the mean exposure to Total‐Δ9‐THC ranged from 0.24–0.67 (LB–UB) to 0.66–1.87 (LB–UB) μg/kg bw. The maximum exposure for high consumers at the P75 of occurrence was 1.82–5.14 (LB–UB) μg/kg bw in adults. Results of the exposure assessment for different European population groups are reported in B.4 of Annex B.
Table 17: Summary of exposure to Total‐ Δ9‐THC for ‘Fine bakery wares’ across different population and age groups in Europe (μg/kg bw) at the lower and upper bound
| LB | UB | |||||||||||||
|---|---|---|---|---|---|---|---|---|---|---|---|---|---|---|
| Population class | Toddlers | Other children | Adolescents | Adults | Elderly | Very elderly | Toddlers | Other children | Adolescents | Adults | Elderly | Very elderly | ||
| Occurrence | Surveys (n) | 15 | 21 | 21 | 23 | 20 | 16 | 15 | 21 | 21 | 23 | 20 | 16 | |
| MEAN Consumption | P50 | Min | < 0.01 | < 0.01 | < 0.01 | < 0.01 | < 0.01 | < 0.01 | 0.05 | 0.04 | 0.01 | 0.06 | 0.05 | 0.05 |
| Max | 0.01 | 0.02 | 0.01 | 0.01 | 0.01 | 0.01 | 0.31 | 0.34 | 0.20 | 0.16 | 0.14 | 0.15 | ||
| P75 | Min | 0.23 | 0.17 | 0.05 | 0.24 | 0.20 | 0.21 | 0.65 | 0.49 | 0.14 | 0.67 | 0.56 | 0.58 | |
| Max | 1.31 | 1.43 | 0.85 | 0.66 | 0.59 | 0.63 | 3.69 | 4.04 | 2.39 | 1.87 | 1.66 | 1.78 | ||
| P90 | Min | – | – | – | – | – | – | – | – | – | – | – | – | |
| Max | – | – | – | – | – | – | – | – | – | – | – | – | ||
| P95 | Min | – | – | – | – | – | – | – | – | – | – | – | – | |
| Max | – | – | – | – | – | – | – | – | – | – | – | – | ||
| Occurrence | Surveys (n) | 13 | 19 | 19 | 23 | 18 | 12 | 13 | 19 | 19 | 23 | 18 | 12 | |
| High (P95) Consumption | P50 | Min | 0.01 | 0.02 | 0.01 | 0.01 | 0.01 | 0.01 | 0.13 | 0.39 | 0.21 | 0.14 | 0.12 | 0.13 |
| Max | 0.04 | 0.04 | 0.03 | 0.02 | 0.02 | 0.01 | 0.81 | 0.76 | 0.54 | 0.43 | 0.35 | 0.31 | ||
| P75 | Min | 0.54 | 1.65 | 0.90 | 0.60 | 0.50 | 0.55 | 1.54 | 4.66 | 2.53 | 1.70 | 1.40 | 1.56 | |
| Max | 3.44 | 3.21 | 2.29 | 1.82 | 1.48 | 1.33 | 9.70 | 9.07 | 6.47 | 5.14 | 4.19 | 3.74 | ||
| P90 | Min | – | – | – | – | – | – | – | – | – | – | – | – | |
| Max | – | – | – | – | – | – | – | – | – | – | – | – | ||
| P95 | Min | – | – | – | – | – | – | – | – | – | – | – | – | |
| Max | – | – | – | – | – | – | – | – | – | – | – | – | ||
LB: lower bound; UB: upper bound; bw: body weight; P50: 50th percentile; P75: 75th percentile; P90: 90th percentile; P95: 95th percentile.
Scenario on Chocolate (Cocoa) products
For ‘Chocolate (Cocoa) products’, 19 samples were available, and exposure was estimated up to the P75 occurrence level. Results of the exposure assessment for Total‐Δ9‐THC at the LB and UB for the ‘Chocolate (Cocoa) products’ are reported in Table 18. In adults, at the highest reliable percentile of occurrence (the P75), the mean exposure to Total‐Δ9‐THC ranged from 0.07–0.11 (LB–UB) to 0.27–0.44 (LB–UB) μg/kg bw. The maximum exposure for high consumers at the P75 of occurrence was 0.67–1.07 (LB–UB) μg/kg bw in adults. Results of the exposure assessment for different European population groups and surveys are reported in B.4 of Annex B.
Table 18: Summary of exposure to Total‐Δ9‐THC for ‘Chocolate (Cocoa) products’ across different population and age groups in Europe (μg/kg bw) at the lower and upper bound
| LB | UB | |||||||||||||
|---|---|---|---|---|---|---|---|---|---|---|---|---|---|---|
| Population Class | Toddlers | Other children | Adolescents | Adults | Elderly | Very elderly | Toddlers | Other children | Adolescents | Adults | Elderly | Very elderly | ||
| Occurrence | Surveys (n) | 15 | 21 | 21 | 23 | 20 | 16 | 15 | 21 | 21 | 23 | 20 | 16 | |
| MEAN Consumption | P50 | Min | < 0.01 | < 0.01 | < 0.01 | < 0.01 | < 0.01 | < 0.01 | 0.08 | 0.12 | 0.09 | 0.06 | 0.02 | 0.04 |
| Max | < 0.01 | < 0.01 | < 0.01 | < 0.01 | < 0.01 | < 0.01 | 0.38 | 0.41 | 0.28 | 0.22 | 0.12 | 0.11 | ||
| P75 | Min | 0.11 | 0.15 | 0.11 | 0.07 | 0.02 | 0.05 | 0.17 | 0.24 | 0.17 | 0.11 | 0.04 | 0.07 | |
| Max | 0.48 | 0.51 | 0.35 | 0.27 | 0.15 | 0.14 | 0.77 | 0.82 | 0.56 | 0.44 | 0.24 | 0.22 | ||
| P90 | Min | – | – | – | – | – | – | – | – | – | – | – | – | |
| Max | – | – | – | – | – | – | – | – | – | – | – | – | ||
| P95 | Min | – | – | – | – | – | – | – | – | – | – | – | – | |
| Max | – | – | – | – | – | – | – | – | – | – | – | – | ||
| Occurrence | Surveys (n) | 12 | 20 | 19 | 21 | 12 | 5 | 12 | 20 | 19 | 21 | 12 | 5 | |
| High (P95) Consumption | P50 | Min | < 0.01 | < 0.01 | < 0.01 | < 0.01 | < 0.01 | < 0.01 | 0.24 | 0.40 | 0.29 | 0.19 | 0.14 | 0.09 |
| Max | < 0.01 | < 0.01 | < 0.01 | < 0.01 | < 0.01 | < 0.01 | 0.79 | 1.08 | 0.84 | 0.54 | 0.24 | 0.36 | ||
| P75 | Min | 0.31 | 0.50 | 0.36 | 0.23 | 0.17 | 0.11 | 0.49 | 0.80 | 0.57 | 0.37 | 0.27 | 0.18 | |
| Max | 0.98 | 1.36 | 1.05 | 0.67 | 0.29 | 0.45 | 1.57 | 2.17 | 1.68 | 1.07 | 0.47 | 0.72 | ||
| P90 | Min | – | – | – | – | – | – | – | – | – | – | – | – | |
| Max | – | – | – | – | – | – | – | – | – | – | – | – | ||
| P95 | Min | – | – | – | – | – | – | – | – | – | – | – | – | |
| Max | – | – | – | – | – | – | – | – | – | – | – | – | ||
LB: lower bound; UB: upper bound; bw: body weight; P50: 50th percentile; P75: 75th percentile; P90: 90th percentile; P95: 95th percentile.
Scenario on energy drinks
The scenario on energy drinks was based on 25 samples reported for ‘Non‐alcoholic beverages (excepting milk‐based beverages)’; acute exposure was estimated up to the P75 occurrence level. Results of the exposure assessment Total‐Δ9‐THC at the UB for Energy drinks are reported in Table 19 (results at the LB can be found in Table B.3 of Annex B). At the UB and considering the highest reliable percentile of occurrence (the P75), the mean exposure to Total‐Δ9‐THC in adults ranged from 0.03 to 0.09 (UB) μg/kg bw across different countries. For high consumers at the P75 of occurrence, exposure in adults varied between 0.14 and 0.25 (UB) μg/kg bw. Results of the exposure assessment for different European population groups are reported in Table B.4 of Annex B.
Table 19: Summary of exposure to Total‐Δ9‐THC for Energy drinks across different population and age groups in Europe (μg/kg bw) at the upper bound
| UB | ||||||||
|---|---|---|---|---|---|---|---|---|
| Population class | Toddlers | Other children | Adolescents | Adults | Elderly | Very elderly | ||
| MEAN Consumption | Occurrence | Surveys (n) | 2 | 6 | 10 | 15 | 4 | 2 |
| P50 | Min | 0.03 | 0.02 | 0.00 | 0.01 | 0.01 | 0.01 | |
| Max | 0.03 | 0.06 | 0.03 | 0.02 | 0.02 | 0.01 | ||
| P75 | Min | 0.15 | 0.09 | 0.02 | 0.03 | 0.03 | 0.05 | |
| Max | 0.18 | 0.31 | 0.17 | 0.09 | 0.10 | 0.07 | ||
| P90 | Min | – | – | – | – | – | – | |
| Max | – | – | – | – | – | – | ||
| P95 | Min | – | – | – | – | – | – | |
| Max | – | – | – | – | – | – | ||
| High (P95) Consumption | Occurrence | Surveys (n) | 0 | 0 | 2 | 4 | 0 | 0 |
| P50 | Min | – | – | 0.04 | 0.02 | – | – | |
| Max | – | – | 0.04 | 0.04 | – | – | ||
| P75 | Min | – | – | 0.20 | 0.14 | – | – | |
| Max | – | – | 0.24 | 0.25 | – | – | ||
| P90 | Min | – | – | – | – | – | – | |
| Max | – | – | – | – | – | – | ||
| P95 | Min | – | – | – | – | – | – | |
| Max | – | – | – | – | – | – | ||
UB: upper bound; bw: body weight; P50: 50th percentile; P75: 75th percentile; P90: 90th percentile; P95: 95th percentile.
Scenario on Beer and Beer‐Like Beverages
In the case of ‘Beer and Beer‐Like Beverages’, 30 samples were available and acute exposure was estimated up to the P90 occurrence level. Exposure to Total‐Δ9‐THC at the UB in the scenario dedicated to ‘Beer and beer‐like beverage’ is summarised in Table 20 (results at the LB can be found in Table B.3 of Annex B). At the highest reportable percentile of occurrence (the P90), mean exposure in adults ranged from 3 to 16 μg/kg bw and high exposure from 7 to 41 μg/kg bw. Results of the exposure assessment for different European population and age groups are reported in B.4 of Annex B.
Table 20: Summary of exposure to Total‐Δ9‐THC for ‘Beer and Beer‐like Beverages’ across different population and age groups in Europe (μg/kg bw) at the upper bound
| UB | ||||||||
|---|---|---|---|---|---|---|---|---|
| Population class | Toddlers | Other children | Adolescents | Adults | Elderly | Very elderly | ||
| Occurrence | Surveys (n) | 6 | 13 | 18 | 23 | 20 | 15 | |
| MEAN Consumption | P50 | Min | 0.01 | 0.01 | 0.02 | 0.06 | 0.05 | 0.05 |
| Max | 0.13 | 0.25 | 0.26 | 0.34 | 0.22 | 0.12 | ||
| P75 | Min | 0.08 | 0.11 | 0.12 | 0.47 | 0.38 | 0.36 | |
| Max | 0.98 | 1.86 | 1.94 | 2.55 | 1.65 | 0.91 | ||
| P90 | Min | 0.50 | 0.70 | 0.79 | 3.00 | 2.42 | 2.32 | |
| Max | 6.20 | 11.80 | 12.32 | 16.21 | 10.47 | 5.78 | ||
| P95 | Min | – | – | – | – | – | – | |
| Max | – | – | – | – | – | – | ||
| High (P95) Consumption | Occurrence | Surveys (n) | 0 | 0 | 4 | 22 | 10 | 4 |
| P50 | Min | – | – | 0.55 | 0.15 | 0.14 | 0.12 | |
| Max | – | – | 0.73 | 0.87 | 0.40 | 0.20 | ||
| P75 | Min | – | – | 4.10 | 1.11 | 1.00 | 0.88 | |
| Max | – | – | 5.42 | 6.45 | 2.98 | 1.47 | ||
| P90 | Min | – | – | 26.02 | 7.06 | 6.35 | 5.59 | |
| Max | – | – | 34.45 | 40.96 | 18.92 | 9.34 | ||
| P95 | Min | – | – | – | – | – | – | |
| Max | – | – | – | – | – | – | ||
UB: upper bound; bw: body weight; P50: 50th percentile; P75: 75th percentile; P90: 90th percentile; P95: 95th percentile.
Scenario on Dietary supplements
In the case of ‘Dietary supplements’, 26 samples were available and acute exposure was estimated up to the P75 occurrence level. Results of the exposure assessment for Total‐Δ9‐THC at the UB for ‘dietary supplements ‘are reported in Table 21 (results at the LB can be found in Table B.3 of Annex B). At the UB in adults, at the highest reliable percentile of occurrence (the P75), the mean exposure to Total‐Δ9‐THC ranged from 0.3 to 5.7 μg/kg bw across different surveys. For high consumers, at the P75 of occurrence, the exposure varied between 1.5 and 9.9 μg/kg bw in adults. Results of the exposure assessment for different European populations and age groups is reported in B.4 of Annex B. Considering that quite different types of samples were included in this food category, with very different occurrence levels and values, results should be taken with caution (see Section 2.3).
Table 21: Summary of exposure to Total‐Δ9‐THC for ‘dietary supplements’& across different population and age groups in Europe (μg/kg bw) at the upper bound
| UB | ||||||||
|---|---|---|---|---|---|---|---|---|
| Population class | Toddlers | Other children | Adolescents | Adults | Elderly | Very elderly | ||
| Occurrence | Surveys (n) | 9 | 12 | 12 | 12 | 11 | 6 | |
| MEAN Consumption | P50 | Min | 0.03 | 0.05 | 0.04 | 0.02 | 0.01 | 0.03 |
| Max | 0.58 | 1.72 | 0.47 | 0.32 | 0.70 | 0.21 | ||
| P75 | Min | 0.54 | 0.82 | 0.77 | 0.32 | 0.14 | 0.53 | |
| Max | 10.32 | 30.46 | 8.30 | 5.66 | 12.46 | 3.68 | ||
| P90 | Min | – | – | – | – | – | – | |
| Max | – | – | – | – | – | – | ||
| P95 | Min | – | – | – | – | – | – | |
| Max | – | – | – | – | – | – | ||
| Occurrence | Surveys (n) | 6 | 7 | 7 | 8 | 8 | 3 | |
| High (P95) Consumption | P50 | Min | 0.13 | 0.16 | 0.11 | 0.08 | 0.10 | 0.07 |
| Max | 2.23 | 1.01 | 0.42 | 0.56 | 0.75 | 0.12 | ||
| P75 | Min | 2.24 | 2.79 | 2.00 | 1.50 | 1.79 | 1.18 | |
| Max | 39.60 | 18.00 | 7.42 | 9.92 | 13.27 | 2.19 | ||
| P90 | Min | – | – | – | – | – | – | |
| Max | – | – | – | – | – | – | ||
| P95 | Min | – | – | – | – | – | – | |
| Max | – | – | – | – | – | – | ||
UB: upper bound; bw: body weight; P50: 50th percentile; P75: 75th percentile; P90: 90th percentile; P95: 95th percentile.
& The consumption data for dietary supplements for Croatia are currently under revision due to possible inconsistencies and were not used in the here reported exposure assessment
Uncertainty analysis
Consumption data on hemp and hemp‐containing products were extremely limited in the Comprehensive Database and therefore proxies had to be considered for the assessment of acute exposure. Several independent scenarios were described based on consumers of ‘standard’ food categories used instead of the hemp‐based versions. The level of consumption of hemp and hemp‐containing products remains unknown and the use of proxies is the best possible approximation despite it still represents an important source of uncertainty. In particular, this assumption is likely introducing an overestimation of exposure, especially for age classes other than adults (as pointed out in Section 1.4.5 on methodology). It is expected that the consumption of hemp and hemp‐containing products occurs less frequently than their ‘standard’ counterpart, but their frequency of consumption within a single day is probably more aligned. As pointed out by BfR (2018), consumption of hemp and hemp‐containing products is comparable with their ‘standard’ version in the case of one‐off quantities consumed in one day.
The number of consumers of hemp and hemp‐based products still represents an important uncertainty. However, acute exposure was assessed for consuming days only for all proxies for hemp and hemp‐based products independently. The possibility of consumption of different hemp and hemp‐based products within the same day was therefore not considered.
The final occurrence data set on hemp and hemp‐derived products used to assess acute exposure to Total‐Δ9‐THC was composed of 588 samples (over 13 food categories). With respect to the EFSA opinion published in 2015 (EFSA, 2015), there was an increase of the number of samples as well as the number of food categories that could be used for exposure assessment to Δ9‐THC. It was therefore possible to assess the exposure for food categories that were not addressed in the 2012 opinion such as ‘Tea (Infusion)’, hemp oil or hemp seeds. However, the occurrence data set used to feed the exposure scenarios showed a variable number of samples per food category (from 5 up to 119) and this represents a source of uncertainty related to the representativeness of the data set. For certain categories, where the number of samples is particularly small (e.g. Cereal bars and Breakfast cereals), or the samples are heterogeneous (such as ‘Dietary supplements’), a higher uncertainty is expected in relation to the representativity of occurrence data. Moreover, the occurrence data collected in a limited number of countries were extrapolation to the whole of Europe and this is a common source of uncertainty in international dietary exposure assessments.
A further source of uncertainty is related to the assumptions regarding the percentage of hemp flour used in the scenario called ‘Bread and rolls from hemp flour’. This factor of 25% was also proposed by FSANZ (FSANZ, 2017b) in its dietary exposure to ∆9‐THC; however, it represents an assumption and might lead to an under or over estimation of the final ∆9‐THC content in the Bread and rolls as consumed. In general, the effect of food processing on ∆9‐THC represents a source of uncertainty in the current assessment.
Within the category, ‘Dietary supplements’ 26 samples were analysed for Total‐Δ9‐THC. When considering the lowest FoodEx level specified, 9 samples were reported as ‘dietary supplements’ with no further specification of the classification with a median concentration of 7,260 μg/kg. Two samples were reported as ‘Vitamin Supplements’ and had a Total‐Δ9‐THC content of 280 and 26,300 μg/kg; 8 samples as ‘Protein and amino acids supplements’ with a median content of 2,145 μg/kg and 7 as ‘Plant extract formula’ with a median of 897 μg/kg (with a max as high as 1,230,000 μg/kg). Acute exposure assessment to ‘dietary supplements’ was performed; however, considering the high heterogeneity of this category and the relatively high number of samples not further specified, results should be interpreted with caution since high uncertainty is associated with the occurrence levels and therefore with the results of the exposure assessment.
As also quoted by other sources (BfR, 2018), there are well known methodological limitations in the exact determination of ∆9‐THC levels in different foods due to a number of factors, which include:
- A variable selectivity towards ∆9‐THC of different analytical methods (e.g. GC‐based vs. LC‐based)
- the extraction efficiency of ∆9‐THCA‐A and ∆9‐THC for different food types and methods
- conversion of ∆9‐THCA‐A into ∆9‐THC during food processing and cooking
In the present report, it was decided to address exposure to Total‐Δ9‐THC, assuming a 100% conversion of ∆9‐THCA‐A into ∆9‐THC, which is considered to be conservative. However, all the above‐mentioned factors can contribute to increase the uncertainty towards an accurate quantification of ∆9‐THC in foods. These factors might contribute to both an over‐or underestimation of the levels of ∆9‐THC in food and of the current exposure assessment.
Exposure to ‘pure’Δ9‐THC was also assessed to better evaluate the uncertainty related to the determination of ∆9‐THC levels (Annex C). In this case, the number of high percentiles that could be used for the assessment decreased. For instance, the P95 for ‘hemp oil’ could not be calculated since only 55 samples of ‘pure’Δ9‐THC were available in this category, exposure was therefore assessed up to P90 (Table C.1, Annex C). At the P90 of occurrence, at the UB, the maximum exposure for high adult consumers was 16 μg/kg bw for ‘pure’Δ9‐THC compared to 11 μg/kg bw for total Total‐Δ9‐THC. When considering the P95 of occurrence for ‘Tea (Infusion)’, the P95 of occurrence was the same as for Total‐Δ9‐THC and ‘pure’Δ9‐THC (6,467 μg/kg UB = LB). Therefore, no difference was found in the maximum exposure for high consumers at the UB for this percentile among the two groups (208 μg/kg bw). However, in adults at the P75 of occurrence, acute exposure to ‘pure’Δ9‐THC varied from a minimum of 8.3 to a maximum of 42.9 μg/kg bw at the UB, while in the case of Total‐Δ9‐THC it varied from 5.5 up to 28.3 μg/kg bw. The higher exposure assessed for ‘pure’Δ9‐THC is the result of the increase in the P75 (1,333 ‘pure’Δ9‐THC vs. 880 μg/kg Total ‐Δ9‐THC). Although, theoretically, the use of Total‐Δ9‐THC is a possible source of overestimation of Δ9‐THC (due to the impossibility to exclude the presence and the contribution to Δ9‐THCA), the specific samples available for Total‐Δ9‐THC were on average lower in Δ9‐THC content than those of ‘pure’Δ9‐THC. Overall, their inclusion in the occurrence data set used for exposure assessment reduced the exposure estimates and overall the uncertainty, since more samples were available for the assessment.
In relation to the dietary exposure assessment, uncertainties and limitations related to the use of EFSA’s Comprehensive Food Consumption Database are described in EFSA’s guidance (EFSA, 2011b) and are not further detailed in this report.
Table 22: Summary of qualitative evaluation of the impact of uncertainties on the exposure assessment to Total‐Δ9‐THC in food
| Sources of uncertainty | Directiona |
|---|---|
| Extrapolation of occurrence data to the whole of Europe | +/– |
| Very low number of food samples available for exposure assessment for certain food categories | +/– |
| Variable selectivity towards ∆9‐THC of different analytical methods used to quantify Total‐∆9‐THC | + |
| Effect of food processing considered in the exposure assessment | +/– |
| Use of Proxy of Consumption for hemp and hemp‐based products | + |
| Consumption of only one hemp‐based product considered within a day | – |
∆9‐THC: delta‐8‐tetrahydrocannabinol.
a uncertainty with potential to cause over‐estimation of exposure; – : uncertainty with potential to cause under estimation of exposure.
Considering all the above‐mentioned factors, exposure estimates presented in this report are expected to represent an overestimation of the acute exposure to Δ9‐THC in ‘single food’ scenarios in consuming days.
Conclusions
Following the European Commission Recommendation 2016/2115 on the monitoring of the presence of Δ9‐THC by the end of December 2018, the EFSA database now contained 1,866 analytical results on Δ9‐THC and cannabinoids in food. After applying the exclusion criteria and a careful reclassification of analyte according to analytical method, a total of 1,547 analytical results were available in the final data set for ‘pure’Δ9‐THC (defined as data submitted on Δ9‐THC and produced with LC‐based methods) and other cannabinoids (with 1,303 analytical results submitted by national organisations and 244 by industry). Most of the data in the final data set were on ‘pure’Δ9‐THC (427 samples), on Sum Δ9‐THC/Δ9‐THCA (237), on cannabidiol (208), and cannabinol (167).
There is documented uncertainty (BfR, 2018) associated with the exact quantification of Δ9‐THC in food due to analytical methods, extraction efficiency as well as in relation to conversions related to food processing. Considering the limited number of samples reported for ‘pure’Δ9‐THC and Sum Δ9‐THC/Δ9‐THCA, and the fact that both categories referred, although with a different extent of uncertainty, to Δ9‐THC, the two sets of data were merged into a unique group called Total‐Δ9‐THC.
- Compared to the EFSA opinion published in 2015 (EFSA, 2015), there was an increase of the number of samples, as well as the number of food categories to be used for exposure assessment.
- In the food categories where more than 60 samples were reported, the highest P95 of occurrence was found in the category ‘hemp oil’ (17,000 μg Total‐Δ9‐THC/kg UB = LB) followed by’ Tea (infusion)’ (6,467 μg Total‐Δ9‐THC/kg UB = LB) and ‘hemp seeds’ (3,960 μg Total‐Δ9‐THC/kg UB = LB).
- At the P75, the highest occurrence of Total‐Δ9‐THC was found in the category ‘Dietary supplements’ (19,800 μg Total‐Δ9‐THC/kg UB = LB) followed by hemp oil (4,260 μg Total‐Δ9‐THC/kg UB = LB).
Given the limited amount of data on consumption of hemp and hemp‐based products, it was decided to use proxies based on ‘standard’ food categories and to calculate acute dietary exposure for specific food groups. This assumption is more relevant for adolescent and adult population groups, but the consumption of hemp‐based products cannot be excluded for ‘toddlers’ and ‘other children’. Exposure was therefore assessed and presented for all age groups, with the only exclusion being infants.
Acute exposure was assessed for 12 food categories independently based on occurrence data for Total‐Δ9‐THC up the highest reliable percentile of occurrence. Due to the lack of suitable occurrence data, it was not possible to assess exposure to Δ9‐THC from food of animal origin. Since THC causes acute effects, the focus is on the highest percentile of the UB occurrence and high (P95) consumers:
- ‘Hemp oil’: exposure was estimated up to the P95 occurrence level. At this percentile for the high consumers, at the UB the acute exposure to Total‐Δ9‐THC in ‘adults’ ranged from 3 to 21 μg/kg bw and in ‘other children’ from 7 to 59 μg/kg bw. Exposure estimates were in line with the acute exposure estimates performed by the BfR (2018) of 19 μg/kg bw in adults of 50 μg/kg bw in children at the P95 of occurrence.
- ‘Hemp seeds’: exposure was estimated up to the P95 occurrence level. At this occurrence level for the high consumers, acute exposure to Total‐Δ9‐THC ranged at the UB from 1.1 to 2.9 μg/kg bw in ‘other children’ and from 2.3 to 9 μg/kg bw in ‘adults’. These values were in line with the exposure estimates performed by the BfR (2018) for adults of 8.4 μg Total‐Δ9‐THC/kg bw at the P95.
- ‘Tea (Infusion)’: acute exposure was estimated up to the P95 occurrence level. At this percentile for high consumers, the exposure ranged from 40 to 208 μg/kg bw in adults (UB). This value is higher than the one of 38.1 μg Total‐Δ9‐THC /kg bw estimated by the BfR (2018). P95 percentile of occurrence was 1.4 mg Total‐Δ9‐THC /kg, while in the EFSA data set the P95 was 6.5 mg Total‐Δ9‐THC /kg.
- ‘Bread and Rolls’: acute exposure was estimated up to the P75 occurrence level (14 samples) for ‘Bread and Rolls’ (as such) and up to the P90 occurrence level for ‘Bread and rolls from hemp flour’ (49 samples). In adults, exposure to Total‐Δ9‐THC for the high consumers was 0.3–1.3 (LB–UB) μg/kg bw in ‘bread and rolls’ vs. 1.15–1.15 μg/kg bw (LB–UB) in ‘Bread and rolls from hemp flour’ at the P75 occurrence level. The difference was mainly due to the elevated amount of left‐censored data (71%) in the category ‘Bread and rolls’ (as such).
- ‘Dietary supplements’: 26 samples were available and acute exposure was estimated up to the P75 occurrence level. At this percentile, for high consumers the exposure to Total‐Δ9‐THC varied between 1.5 and 9.9 (UB) μg/kg bw in adults.
- ‘Pasta (Raw)’: only 18 samples were available and acute exposure was estimated up to the P75 occurrence level. At this percentile for high consumers at the UB, exposure varied between 1.2 and 6.4 μg/kg bw in adults.
- ‘Breakfast cereals’: exposure was estimated up to the P50 occurrence level (7 samples). At this percentile the exposure to Total‐Δ9‐THC for high consumers ranged from 0.18 to 1.27 (at the UB) μg/kg bw in adults.
- ‘Cereal bars’: exposure was estimated only for the P50 occurrence level (5 samples). At this percentile the exposure, acute exposure to Total‐Δ9‐THC ranged from 0.19 to 0.27 (at the UB) μg/kg bw in adults with high consumption.
- ‘Fine bakery wares’: exposure was estimated up to the P75 occurrence level (24 samples). At this occurrence percentile, the exposure to Total‐Δ9‐THC in adults, for high consumers ranged from 1.7 to 5.1 μg/kg bw at the UB.
- ‘Chocolate (Cocoa) products’: acute exposure was estimated up to the P75 occurrence level (19 samples). At this occurrence percentile, the exposure to Total‐Δ9‐THC in adults, for high consumers ranged from 0.37 to 1.07 μg/kg bw at the UB.
- ‘Energy drinks’: acute exposure was estimated up to the P75 occurrence level (25 samples). For high consumers at the P75 of occurrence, exposure in adults varied between 0.14 and 0.25 (UB) μg Total‐Δ9‐THC /kg bw.
- ‘Beer and Beer‐Like Beverages’: acute exposure was estimated up to the P90 occurrence level (30 samples). At this percentile, the acute exposure to Total‐Δ9‐THC at the UB, for high adult consumers varied from 7 to 41 μg Total‐Δ9‐THC /kg bw.
- The EFSA ARfD of 1 μg/kg bw was exceeded in the adult high consumers of most of the hemp and hemp‐containing products considered in this assessment, both under the LB and UB scenario. High consumers of ‘Tea (Infusion)’ and Hemp oil already exceeded 1 μg/kg bw when assuming the P50 of occurrence (UB) for Total‐Δ9‐THC. When assuming the P75 (UB) of occurrence, the ARfD was exceeded by adult high consumers of ‘Hemp oil’, ‘Pasta (Raw)’, ‘Fine bakery wares’, ‘Dietary supplements’, ‘Beer and beer‐like beverages’, ‘Bread and rolls’, ‘Hemp seeds’, ‘Bread and rolls from hemp flour’ and ‘Chocolate (Cocoa) products’. At the P95 of occurrence (UB), adult high consumers of Tea (Infusion), Hemp oil and Hemp seeds were exposed up to 208, 21 and 9 μg/kg bw, respectively. For some of the hemp‐containing products, exposure to Total‐Δ9‐THC in mean consumers exceeded the ARfD of 1 μg/kg when assuming the highest reliable percentile of occurrence.
- The use of proxies for the consumption of hemp and hemp‐containing products, the limited number of occurrence data for some of the food categories and the analytical limitations in the quantification of ∆9‐THC represent the most important sources of uncertainty related to the exposure results. Overall, exposure estimates presented in this report are expected to represent an overestimation of acute exposure to Δ9‐THC in the EU.
Recommendations
- Further research is needed in order to obtain sensitive, validated (this including interlaboratory validation) and Δ9‐THC specific methods to be translated to reliable official methods.
- Studies on the stability of Δ9‐THC, as well as on the conversion of Δ9‐THCA during food processing, including cooking, are required using state‐of‐the‐art Δ9‐THC specific methods.
- Studies to investigate the carry‐over of Δ9‐THC in the food chain and especially in food of animal origin, when the animals are fed with hemp and hemp‐derived products, should be performed.
- Data providers and in general the scientific community working in the field, should be encouraged to avoid the misclassification and the submission to EFSA of data on Total‐Δ9‐THC (based on unspecific GC methods) as ‘Δ9‐THC’.
- Member states should be encouraged to collect and submit to EFSA more occurrence data (based on selective methods) for Δ9‐THC in food and especially of animal origin, including dairy products, eggs and meat of animals fed with hemp and hemp‐derived products.
- Consumption data on real consumers of hemp and hemp‐containing products are needed to refine the exposure assessment.
Abbreviations
Δ8‐THC
delta‐8‐tetrahydrocannabinol
Δ9‐THC
delta‐9‐tetrahydrocannabinol
Δ9‐THCA
delta‐9‐tetrahydrocannabinolic Acid
ARfD
acute reference dose
BfR
German Federal Institute for Risk Assessment
BMDL10
benchmark dose lower confidence limit
bw
body weight
CBD
cannabidiol
CBN
cannabinol
CNS
central nervous system
CONTAM Panel
EFSA Panel on Contaminants in the Food Chain
DAD
diode‐array detector
DATA Unit
EFSA Evidence Management Unit
EIHA
European Industrial Hemp Association
FSANZ
Food Standards Australia New Zealand
FSVO
Swiss Federal Food Safety and Veterinary Office
GC
gas chromatography
GC‐FID
capillary gas chromatography with flame ionisation
GC–MS
gas chromatography coupled with mass spectrometry
HPLC
high‐pressure liquid chromatography
LB
lower bound
LC
liquid chromatography
LC–MS
liquid chromatography coupled to mass spectrometry
LC–MS/MS
liquid chromatography–tandem mass spectrometry
LOAEL
lowest‐observed‐adverse‐effect level
LOD
limit of detection
LOQ
limit of quantification
NOAEL
no‐observed‐adverse‐effect level
P50
50th percentile
P75
75th percentile
P90
90th percentile
P95
95th percentile
RP
reference point
RPC
raw primary commodity
SOP
standard operational procedure
Sum Δ9‐THC/Δ9‐THCA
sum of delta‐9‐Tetrahydrocannabinol and delta‐9‐Tetrahydrocannabinolic Acid
TDI
tolerable daily intake
Tot‐Δ9‐THC
total‐delta‐9‐Tetrahydrocannabinol
UB
upper bound
UF
uncertainty factor
UV
ultraviolet‐visible
Annex A – Dietary surveys and occurrence data in food submitted to EFSA
Annex B – Methodology details and Results of Exposure assessment
Annex C – Results of Exposure assessment ‘pure’Δ9‐THC
Annexes A–C can be found in the online version of this output (‘Supporting information’ section).
Supplementary Materials
References
- Tetrahydrocannabinol levels are too high in many hemp‐containing foods ‐health impairments are possible. 034/2018.. 2018
- Innovative development and validation of an HPLC/DAD method for the qualitative and quantitative determination of major cannabinoids in cannabis plant material.. Journal of Chromatography B,, 2009. [DOI]
- Management of left‐censored data in dietary exposure assessment of chemical substances.. EFSA Journal 2010;, 2010a. [DOI]
- Standard sample description for food and feed.. EFSA Journal 2010;, 2010b. [DOI]
- Report on the development of a Food Classification and Description System for exposure assessment and guidance on its implementation and use.. EFSA Journal 2011;, 2011a. [DOI]
- Use of the EFSA Comprehensive European Food Consumption Database in Exposure Assessment.. EFSA Journal 2011;, 2011b. [DOI]
- Scientific Opinion on the risks for human health related to the presence of tetrahydrocannabinol (THC) in milk and other food of animal origin.. EFSA Journal 2015;, 2015. [DOI]
- Use of cut‐off values on the limits of quantification reported in datasets used to estimate dietary exposure to chemical contaminants.. EFSA Journal 2018;, 2018. [DOI]
- The raw primary commodity (RPC) model: strengthening EFSA’s capacity to assess dietary exposure at different levels of the food chain, from raw primary commodities to foods as consumed.. EFSA Journal 2019;, 2019. [DOI]
- Approval report – Proposal P1042 Low THC Hemp Seeds as Food. Available online:. 2017a
- Updated estimates of dietary exposure to 9‐tetrahydrocannabinol (THC) and cannabidiol (CBD) from foods containing low THC hemp seed (at Approval) – Proposal P1042 Low THC Hemp Seeds as Food. Available online:. 2017b
- Principles and Methods for the Risk Assessment of Chemicals in Food, International Programme on Chemical Safety, Environmental Health Criteria 240. Chapter 6: Dietary Exposure Assessment of Chemicals in Food.. 2009