Associations of mitochondrial genomic variation with corticobasal degeneration, progressive supranuclear palsy, and neuropathological tau measures
Abstract
Electronic supplementary material:
The online version of this article (10.1186/s40478-020-01035-z) contains supplementary material, which is available to authorized users.
Article type: Research Article
Keywords: Progressive supranuclear palsy, Corticobasal degeneration, mtDNA, Mitochondrial haplogroups, Tauopathy, Neuropathology
Affiliations: grid.417467.70000 0004 0443 9942Department of Neuroscience, Mayo Clinic, Jacksonville, FL 32224 USA; grid.417467.70000 0004 0443 9942SURF Program Neuroscience, Mayo Clinic, Jacksonville, FL 32224 USA; grid.417467.70000 0004 0443 9942Division of Biomedical Statistics and Informatics, Mayo Clinic, Jacksonville, FL 32224 USA; grid.417467.70000 0004 0443 9942Department of Neurology, Mayo Clinic, Jacksonville, FL 32224 USA; grid.417467.70000 0004 0443 9942Department of Clinical Genomics, Mayo Clinic, Jacksonville, FL 32224 USA; grid.417467.70000 0004 0443 9942Neuroscience Track, Mayo Graduate School, Mayo Clinic, Jacksonville, FL 32224 USA
License: © The Author(s) 2020 CC BY 4.0 Open AccessThis article is licensed under a Creative Commons Attribution 4.0 International License, which permits use, sharing, adaptation, distribution and reproduction in any medium or format, as long as you give appropriate credit to the original author(s) and the source, provide a link to the Creative Commons licence, and indicate if changes were made. The images or other third party material in this article are included in the article’s Creative Commons licence, unless indicated otherwise in a credit line to the material. If material is not included in the article’s Creative Commons licence and your intended use is not permitted by statutory regulation or exceeds the permitted use, you will need to obtain permission directly from the copyright holder. To view a copy of this licence, visit http://creativecommons.org/licenses/by/4.0/. The Creative Commons Public Domain Dedication waiver (http://creativecommons.org/publicdomain/zero/1.0/) applies to the data made available in this article, unless otherwise stated in a credit line to the data.
Article links: DOI: 10.1186/s40478-020-01035-z | PubMed: 32943110 | PMC: PMC7495714
Relevance: Relevant: mentioned in keywords or abstract
Full text: PDF (1.2 MB)
Introduction
Progressive supranuclear palsy (PSP) and Corticobasal degeneration (CBD) are rare progressive neurodegenerative movement disorders [ref. 1, ref. 2]. PSP typically presents clinically with early falls, supranuclear vertical gaze palsy, parkinsonism, and dementia at about 65 years of age [ref. 3]. Individuals with CBD often present with progressive asymmetric rigidity and apraxia, loss of coordination, tremor, bradykinesia, akinesia, and occasionally alien limb syndrome [ref. 4, ref. 5]. Both diseases have overlapping clinical symptoms with each other and other neurodegenerative diseases, such as Parkinson’s disease (PD) and Alzheimer’s disease (AD) [ref. 3, ref. 6–ref. 8]. This can result in an inaccurate clinical diagnosis; definitive diagnosis is only achieved post-mortem using specific neuropathological diagnostic criteria [ref. 9, ref. 10].
Neuropathologically, PSP and CBD are characterised as primary four-repeat (4R) tauopathies, with tau-positive aggregates in the form of neurofibrillary tangles (NFT), tufted astrocytes (TA), astrocytic plaques (AP), neuropil threads (NT), and oligodendroglia coiled bodies (CB), evident in the basal ganglia, diencephalon, and brainstem in PSP [ref. 11, ref. 12], and in the substantia nigra and locus coeruleus in CBD [ref. 10]. Although generally considered sporadic disorders, MAPT, which encodes microtubule associated protein tau, is consistently documented as a strong genetic risk factor for both PSP and CBD [ref. 13, ref. 14], and genetic variation in MAPT influences tau pathology severity in PSP [ref. 15]. Other genetic factors have also been identified however they do not explain complete disease aetiology [ref. 11, ref. 13, ref. 14, ref. 16].
Age is the major risk factor for PSP and CBD, and mitochondrial health is well-established to contribute significantly to healthy ageing [ref. 17]. Mitochondrial dysfunction is also recognised in PSP pathogenesis as well as other clinically similar diseases such as PD and AD [ref. 18–ref. 21]. More specifically, defective mitochondria generate reactive oxygen species (ROS) which oxidise proteins, lipids, and nucleic acids, accelerating the ageing process [ref. 22]. ROS is suggested to contribute to the accumulation of insoluble proteinaceous deposits, such as Lewy bodies in PD, and senile plaques and NFT in AD [ref. 23–ref. 25], and dysfunction of complex I in the oxidative phosphorylation (OXPHOS) system has been shown to accelerate 4R tau isoform formation in PSP cell lines [ref. 26] and is defective in the substantia nigra of PD patients [ref. 27, ref. 28].
Mitochondria contain their own double-stranded, circular 16.6 kilo-base pair genome (mtDNA), independent to nuclear DNA (nDNA). mtDNA encodes 37 polypeptides, of which 13 encode vital OXPHOS subunits. An individual cell can contain hundreds to thousands of mtDNA copies which significantly affects cellular metabolic background [ref. 29]. mtDNA also contains stable single nucleotide polymorphisms which define individuals to specific haplogroups. Individual mtDNA haplogroups have distinctive metabolic demands [ref. 30, ref. 31] and haplogroup bioefficiency has also been shown to affect ageing and risk of developing many neurodegenerative diseases, including PD and AD [ref. 31–ref. 34].
Despite evidence reporting mitochondrial dysfunction in PSP, no studies have examined if mtDNA background influences PSP or CBD risk or if mtDNA variation can contribute to overall tau pathology severity. Thus, herein we examine the association of mtDNA background with PSP and CBD risk and tau pathology severity in two autopsy-defined series.
Methods
Study design
1042 pathologically confirmed PSP cases, 171 pathologically confirmed CBD cases, and 910 neurologically healthy controls were included. All subjects were of self-reported European descent. PSP samples were donated between 1998 and 2016 and CBD samples were collected between 1994 and 2017. All samples were obtained from the CurePSP Brain Bank at Mayo Clinic Jacksonville and were rendered by a single neuropathologist (DWD) following published criteria [ref. 8, ref. 10, ref. 35]. Controls were recruited from 1998 to 2015 through the clinical Neurology department at Mayo Clinic Jacksonville, Florida. Demographic information is summarised in Table 1. Age of onset and disease duration was unavailable for 606 PSP and was not available for CBD cases. This study was approved by the Mayo Clinic Institutional Review Board and individual written consent was obtained from all subjects, or their next of kin, prior to commencement.
Table 1: Summary of cohort characteristics in N = 1042 PSP cases, 171 CBD cases, and N = 910 controls
| Variable | PSP cases (N = 1042) | CBD cases (N = 171) | Controls (N = 910) |
|---|---|---|---|
| Age (years) | 75 (45, 98) | 70 (46, 96) | 79 (41, 102) |
| Sex | |||
| Male | 564 (54.1%) | 89 (52.0%) | 388 (42.6%) |
| Female | 478 (45.9%) | 82 (48.0%) | 522 (57.4%) |
| Age of onset (years) | 68 (41, 90) | – | – |
| Disease duration (years) | 7 (1, 32) | – | – |
| PSP clinical subtype | |||
| Richardson | 568 (74.4%) | – | – |
| Non-Richardson | 195 (25.6%) | – | – |
| Braak stage | |||
| 0 | 113 (14.8%) | 20 (13.3%) | – |
| I | 127 (16.6%) | 32 (21.3%) | – |
| II | 223 (29.2%) | 50 (33.3%) | – |
| III | 234 (30.6%) | 39 (26.0%) | – |
| IV | 50 (6.5%) | 7 (4.7%) | – |
| V | 11 (1.4%) | 1 (0.7%) | – |
| VI | 6 (0.8%) | 1 (0.7%) | – |
| Thal phase | |||
| 0 | 336 (44.0%) | 82 (54.7%) | – |
| 1 | 125 (16.4%) | 30 (20.0%) | – |
| 2 | 52 (6.8%) | 14 (9.3%) | – |
| 3 | 188 (24.6%) | 19 (12.7%) | – |
| 4 | 43 (5.6%) | 3 (2.0%) | – |
| 5 | 20 (2.6%) | 2 (1.3%) | – |
| CB tau pathology score | 1.50 (0.25, 2.36) | 0.76 (0.23, 1.75) | – |
| NFT tau pathology score | 2.23 (0.83, 2.89) | 2.19 (0.99, 2.67) | – |
| TA/AP tau pathology score | 1.00 (0.06, 2.00) | 0.52 (0.24, 1.04) | – |
| NT tau pathology score | 2.15 (0.35, 2.90) | 2.52 (1.23, 2.95) | – |
The sample median (minimum, maximum) is given for continuous variables. CB = coiled bodies; NFT = neurofibrillary tangles; TA = tufted astrocytes; AP = astrocytic plaques; NT = neuropil threads
Neuropathological assessment
Semi-quantitative tau pathology scores in PSP and CBD cases were determined by a single neuropathologist (DWD) using standardized histopathologic methods and phospho-tau immunochemistry. Scores were generated in a subset of cases (PSP: N = 764, CBD: N = 150) on a four-point severity scale (0 = none, 1 = mild, 2 = moderate, and 3 = severe) [ref. 36]. All sections from all cases were processed in an identical manner with phospho-tau monoclonal antibody (CP13, from Dr. Peter Davies, Feinstein Institute, Long Island, NY) and immunohistochemistry using a DAKO Autostainer. NFT (PSP: N = 764, CBD: N = 150), CB (PSP: N = 763, CBD: N = 150), TA/AP (PSP: N = 734, CBD: N = 150), and NT (PSP: N = 763, CBD: N = 149) were assessed, and overall scores in 17–20 different, vulnerable neuroanatomical regions in PSP/CBD were generated for each separate tau pathology measure (Additional file 1: Table S1). Mean semi-quantitative measures were then calculated for each PSP/CBD patient across all anatomical regions, where a higher overall score indicated more severe tau pathology. PSP/CBD patients who did not have tau scores in a given region for a given tau pathology measure had their scores imputed by using the mean of the values of the patients in the given disease group (PSP or CBD) who did have scores. Any patients with missing data for > 50% of neuroanatomical regions for a given tau pathology measure were not included in any analysis involving tau pathology measures. PSP and CBD cases were additionally assessed for Alzheimer-type pathology with thioflavin-S fluorescent microscopy. Thioflavin-S predominantly binds to 3R and 4R tau molecules which form paired-helical filaments in AD pathology [ref. 37, ref. 38]. As PSP/CBD are pure 4R tauopathies, with straight filament NFT [ref. 39], thioflavin S is specifically used to assign Braak NFT stage and should not detect PSP/CBD NFT. Braak NFT stage [ref. 40] and Thal amyloid phase [ref. 41] were generated for each case based on the density and distribution of plaques and tangles, as previously detailed [ref. 42, ref. 43] (Table 1).
DNA preparation and genotyping
Genomic DNA and mtDNA was extracted from peripheral blood lymphocytes from control subjects and from frozen cerebellum brain tissue from PSP and CBD cases using Autogen Flex Star and Autogen 245T (Holliston, MA) methods respectively. mtDNA in all samples was genotyped on two high multiplex custom-designed iPlex assays (consisting of 39 mtDNA SNPs—Fig. 1) using Sequenom MassARRAY iPlex technology (MALDI-TOF MS) and iPlex® Gold chemistry technology [ref. 44]. PCR and sequence-specific extension primers were designed through Sequenom’s MassARRAY Typer 4.0 Designer software (version 0.2) (Additional file 1: Table S2), part of the Assay Design Suite (Agena Bioscience™, San Diego, USA), and were manufactured by Integrated DNA Technologies (IDT, San Diego, USA). Genotypes were determined by Sequenom MassARRAY® Bruker mass spectrometry (Agena Bioscience, San Diego, CA, USA) [ref. 44] and were accepted if intensities were > 5 from the base line intensity (< 5 was considered noise). Individuals with a genotyping call rate > 95% were accepted and had mtDNA haplogroups determined. Genotyping analysis was conducted using Sequenom’s Typer 4.0 Analyzer software (version 25.73). Additional details are provided in Additional file 1: Supplementary Methods.
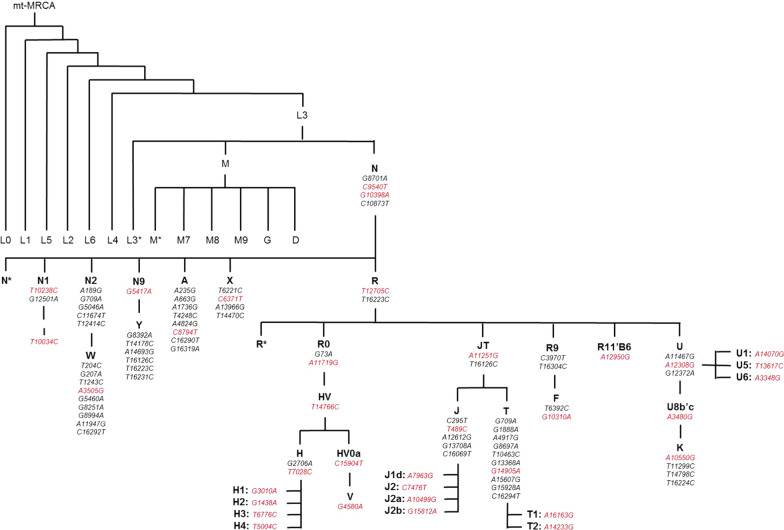
Mitochondrial DNA haplogroup assignment
Mitochondrial DNA haplogroups were manually defined to mitochondrial phylogeny [ref. 45, ref. 46] (Fig. 1). Haplogroups and sub-haplogroups were determined whereby patterns of mtDNA SNPs had to sequentially be present down the phylotree and not present in other phylogenetic clades (refer to Additional file 1 for further details). For use in secondary analysis, super-haplogroups were determined by combining phylogenetic-related haplogroups together (Additional file 1). Over 95% of individuals in European populations classify as one of the following mtDNA haplogroups—H, V, J, T, I, X, W, U, or K [ref. 47], therefore individuals with a non-European mitochondrial haplogroups (e.g. non-N, A, F, and B) were removed from analysis.
Statistical analysis
Associations of mitochondrial haplogroups with risk of PSP and CBD (each separately versus controls) were evaluated using logistic regression models that were adjusted for age and sex. Odds ratios (ORs) and 95% confidence intervals (CIs) were estimated. In analysis of only PSP or CBD patients, linear regression models were used to assess associations of mitochondrial haplogroups with PSP disease duration, age of PSP onset, and tau pathology scores of; CB, NFT, TA, AP, and NT. Models were adjusted for age of PSP onset and sex (models involving PSP disease duration), for sex (models involving age of PSP onset), and for age at death, sex, Braak stage, and Thal phase (models involving CB, NFT, TA, AP, and NT tau pathology scores).
Haplogroups that occurred in < 10 subjects for a given association analysis were not included in that analysis. For the primary analysis (i.e. all analysis not involving super-haplogroups), a Bonferroni correction was applied for multiple testing separately for each group of similar statistical tests. Specifically, P values ≤ 0.0021 (associations with PSP), ≤ 0.0024 (associations with CBD), ≤ 0.0026 (associations with disease duration and age of PSP onset), ≤ 0.0024 and ≤ 0.0045 (associations with tau pathology scores in either PSP or CBD cases respectively) were considered to be statistically significant. No adjustment for multiple testing was made for secondary analysis involving super-haplogroups and P values ≤ 0.05 were considered significant. A power analysis regarding associations of mitochondrial haplogroups with disease risk and tau pathology scores is displayed in Additional file 1: Table S3. Statistical analyses were performed using R Statistical Software (version 3.6.1).
Results
Mitochondrial DNA haplogroup frequencies in our control cohort were representative of European populations (Table 2) [ref. 46] and were considered an appropriate reference cohort to investigate mtDNA background associations with risk of PSP and CBD. Individuals carrying non-European mtDNA haplogroups (non-N, A, F, and B) were previously removed to ensure individuals from European descent were assessed. In analysis that was adjusted for age and sex, to remove possible confounding influences, and after correcting for multiple testing (P ≤ 0.0021 considered significant), there were no significant associations between individual mtDNA haplogroups and PSP risk (all P ≥ 0.041, Table 2). We did observe a significant association between mtDNA haplogroup H4 and an increased risk of CBD (5.3% vs. 1.2%, OR = 4.51, P = 0.001, Table 2). Secondary analyses examining associations of mtDNA super-haplogroups with risk of PSP and CBD are displayed in Additional file 1: Table S4; no strong associations were identified.
Table 2: Associations of individual mitochondrial DNA haplogroups with risk of PSP and CBD (compared to controls) were evaluated using multivariable logistic regression models adjusted for age and sex
| Mitochondrial DNA Haplogroup | Haplogroup frequency, No. (%) | PSP versus controls | CBD versus controls | ||||
|---|---|---|---|---|---|---|---|
| Controls (N = 910) | PSP patients (N = 1042) | CBD patients (N = 171) | OR (95% CI) | P value | OR (95% CI) | P value | |
| Na | 2 (0.2%) | 0 (0.0%) | 0 (0.0%) | – | – | – | – |
| N1 | 5 (0.5%) | 6 (0.6%) | 0 (0.0%) | 1.08 (0.33, 3.58) | 0.90 | – | – |
| I | 31 (3.4%) | 23 (2.2%) | 2 (1.2%) | 0.56 (0.32, 0.98) | 0.041 | 0.24 (0.06, 1.05) | 0.058 |
| W | 15 (1.6%) | 22 (2.1%) | 3 (1.8%) | 1.37 (0.70, 2.67) | 0.36 | 1.27 (0.35, 4.54) | 0.72 |
| X | 8 (0.9%) | 18 (1.7%) | 5 (2.9%) | 1.90 (0.81, 4.43) | 0.14 | 3.48 (1.07, 11.33) | 0.039 |
| R and R0a | 6 (0.7%) | 10 (1.0%) | 2 (1.2%) | 1.33 (0.48, 3.72) | 0.58 | – | – |
| HV and HV0a | 22 (2.4%) | 16 (1.5%) | 2 (1.2%) | 0.67 (0.35, 1.30) | 0.24 | 0.54 (0.12, 2.35) | 0.41 |
| H, H1, H2, H3, and H4 | 423 (46.5%) | 469 (45.0%) | 84 (49.1%) | 0.94 (0.78, 1.13) | 0.50 | 1.11 (0.79, 1.55) | 0.54 |
| H | 199 (21.9%) | 200 (19.2%) | 30 (17.5%) | 0.84 (0.68, 1.05) | 0.14 | 0.76 (0.49, 1.17) | 0.21 |
| H1 | 145 (15.9%) | 171 (16.4%) | 31 (18.1%) | 1.03 (0.80, 1.31) | 0.84 | 1.16 (0.75, 1.79) | 0.52 |
| H2 | 36 (4.0%) | 34 (3.3%) | 5 (2.9%) | 0.78 (0.48, 1.27) | 0.32 | 0.65 (0.25, 1.73) | 0.39 |
| H3 | 32 (3.5%) | 49 (4.7%) | 9 (5.3%) | 1.47 (0.93, 2.33) | 0.10 | 1.76 (0.81, 3.83) | 0.16 |
| H4 | 11 (1.2%) | 15 (1.4%) | 9 (5.3%) | 1.18 (0.54, 2.60) | 0.68 | 4.51 (1.8, 11.31) | 0.001 |
| V | 18 (2.0%) | 29 (2.8%) | 3 (1.8%) | 1.37 (0.75, 2.50) | 0.31 | 0.79 (0.23, 2.79) | 0.72 |
| JTa | 2 (0.2%) | 3 (0.3%) | 0 (0.0%) | – | – | – | – |
| J1, J1d, J2a, and J2b | 93 (10.2%) | 125 (12.0%) | 18 (10.5%) | 1.23 (0.92, 1.64) | 0.15 | 1.11 (0.65, 1.92) | 0.70 |
| J1 | 72 (7.9%) | 98 (9.4%) | 17 (9.9%) | 1.23 (0.89, 1.69) | 0.21 | 1.35 (0.76, 2.39) | 0.30 |
| J1da | 1 (0.1%) | 0 (0.0%) | 0 (0.0%) | – | – | – | – |
| J2a | 13 (1.4%) | 24 (2.3%) | 1 (0.6%) | 1.77 (0.89, 3.53) | 0.10 | 0.49 (0.06, 3.84) | 0.50 |
| J2b | 7 (0.8%) | 3 (0.3%) | 0 (0.0%) | 0.39 (0.10, 1.52) | 0.17 | – | – |
| T, T1, and T2 | 77 (8.5%) | 102 (9.8%) | 22 (12.9%) | 1.20 (0.88, 1.64) | 0.26 | 1.72 (1.02, 2.89) | 0.042 |
| Ta | 0 (0.0%) | 2 (0.2%) | 1 (0.6%) | – | – | – | – |
| T1 | 17 (1.9%) | 22 (2.1%) | 4 (2.3%) | 1.10 (0.58, 2.10) | 0.77 | 1.16 (0.37, 3.6) | 0.80 |
| T2 | 60 (6.6%) | 78 (7.5%) | 17 (9.9%) | 1.19 (0.84, 1.70) | 0.33 | 1.74 (0.97, 3.11) | 0.063 |
| U, U1, U3, U5, and U6 | 130 (14.3%) | 138 (13.2%) | 19 (11.1%) | 0.88 (0.68, 1.15) | 0.36 | 0.71 (0.42, 1.19) | 0.19 |
| U | 44 (4.8%) | 56 (5.4%) | 7 (4.1%) | 1.07 (0.71, 1.61) | 0.74 | 0.84 (0.36, 1.92) | 0.68 |
| U1a | 1 (0.1%) | 1 (0.1%) | 0 (0.0%) | – | – | – | – |
| U3a | 8 (0.9%) | 0 (0.0%) | 0 (0.0%) | – | – | – | – |
| U5 | 74 (8.1%) | 80 (7.7%) | 12 (7.0%) | 0.92 (0.66, 1.28) | 0.60 | 0.79 (0.41, 1.51) | 0.48 |
| U6a | 3 (0.3%) | 1 (0.1%) | 0 (0.0%) | – | – | – | – |
| K | 78 (8.6%) | 80 (7.7%) | 11 (6.4%) | 0.92 (0.66, 1.28) | 0.62 | 0.72 (0.37, 1.41) | 0.35 |
After applying a Bonferroni correction for multiple testing, association P values ≤ 0.0021 (PSP vs. controls analysis) and ≤ 0.0024 (CBD vs. controls) are considered statistically significant
aStatistical tests were not performed for these haplogroups owing to their rare frequency (< 10 subjects in the given haplogroup for the given comparison [PSP vs. controls or CBD vs. controls]). OR = odds ratio; CI = confidence interval at 95%
Associations of individual mtDNA haplogroups with tau pathology scores of CB, NFT, TA, and NT in PSP and of CB, NFT, AP, and NT in CBD are summarised in Tables 3 and 4, respectively. After correction for multiple testing (P ≤ 0.0024 considered significant) and when adjusting for age at death, sex, Braak stage, and Thal phase, PSP individuals with a haplogroup HV and HV0a background (N = 10) had significantly lower NT pathology (P = 0.0023, Table 3) compared to other individuals; mean NT tau pathology scores were 0.35 units lower for haplogroup HV and HV0a cases (Additional file 1: Figure S1A). Additionally, although not quite statistically significant, mean NFT tau pathology score was 0.09 units lower for individuals with PSP and mtDNA haplogroup T, T1, and T2 backgrounds (N = 85) compared to other individuals (P = 0.009, Additional file 1: Figure S1B). No super-haplogroups reported significant associations with tau pathology measures in PSP in secondary analyses (Additional file 1: Table S5). No individual mtDNA haplogroups were significantly associated with any tau pathology measures in CBD (Table 4), however in secondary analysis super-haplogroup UK reported a lower CB tau pathology (Additional file 1: Table S6, P = 0.014).
Table 3: Associations of individual mitochondrial DNA haplogroups with CB, NFT, AP, and NT tau pathology scores in PSP cases with measured tau pathology scores (N = 764) from linear regression models that were adjusted for age at death, sex, Braak, and Thal phase
| Mitochondrial DNA Haplogroup | No. (%) in haplogroup (N = 764) | Association with CB tau pathology score | Association with NFT tau pathology score | Association with AP tau pathology score | Association with NT tau pathology score | ||||
|---|---|---|---|---|---|---|---|---|---|
| Regression coefficient (95% CI) | P value | Regression coefficient (95% CI) | P value | Regression coefficient (95% CI) | P value | Regression coefficient (95% CI) | P value | ||
| I | 18 (2.4%) | 0.05 (−0.11, 0.21) | 0.53 | 0.05 (−0.09, 0.20) | 0.47 | −0.03 (−0.20, 0.13) | 0.70 | 0.01 (−0.17, 0.18) | 0.94 |
| W | 16 (2.1%) | 0.03 (−0.14, 0.20) | 0.70 | 0.09 (−0.07, 0.25) | 0.26 | −0.10 (−0.27, 0.08) | 0.29 | 0.05 (−0.13, 0.23) | 0.59 |
| X | 17 (2.2%) | −0.12 (−0.28, 0.05) | 0.16 | −0.07 (−0.22, 0.08) | 0.38 | −0.07 (−0.24, 0.10) | 0.41 | −0.12 (−0.30, 0.06) | 0.18 |
| R and R0a | 5 (0.7%) | – | – | – | – | – | – | – | – |
| HV and HV0a | 10 (1.3%) | −0.04 (−0.25, 0.17) | 0.70 | −0.09 (−0.29, 0.10) | 0.36 | −0.28 (−0.49, −0.06) | 0.012 | −0.35 (−0.58, −0.13) | 0.0023 |
| H, H1, H2, H3 and H4 | 337 (44.1%) | 0.02 (−0.03, 0.06) | 0.54 | 0.04 (0.00, 0.09) | 0.055 | 0.01 (−0.04, 0.06) | 0.81 | 0.05 (0.00, 0.10) | 0.065 |
| H | 150 (19.6%) | 0.03 (−0.03, 0.09) | 0.28 | 0.05 (−0.01, 0.11) | 0.082 | 0.01 (−0.05, 0.08) | 0.70 | 0.05 (−0.02, 0.11) | 0.14 |
| H1 | 120 (15.7%) | −0.02 (−0.09, 0.04) | 0.48 | 0.01 (−0.05, 0.07) | 0.70 | −0.04 (−0.11, 0.03) | 0.30 | 0.00 (−0.07, 0.07) | 0.95 |
| H2 | 25 (3.3%) | 0.02 (−0.12, 0.15) | 0.82 | 0.09 (−0.04, 0.22) | 0.16 | 0.04 (−0.10, 0.18) | 0.61 | 0.06 (−0.08, 0.21) | 0.41 |
| H3 | 32 (4.2%) | −0.01 (−0.13, 0.11) | 0.92 | 0.00 (−0.11, 0.11) | 0.97 | 0.09 (−0.04, 0.21) | 0.17 | 0.05 (−0.08, 0.18) | 0.42 |
| H4 | 10 (1.3%) | 0.11 (−0.10, 0.32) | 0.31 | −0.11 (−0.30, 0.09) | 0.28 | −0.03 (−0.28, 0.21) | 0.78 | 0.00 (−0.23, 0.23) | 0.99 |
| V | 19 (2.5%) | −0.05 (−0.20, 0.11) | 0.55 | −0.12 (−0.27, 0.02) | 0.095 | 0.06 (−0.10, 0.21) | 0.49 | −0.10 (−0.27, 0.07) | 0.24 |
| J1 and J2a | 88 (11.5%) | −0.01 (−0.08, 0.07) | 0.84 | 0.01 (−0.06, 0.08) | 0.80 | 0.00 (−0.08, 0.08) | 0.95 | −0.06 (−0.15, 0.02) | 0.12 |
| J1 | 69 (9.0%) | 0.01 (−0.07, 0.10) | 0.73 | 0.03 (−0.05, 0.10) | 0.51 | 0.01 (−0.08, 0.10) | 0.77 | −0.05 (−0.14, 0.04) | 0.31 |
| J2a | 17 (2.2%) | −0.11 (−0.28, 0.05) | 0.18 | −0.07 (−0.22, 0.08) | 0.36 | −0.05 (−0.22, 0.13) | 0.61 | −0.14 (−0.31, 0.04) | 0.13 |
| T, T1 and T2 | 85 (11.1%) | −0.02 (−0.10, 0.05) | 0.57 | −0.09 (−0.17, −0.02) | 0.009 | 0.02 (−0.06, 0.10) | 0.61 | −0.04 (−0.12, 0.04) | 0.37 |
| Ta | 2 (0.3%) | – | – | – | – | – | – | – | – |
| T1 | 19 (2.5%) | 0.04 (−0.12, 0.19) | 0.62 | −0.07 (−0.22, 0.07) | 0.32 | 0.08 (−0.08, 0.24) | 0.32 | 0.04 (−0.13, 0.21) | 0.64 |
| T2 | 64 (8.4%) | −0.05 (−0.13, 0.04) | 0.30 | −0.1 (−0.18, −0.02) | 0.011 | 0.00 (−0.09, 0.09) | 0.99 | −0.07 (−0.16, 0.02) | 0.15 |
| U and U5 | 104 (13.6%) | 0.00 (−0.07, 0.07) | 0.90 | 0.01 (−0.06, 0.07) | 0.86 | 0.01 (−0.07, 0.08) | 0.85 | 0.03 (−0.04, 0.11) | 0.42 |
| U | 42 (5.5%) | −0.05 (−0.16, 0.06) | 0.36 | 0.05 (−0.05, 0.14) | 0.35 | 0.01 (−0.10, 0.12) | 0.83 | 0.04 (−0.07, 0.15) | 0.48 |
| U5 | 61 (8.0%) | 0.03 (−0.06, 0.12) | 0.57 | −0.03 (−0.11, 0.06) | 0.54 | 0.00 (−0.10, 0.09) | 0.92 | 0.02 (−0.08, 0.11) | 0.72 |
| K | 56 (7.3%) | 0.02 (−0.08, 0.11) | 0.73 | 0.01 (−0.08, 0.09) | 0.90 | 0.01 (−0.08, 0.11) | 0.77 | 0.03 (−0.07, 0.13) | 0.61 |
Regression coefficients are interpreted as the increase in mean CB, NFT, AP, or NT tau pathology scores for patients in the given mitochondrial DNA haplogroup compared to patients not in the given haplogroup (non-haplogroup). P values ≤ 0.0024 are considered statistically significant after applying a Bonferroni correction for multiple testing
aStatistical tests were not performed for these haplogroups owing to their rare frequency (< 10 PSP cases in the given haplogroup). CB = coiled bodies; NFT = neurofibrillary tangles; AP = astrocytic plaques; NT = neuropil threads; CI = confidence interval
Table 4: Associations of individual mitochondrial DNA haplogroups with CB, NFT, TA, and NT tau pathology scores in CBD cases with measured tau pathology scores (N = 150) from linear regression models that were adjusted for age at death, sex, Braak, and Thal phase
| Mitochondrial DNA Haplogroup | No. (%) in haplogroup (N = 150) | Association with CB tau pathology score | Association with NFT tau pathology score | Association with TA tau pathology score | Association with NT tau pathology score | ||||
|---|---|---|---|---|---|---|---|---|---|
| Regression coefficient (95% CI) | P Value | Regression coefficient (95% CI) | P Value | Regression coefficient (95% CI) | P Value | Regression coefficient (95% CI) | P Value | ||
| Ia | 1 (0.7%) | – | – | – | – | – | – | – | – |
| Wa | 3 (2.0%) | – | – | – | – | – | – | – | – |
| Xa | 4 (2.7%) | – | – | – | – | – | – | – | – |
| R and R0a | 2 (1.3%) | – | – | – | – | – | – | – | – |
| HV and HV0aa | 2 (1.3%) | – | – | – | – | – | – | – | – |
| H, H1, H2, H3 and H4 | 71 (47.3%) | 0.02 (−0.07, 0.11) | 0.68 | −0.02 (−0.10, 0.06) | 0.65 | 0.00 (−0.04, 0.05) | 0.83 | −0.04 (−0.13, 0.05) | 0.43 |
| H | 25 (16.7%) | 0.03 (−0.09, 0.15) | 0.66 | 0.11 (0.00, 0.22) | 0.046 | 0.01 (−0.05, 0.07) | 0.78 | 0.09 (−0.03, 0.21) | 0.16 |
| H1 | 26 (17.3%) | 0.05 (−0.07, 0.17) | 0.45 | −0.09 (−0.20, 0.03) | 0.13 | 0.00 (−0.06, 0.06) | 0.99 | −0.04 (−0.17, 0.08) | 0.48 |
| H2a | 4 (2.7%) | – | – | – | – | – | – | – | – |
| H3a | 8 (5.3%) | – | – | – | – | – | – | – | – |
| H4 | 8 (5.3%) | −0.08 (−0.28, 0.11) | 0.41 | 0.12 (−0.07, 0.30) | 0.22 | 0.04 (−0.06, 0.13) | 0.43 | 0.10 (−0.10, 0.30) | 0.33 |
| Va | 3 (2.0%) | – | – | – | – | – | – | – | – |
| J1 and J2a | 14 (9.3%) | 0.09 (−0.06, 0.25) | 0.23 | −0.01 (−0.15, 0.13) | 0.90 | 0.02 (−0.06, 0.09) | 0.65 | 0.09 (−0.06, 0.25) | 0.25 |
| J1 | 13 (8.7%) | 0.07 (−0.09, 0.23) | 0.40 | −0.01 (−0.16, 0.14) | 0.90 | −0.01 (−0.09, 0.06) | 0.73 | 0.08 (−0.08, 0.24) | 0.34 |
| J2aa | 1 (0.7%) | – | – | – | – | – | – | – | – |
| T, T1 and T2 | 21 (14.0%) | 0.08 (−0.05, 0.21) | 0.24 | 0.03 (−0.09, 0.15) | 0.59 | 0.02 (−0.04, 0.09) | 0.44 | 0.01 (−0.12, 0.14) | 0.90 |
| Ta | 1 (0.7%) | – | – | – | – | – | – | – | – |
| T1a | 4 (2.7%) | – | – | – | – | – | – | – | – |
| T2 | 16 (10.7%) | 0.10 (−0.05, 0.24) | 0.19 | 0.02 (−0.12, 0.15) | 0.80 | 0.02 (−0.11, 0.16) | 0.73 | 0.00 (−0.14, 0.15) | 0.97 |
| U and U5 | 18 (12.0%) | −0.11 (−0.24, 0.03) | 0.12 | 0.01 (−0.11, 0.14) | 0.82 | −0.05 (−0.11, 0.02) | 0.16 | −0.06 (−0.20, 0.08) | 0.40 |
| Ua | 7 (4.7%) | – | – | – | – | – | – | – | – |
| U5 | 11 (7.3%) | 0.02 (−0.15, 0.20) | 0.78 | 0.01 (−0.15, 0.17) | 0.94 | −0.07 (−0.15, 0.01) | 0.11 | 0.02 (−0.15, 0.20) | 0.78 |
| K | 11 (7.3%) | −0.16 (−0.33, 0.01) | 0.073 | −0.05 (−0.21, 0.11) | 0.56 | −0.01 (−0.09, 0.07) | 0.82 | −0.03 (−0.21, 0.14) | 0.71 |
Regression coefficients are interpreted as the increase in mean CB, NFT, TA, or NT tau pathology scores for patients in the given mitochondrial DNA haplogroup compared to patients not in the given haplogroup (non-haplogroup). P values ≤ 0.0045 are considered statistically significant after applying a Bonferroni correction for multiple testing
aStatistical tests were not performed for these haplogroups owing to their rare frequency (< 10 PSP cases in the given haplogroup, with the exception of haplogroup H4 which was examined despite the fact that it occurred in only 8 cases owing to the fact that it was of specific interest due to its significant association with risk of CBD). CB = coiled bodies; NFT = neurofibrillary tangles; TA = tufted astrocytes; NT = neuropil threads; CI = confidence interval
Mitochondrial DNA background was not strongly associated with age of onset or disease duration in PSP (Additional file 1: Table S7); however, there was a suggestive association between mtDNA haplogroup W (N = 11) and a longer disease duration in PSP (P = 0.004, Additional file 1: Figure S1C). Key findings of our study are summarised in Additional file 1: Figure S2.
Discussion
Mitochondrial health plays a significant role in ageing and the development of neurodegenerative diseases, including tauopathy [ref. 17–ref. 21]; however population specific mtDNA variation has not been investigated in PSP and CBD. Our findings indicate that major mtDNA haplogroups do not associate with risk of PSP; however, individuals with mtDNA sub-haplogroup H4 background may be at an increased risk of CBD. In PSP cases, individuals with mtDNA haplogroup HV/HV0a backgrounds had a decreased NT tau pathology and individuals with a haplogroup T (including T1 and T2) background had mildly reduced NFT tau pathology levels. No mtDNA haplogroups were significantly associated with tau pathology severity in CBD cases.
mtDNA sub-haplogroup H4, which was associated with an increased risk of CBD, is defined by a synonymous coding variant rs41419549 which is located in the NADH dehydrogenase subunit-2 (MT–ND2) (Additional file 1: Figure S2). ND2 has been identified to play a central role in the assembly of complex I subunits [ref. 48]. CBD pathology occurs in the substantia nigra and locus coeruleus [ref. 9], which may indicate that mtDNA haplogroup H4 has a tissue specific effect on mitochondrial functionality in those regions. Albeit interesting, the absence of a H4 association with any tau pathology severity measure in CBD suggests that the presence of haplogroup H4 may be accelerating degeneration rather than enhancing tau aggregation. Despite the strong effect size (OR = 4.51) and the fact that this association survived a stringent Bonferroni correction for multiple testing, as the H4 mtDNA haplogroup occurred in a small number of CBD patients (N = 9), validation of this finding will be important.
Regarding mtDNA haplogroup HV/HV0a, which was associated with less NT tau pathology in PSP cases, haplogroup HV is defined by a single missense variant rs193302980 in the cytochrome-b subunit of complex III (MT–CYB) and haplogroup HV0a is defined by a unique variant rs35788393 located adjacent to MT–CYB in the coding region for tRNA-threonine (Additional file 1: Figure S2). Cytochrome-b is a vital component of complex III and ND6 is a subunit of complex I. Both complex I and III are important components of the OXPHOS pathway, and have been identified as major drivers of neurodegeneration and dysfunction of complex I has also been shown to accelerate 4R tau isoform formation in PSP cell lines [ref. 26, ref. 27]. Again, despite the statistically significant association between mtDNA haplogroup HV/HV0a background and NT severity, replication of this finding will be key given that there were only 10 HV/HV0a PSP cases.
Although this is the first study to report significant associations of mtDNA variation background with CBD risk and with tau pathology in PSP, several limitations need to be acknowledged. First, to the best of our knowledge, all participants in our study were of European descent based on both self-reported ethnicity as well as mtDNA haplogroup profile (non-European haplogroups were excluded). Nonetheless, given the absence of available genome-wide population control markers, which would have allowed us to adjust our regression models for genetic background (in the form of top principal components from genetic data), we cannot rule out the possibility that population stratification could have had an effect on our results.
Another limitation is the lack of a replication series. Although relatively large numbers of PSP and CBD cases were included in this study, considering the rarity of these two diseases, independent validation of our findings, as well as meta-analytic studies, will be important. Furthermore, power to detect associations was limited in the smaller CBD series and for rare haplogroups in both series.
Given the complex nature of mtDNA variation, levels of heteroplasmy may also be a concern in brain tissue. We used a PCR amplification-based MALDI-TOF MS technology which is considered sensitive enough to accurately determine alleles from pools of recombinants and is thus suitable for mtDNA-based population studies, limiting the impact of heteroplasmy and determining the individual mtDNA background [ref. 49]. Furthermore, heteroplasmy levels are assumed to be low in our cases and controls due to tissue types used and should not interfere with genotyping results in this study. In the future, performing mtDNA sequencing may identify higher impact and rarer penetrant variants. African and Asian haplogroup clades were also not investigated in this study and would need to be explored in future work. Finally, functional studies need to be performed to better understand the mechanisms by which mtDNA haplogroup background is contributing to disease risk and tau pathology severity.
Conclusions
This is the first study to characterise the role of mtDNA background in susceptibility to PSP and CBD and in tau pathology severity in general. Our data suggests that mtDNA haplogroup background may influence CBD risk and may also modify tau aggregation formation in PSP. Though larger validation studies will be key (particularly for CBD due to the smaller sample size of this group), it will also be important for future studies to investigate how established nDNA risk factors, such as the MAPT H1 haplotype, interact with mtDNA genetic background with regard to susceptibility to disease and severity of tau pathology.
Supplementary Materials
References
- A Schrag, Y Ben-Shlomo, NP Quinn. Prevalence of progressive supranuclear palsy and multiple system atrophy: a cross-sectional study. The Lancet, 1999. [DOI]
- LI Golbe. The Epidemiology of Progressive Supranuclear Palsy, 2008
- AL Boxer, J-T Yu, LI Golbe, I Litvan, AE Lang, GU Höglinger. Advances in progressive supranuclear palsy: new diagnostic criteria, biomarkers, and therapeutic approaches. Lancet Neurol, 2017. [DOI | PubMed]
- WRG Gibb, PJ Luthert, CD Marsden. Corticobasal degeneration. Brain, 1989. [DOI | PubMed]
- DE Riley, AE Lang, A Lewis, L Resch, P Ashby, O Hornykiewicz, S Black. Cortical-basal ganglionic degeneration. Neurology, 1990. [DOI | PubMed]
- BN Dugger, M Tu, ME Murray, DW Dickson. Disease specificity and pathologic progression of tau pathology in brainstem nuclei of Alzheimer’s disease and progressive supranuclear palsy. Neurosci Lett, 2011. [DOI | PubMed]
- S Fujioka, AA Algom, ME Murray, A Strongosky, AI Soto-Ortolaza, R Rademakers, OA Ross, ZK Wszolek, DW Dickson. Similarities between familial and sporadic autopsy-proven progressive supranuclear palsy. Neurology, 2013. [DOI | PubMed]
- U Höglinger Günter, G Respondek, M Stamelou, C Kurz, A Josephs Keith, E Lang Anthony, B Mollenhauer, U Müller, C Nilsson, L Whitwell Jennifer, T Arzberger, E Englund, E Gelpi, A Giese, J Irwin David, G Meissner Wassilios, A Pantelyat, A Rajput, C Swieten John, C Troakes, A Antonini, P Bhatia Kailash, Y Bordelon, Y Compta, JC Corvol, C Colosimo, W Dickson Dennis, R Dodel, L Ferguson, M Grossman, J Kassubek, F Krismer, J Levin, S Lorenzl, R Morris Huw, P Nestor, H Oertel Wolfgang, W Poewe, G Rabinovici, B Rowe James, D Schellenberg Gerard, K Seppi, T Eimeren, K Wenning Gregor, L Boxer Adam, I Golbe Lawrence, I Litvan, N Null, L Boxer Adam, A Rajput, A Pantelyat, A Antonini, E Lang Anthony, A Giese, B Mollenhauer, C Colosimo, C Kurz, C Nilsson, C Troakes, J Irwin David, W Dickson Dennis, E Gelpi, F Krismer, D Schellenberg Gerard, G Respondek, G Rabinovici, K Wenning Gregor, U Höglinger Günter, R Morris Huw, I Litvan, B Rowe James, J Kassubek, JC Corvol, L Whitwell Jennifer, J Levin, J van Swieten, P Bhatia Kailash, A Josephs Keith, K Seppi, I Golbe Lawrence, M Stamelou, M Grossman, P Nestor, R Dodel, S Lorenzl, T van Eimeren, T Arzberger, U Müller, G Meissner Wassilios, W Poewe, H Oertel Wolfgang, Y Compta, Y Bordelon. Clinical diagnosis of progressive supranuclear palsy: the movement disorder society criteria. Mov Disord, 2017. [DOI | PubMed]
- DW Dickson. Neuropathologic differentiation of progressive supranuclear palsy and corticobasal degeneration. J Neurol, 1999. [DOI | PubMed]
- DW Dickson, C Bergeron, SS Chin, C Duyckaerts, D Horoupian, K Ikeda, K Jellinger, PL Lantos, CF Lippa, SS Mirra, M Tabaton, JP Vonsattel, K Wakabayashi, I Litvan. Office of rare diseases neuropathologic criteria for corticobasal degeneration. J Neuropathol Exp Neurol, 2002. [DOI | PubMed]
- MY Sanchez-Contreras, N Kouri, CN Cook, DJ Serie, MG Heckman, NA Finch, RJ Caselli, RJ Uitti, ZK Wszolek, N Graff-Radford, L Petrucelli, L-S Wang, GD Schellenberg, DW Dickson, R Rademakers, OA Ross. Replication of progressive supranuclear palsy genome-wide association study identifies SLCO1A2 and DUSP10 as new susceptibility loci. Mol Neurodegener, 2018. [DOI | PubMed]
- GG Kovacs. Invited review: Neuropathology of tauopathies: principles and practice. Neuropathol Appl Neurobiol, 2015. [DOI | PubMed]
- V Ries, WH Oertel, GU Höglinger. Mitochondrial dysfunction as a therapeutic target in progressive supranuclear palsy. J Mol Neurosci, 2011. [DOI | PubMed]
- N Kouri, OA Ross, B Dombroski, CS Younkin, DJ Serie, A Soto-Ortolaza, M Baker, NCA Finch, H Yoon, J Kim, S Fujioka, CA McLean, B Ghetti, S Spina, LB Cantwell, MR Farlow, J Grafman, ED Huey, M Ryung Han, S Beecher, ET Geller, HA Kretzschmar, S Roeber, M Gearing, JL Juncos, JPG Vonsattel, VM Van Deerlin, M Grossman, HI Hurtig, RG Gross, SE Arnold, JQ Trojanowski, VM Lee, GK Wenning, CL White, GU Höglinger, U Müller, B Devlin, LI Golbe, J Crook, JE Parisi, BF Boeve, KA Josephs, ZK Wszolek, RJ Uitti, NR Graff-Radford, I Litvan, SG Younkin, L-S Wang, N Ertekin-Taner, R Rademakers, H Hakonarsen, GD Schellenberg, DW Dickson. Genome-wide association study of corticobasal degeneration identifies risk variants shared with progressive supranuclear palsy. Nat Commun, 2015. [DOI | PubMed]
- MG Heckman, RR Brennan, C Labbé, AI Soto, S Koga, MA DeTure, ME Murray, RC Petersen, BF Boeve, JA van Gerpen, RJ Uitti, ZK Wszolek, R Rademakers, DW Dickson, OA Ross. Association of MAPT subhaplotypes with risk of progressive supranuclear palsy and severity of tau pathology. JAMA Neurol, 2019. [DOI | PubMed]
- JA Chen, Z Chen, H Won, AY Huang, JK Lowe, K Wojta, JS Yokoyama, G Bensimon, PN Leigh, C Payan, A Shatunov, AR Jones, CM Lewis, P Deloukas, P Amouyel, C Tzourio, JF Dartigues, A Ludolph, AL Boxer, JM Bronstein, A Al-Chalabi, DH Geschwind, G Coppola. Joint genome-wide association study of progressive supranuclear palsy identifies novel susceptibility loci and genetic correlation to neurodegenerative diseases. Mol Neurodegener, 2018. [DOI | PubMed]
- MJ Keogh, PF Chinnery. Mitochondrial DNA mutations in neurodegeneration. Biochim Biophys Acta Bioenergetics, 2015. [DOI]
- DS Albers, RH Swerdlow, G Manfredi, C Gajewski, L Yang, WD Parker, MF Beal. Further evidence for mitochondrial dysfunction in progressive supranuclear palsy. Exp Neurol, 2001. [DOI | PubMed]
- AC Rego, CR Oliveira. Mitochondrial dysfunction and reactive oxygen species in excitotoxicity and apoptosis: implications for the pathogenesis of neurodegenerative diseases. Neurochem Res, 2003. [DOI | PubMed]
- RH Swerdlow, LI Golbe, JK Parks, DS Cassarino, DR Binder, AE Grawey, I Litvan, JP Bennett, GF Wooten, WD Parker. Mitochondrial dysfunction in cybrid lines expressing mitochondrial genes from patients with progressive supranuclear palsy. J Neurochem, 2000. [DOI | PubMed]
- PR Angelova, M Barilani, C Lovejoy, M Dossena, M Viganò, A Seresini, D Piga, S Gandhi, G Pezzoli, AY Abramov, L Lazzari. Mitochondrial dysfunction in Parkinsonian mesenchymal stem cells impairs differentiation. Redox Biol, 2018. [DOI | PubMed]
- J Roy, J-M Galano, T Durand, J-YL Guennec, JC-Y Lee. Physiological role of reactive oxygen species as promoters of natural defenses. FASEB J, 2017. [DOI | PubMed]
- J Choi, HD Rees, ST Weintraub, AI Levey, L-S Chin, L Li. Oxidative modifications and aggregation of Cu, Zn-superoxide dismutase associated with Alzheimer and Parkinson diseases. J Biol Chem, 2005. [DOI | PubMed]
- BI Giasson, H Ischiropoulos, VMY Lee, JQ Trojanowski. The relationship between oxidative/nitrative stress and pathological inclusions in Alzheimer’s and Parkinson’s diseases 1,211 Guest Editors: Mark A. Smith and George Perry22. This article is part of a series of reviews on “Causes and Consequences of Oxidative Stress in Alzheimer’s Disease”. Free Radic Biol Med, 2002. [DOI | PubMed]
- P Jenner. Oxidative stress in Parkinson’s disease. Ann Neurol, 2003. [DOI | PubMed]
- J Bruch, H Xu, A De Andrade, G Höglinger. Mitochondrial complex 1 inhibition increases 4-repeat isoform tau by SRSF2 upregulation. PLoS ONE, 2014. [DOI | PubMed]
- AHV Schapira, JM Cooper, D Dexter, JB Clark, P Jenner, CD Marsden. Mitochondrial complex I deficiency in Parkinson’s disease. J Neurochem, 1990. [DOI | PubMed]
- L Puspita, SY Chung, J-W Shim. Oxidative stress and cellular pathologies in Parkinson’s disease. Mol Brain, 2017. [DOI | PubMed]
- AN Malik, A Czajka. Is mitochondrial DNA content a potential biomarker of mitochondrial dysfunction?. Mitochondrion, 2013. [DOI | PubMed]
- A Gómez-Durán, D Pacheu-Grau, E López-Gallardo, C Díez-Sánchez, J Montoya, MJ López-Pérez, E Ruiz-Pesini. Unmasking the causes of multifactorial disorders: OXPHOS differences between mitochondrial haplogroups. Hum Mol Genet, 2010. [DOI | PubMed]
- PF Chinnery, A Gomez-Duran. Oldies but goldies mtDNA population variants and neurodegenerative diseases. Front Neurosci, 2018. [DOI | PubMed]
- H Latsoudis, C Spanaki, G Chlouverakis, A Plaitakis. Mitochondrial DNA polymorphisms and haplogroups in Parkinson’s disease and control individuals with a similar genetic background. J Hum Genet, 2008. [DOI | PubMed]
- D Ghezzi, C Marelli, A Achilli, S Goldwurm, G Pezzoli, P Barone, MT Pellecchia, P Stanzione, L Brusa, AR Bentivoglio, U Bonuccelli, L Petrozzi, G Abbruzzese, R Marchese, P Cortelli, D Grimaldi, P Martinelli, C Ferrarese, B Garavaglia, S Sangiorgi, V Carelli, A Torroni, A Albanese, M Zeviani. Mitochondrial DNA haplogroup K is associated with a lower risk of Parkinson’s disease in Italians. Eur J Hum Genet, 2005. [DOI | PubMed]
- PG Ridge, TJ Maxwell, CD Corcoran, MC Norton, JT Tschanz, E O’Brien, RA Kerber, RM Cawthon, RG Munger, JSK Kauwe. Mitochondrial genomic analysis of late onset Alzheimer’s disease reveals protective haplogroups H6A1A/H6A1B: the cache county study on memory in aging. PLoS ONE, 2012. [DOI | PubMed]
- I Litvan, JJ Hauw, JJ Bartko, PL Lantos, SE Daniel, DS Horoupian, A McKee, D Dickson, C Bancher, M Tabaton, K Jellinger, DW Anderson. Validity and reliability of the preliminary NINDS neuropathologic criteria for progressive supranuclear palsy and related disorders. J Neuropathol Exp Neurol, 1996. [DOI | PubMed]
- S Koga, A Parks, K Kasanuki, M Sanchez-Contreras, MC Baker, KA Josephs, JE Ahlskog, RJ Uitti, N Graff-Radford, JA van Gerpen, ZK Wszolek, R Rademakers, DW Dickson. Cognitive impairment in progressive supranuclear palsy is associated with tau burden. Movement Disord, 2017. [DOI | PubMed]
- L Buée, A Delacourte. Comparative biochemistry of tau in progressive supranuclear palsy, corticobasal degeneration, FTDP-17 and Pick’s disease. Brain Pathol (Zurich, Switzerland), 1999. [DOI]
- M Pérez, JM Valpuesta, EM de Garcini, C Quintana, M Arrasate, JL López Carrascosa, A Rábano, J García de Yébenes, J Avila. Ferritin is associated with the aberrant tau filaments present in progressive supranuclear palsy. Am J Pathol, 1998. [PubMed]
- I Santa-María, M Pérez, F Hernández, J Avila, FJ Moreno. Characteristics of the binding of thioflavin S to tau paired helical filaments. J Alzheimers Dis, 2006. [DOI | PubMed]
- H Braak, E Braak. Neuropathological stageing of Alzheimer-related changes. Acta Neuropathol, 1991. [DOI | PubMed]
- DR Thal, U Rüb, M Orantes, H Braak. Phases of Aβ-deposition in the human brain and its relevance for the development of AD. Neurology, 2002. [DOI | PubMed]
- ME Murray, VJ Lowe, NR Graff-Radford, AM Liesinger, A Cannon, SA Przybelski, B Rawal, JE Parisi, RC Petersen, K Kantarci, OA Ross, R Duara, DS Knopman, CR Jack, DW Dickson. Clinicopathologic and 11C-Pittsburgh compound B implications of Thal amyloid phase across the Alzheimer’s disease spectrum. Brain, 2015. [DOI | PubMed]
- N Zhao, C-C Liu, AJ Van Ingelgom, C Linares, A Kurti, JA Knight, MG Heckman, NN Diehl, M Shinohara, YA Martens, ON Attrebi, L Petrucelli, JD Fryer, ZK Wszolek, NR Graff-Radford, RJ Caselli, MY Sanchez-Contreras, R Rademakers, ME Murray, S Koga, DW Dickson, OA Ross, G Bu. APOE ε2 is associated with increased tau pathology in primary tauopathy. Nature Communications, 2018. [DOI | PubMed]
- S Gabriel, L Ziaugra, D Tabbaa. SNP genotyping using the sequenom MassARRAY iPLEX platform. Curr Protoc Hum Genet, 2009
- M van Oven, M Kayser. Updated comprehensive phylogenetic tree of global human mitochondrial DNA variation. Hum Mutat, 2009. [DOI | PubMed]
- MT Lott, JN Leipzig, O Derbeneva, HM Xie, D Chalkia, M Sarmady, V Procaccio, DC Wallace. mtDNA variation and analysis using mitomap and mitomaster. Curr Protoc Bioinform, 2013
- A Torroni, K Huoponen, P Francalacci, M Petrozzi, L Morelli, R Scozzari, D Obinu, ML Savontaus, DC Wallace. Classification of European mtDNAs from an analysis of three European populations. Genetics, 1996. [PubMed]
- G Barshad, N Zlotnikov-Poznianski, L Gal, M Schuldiner, D Mishmar. Disease-causing mutations in subunits of OXPHOS complex I affect certain physical interactions. Sci Rep, 2019. [DOI | PubMed]
- M Cerezo, V Černý, Á Carracedo, A Salas. Applications of MALDI-TOF MS to large-scale human mtDNA population-based studies. Electrophoresis, 2009. [DOI | PubMed]