
Dissecting and steering cell dynamics using spatially-informed RNA velocity with veloAgent
Abstract
RNA velocity enables inference of cell state transitions from single-cell transcriptomics by modeling transcriptional dynamics from spliced and unspliced mRNA. However, existing methods overlook spatial context and struggle to scale to large datasets, limiting insights into tissue organization and dynamic processes. We introduce veloAgent, a deep generative and agent-based framework that estimates gene- and cell-specific transcriptional kinetics while integrating spatial information through agent-based simulations of local microenvironments. By leveraging both molecular and spatial cues, veloAgent improves velocity accuracy and achieves sublinear memory scaling, enabling efficient analysis of large and multi-batch spatial datasets. A distinctive feature of veloAgent is its in silico perturbation module, which allows targeted manipulation of spatial velocity vectors to simulate regulatory interventions and predict their impact on cell fate dynamics. These capabilities position veloAgent as a scalable and versatile framework for dissecting spatially resolved cellular dynamics and guiding cell fate manipulation across diverse biological processes.
Article type: Research Article
Keywords: Computational Biology
Affiliations: https://ror.org/01pxwe438grid.14709.3b0000 0004 1936 8649School of Computer Science, McGill University, Montreal, QC Canada; https://ror.org/04pemf943Meakins-Christie Laboratories, Translational Research in Respiratory Diseases Program, Research Institute of the McGill University Health Centre, Montreal, QC Canada; https://ror.org/05c22rx21grid.510486.eMila – Quebec Artificial Intelligence Institute, Montreal, QC Canada; https://ror.org/05hffr360grid.440568.b0000 0004 1762 9729Khalifa University, Abu Dhabi, United Arab Emirates
License: © The Author(s) 2026 CC BY 4.0 Open Access This article is licensed under a Creative Commons Attribution 4.0 International License, which permits use, sharing, adaptation, distribution and reproduction in any medium or format, as long as you give appropriate credit to the original author(s) and the source, provide a link to the Creative Commons licence, and indicate if changes were made. The images or other third party material in this article are included in the article’s Creative Commons licence, unless indicated otherwise in a credit line to the material. If material is not included in the article’s Creative Commons licence and your intended use is not permitted by statutory regulation or exceeds the permitted use, you will need to obtain permission directly from the copyright holder. To view a copy of this licence, visit http://creativecommons.org/licenses/by/4.0/. Creative Commons Public Domain Dedication waiver http://creativecommons.org/publicdomain/zero/1.0/ applies to the data associated with this article, unless otherwise stated in a credit line to the data, but does not extend to the graphical or creative elements of illustrations, charts, or figures. This waiver removes legal barriers to the re-use and mining of research data. According to standard scholarly practice, it is recommended to provide appropriate citation and attribution whenever technically possible.
Article links: DOI: 10.1038/s44320-026-00213-w | PubMed: 42092184 | PMC: PMC13328566
Relevance: Moderate: mentioned 3+ times in text
Full text: PDF (9.0 MB)
Introduction
Dynamic changes in gene expression, including both transcriptional and post-transcriptional regulation are fundamental to determining a cell’s identity and function (Kouno et al, ref. 2013; Pascual-Ahuir et al, ref. 2020). Single-cell RNA sequencing (scRNA-seq) has revolutionized the field of transcriptomics by enabling high-resolution profiling of gene expression at the single-cell level, thereby facilitating unprecedented insights into cellular heterogeneity, gene regulatory dynamics, and developmental trajectories (Kashima et al, ref. 2020; Kolodziejczyk et al, ref. 2015). In parallel, advances in spatial transcriptomics have made it possible to preserve spatial context while quantifying gene expression, enabling researchers to investigate tissue organization, niche-specific expression programs and cell–cell interactions (Vahid et al, ref. 2023; Williams et al, ref. 2022; Zhao et al, ref. 2024). Despite its quantitative precision and comprehensive coverage, these technologies only provide a temporally static snapshot of cellular states rather than a trajectory of cellular behavior. This limitation constrains our ability to reconstruct dynamic processes such as differentiation, and lineage commitment (Tritschler et al, ref. 2019). Addressing these limitations, RNA velocity has emerged as a transformative framework for inferring future cellular states by leveraging the relative abundances of unspliced and spliced mRNA transcripts to model ongoing gene expression kinetics (Bergen et al, ref. 2020; La Manno et al, ref. 2018). This approach not only enables the extrapolation of transcriptional dynamics and trajectory predictions but also offers critical insights into cellular decision-making processes with broad applications in developmental biology, and disease progression.
Several computational frameworks have been developed to infer RNA velocity, including cellDancer (Li et al, ref. 2024), scVelo (Bergen et al, ref. 2020), SIRV (Abdelaal et al, ref. 2024), DeepVelo (Cui et al, ref. 2024), VeloVAE (Gu et al, ref. 2022), VeloVI (Gayoso et al, ref. 2024), and UniTVelo (Gao et al, ref. 2022). These methods introduce various strategies to improve accuracy, such as incorporating dynamical systems modeling, deep generative modeling, and kinetic parameter estimation. However, existing RNA velocity methods face several limitations that constrain our ability to fully understand development and disease progression. Many existing methods still assume uniform transcriptional kinetics across genes or cells, an oversimplification that erases the cell-to-cell heterogeneity that drives development, disease onset and progression. While more advanced models such as cellDancer estimate gene- and cell-specific kinetics and yield biologically plausible results, their heavy computational demands make them impractical for the large, multi-batch datasets increasingly central to development or disease atlas-scale studies (Li et al, ref. 2024). Perhaps, most critically, nearly all current approaches ignore spatial context, relying instead on embeddings of transcriptional similarity. This omission ignores vital information from tissue microenvironments and cell–cell interactions, leading to inferred trajectories that cross anatomical boundaries or contradict known tissue structure (Armingol et al, ref. 2021; Asp et al, ref. 2020; Zheng et al, ref. 2023). This loss of spatial fidelity prevents us from uncovering how tumors invade, how immune cells coordinate in tissue, or how stem cells rebuild organs (Hunter et al, ref. 2021; Oliveira et al, ref. 2025; Tang et al, ref. 2025). Furthermore, no current framework allows researchers to computationally perturb key genes or pathways and predict how such perturbations reshape cellular trajectories. Such a tool would be especially powerful in regenerative medicine and disease intervention, where rapid in silico tests could help prioritize experiments, highlight therapeutic targets, and significantly reduce the time and cost of discovery pipelines. Together, these gaps limit not just technical accuracy but our ability to translate single-cell maps into insights about developmental and disease biology. This limitation has also constrained our understanding of how cellular dynamics unfold within the structural and spatial context of native tissues.
To address these challenges, we introduce veloAgent, a hybrid framework consisting of three distinct components: a variational autoencoder (VAE), a gene interaction-informed neural network, and an agent-based model (ABM) to infer spatial RNA velocities. The VAE learns robust latent representations from noisy spliced and unspliced mRNA counts, providing a unified and denoised embedding of transcriptional states. The neural network guided by gene–gene interaction networks derived from the STRING database encodes cell- and gene-specific transcriptional kinetics, while operating in a fixed-dimensional, gene-centric space that scales efficiently to a large number of cells (Szklarczyk et al, ref. 2023). The ABM then leverages spatial transcriptomics data to simulate each cell as an autonomous agent positioned in its native tissue context, whose future state is influenced by neighboring cells within its local environment. ABMs have previously been used in spatial transcriptomics to model interactions between cells, supporting our choice of this modeling paradigm (Raghavan et al, ref. 2025). This integrative design enables veloAgent to model spatial RNA velocity, capturing how gene expression dynamics unfold across both time and space. By embedding tissue architecture directly into the inference process, we bridge the divide between molecular kinetics and spatial organization, transforming RNA velocity from an abstract representation into a spatially coherent model of cell-state transitions.
We demonstrate the utility of veloAgent across a range of spatial transcriptomics platforms with varying spatial resolutions, including Visium (Ståhl et al, ref. 2016), Stereo-seq (Chen et al, ref. 2022), HybISS (Gyllborg et al, ref. 2020), and seqFISH (Lohoff et al, ref. 2022). Unlike existing RNA velocity methods, veloAgent does not simply infer trajectories from just the transcriptome, but directly integrates spatial coordinates, enabling analysis of velocity vectors onto tissue architecture. This uniquely allows researchers to resolve dynamic cellular programs within native niches, revealing transition pathways that respect anatomical boundaries and microenvironmental organization rather than producing over-smoothed, anatomically implausible fields. veloAgent is also designed for scale with its gene-centric framework that makes velocity analysis practical on atlas-scale and multi-batch datasets. Finally, veloAgent introduces an innovation not previously available in velocity analysis: in silico perturbation of transcriptional kinetics. This enabling virtual screening and prioritization of interventions, generating testable hypotheses that reduce experimental cost and accelerate translational discovery. By integrating transcriptomic kinetics, gene-network priors, and spatial context, veloAgent enables both mechanistic interpretation and in silico perturbation, defining a new paradigm for data-driven hypothesis generation and therapeutic target discovery.
Results
Overview of veloAgent
veloAgent introduces a hybrid deep learning and agent-based modeling (ABM) framework for estimating RNA velocity at single-cell resolution by integrating gene expression data with prior gene–gene interaction networks and spatial information. Unlike existing RNA velocity frameworks, veloAgent jointly models transcriptional kinetics and spatial context within a unified deep generative-agent-based model hybrid. As illustrated in Fig. 1, the methodology proceeds through four main stages. First (Fig. 1A), a variational autoencoder (VAE) encodes each cell’s spliced and unspliced mRNA counts into a unified latent representation. This step reduces dimensionality while preserving key transcriptional features that reflect dynamic cellular states. Second (Fig. 1B), the resulting latent vectors are processed through a biologically constrained gene–gene deep neural network (DNN) to infer cell- and gene-specific kinetic parameters—transcription rate (α), splicing rate (β), and degradation rate (γ). The network architecture is guided by protein–protein interactions from the STRING database, enforcing biologically grounded sparsity: each gene’s output depends only on its annotated interactors. This design enables the model to capture meaningful regulatory dependencies during kinetic inference. The inferred parameters are then incorporated into differential equations to compute initial RNA velocity estimates.
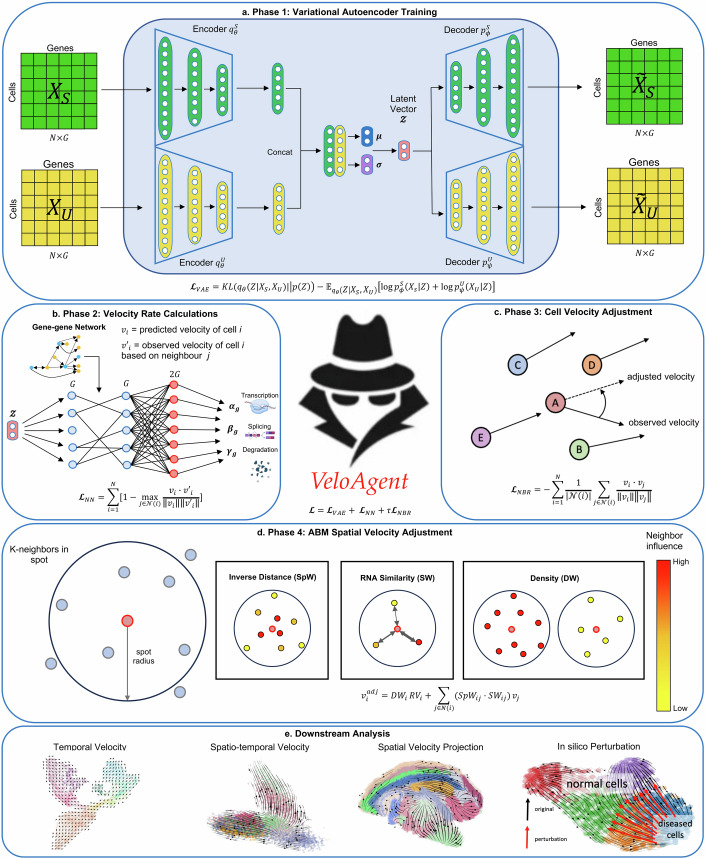
The third stage (Fig. 1C) refines the estimated velocity field by enforcing local coherence. Each cell’s velocity vector is aligned with those of its transcriptionally similar neighbors, minimizing directional noise and enhancing trajectory continuity. Finally (Fig. 1D), for datasets with spatial transcriptomics measurements, veloAgent integrates an ABM to further refine velocities in their spatial context. The ABM incorporates intercellular distance, local cell density, and expression similarity to simulate spatial constraints, yielding biologically realistic and spatially informed velocity fields in structured tissue environments. Beyond velocity inference, veloAgent provides multiple outputs for downstream analysis—including temporal and spatial velocity projections—and features a perturbation module that enables in silico steering of RNA velocity directions to model potential gene perturbations (Fig. 1E). Together, these components establish veloAgent as a unified framework for reconstructing and perturbing cellular dynamics in both temporal and spatial contexts.
veloAgent enables spatially informed RNA velocity inference
veloAgent extends RNA velocity analysis by embedding spatial information directly into the inference process, allowing trajectories to better reflect tissue architecture and neighborhood organization. Through an agent-based spatial refinement module, veloAgent integrates intercellular proximity, local density, and expression similarity to couple neighboring cells during velocity estimation. This spatial coupling promotes locally aligned velocity directions and suppresses noise arising from isolated or contradictory cell states. As a result, veloAgent produces coherent and biologically interpretable velocity fields that conform to underlying tissue structure and resolve directional ambiguities commonly observed in conventional methods.
To evaluate its performance, we applied veloAgent to four representative spatial transcriptomics datasets—mouse brain (Stereo-seq), breast cancer, chicken heart, and mouse brain (HybISS). Across all datasets, veloAgent achieved superior performance in both qualitative (Fig. 2A–H) and quantitative (Fig. 2I–K) benchmarks, demonstrating that spatial context provides a more faithful representation of tissue-level dynamics. In most regions, veloAgent and SIRV yielded broadly consistent trends; however, veloAgent clearly outperformed in complex or transitional zones where spatial organization was critical. In the Stereo-seq mouse brain, for example, SIRV produced unclear or contradictory velocities around fiber-tract cells, whereas veloAgent captured coherent transitions from hippocampus, thalamus sensory-motor (DORsm), and polymodal association (DORpm) regions, consistent with known projections of fiber-tract neurons (Fig. 2A; red circles) (Ferguson and Gao, ref. 2015; Guido, ref. 2018; Qiu et al, ref. 2024; Senova et al, ref. 2020). In breast cancer, SIRV incorrectly directed flows from tumor cells toward normal cells, whereas veloAgent corrected these mispredictions, yielding biologically consistent trajectories (Fig. 2B; red circles) (Sahai et al, ref. 2020). In the chicken heart, veloAgent corrected SIRV’s reversed trajectories at the ventricle-atrium boundary and valve cluster (Fig. 2C; red circles) (Tallquist, ref. 2020). Similarly, in the HybISS brain, SIRV misdirected neuron velocities toward neuroblasts, whereas veloAgent correctly modeled neurons as terminal states (Fig. 2D; red circles) (Xu et al, ref. 2020). Collectively, these results highlighted veloAgent’s ability to recover biologically consistent transitions where other approaches failed.
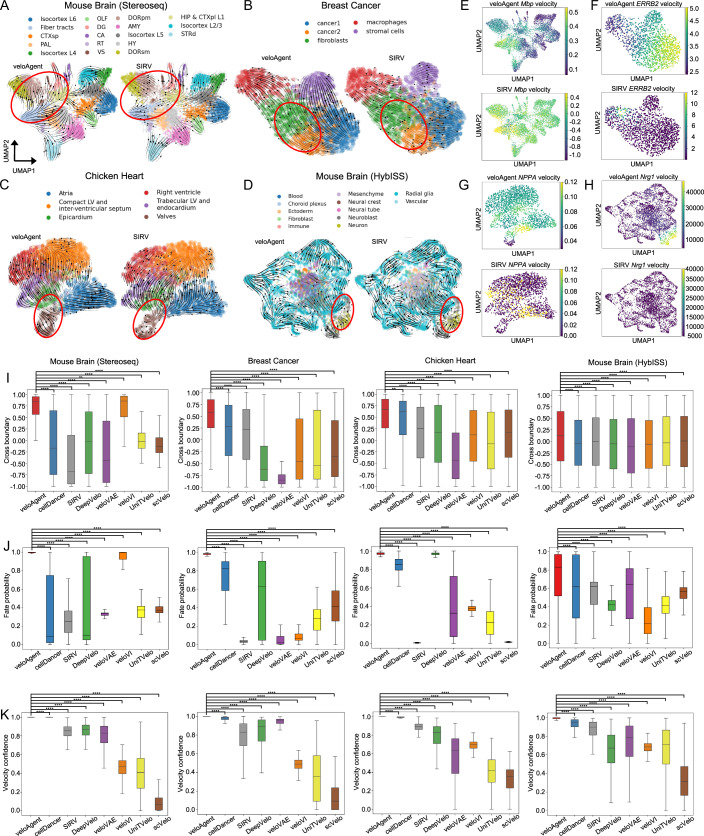
We next validated the spatial fidelity of inferred velocities using well-established regional marker genes that define terminal or tissue-specific populations (Fig. 2E–H). In each dataset, veloAgent’s velocity fields aligned closely with the known spatial domains of these markers, whereas SIRV frequently produced diffuse or misplaced activity. In the Stereo-seq mouse brain, Mbp velocity was confined to fiber tracts, consistent with its role in oligodendrocyte maturation and myelination (Fig. 2E) (Xu et al, ref. 2020). In breast cancer, ERBB2 velocity localized correctly within tumor regions but was erroneously assigned to macrophages by SIRV, contradicting its established role as an oncogene and therapeutic target (Fig. 2F) (Yu and Hung, ref. 2000). In the chicken heart, NPPA velocity was restricted to atria under veloAgent yet aberrantly extended into ventricles with SIRV, inconsistent with its function as an atrial differentiation marker distinguishing atria from ventricles (Fig. 2G) (Li, ref. 2022). In the HybISS mouse brain, Nrg1 velocity was specifically confined to neurons, consistent with its role in neuronal development, while SIRV failed to capture any localized signal (Fig. 2H) (Rajebhosale et al, ref. 2024). These spatial-marker-based evaluations confirm that veloAgent faithfully captures known anatomical domains and improves the spatial interpretability of RNA velocity.
Quantitative benchmarking against seven leading RNA-velocity models (cellDancer, SIRV, DeepVelo, veloVAE, veloVI, UniTVelo, scVelo) confirmed these gains (Fig. 2I–K). Evaluated across three complementary metrics—fate probability (Bergen et al, ref. 2020), cross-boundary direction correctness (Qiao and Huang, ref. 2021), and velocity confidence (Qiao and Huang, ref. 2021)—veloAgent achieved the highest or near-highest scores in all datasets. For cross-boundary direction correctness, veloAgent was on average 92.03% (Stereo-seq brain), 92.02% (breast cancer), 55.52% (chicken heart), and 12.15% (HybISS brain) better than all other methods. Specifically, veloAgent matched veloVI in Stereo-seq brain (0.8447 vs. 0.8590, n.s) and outperformed all methods in the other datasets: breast cancer (0.6148 vs. 0.2849, cellDancer; FDR = 3.588 × 10−60), chicken heart (0.6742 vs. 0.6193, cellDancer; FDR = 2.923 × 10⁻³), and HybISS brain (0.1237 vs. –0.0209, SIRV; FDR = 3.880 × 10⁻³). For fate probability, veloAgent consistently showed stronger or comparable predictive power in comparison to other methods and on average, veloAgent achieved 64.97% (Stereo-seq brain), 65.87% (breast cancer), 58.12% (chicken heart), and 33.32% (HybISS brain) higher predictive power than all competing methods. Specifically, veloAgent consistently demonstrated stronger or comparable performance: Stereo-seq brain (0.9995 vs. 0.9919, veloVI; FDR = 6.990 × 10−132), breast cancer (0.9841 vs. 0.6309, DeepVelo; FDR < 1.0 × 10−308), chicken heart (0.9779 vs. 0.8520, cellDancer; FDR = < 1.0 × 10−308), and HybISS brain (0.8324 vs. 0.6231, cellDancer; FDR = 1.071 × 10−51). For velocity confidence, veloAgent achieved on average 35.61% (Stereo-seq brain), 34.92% (breast cancer), 31.23% (chicken heart), and 28.25% (HybISS brain) higher internal consistency than all competing methods. Specifically, veloAgent maintained near-perfect internal consistency (≥ 0.998) across datasets: Stereo-seq brain (0.9995 vs. 0. 8704, DeepVelo; FDR < 1.0 × 10−308), breast cancer (0.9987 vs. 0.8304, SIRV; FDR < 1.0 × 10−308), chicken heart (0.9999 vs. 0.6349, veloVAE; FDR < 1.0 × 10−308), and HybISS brain (0.9987 vs. 0.9524, cellDancer; FDR < 1.0 × 10−308). These improvements reflect more accurate modeling of transition boundaries, terminal fates, and noise-robust velocity estimation.
Although principally designed for spatial data, veloAgent also applies to conventional scRNA-seq datasets, maintaining advantages over existing approaches (Appendix Figs. S1–2, Appendix Table S2). Extended benchmarking across additional datasets and metrics (Appendix Figs. S3–5) further demonstrate its robustness, positioning veloAgent as a powerful framework for reconstructing cellular dynamics with spatial fidelity and quantitative precision.
Spatially informed RNA velocity reveals tissue-coherent cell-state transitions
Most existing RNA velocity methods infer transcriptional dynamics solely in latent transcriptomic space, treating velocity as an abstract trajectory independent of tissue structure. In contrast, veloAgent integrates spatial priors into RNA velocity inference through an ABM, embedding velocity vectors directly onto tissue coordinates to capture how cellular transitions are shaped by native architecture. Importantly, the projected velocity vectors represent inferred transcriptional state transitions and do not imply physical cell migration within the tissue (Fig. 3A–D). This integration enables spatially coherent and biologically grounded reconstruction of cell-state dynamics. Across four spatial transcriptomics datasets, veloAgent produced velocity fields that were directionally coherent, spatially continuous, and extended along broader developmental transition tracks than competing methods (Fig. 3A–D; Appendix Fig. S6). By enforcing local spatial coherence through ABM simulations, veloAgent revealed how tissue organization constrains and guides cellular trajectories—an effect absent from models that neglect spatial context.
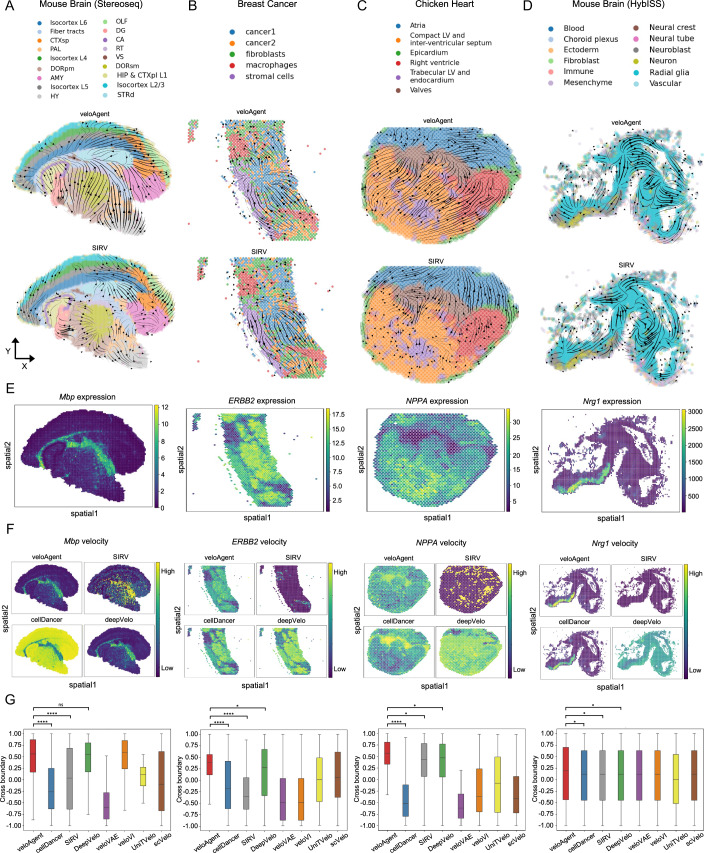
At the gene level, veloAgent more accurately captured the spatial dynamics of key driver genes than other methods. For terminal-state marker genes, velocity magnitudes were tightly localized to expected regions, reflecting transcriptional activation or repression near terminal states (Fig. 3E,F; Appendix Figs. S7 and 8). Although expression patterns were comparable across methods, their velocity profiles differed markedly: veloAgent consistently yielded sharper and more biologically meaningful velocity patterns. For example, in the Stereo-seq mouse brain, Mbp velocity was concentrated within fiber tracts, consistent with its role in oligodendrocyte myelination (Xu et al, ref. 2020) (Fig. 3E,F; left), whereas cellDancer incorrectly predicted high velocity outside these regions. In the breast cancer dataset, ERBB2 velocity was tightly restricted to cancer cell populations by veloAgent (Fig. 3E,F; middle left), whereas SIRV lacked this specificity despite ERBB2 being a known oncogene driving tumor progression (Yu and Hung, ref. 2000). Similarly, in the HybISS mouse brain, Nrg1 velocity localized to neurons in line with its role in neuronal development (Rajebhosale et al, ref. 2024) (Fig. 3E,F; right), while SIRV and DeepVelo produced diffuse or nonspecific signals. Even when velocity and expression were imperfectly aligned, such as for NPPA in the chicken heart (Fig. 3E,F; middle right), veloAgent still best reflected biology by capturing its role as an atrial differentiation marker (Li, ref. 2022).
Quantitatively, veloAgent consistently achieved the highest scores across cross-boundary direction, spatial velocity confidence, and fate probability metrics among all datasets (Fig. 3G; Appendix Fig. S9), confirming superior alignment between predicted velocity and spatially localized transitions. For cross boundary direction, veloAgent achieved on average 49.57% (Stereo-seq brain), 54.30% (breast cancer), 72.74% (chicken heart), and 8.75% (HybISS brain) higher accuracy than all other methods, consistently matching or surpassing competing models across datasets.
Specifically, veloAgent achieved superior performance relative to the top 3 next-best methods: Stereo-seq brain (0.5648 vs. 0.5594, veloVI; n.s) (0.5648 vs. 0.5492, DeepVelo; n.s) (0.5648 vs. −0.1164, UniTVelo; FDR = 6.845 × 10⁻³⁵), breast cancer (0.3816 vs. 0.2806, DeepVelo; FDR = 3.192 × 10⁻²) (0.3816 vs. 0.00654, scVelo; FDR = 2.646×10⁻⁵) (0.3816 vs. 0.0162, UniTVelo; FDR = 1.490 × 10⁻⁹), chicken heart (0.5744 vs. 0.4714, DeepVelo; FDR = 3.631 × 10⁻²) (0.5744 vs. 0.4511, SIRV; FDR = 4.325 × 10⁻²) (0.5744 vs −0.0759, UniTVelo; FDR = 5.793 × 10⁻⁹), and HybISS brain (0.1937 vs. 0.1273, cellDancer; FDR = 2.041 × 10⁻²); (0.1937 vs. 0.1228, DeepVelo; FDR = 2.041 × 10⁻²) (0.1937 vs. 0.1199, SIRV; FDR = 2.041 × 10⁻²) showing that it can consistently match or outperform other velocity inference methods.
To further assess spatial fidelity, we introduced two analog metrics—spatial velocity confidence and spatial fate probability—representing spatially mapped extensions of their conventional counterparts. These two metrics are spatially-aware and help specifically assess spatial accuracy in addition to transcriptomic performance. On average, veloAgent achieved 46.30% (Stereo-seq brain), 13.77% (breast cancer), 29.69% (chicken heart), and 30.36% (HybISS brain) higher predictive power in spatial fate probability than competing methods (Appendix Fig. S9B). Specifically, against the second-best method, veloAgent achieved: Stereo-seq brain (0.7250 vs. 0.5954, veloVI; FDR < 1.0 × 10−308), breast cancer (0.5648 vs. 0.5370, SIRV; FDR = 1.351 × 10⁻²), chicken heart (0.8331 vs. 0.7926, cellDancer; FDR = 8.071 × 10−101), and HybISS brain (0.7769 vs. 0.7280, cellDancer; FDR = 5.249 × 10−40). veloAgent demonstrated on average 36.63% (Stereo-seq brain), 36.22% (breast cancer), 33.03% (chicken heart), and 35.04% (HybISS brain) higher spatial velocity confidence than all other methods (Appendix Fig. S9A). In direct comparison to the other models: Stereo-seq brain (0.9999 vs. 0.8576, DeepVelo; FDR = 4.406 × 10−248), breast cancer (0.9998 vs. 0.9776, cellDancer; FDR = 2.576 × 10−74), chicken heart (0.9999 vs. 0.8859, SIRV; FDR = 5.397 × 10−51), and HybISS brain (0.9999 vs. 0.9188, cellDancer; FDR = 3.157 × 10−105). veloAgent maintained superior performance across both measures, reinforcing its ability to generate accurate and spatially consistent velocity fields (Appendix Fig. S9). Collectively, these results demonstrate that by integrating spatial priors through ABM, veloAgent transforms RNA velocity estimation from a purely temporal abstraction into a spatially coherent model of tissue dynamics, enabling more accurate and interpretable studies of cellular transitions and their underlying gene programs.
veloAgent reveals lineage-specific driver genes and transcription factors
To determine whether the improved RNA velocity estimates from veloAgent translate into biologically meaningful gene-level insights, we leveraged CellRank as a downstream framework that operates on velocity fields (Lange et al, ref. 2022). Unlike prior analyses where CellRank was applied to conventional RNA velocity, here it is driven by veloAgent’s spatially and temporally coherent velocity vectors, allowing us to assess how enhanced spatial modeling improves downstream fate and driver-gene inference. For each dataset (HybISS mouse brain, chicken heart, and Stereo-seq mouse brain), we computed fate probabilities and ranked genes along pseudotime within each lineage. These ranked genes were visualized as pseudotime heatmaps, where expression was scaled and genes were ordered by the pseudotime at which smoothed expression peaked (Fig. 4A,D,G).
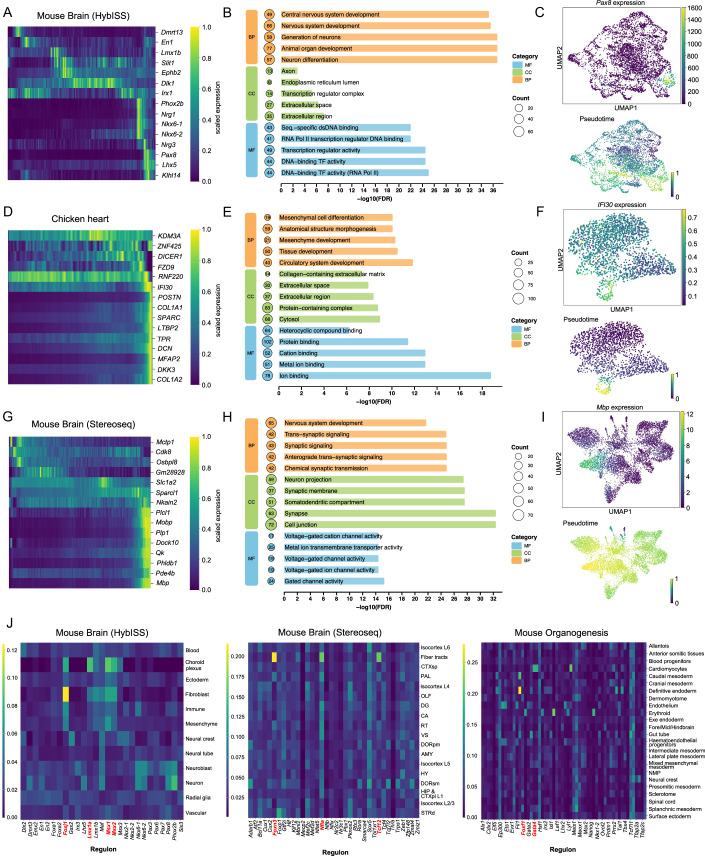
Across all datasets, veloAgent revealed coherent cascades of early regulators, mid-stage transition factors, and late differentiation markers that followed expected developmental orderings. In the HybISS mouse brain, veloAgent-derived pseudotime captured the sequential activation of regulators driving neuronal differentiation (Fig. 4A). Early En1 expression aligned with progenitor-like states, consistent with its role in embryonic patterning, where loss of En1 causes mid/hindbrain defects by E9 (Simon et al, ref. 2005). Dlk1 peaked at mid-pseudotime, mirroring pro-neural factors (Ngn2, Mash1, NeuroD) known to precede neuronal maturation (Surmacz et al, ref. 2012). Late-stage genes such as Lhx5 and Klhl14 were upregulated in terminal neuronal populations; Lhx5 regulates hippocampal neuron differentiation and migration, while Klhl14 directs corticospinal axon targeting (Miquelajáuregui et al, ref. 2015; Miquelajáuregui et al, ref. 2010; Pillai et al, ref. 2007; Sahni et al, ref. 2021; Zhao et al, ref. 1999). Pax8 is also a known critical transcription factor involved in mid-hindbrain development (Fig. 4C) (Giacco et al, ref. 2025). These results demonstrate that veloAgent reconstructs the temporal hierarchy of transcriptional regulators underlying neurodevelopment.
In the chicken heart, veloAgent distinguished transient valve progenitors enriched for DICER1 from terminal valve cells expressing ECM genes (COL1A1/2, SPARC) (Fig. 4D). This ordering aligns with reports that DICER1 activity is essential for early valve development, whereas ECM expression supports structural maturation and stability of the valves later in development (Acharya et al, ref. 2012; Deckx et al, ref. 2019; Yan et al, ref. 2022). IFI30 was also identified, with previous studies linking it with cardiomyocytes (Fig. 4F) (Li et al, ref. 2022). In the Stereo-seq mouse brain, veloAgent aligned early regulators such as Cdk8, mid-phase factors including Quaking (Qk), and late markers such as Mbp (Fig. 4G). Cdk8, a Mediator-complex component, is essential for early mouse development (Galbraith et al, ref. 2010; Westerling et al, ref. 2007), while Qk isoforms stabilize p27^Kip1^ mRNA to promote oligodendrocyte maturation (Larocque et al, ref. 2005), and Mbp marks terminal differentiation during myelination (Fig. 4I) (Landry et al, ref. 1996). Together, these cascades highlight veloAgent’s ability to delineate lineage-specific transcriptional programs across distinct spatial and developmental contexts.
To assess the biological relevance of the inferred driver genes, we performed Gene Ontology (GO) enrichment analysis on the top fate-associated genes for each lineage (Fig. 4B,E,H). Enriched pathways were strongly consistent with known developmental programs. In the chicken heart (Fig. 4E), enriched terms included circulatory-system development (FDR = 1.4 × 10⁻¹², 40 genes), anatomical-structure morphogenesis (FDR = 8.7 × 10⁻¹¹, 59 genes), and mesenchymal development (FDR = 4.9 × 10⁻¹¹, 21 genes), implicating POSTN and COL1A1 as central regulators of cardiac morphogenesis and collagen signaling (Conway and Molkentin, ref. 2008; Deng et al, ref. 2025). In the HybISS mouse brain (Fig. 4B), enriched terms such as neuron differentiation (FDR = 1.9 × 10−³⁷, 57 genes), nervous-system development (FDR = 2.6 × 10−³⁶, 66 genes), and generation of neurons (FDR = 1.9 × 10−³⁷, 58 genes) confirmed neural-lineage specificity, featuring Lhx5 and Phox2b as canonical regulators (Pattyn et al, ref. 1999; Pillai et al, ref. 2007). In the Stereo-seq brain (Fig. 4H), enriched pathways included nervous-system development and synaptic signaling, with Qk and Mbp emerging as key regulators of oligodendrocyte maturation and myelin formation (Landry et al, ref. 1996; Larocque et al, ref. 2005). These enrichment patterns confirm that the driver genes inferred from veloAgent-based velocity recapitulate lineage-regulatory programs across tissues.
To further examine upstream transcriptional regulation, we applied SCENIC (Aibar et al, ref. 2017) to infer gene-regulatory networks and identify active transcription factors (TFs) across the HybISS, Stereo-seq, and mouse-organogenesis datasets (Fig. 4J). Because SCENIC’s predictions depend directly on the quality of the input expression and velocity information, improvements in RNA velocity modeling should translate into clearer and more biologically coherent TF-activity patterns. The predicted TFs showed strong concordance with known lineage regulators. In the HybISS dataset, Foxj1, Lmx1a, Msx1, and Msx2 were recovered, consistent with their established roles in choroid-plexus patterning (Liddelow, ref. 2015; Venugopalan et al, ref. 2008) (Fig. 4J; left); Lmx1a, for instance, directs cells toward roof-plate and choroid-plexus lineages rather than neuronal fates originating from the rhombic lip (Chizhikov et al, ref. 2010). In the Stereo-seq brain, Foxn3, Nfia, and Tcf12 were predicted (Fig. 4J; middle); Nfia and Tcf12 are established regulators of fiber-tract formation, while Foxn3, though not previously linked, may play an indirect regulatory role and represents a potential novel TF for further investigation (das Neves et al, ref. 1999; Samaan et al, ref. 2010; Singh et al, ref. 2022). In the mouse-organogenesis dataset, Foxf1 and Gata4 were identified in association with the definitive endoderm and cardiomyocyte lineages, respectively (Fig. 4J; right); Foxf1 mediates endoderm–mesoderm signaling, and Gata4 is a key regulator of cardiac gene expression and differentiation (Madison et al, ref. 2009; Malek Mohammadi et al, ref. 2017).
These results demonstrate that veloAgent not only infers spatially and temporally consistent cell-state dynamics but also enables biologically validated and accurate identification of lineage-specific driver genes and transcription factors across diverse tissues.
veloAgent facilitates in silico perturbation of RNA velocity to reveal causal regulators and therapeutic targets
A capability absent in all existing RNA velocity inference methods—including scVelo, cellDancer, and DeepVelo—is the ability to perform in silico perturbations directly within the learned dynamical system. veloAgent fills this gap by explicitly parameterizing gene-specific transcription (α), splicing (β), and degradation (γ) kinetics, enabling mechanistic simulation of how gene-level perturbations propagate through the cellular velocity field. By computationally silencing a gene’s transcription rate, veloAgent emulates a virtual knockout and recomputes the resulting flow of cell states, predicting how the loss of that gene would redirect developmental or disease trajectories in real tissue space. This approach transforms RNA velocity from a descriptive framework into a causal, predictive system capable of identifying regulatory drivers and therapeutic targets.
Perturbations were performed by systematically setting each gene’s transcription rate (α) to zero in the trained model, without retraining, and propagating the change through the dynamical equations to recalculate RNA velocity for all cells (Fig. 5A). Because the model learns gene-specific transcription, splicing, and degradation kinetics as coupled parameters, altering α post-training preserves the learned regulatory dependencies and propagates mechanistically through the velocity field rather than numerically rescaling expression. The resulting perturbed velocity fields were projected onto the UMAP embedding to visualize directional shifts. To quantify the magnitude and orientation of these shifts, we calculated the cross-boundary direction (CBD) score, which measures the change in flow vectors across boundaries separating progenitor and terminal states. A positive score indicates that silencing a gene pushes trajectories toward terminal fates, whereas a negative score reflects diversion away from them. Genes with high absolute CBD values thus act as key regulators of fate progression.
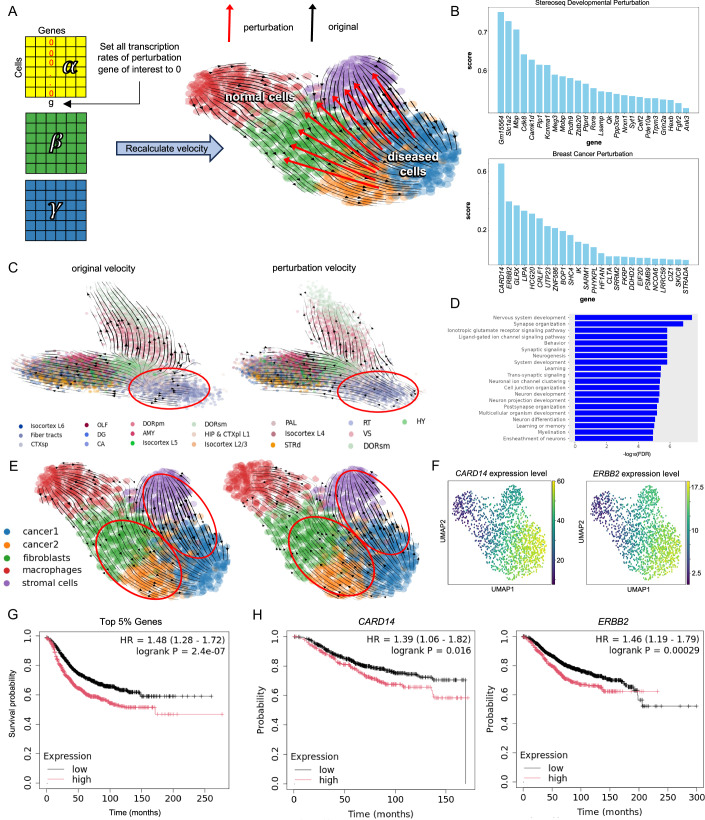
We first applied this framework to a developmental mouse brain dataset profiled by Stereo-seq. The unperturbed velocity field showed expected progression toward fiber-tract cells. Silencing top-ranked genes (Fig. 5B; top), identified by high |CBD| values, reversed this directionality, implying their causal roles in guiding differentiation toward the fiber-tract fate (Fig. 5C). Gene Ontology enrichment of the top perturbed genes revealed significant over-representation of neurogenesis, axonogenesis, and synaptic-organization pathways (Fig. 5D), confirming that the perturbation-derived regulators align with known developmental programs.
We next tested whether this causal-perturbation framework could uncover regulatory dependencies in disease. Using a Visium human breast cancer spatial-transcriptomics dataset, the unperturbed velocity field indicated trajectories converging toward malignant clusters. Perturbing top-scoring genes markedly redirected the velocity vectors away from these clusters (Fig. 5E; Appendix Fig. S10), suggesting suppression of malignant progression. The most strongly perturbed genes (Fig. 5B, bottom) included CARD14 and ERBB2 (Dumbrava et al, ref. 2019; Lim et al, ref. 2020)—well-established oncogenes whose inhibition reversed trajectory directionality. Spatial maps confirmed their enrichment within malignant cell populations (Fig. 5F). Kaplan–Meier survival analyses showed that patients with high expression of these genes experienced significantly poorer overall survival (Fig. 5G,H). Notably, ERBB2 is a validated therapeutic target of multiple FDA-approved drugs, including trastuzumab and trastuzumab deruxtecan (Modi et al, ref. 2020; Swain et al, ref. 2023), underscoring the translational fidelity of our in silico predictions.
To assess whether veloAgent’s perturbation framework generalizes beyond transcriptional regulation, we further simulated perturbations of the splicing rate (β) for each gene. These β-perturbations altered velocity directionality in a manner consistent with post-transcriptional control, typically inducing smoother and temporally delayed trajectory shifts relative to α-perturbations (Appendix Fig. S11). This result demonstrates that veloAgent can model both transcriptional and splicing-driven dynamics within the same mechanistic framework, further validating its capacity for causal simulation.
By enabling gene-level kinetic perturbations within a learned velocity model, veloAgent provides a scalable, mechanistic, and hypothesis-driven alternative to physical perturbation assays. Together, these analyses establish veloAgent as a bridge between mechanistic modeling and functional discovery: by linking gene-specific kinetic parameters to emergent changes in cellular dynamics, veloAgent enables causal inference of regulatory genes, nominates candidate therapeutic targets such as CARD14 and ERBB2, and offers a generalizable computational platform for virtual perturbation experiments across developmental and disease contexts.
veloAgent is scalable and computationally robust
veloAgent’s architecture, which scales with the number of genes rather than the number of cells, provides substantial gains in computational and memory efficiency compared to existing RNA velocity models. This design choice is critical because the number of genes in each organism is essentially fixed, whereas single-cell datasets continue to expand exponentially with improvements in sequencing throughput. In contrast, most frameworks—including cellDancer—scale with cell count, leading to rapidly increasing memory and runtime requirements that limit their applicability for atlas-level analyses involving hundreds of thousands or millions of cells.
To systematically benchmark scalability, we progressively duplicated the HybISS mouse brain dataset to generate datasets ranging from 50,000 to one million cells. While cellDancer’s memory usage scaled near cubically, reaching ~120 GB at one million cells, veloAgent exhibited near-linear scaling, requiring only ~37 GB under identical conditions (Fig. 6A; Appendix Fig. S12). Similarly, veloAgent completed velocity inference substantially faster, maintaining nearly constant per-cell runtime as dataset size increased (Fig. 6B; Appendix Fig. S13). cellDancer was selected as the primary comparator because it is the most competitive deep-learning–based RNA velocity framework and offers a direct architectural contrast to veloAgent’s gene-scaled design. Other frameworks such as scVelo were excluded from this analysis because their smaller network architectures preclude meaningful efficiency comparisons, though they were included in biological benchmarking elsewhere in this study. Full experimental and hardware details are provided in the Methods section.
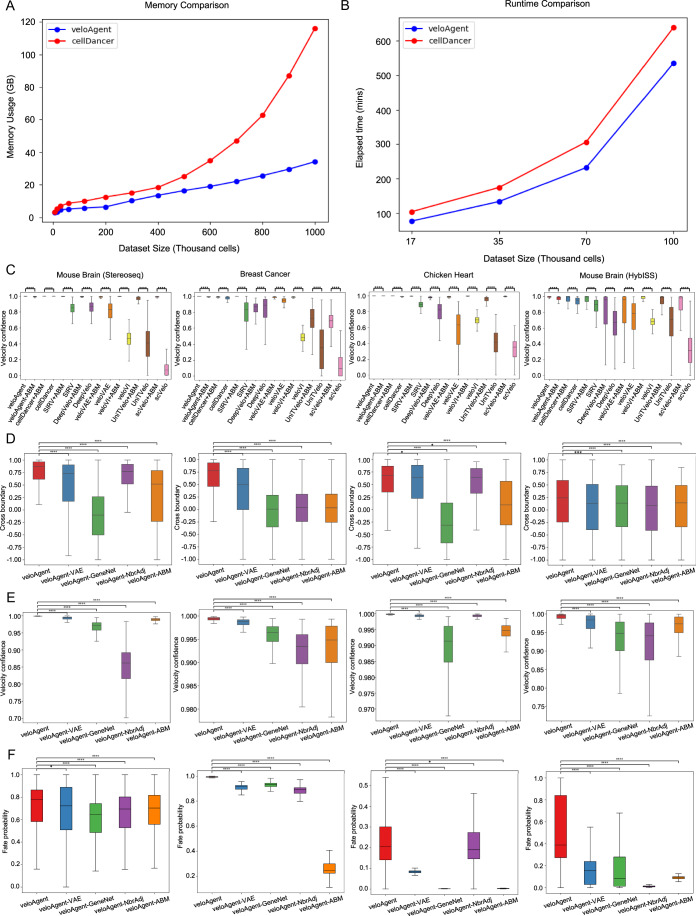
Beyond computational scalability, veloAgent enhances biological robustness through its agent-based modeling (ABM) module, which integrates spatial context to refine velocity fields. The ABM takes temporally inferred velocity estimates and couples them with spatial coordinates of neighboring cells to produce spatially coherent velocity directions. Notably, this module is fully modular and can be applied to improve the outputs of other RNA velocity methods without retraining. To directly assess the contribution of spatial information, we applied the ABM module to velocity embeddings generated by existing RNA velocity methods, incorporating spatial priors post hoc. Across all datasets, ABM integration markedly increased median velocity confidence for all methods (Fig. 6C). For example, relative to scVelo adding the ABM module led to the following performance improvements (Fig. 6C): mouse brain (Stereo-seq, 0.9943 vs. 0.0677; FDR < 1.0 × 10−³⁰⁸), breast cancer (0.6920 vs. 0.0929; FDR < 1.0 × 10−³⁰⁸), chicken heart (0.9959 vs. 0.3550; FDR < 1.0 × 10−³⁰⁸), and mouse brain (HybISS, 0.9794 vs. 0.3166; FDR < 1.0 × 10−³⁰⁸). These consistent gains demonstrate that the ABM functions as a general-purpose enhancement, improving spatial coherence while preserving veloAgent’s computational efficiency.
To evaluate model robustness, we conducted ablation experiments on spatial transcriptomics datasets using four complementary metrics: cross-boundary direction, fate probability, velocity confidence, and in-cluster coherence. Removing any of veloAgent’s key components—the VAE encoder (Phase 1), gene–gene interaction network (Phase 2), neighborhood adjustment (Phase 3), or ABM refinement (Phase 4)—significantly reduced performance, whereas the complete model consistently achieved the highest accuracy (Fig. 6D–F; Appendix Figs. S14 and S15). Removal of the ABM resulted in the largest performance reduction across spatial transcriptomics datasets, underscoring that the observed performance of veloAgent is primarily driven by incorporation of spatial priors rather than solely by the VAE or underlying gene–gene neural network (Fig. 6D–F). Ablation analyses on scRNA-seq-only datasets (without ABM) yielded consistent results (Appendix Fig. S16).
Discussion
In this study, we present veloAgent, a deep generative and agent-based model (ABM) for spatial RNA velocity estimation that incorporates spatial transcriptomics data. Most existing RNA velocity frameworks treat cells as independent points in expression space, neglecting the tissue architecture and interactions between cells that influence cell state transitions. veloAgent bridges this gap by combining a VAE for robust latent representation, a gene-regulatory-aware neural network that incorporates known molecular interactions, and an ABM that simulates each cell’s spatial microenvironment. This integration ensures that velocity estimates are not only informed by transcriptional dynamics but also constrained by spatial neighborhood structure, improving both accuracy and interpretability. Applied to developmental and disease datasets, veloAgent outperforms existing methods across quantitative benchmarks and captures literature-supported marker gene dynamics in their correct spatial contexts. Beyond trajectory inference, veloAgent’s in silico perturbation module predicts how changes in gene regulation or signaling alter cell fate, enabling targeted hypothesis generation in developmental biology oncology and regenerative medicine.
veloAgent offers several key advances over existing RNA velocity frameworks. First, it is designed for scalability through a gene-centric architecture, where model complexity scale with the number of genes—typically fixed for an organism—rather than the number of cells. This contrasts with cell-centric methods such as cellDancer, whose complexity grows with cell count, making large-scale analysis computationally expensive. By scaling with genes instead of cells, veloAgent achieves sublinear memory usage and can handle atlas-scale datasets with millions of cells. This is particularly important given the recent rise in single-cell experimental throughput, which is expected to continue growing. Unlike models that rely on global assumptions or cell-centric designs, our approach generalizes across tissues and experimental platforms without compromising interpretability or performance (Bergen et al, ref. 2021). Second, veloAgent uniquely integrates spatial transcriptomics data into the velocity inference process through its ABM module. In the ABM, individual cells are treated as agents and their velocities are refined using predefined local interaction rules that incorporate neighboring cells, spatial proximity, and transcriptional similarity. Although this module is not a full multi-step agent-based simulation framework, it preserves the central ABM principle of updating individual cellular states through local interactions. Spatial context is often overlooked in RNA velocity frameworks, yet it plays a fundamental role in shaping lineage boundaries, localized gene expression patterns, and environmental signals that guide cell behavior (Feng et al, ref. 2025; Ru et al, ref. 2023). By simulating the spatial microenvironments of each cell, veloAgent embeds tissue architecture into its RNA velocity estimations, ensuring that transcriptionally similar and spatially proximal cells are inferred to follow coherent trajectories. In contrast, existing approaches either omit spatial information entirely or use it only for post hoc projection (e.g., SIRV), which can visualize velocities on a tissue map but cannot influence the underlying estimation. veloAgent unifies both, incorporating spatial constraints during velocity inference and projecting the resulting vectors back into physical space to reveal region-specific linear trajectories and niche-dependent differentiation. Third, veloAgent’s modular ABM design allows it to function as a universal booster, seamlessly integrating with existing RNA velocity frameworks. By coupling their outputs with spatial context, the ABM refines and harmonizes velocity fields across tissue regions, substantially enhancing spatial coherence and biological interpretability without retraining of the original models. Finally, beyond trajectory inference, veloAgent introduces an in silico perturbation framework that allows targeted manipulation of RNA velocity vectors to simulate the effects of gene regulatory or signaling interventions. In silico perturbation has been employed in other areas in single-cell genomics outside of RNA velocity (Jolasun et al, ref. 2025; Raghavan et al, ref. 2025; Zhao et al, ref. 2025; Zheng et al, ref. 2025). Our in silico perturbation enables rational cell state steering and identification of candidate therapeutic targets. As a case study, we show that veloAgent can recover key breast cancer linked genes whose perturbation could reverse disease trajectories, including ERBB2, which has existing FDA-approved inhibitors. This opens new avenues for therapeutic discovery, such as identifying candidate drug targets or designing intervention strategies for regenerative medicine and cell reprogramming.
While veloAgent offers significant advancements, it also faces limitations that warrant future investigation. Since Visium spots may capture transcripts from multiple cells, inferred dynamics represent averaged transcriptional states. However, consistent results across higher-resolution platforms such as Stereo-seq and HybISS suggest that veloAgent captures biologically meaningful transition signals that are robust to spatial granularity. Secondly, the current perturbation framework models single gene interventions for simplicity and does not capture the complexity of combinatorial perturbations or the interplay of multiple regulatory pathways. Additionally, integrating other omics modalities such as ATAC-seq and proteomics could further enhance both velocity estimation as well as perturbation modeling by providing a more complete view of cell state and regulatory control. Another limitation arises from incomplete prior knowledge in interaction databases such as STRING. For genes without annotated interactions, we connect them to all other gene nodes in the gene–gene neural network, allowing the model to learn potential regulatory relationships from the data. While this ensures that such genes are not excluded from the model, it may introduce biologically implausible connections and additional noise. Nevertheless, this design represents a practical compromise given the incompleteness of current interaction databases and is consistent with approaches used in prior work that combine biological priors with data-driven learning. A further limitation is that veloAgent, like other RNA velocity methods, operates at the gene level and does not capture exon-level transcriptional dynamics. Incorporating exon-level quantification, as explored in DOLPHIN (Song et al, ref. 2025), could enable more precise modeling of transcriptional regulation and RNA velocity estimates. Finally, while veloAgent is designed for scalability, it has not yet been applied to a true atlas dataset with millions of cells, representing an important step to fully demonstrate its large-scale applicability.
veloAgent defines a scalable, spatially aware, and biologically interpretable framework that extends RNA-velocity analysis into previously inaccessible domains. Its scalability supports emerging cell-atlas projects, and its perturbation module bridges computational modeling with experimental design. The framework provides a foundation for predictive, intervention-ready models of cellular behavior, with the potential to accelerate discovery, advance developmental understanding, and guide therapeutic innovation.
Methods
Reagents and tools table
| Reagent/Resource | Reference or Source | Identifier or Catalog Number |
|---|---|---|
| Experimental models | ||
| N/A | N/A | N/A |
| Recombinant DNA | ||
| N/A | N/A | N/A |
| Antibodies | ||
| N/A | N/A | N/A |
| Oligonucleotides and other sequence-based reagents | ||
| N/A | N/A | N/A |
| Chemicals, Enzymes and other reagents | ||
| N/A | N/A | N/A |
| Software | ||
| Python v3.8.19 | ||
| cellDancer | https://github.com/GuangyuWangLab2021/cellDancer | |
| scVelo v0.3.2 | https://github.com/theislab/scvelo | |
| DeepVelo v0.2.5 | https://github.com/bowang-lab/DeepVelo | |
| VeloVI v0.3.1 | https://github.com/YosefLab/velovi | |
| VeloVAE | https://github.com/welch-lab/velovae | |
| UniTVelo v0.2.4 | https://github.com/StatBiomed/UniTVelo | |
| VeloAE v0.2.0 | https://github.com/qiaochen/VeloAE | |
| CellRank v2.0.5 | https://github.com/scverse/cellrank | |
| SCENIC v0.12.1 | https://github.com/aertslab/SCENIC | |
| Scanpy v1.9.8 | https://github.com/scverse/scanpy | |
| Other | ||
Single-cell sequencing data preprocessing
Spliced and unspliced count matrices were obtained using the standard velocyto pipeline (La Manno et al, ref. 2018). For datasets in which these matrices were not already available, we generated them using velocyto with standard/default settings; otherwise, we used the publicly available processed matrices directly.
We processed the single-cell RNA-sequencing data using the scVelo pipeline. We began by filtering out cells with less than 20 genes. We then selected the top 2000 highly variable genes and normalized against the library size and transformed into log space. We then computed a nearest-neighbor graph (with 30 neighbors) in principal component analysis space (30 principal components). Finally, we calculated the first-order moment of spliced and unspliced counts for subsequent velocity estimation steps.
We used spatial transcriptomics datasets from multiple technologies, including Visium, Stereo-seq, SeqFISH+, and HybISS. We note that Visium’s poly-A capture chemistry may lead to reduced intronic capture efficiency compared to single-cell RNA-sequencing, potentially resulting in increased sparsity in unspliced counts. In veloAgent, this limitation is partially alleviated through a combination of latent embedding and the agent-based modeling (ABM) refinement module. The latent representation provides a denoised and compact encoding of transcriptional states, while the ABM module aggregates information from neighboring cells based on spatial proximity and transcriptional similarity, thereby stabilizing velocity estimation under sparse conditions.
veloAgent framework
The veloAgent model consists of three sub-components, a variational autoencoder (VAE), a deep neural network, and an agent-based model (ABM).
Phase 1: Variational autoencoder
veloAgent uses a VAE designed to represent high-dimensional single-cell gene expression data within a lower-dimensional embedding space. Specifically, our VAE incorporates two separate encoders, each sharing an identical structure composed of three fully connected hidden layers. These hidden layers progressively decrease in dimension, evenly spaced in thirds, ultimately reducing the input to the latent dimension Z. Each encoder, \({q}_{\theta }\), independently process the spliced (\({q}_{\theta }^{S}\)) and unspliced (\({q}_{\theta }^{U}\)) gene expression, transforming them into distinct low-dimensional embeddings. The outputs from both encoders are concatenated to form a unified representation, \(h={concat}\left({q}_{\theta }^{S}\left({{{{\bf{X}}}}}_{S}\right),\,{q}_{\theta }^{U}\left({{{{\bf{X}}}}}_{U}\right)\right)\). Two MLPs are then employed to determine the mean vectors, \({\mu }_{z}={f}_{{\mu }_{\theta }}\left({\mu }_{z}|h\right)\), and standard deviation vectors \({\sigma }_{z}={f}_{{\sigma }_{\theta }}\left({\sigma }_{z}|h\right)\) of the latent representation, assuming a multivariate normal distribution as a prior, \({{{\bf{Z}}}}{{{\mathscr{ \sim }}}}{{{\mathscr{N}}}}\left({\mu }_{z},\,{\sigma }_{z}^{2}\right)\). The approximated posterior distribution is represented as \({q}_{\theta }({{{\bf{Z}}}}\,|\,{{{{\bf{X}}}}}_{S},\,{{{{\bf{X}}}}}_{U})\). The latent representation is particularly valuable, as they are designed to preserve critical biological information while reducing noise and less relevant features. This enables more coherent and accurate estimations of single-cell velocities. Two corresponding decoders (\({p}_{\psi }^{S},\,{p}_{\psi }^{U}\)) mirror the encoders architectures reconstructing the original cell-by-gene matrices for splices and unspliced counts from Z. The VAE loss function is given by the following equation:
\[
{{{{\mathscr{L}}}}}_{{VAE}}= {D}_{{{{\rm{KL}}}}}({q}_{\theta }({{{\bf{Z}}}}|{{{{\bf{X}}}}}_{{{{\rm{S}}}}},{{{{\bf{X}}}}}_{{{{\rm{U}}}}}){||p}\left({{{\bf{Z}}}}\right)) \\ -{{\mathbb{E}}}_{{q}_{\theta }({{{\bf{Z}}}}|{{{{\bf{X}}}}}_{{{{\rm{S}}}}},{{{{\bf{X}}}}}_{{{{\rm{U}}}}})}\left[\log {p}_{\phi }^{S}({{{{\bf{X}}}}}_{{{{\rm{s}}}}}|{{{\bf{Z}}}})+\log {p}_{\psi }^{U}({{{{\bf{X}}}}}_{U}|{{{\bf{Z}}}})\right]
\]
Phase 2: Velocity rate estimation using deep neural network
The transcriptional kinetics of an individual gene, g, are modeled by a system of two ordinary differential equations:
\[
\frac{{{{\rm{d}}}}{{{{\bf{u}}}}}_{i,g}\left(t\right)}{{{{\rm{d}}}}t}={{{{\boldsymbol{\alpha }}}}}_{i,g}\left(t\right)-{{{{\boldsymbol{\beta }}}}}_{i,g}\left(t\right)\cdot {{{{\bf{u}}}}}_{i,g}\left(t\right)
\]
\[
\frac{{{{\rm{d}}}}{{{{\bf{s}}}}}_{i,g}\left(t\right)}{{{{\rm{d}}}}t}={{{{\boldsymbol{\beta }}}}}_{i,g}\left(t\right){\cdot {{{\bf{u}}}}}_{i,g}\left(t\right)-{{{{\boldsymbol{\gamma }}}}}_{i,g}\left(t\right){\cdot {{{\bf{s}}}}}_{i,g}\left(t\right)
\]
where \({{{{\bf{u}}}}}_{i,g}\left(t\right)\) and \({{{{\bf{s}}}}}_{i,g}\left(t\right)\) represent the concentrations of the premature and mature mRNAs for cell i, gene g at time t and \({{{{\boldsymbol{\alpha }}}}}_{i,g}\), \({{{{\boldsymbol{\beta }}}}}_{i,g}\), \({{{{\boldsymbol{\gamma }}}}}_{i,g}\) represent the transcription, splicing and degradation rates at time t, respectively. Previous methods assume that parameters α, β, and γ are either constant or universally shared across all genes and cells. However, this assumption inadequately models the continuously evolving and heterogeneous cell subpopulations.
To accurately estimate α, β, and γ, we utilize a neural network that takes as input the latent representation Z generated by the VAE in phase 1. The first hidden layer has dimensionality equal to the number of genes (G) and connects the latent representation to gene-level feature through dense fully connected weights. The second hidden layer is also of size G, but instead of dense connections as in a standard multilayer perceptron, it incorporates sparse connections informed by gene–gene interaction data from the STRING database (Szklarczyk et al, ref. 2023). Specifically, when a corresponding interaction exists between two genes in the STRING, a trainable connection is introduced between their corresponding nodes in the model. We incorporate all available interactions from STRING to maximize the use of prior biological knowledge and do not filter edges based on confidence score, as this also led to better performance than restricting the model to only high-confidence interactions (Appendix Fig. S17B,C). Genes without known connections are connected to all other gene nodes, resulting in a fully connected node for that gene. This design ensures that genes lacking documented interactions are not excluded from the model and allows the network to learn potential regulatory relationships directly from the data (Raghavan et al, ref. 2025). We found that the majority of genes in the datasets were also present in STRING (Appendix Fig. S17A). Following this biologically informed layer, the network proceeds through two additional fully connected layers, expanding first to 2G and then to 3G, where G is the number of genes. The final layer is structured such that the first G units correspond to transcription rate (α), the second G units correspond to splicing rate (β), and the third G units correspond to degradation rate (γ). The output provides independent rate parameters for each gene in every cell, resulting in cell and gene-specific estimates of kinetic rates.
The neural network is trained using a loss function based on cosine similarity to compare the predicted RNA velocity with observed velocity vectors, similar to in cellDancer (Li et al, ref. 2024). Given the outputs α, β, and γ, the predicted spliced (\(\hat{{{{\boldsymbol{s}}}}}\)) and unspliced (\(\hat{{{{\boldsymbol{u}}}}}\)) counts are obtained using the ordinary differential equations. The velocity vector for each cell is defined as the change from its observed counts to its predicted counts:
\[
{{{{\bf{v}}}}}_{i}=\left(\,{\hat{{{{\bf{u}}}}}}_{i}(t)-{{{{\bf{u}}}}}_{i}\,\left(t\right),\,{\hat{{{{\bf{s}}}}}}_{i}(t)-{{{{\bf{s}}}}}_{i}\left(t\right)\right),
\]
\[
{{{{{\bf{v}}}}}^{{{{\prime} }}}}_{i}=\left(\,{{{{\bf{u}}}}}_{{i}^{{\prime} }}(t)\,-{{{{\bf{u}}}}}_{i}\left(t\right),\,{{{{\bf{s}}}}}_{{i}^{{\prime} }}\left(t\right)-{{{{\bf{s}}}}}_{i}\left(t\right)\right)
\]
Where \(\{{i}^{{\prime} }\}\) is the collection of neighboring cells of cell i; and \(i{\prime}\) is the neighboring cell that minimizes the cosine similarity loss function. To assess the quality of the predicted velocity, we compute the cosine similarity between the velocity of cell i, \({v}_{i}\), and the velocity vectors of neighboring cells:
\[
{{{\boldsymbol{{{\mathscr{L}}}}}}}_{{NN}}={\sum }_{i=1}^{N}[1-{\max }_{j{{{\mathscr{\in }}}}{{{\mathscr{N}}}}\left(i\right)}\frac{{{{{\bf{v}}}}}_{i}\cdot {{{{{\bf{v}}}}}^{{{{\prime} }}}}_{i}}{\left|\left|{{{{\bf{v}}}}}_{i}\right|\right|{||}{{{{{\bf{v}}}}}^{{{{\prime} }}}}_{i}{||}}]
\]
where N is the number of cells and N(i) is the neighborhood of cell i, and j is a neighboring cell of i. We take the maximum cosine similarity between the cell’s predicted velocity and the velocity of all its neighbors.
Phase 3: Cell velocity adjustment
In this phase, we refine each cell’s predicted velocity to produce a more consistent and confident estimate by leveraging information from neighboring cells. Specifically, we adjust each cell’s velocity to align with those of its neighbors by minimizing the cosine similarity between their velocity vectors. This alignment step enhances the stability and reliability of the velocity estimates by encouraging local consistency in the velocity field. The underlying assumption is that cells within a local neighborhood in gene expression space tend to follow similar dynamic patterns. The loss function used for this alignment is formally defined below, where N is the number of cells, N(i) is the neighborhood of cell i, and \(j \, \epsilon \, {{{\mathscr{N}}}}\left(i\right)\) is a neighboring cell of i:
\[
{{{\boldsymbol{{{\mathscr{L}}}}}}}_{{NBR}}=-{\sum }_{i=1}^{N}\frac{1}{|{{{\mathscr{N}}}}\left(i\right)|}{\sum }_{j{{{\mathscr{\in }}}}{{{\mathscr{N}}}}\left(i\right)}\frac{{{{{\bf{v}}}}}_{i}\cdot {{{{\bf{v}}}}}_{j}}{\left|\left|{{{{\bf{v}}}}}_{i}\right|\right|{||}{{{{\bf{v}}}}}_{j}{||}}
\]
The overall loss function of veloAgent combines three components: the VAE reconstruction loss \({{{{\mathscr{L}}}}}_{{VAE}}\), the rate prediction loss from the neural network \({{{{\mathscr{L}}}}}_{{NN}}\), and the neighborhood coherence loss \({{{{\mathscr{L}}}}}_{{NBR}}\). Together, these form the total training objective of the model, expressed as:
\[
{{\boldsymbol{{{\mathscr{L}}}}}}={{{\boldsymbol{{{\mathscr{L}}}}}}}_{{VAE}}+\,{{{\boldsymbol{{{\mathscr{L}}}}}}}_{{NN}}+{{{{\boldsymbol{\tau }}}}{{\boldsymbol{{{\mathscr{L}}}}}}}_{{NBR}}
\]
Agent-based model for spatial RNA velocity modeling
To incorporate spatial context into RNA velocity estimation, we developed an agent-based module in which each cell is treated as an agent and its velocity is refined using predefined local interaction rules based on neighboring cells within a defined spatial radius. Although this module is not a full multi-step agent-based simulation framework, it follows the core principle of agent-based modeling by updating individual cellular states through local interactions. ABMs have previously been used to model cellular dynamics in single-cell and spatial transcriptomics data, capturing complex interactions among cells in a spatially aware manner (Raghavan et al, ref. 2025). The model refines velocity estimates based on three key factors: local cell density, inverse distance, and RNA expression similarity. To construct the ABM, we first define the states and behaviors of the agent, where each agent represents a cell in the biological system. Agent states capture the properties and dynamic features of each cell, while agent rules define how each agent behaves.
Cell agent state description
Since our primary goal is to study RNA velocity in the context of spatially organized tissues, each cell agent is characterized by features relevant of both its transcriptional state and its spatial interactions. These include gene expression profiles, RNA velocity vectors, and spatial coordinates. We also include metadata such as cell type or tissue annotations, batch ID etc.
RNA velocity adjustment behavior rules
The agent behaviors are defined by rules governing how each cell’s velocity is modulated by its neighbors. For a given cell i, the neighborhood \(N\left(i\right)\) comprises all cells located within a specified radius r. The updated velocity of cell i is computed as a weighted combination of its own velocity and those of its neighbors, reflecting three biologically motivated influence terms. First, neighboring cells with similar expression profiles are expected to exhibit similar transcriptional dynamics. This relationship is captured by a similarity weight (SW) defined as
\[
{{{\bf{S}}}}{{{{\bf{W}}}}}_{{ij}}={\sigma }_{{\mbox{ABM}}}\cdot \frac{{{\mbox{cosine}}}\left({{{{\bf{x}}}}}_{i},{{{{\bf{x}}}}}_{j}\right)}{{\sum }_{k\in N\left(i\right)}{{\mbox{cosine}}}\left({{{{\bf{x}}}}}_{i},{{{{\bf{x}}}}}_{k}\right)}
\]
Here, \({\sigma }_{{\mbox{ABM}}}\) is a scaling constant and \({{{{\bf{x}}}}}_{i}\) is the expression profile of cell i.
Second, denser local environments exert greater collective influence on a cell’s velocity, quantified by a density weight (DW)
\[
{{{\bf{D}}}}{{{{\bf{W}}}}}_{i}=\frac{{{{{\boldsymbol{\rho }}}}}_{{{{\bf{i}}}}}-\min ({{{\boldsymbol{\rho }}}})}{\max ({{{\boldsymbol{\rho }}}})-\min ({{{\boldsymbol{\rho }}}})},
\]
where \({{{{\boldsymbol{\rho }}}}}_{{{{\bf{i}}}}}\) denotes the local cell density for cell i, computed as the number of neighboring cells within the predefined radius. We observed that not including the density weight reduced model performance (Appendix Fig. S18).
Third, spatial proximity modulates intercellular influence, as nearby cells are more likely to affect one another through diffusion-limited molecular signaling that alters gene expression. This effect is modeled using spatial inverse-distance weighting (SpW), assigning stronger influence on closer neighbors.
\[
{{{\bf{Sp}}}}{{{{\bf{W}}}}}_{{ij}}=({1-\sigma }_{{\mbox{ABM}}})\cdot \,\frac{1/{d}_{{ij}}^{{\tau }_{{\mbox{spatial}}}}}{{\sum }_{k\in N(i)}1/{d}_{{ik}}^{{\tau }_{{\mbox{spatial}}}}},
\]
where \({d}_{{ij}}\) is the Euclidean distance between cells i and j, and \({\tau }_{{\mbox{spatial}}}=2\), for 2D data.
The refined velocity (\({{{\rm{RV}}}}^{\prime}\)) for each cell i is then obtained by combining its intrinsic and neighborhood influences according to
\[
{{{\bf{R}}}}{{{{\bf{V}}}}}_{i}^{{{{\prime} }}}={{{\bf{D}}}}{{{{\bf{W}}}}}_{i}\cdot \,{{{\bf{R}}}}{{{{\bf{V}}}}}_{i}+\mathop{\sum }_{j\in N(i)}({{{\bf{Sp}}}}{{{{\bf{W}}}}}_{{ij}}\cdot {{{\bf{S}}}}{{{{\bf{W}}}}}_{{ij}})\,{{{\bf{R}}}}{{{{\bf{V}}}}}_{j}
\]
\({{{\bf{R}}}}{{{{\bf{V}}}}}_{i}\) is the velocity of cell i after phase 3. This formulation ensures that transcriptionally similar and spatially proximal cells exhibit coherent directional dynamics, while preserving biological heterogeneity across distinct tissue regions. Through this spatial refinement, the ABM transforms RNA velocity into a tissue-consistent and biologically interpretable model of cellular state transitions.
In silico perturbation
To evaluate the contribution of individual genes to RNA velocity and trajectory inference, we implemented an in silico perturbation framework within veloAgent. Perturbation is applied to either the transcription rate parameter (α) or the splicing rate parameter (β) for a given gene, but not both simultaneously. In the main analyses (Fig. 5) presented in this study, perturbations were performed by modifying α, whereas additional experiments modifying β are reported in Appendix Fig. S11. For each gene, a virtual loss-of-function was simulated by setting its transcription rate parameter (α) or splicing rate parameter (β) to zero for all cells, effectively removing its transcriptional or splicing influence from the learned kinetic system. When α is modified, the remaining kinetic parameters (β and γ) remain fixed, and similarly, when β is perturbed α and γ remain unchanged. The model was then used to recompute RNA velocity estimates (\({v}^{(-g)}\)), allowing direct assessment of how the perturbation altered predicted cellular dynamics. Since perturbation is applied after the gene–gene interaction network has already inferred the kinetic parameters α, β, and γ, the neural network is not retrained during perturbation, and all learned model parameters remain unchanged.
The impact of each perturbation was quantified using the cross-boundary direction (CBD) metric. This metric quantifies how well velocity vectors maintain the correct directionality between transitioning cell types (e.g., cell type A to cell type B), reflecting the gene’s influence (\({{{{\bf{I}}}}}_{g}\)) on the inferred dynamic processes \({{{\rm{CBD}}}}\left({{{\bf{v}}}},{d}\left(A,{B}\right)\right)\). The change in CBD following perturbation, \({{{\rm{CBD}}}}({v}^{(-g)},d(B,A))\), reflects the influence of gene g on the inferred dynamic process. A gene-level importance score was computed as
\[
{I}_{g}=\frac{1}{N}{\sum }_{i=1}^{N}{{\mbox{CBD}}}({{{{\bf{v}}}}}_{i}^{(-g)},d(B,A))
\]
where N denotes the total number of cells. This score represents the extent to which perturbing a specific gene alters trajectory directionality, thus identifying regulators that drive or constrain lineage progression. Statistical significance was determined using permutation testing to identify genes whose perturbation caused a significant disruption in velocity alignment.
To assess the biological relevance of these computational perturbations, we performed Reactome pathway enrichment analysis for the mouse brain developmental dataset, confirming that top-ranked perturbed genes were enriched for neurogenesis- and differentiation-related pathways. For the breast cancer dataset, we validated candidate therapeutic genes by examining their association with patient survival using Kaplan–Meier (KM) analysis, linking predicted regulatory effects to clinical outcomes.
Benchmarking
We benchmarked veloAgent against seven state-of-the-art RNA velocity frameworks encompassing both conventional and spatially aware approaches. Among these, SIRV is the only method that also uses spatial transcriptomics data for spatial velocity projection. Comparisons were performed on scRNA-seq datasets for all methods except SIRV and on spatial transcriptomics datasets for all methods.
Performance was evaluated using three established metrics: velocity confidence, cross-boundary direction, and fate probability accuracy. Velocity confidence measures the local cosine similarity between a cell’s velocity vector and those of its neighbors, reflecting the global coherence and reliability of the inferred velocity field. Cross-boundary direction assesses whether velocity vectors point in the biologically expected direction across annotated lineage transitions, quantifying directional accuracy at cell-type boundaries. Fate probability accuracy evaluates how well each method captures the commitment of cells toward terminal states based on their inferred RNA velocities. Fate probabilities were computed by constructing velocity-based transition matrices and quantifying the agreement between inferred and known terminal states.
To specifically assess spatial performance, we extended velocity confidence and fate probability into spatially aware variants, termed spatial velocity confidence (Qiao and Huang, ref. 2021) and spatial fate probability (Lange et al, ref. 2022). These metrics compute coherence and fate commitment using spatial neighborhoods rather than transcriptomic nearest neighbors, thereby evaluating whether inferred velocities are consistent with tissue architecture. This extension enables direct quantification of spatial accuracy beyond gene expression similarity alone.
Ablation
To evaluate the contribution of each major component in the veloAgent framework, we conducted systematic ablation experiments in which individual modules were selectively removed or simplified. Four variants were tested: the VAE, the gene–gene interaction network, the neighbor refinement mechanism, and the agent-based model (ABM). In the veloAgent-VAE variant, the learned VAE was replaced with a fixed principal component analysis (PCA) projection of the spliced and unspliced counts, eliminating the ability to learn a nonlinear latent space that captures complex cellular structure. In the veloAgent-GeneNet variant, the biologically informed gene-gene interaction layer was substituted with a fully connected layer, removing the inductive bias derived from known molecular relationships and thereby reducing the biological interpretability of the learned dependencies. The veloAgent-NBR variant ablated the neighborhood refinement step, which aligns velocity vectors across transcriptionally similar cells to ensure local directional consistency. The veloAgent-ABM variant excluded spatial refinement, preventing the model from leveraging spatial transcriptomics data to enhance tissue-level coherence and directional accuracy. All ablation variants were evaluated using the same three metrics—cross-boundary correctness, velocity confidence, and fate probability—to quantify the contribution of each component.
Driver gene analysis
To identify key driver genes underlying cellular differentiation trajectories, we performed a pseudotime analysis using RNA velocity-based ordering. After computing the velocity graph, we derived pseudotime estimates for each cell using scv.tl.velocity_pseudotime. We then visualized the expression dynamics of genes of interest (GOIs) across pseudotime using a heatmap. The selected GOIs were identified from CellRank (Lange et al, ref. 2022) lineage analysis as putative drivers of specific fate transitions. The heatmap was sorted by velocity pseudotime to capture temporal expression trends, highlighting the sequential activation and repression of lineage-associated genes along differentiation paths.
To further validate the relevance of lineage-driving genes identified through CellRank, we extracted all genes significantly associated with a specific terminal fate based on their correlation with fate probabilities. We then performed Gene Ontology (GO) enrichment analysis on this set of genes to evaluate the biological processes and pathways most enriched within each fate, thereby confirming the functional relevance of the identified gene programs.
Transcription factor analysis
To investigate the transcriptional regulators associated with terminal fates, we performed transcription factor (TF) inference using SCENIC (Aibar et al, ref. 2017) pipeline. Transcription factor-target gene relationships were first inferred from gene co-expression patterns and then refined by assessing the enrichment of transcription factor binding motifs in the regulatory regions of target genes, using a curated database of mouse DNA motifs derived from experimental evidence. Regulon activity was quantified using AUCell and summarized by cell type to reveal distinct regulatory programs associated with specific cellular identities.
Hyperparameters
All hyperparameters used were fixed across datasets. The VAE was trained using Adam optimizer with a learning rate of \(1\times {10}^{-2}\) for 1000 iterations (or when early stopping was reached) and a latent embedding dimension of 5. The neural network for kinetic parameter estimation was trained using Adam optimization with a learning rate of \(1\times {10}^{-4}\) for 500 iterations (or when early stopping is reached). The number of nearest neighbors for the neural network and the neighborhood refinement was set to 30. The neighborhood velocity refinement module was run for 50 iterations. τ which controls the strength of the regularization of the neighborhood refinement loss is by default set to 0.2, as this value gave the best performance (Appendix Fig. S19). For the ABM. Spatial velocity refinement was performed over 100 update steps. The spatial interaction radius r was set to a value for each dataset that led to each cell having roughly between 15 and 20 neighbours on average. The transcriptional similarity weight (SW) is controlled by \({\sigma }_{{\mbox{ABM}}}\) which was by default set to 0.7 as this value gave the best performance (Appendix Fig. S20). The degree of spatial freedom \({\tau }_{{\mbox{spatial}}}\) was set to 2, since the spatial transcriptomics data was derived from 2-dimensional slices.
Computer configurations
Computational experiments were conducted on a high-performance computing server running Ubuntu 20.04.6 LTS with Linux kernel 5.4.0-216-generic (x86_64). The system was equipped with two Intel® Xeon® Platinum 8160 CPUs (96 logical cores, 2.10 GHz), 500 GB of RAM, and 8 GPUs (four NVIDIA Tesla M10 GPUs, 8 GB each; and four NVIDIA A16 GPUs, 15 GB each).
Supplementary Materials
References
- T Abdelaal, LM Grossouw, RJ Pasterkamp, BP Lelieveldt, MJ Reinders, A Mahfouz. SIRV: spatial inference of RNA velocity at the single-cell resolution. NAR Genomics Bioinforma, 2024. [DOI]
- A Acharya, ST Baek, G Huang, B Eskiocak, S Goetsch, CY Sung, S Banfi, MF Sauer, GS Olsen, JS Duffield. The bHLH transcription factor Tcf21 is required for lineage-specific EMT of cardiac fibroblast progenitors. Development, 2012. [DOI | PubMed]
- S Aibar, CB González-Blas, T Moerman, VA Huynh-Thu, H Imrichova, G Hulselmans, F Rambow, J-C Marine, P Geurts, J Aerts. SCENIC: single-cell regulatory network inference and clustering. Nat Methods, 2017. [DOI | PubMed]
- E Armingol, A Officer, O Harismendy, NE Lewis. Deciphering cell–cell interactions and communication from gene expression. Nat Rev Genet, 2021. [DOI | PubMed]
- M Asp, J Bergenstråhle, J Lundeberg. Spatially resolved transcriptomes—next generation tools for tissue exploration. BioEssays, 2020. [DOI]
- V Bergen, M Lange, S Peidli, FA Wolf, FJ Theis. Generalizing RNA velocity to transient cell states through dynamical modeling. Nat Biotechnol, 2020. [DOI | PubMed]
- V Bergen, RA Soldatov, PV Kharchenko, FJ Theis. RNA velocity—current challenges and future perspectives. Mol Syst Biol, 2021. [DOI]
- A Chen, S Liao, M Cheng, K Ma, L Wu, Y Lai, X Qiu, J Yang, J Xu, S Hao. Spatiotemporal transcriptomic atlas of mouse organogenesis using DNA nanoball-patterned arrays. Cell, 2022. [DOI | PubMed]
- VV Chizhikov, AG Lindgren, Y Mishima, RW Roberts, KA Aldinger, GR Miesegaes, DS Currle, ES Monuki, KJ Millen. Lmx1a regulates fates and location of cells originating from the cerebellar rhombic lip and telencephalic cortical hem. Proc Natl Acad Sci USA, 2010. [DOI | PubMed]
- SJ Conway, JD Molkentin. Periostin as a heterofunctional regulator of cardiac development and disease. Curr Genomics, 2008. [DOI | PubMed]
- H Cui, H Maan, MC Vladoiu, J Zhang, MD Taylor, B Wang. DeepVelo: deep learning extends RNA velocity to multi-lineage systems with cell-specific kinetics. Genome Biol, 2024. [DOI | PubMed]
- L das Neves, CS Duchala, F Godinho, MA Haxhiu, C Colmenares, WB Macklin, CE Campbell, KG Butz, RM Gronostajski. Disruption of the murine nuclear factor IA gene (Nfia) results in perinatal lethality, hydrocephalus, and agenesis of the corpus callosum. Proc Natl Acad Sci USA, 1999. [DOI | PubMed]
- S Deckx, DM Johnson, M Rienks, P Carai, E Van Deel, J Van der Velden, KR Sipido, S Heymans, A-P Papageorgiou. Extracellular SPARC increases cardiomyocyte contraction during health and disease. PLoS ONE, 2019. [DOI | PubMed]
- Deng Y, He Y, Xu J, He H, Zhang M, Li G (2025) Cardiac Fibroblasts regulate myocardium and coronary vasculature development via the collagen signaling pathway. eLife 13:RP102305
- EEI Dumbrava, K Balaji, K Raghav, K Hess, M Javle, M Blum-Murphy, J Ajani, S Kopetz, R Broaddus, M Routbort. Targeting ERBB2 (HER2) amplification identified by next-generation sequencing in patients with advanced or metastatic solid tumors beyond conventional indications. JCO Precis Oncol, 2019. [DOI]
- J Feng, E Janečková, T Guo, H Ziaei, M Zhang, JJ Geng, S Cha, A Araujo-Villalba, M Liu, T-V Ho. High-resolution spatial transcriptomics and cell lineage analysis reveal spatiotemporal cell fate determination during craniofacial development. Nat Commun, 2025. [DOI | PubMed]
- BR Ferguson, W-J Gao. Development of thalamocortical connections between the mediodorsal thalamus and the prefrontal cortex and its implication in cognition. Front Hum Neurosci, 2015. [DOI | PubMed]
- MD Galbraith, AJ Donner, JM Espinosa. CDK8: a positive regulator of transcription. Transcription, 2010. [DOI | PubMed]
- M Gao, C Qiao, Y Huang. UniTVelo: temporally unified RNA velocity reinforces single-cell trajectory inference. Nat Commun, 2022. [DOI | PubMed]
- A Gayoso, P Weiler, M Lotfollahi, D Klein, J Hong, A Streets, FJ Theis, N Yosef. Deep generative modeling of transcriptional dynamics for RNA velocity analysis in single cells. Nat Methods, 2024. [DOI | PubMed]
- A Giacco, S Iervolino, F Cioffi, T Peluso, G Mercurio, L Roberto, V de Rosa, M Cammarota, S Varricchio, S Staibano. Brain abnormalities in young single-and double-heterozygote mice for both Nkx2-1-and Pax8-null mutations. Mol Neurobiol, 2025. [DOI | PubMed]
- Gu Y, Blaauw D, Welch JD (2026) Bayesian inference of RNA velocity incorporating timepoints, lineage bifurcations, and count data. PLoS Comput Biol 22:e1014060
- W Guido. Development, form, and function of the mouse visual thalamus. J Neurophysiol, 2018. [DOI | PubMed]
- D Gyllborg, CM Langseth, X Qian, E Choi, SM Salas, MM Hilscher, ES Lein, M Nilsson. Hybridization-based in situ sequencing (HybISS) for spatially resolved transcriptomics in human and mouse brain tissue. Nucleic Acids Res, 2020. [DOI | PubMed]
- MV Hunter, R Moncada, JM Weiss, I Yanai, RM White. Spatially resolved transcriptomics reveals the architecture of the tumor-microenvironment interface. Nat Commun, 2021. [DOI | PubMed]
- Jolasun Y, Song K, Zheng Y, Wang J, Fonseca GJ, Eidelman DH, Ding J (2025) SIDISH integrates single-cell and bulk transcriptomics to identify high-risk cells and guide precision therapeutics through in silico perturbation. Nat Commun 6:1127
- Y Kashima, Y Sakamoto, K Kaneko, M Seki, Y Suzuki, A Suzuki. Single-cell sequencing techniques from individual to multiomics analyses. Exp Mol Med, 2020. [DOI | PubMed]
- AA Kolodziejczyk, JK Kim, V Svensson, JC Marioni, SA Teichmann. The technology and biology of single-cell RNA sequencing. Mol Cell, 2015. [DOI | PubMed]
- T Kouno, M de Hoon, JC Mar, Y Tomaru, M Kawano, P Carninci, H Suzuki, Y Hayashizaki, JW Shin. Temporal dynamics and transcriptional control using single-cell gene expression analysis. Genome Biol, 2013. [DOI | PubMed]
- G La Manno, R Soldatov, A Zeisel, E Braun, H Hochgerner, V Petukhov, K Lidschreiber, ME Kastriti, P Lönnerberg, A Furlan. RNA velocity of single cells. Nature, 2018. [DOI | PubMed]
- CF Landry, JA Ellison, TM Pribyl, C Campagnoni, K Kampf, AT Campagnoni. Myelin basic protein gene expression in neurons: developmental and regional changes in protein targeting within neuronal nuclei, cell bodies, and processes. J Neurosci, 1996. [DOI | PubMed]
- M Lange, V Bergen, M Klein, M Setty, B Reuter, M Bakhti, H Lickert, M Ansari, J Schniering, HB Schiller. CellRank for directed single-cell fate mapping. Nat methods, 2022. [DOI | PubMed]
- D Larocque, A Galarneau, H-N Liu, M Scott, G Almazan, S Richard. Protection of p27Kip1 mRNA by quaking RNA binding proteins promotes oligodendrocyte differentiation. Nat Neurosci, 2005. [DOI | PubMed]
- Li M, Wang J, Qian Q, Chen B, Zhang Z, Barroso E, Zhang Y, Hall DD, Abel ED, Song L-S (2022) Gamma-interferon-inducible lysosomal thiol reductase maintains cardiac immuno-metabolic homeostasis in heart failure. Preprint at 10.1101/2022.07.03.498477
- S Li, P Zhang, W Chen, L Ye, KW Brannan, N-T Le, J-i Abe, JP Cooke, G Wang. A relay velocity model infers cell-dependent RNA velocity. Nat Biotechnol, 2024. [DOI | PubMed]
- Y Li. Cellular Mechanism of Mouse Atrial Development. Open J Regen Med, 2022
- SA Liddelow. Development of the choroid plexus and blood-CSF barrier. Front Neurosci, 2015. [DOI | PubMed]
- J-Y Lim, SW Kim, B Kim, S-J Park. Knockdown of CARD14 inhibits cell proliferation and migration in breast cancer cells. Anticancer Res, 2020. [DOI | PubMed]
- T Lohoff, S Ghazanfar, A Missarova, N Koulena, N Pierson, JA Griffiths, ES Bardot, C-H Eng, RC Tyser, R Argelaguet. Integration of spatial and single-cell transcriptomic data elucidates mouse organogenesis. Nat Biotechnol, 2022. [DOI | PubMed]
- BB Madison, LB McKenna, D Dolson, DJ Epstein, KH Kaestner. FoxF1 and FoxL1 link hedgehog signaling and the control of epithelial proliferation in the developing stomach and intestine. J Biol Chem, 2009. [DOI | PubMed]
- M Malek Mohammadi, B Kattih, A Grund, N Froese, M Korf-Klingebiel, A Gigina, U Schrameck, C Rudat, Q Liang, A Kispert. The transcription factor GATA4 promotes myocardial regeneration in neonatal mice. EMBO Mol Med, 2017. [DOI | PubMed]
- A Miquelajáuregui, T Sandoval-Schaefer, M Martínez-Armenta, L Pérez-Martínez, A Cárabez, Y Zhao, M Heide, G Alvarez-Bolado, A Varela-Echavarría. LIM homeobox protein 5 (Lhx5) is essential for mamillary body development. Front Neuroanat, 2015. [DOI | PubMed]
- A Miquelajáuregui, A Varela-Echavarría, ML Ceci, F García-Moreno, I Ricano, K Hoang, D Frade-Pérez, C Portera-Cailliau, E Tamariz, JA De Carlos. LIM-homeobox gene Lhx5 is required for normal development of Cajal–Retzius cells. J Neurosci, 2010. [DOI | PubMed]
- S Modi, C Saura, T Yamashita, YH Park, S-B Kim, K Tamura, F Andre, H Iwata, Y Ito, J Tsurutani. Trastuzumab deruxtecan in previously treated HER2-positive breast cancer. N Engl J Med, 2020. [DOI | PubMed]
- MFD Oliveira, JP Romero, M Chung, SR Williams, AD Gottscho, A Gupta, SE Pilipauskas, S Mohabbat, N Raman, DJ Sukovich. High-definition spatial transcriptomic profiling of immune cell populations in colorectal cancer. Nat Genet, 2025. [DOI | PubMed]
- A Pascual-Ahuir, J Fita-Torró, M Proft. Capturing and understanding the dynamics and heterogeneity of gene expression in the living cell. Int J Mol Sci, 2020. [DOI | PubMed]
- A Pattyn, X Morin, H Cremer, C Goridis, J-F Brunet. The homeobox gene Phox2b is essential for the development of autonomic neural crest derivatives. Nature, 1999. [DOI | PubMed]
- Pillai A, Mansouri A, Behringer R, Westphal H, Goulding M (2007) Lhx1 and Lhx5 maintain the inhibitory-neurotransmitter status of interneurons in the dorsal spinal cord. Development 134:357–366
- C Qiao, Y Huang. Representation learning of RNA velocity reveals robust cell transitions. Proc Natl Acad Sci USA, 2021. [DOI | PubMed]
- S Qiu, Y Hu, Y Huang, T Gao, X Wang, D Wang, B Ren, X Shi, Y Chen, X Wang. Whole-brain spatial organization of hippocampal single-neuron projectomes. Science, 2024. [DOI | PubMed]
- V Raghavan, Y Zheng, Y Li, J Ding. Harnessing agent-based frameworks in CellAgentChat to unravel cell–cell interactions from single-cell and spatial transcriptomics. Genome Res, 2025. [DOI | PubMed]
- Rajebhosale P, Jone A, Johnson KR, Hofland R, Palarpalar C, Khan S, Role LW, Talmage DA (2024) Neuregulin1 nuclear signaling influences adult neurogenesis and regulates a schizophrenia susceptibility gene network within the mouse dentate gyrus. J Neurosci 44:e0063-24.2024
- B Ru, J Huang, Y Zhang, K Aldape, P Jiang. Estimation of cell lineages in tumors from spatial transcriptomics data. Nat Commun, 2023. [DOI | PubMed]
- E Sahai, I Astsaturov, E Cukierman, DG DeNardo, M Egeblad, RM Evans, D Fearon, FR Greten, SR Hingorani, T Hunter. A framework for advancing our understanding of cancer-associated fibroblasts. Nat Rev Cancer, 2020. [DOI | PubMed]
- Sahni V, Itoh Y, Shnider SJ, Macklis JD (2021) Crim1 and Kelch-like 14 exert complementary dual-directional developmental control over segmentally specific corticospinal axon projection targeting. Cell Rep 37
- G Samaan, D Yugo, S Rajagopalan, J Wall, R Donnell, D Goldowitz, R Gopalakrishnan, S Venkatachalam. Foxn3 is essential for craniofacial development in mice and a putative candidate involved in human congenital craniofacial defects. Biochem Biophys Res Commun, 2010. [DOI | PubMed]
- S Senova, A Fomenko, E Gondard, AM Lozano. Anatomy and function of the fornix in the context of its potential as a therapeutic target. J Neurol, Neurosurg Psychiatry, 2020. [DOI | PubMed]
- HH Simon, C Scholz, DD O’Leary. Engrailed genes control developmental fate of serotonergic and noradrenergic neurons in mid-and hindbrain in a gene dose-dependent manner. Mol Cell Neurosci, 2005. [DOI | PubMed]
- A Singh, A Mahesh, F Noack, B Cardoso de Toledo, F Calegari, VK Tiwari. Tcf12 and NeuroD1 cooperatively drive neuronal migration during cortical development. Development, 2022. [DOI | PubMed]
- K Song, Y Zheng, B Zhao, DH Eidelman, J Tang, J Ding. DOLPHIN advances single-cell transcriptomics beyond gene level by leveraging exon and junction reads. Nat Commun, 2025. [DOI | PubMed]
- PL Ståhl, F Salmén, S Vickovic, A Lundmark, JF Navarro, J Magnusson, S Giacomello, M Asp, JO Westholm, M Huss. Visualization and analysis of gene expression in tissue sections by spatial transcriptomics. Science, 2016. [DOI | PubMed]
- B Surmacz, P Noisa, JR Risner-Janiczek, K Hui, M Ungless, W Cui, M Li. DLK1 promotes neurogenesis of human and mouse pluripotent stem cell-derived neural progenitors via modulating Notch and BMP signalling. Stem Cell Rev Rep, 2012. [DOI | PubMed]
- SM Swain, M Shastry, E Hamilton. Targeting HER2-positive breast cancer: advances and future directions. Nat Rev Drug Discov, 2023. [DOI | PubMed]
- D Szklarczyk, R Kirsch, M Koutrouli, K Nastou, F Mehryary, R Hachilif, AL Gable, T Fang, NT Doncheva, S Pyysalo. The STRING database in 2023: protein–protein association networks and functional enrichment analyses for any sequenced genome of interest. Nucleic Acids Res, 2023. [DOI | PubMed]
- MD Tallquist. Developmental pathways of cardiac fibroblasts. Cold Spring Harb Perspect Biol, 2020. [DOI | PubMed]
- XT Tang, LV Chen, BO Zhou. Resolving the spatial organization of fetal liver hematopoiesis by SeekSpace. Cell Regen, 2025. [DOI | PubMed]
- S Tritschler, M Büttner, DS Fischer, M Lange, V Bergen, H Lickert, FJ Theis. Concepts and limitations for learning developmental trajectories from single cell genomics. Development, 2019. [DOI | PubMed]
- MR Vahid, EL Brown, CB Steen, W Zhang, HS Jeon, M Kang, AJ Gentles, AM Newman. High-resolution alignment of single-cell and spatial transcriptomes with CytoSPACE. Nat Biotechnol, 2023. [DOI | PubMed]
- SR Venugopalan, MA Amen, J Wang, L Wong, AC Cavender, RN D’Souza, M Akerlund, SL Brody, TA Hjalt, BA Amendt. Novel expression and transcriptional regulation of FoxJ1 during oro-facial morphogenesis. Hum Mol Genet, 2008. [DOI | PubMed]
- T Westerling, E Kuuluvainen, TP Maäkelaä. Cdk8 is essential for preimplantation mouse development. Mol Cell Biol, 2007. [DOI | PubMed]
- CG Williams, HJ Lee, T Asatsuma, R Vento-Tormo, A Haque. An introduction to spatial transcriptomics for biomedical research. Genome Med, 2022. [DOI | PubMed]
- H Xu, Y Dzhashiashvili, A Shah, RB Kunjamma, Y-l Weng, B Elbaz, Q Fei, JS Jones, YI Li, X Zhuang. m6A mRNA methylation is essential for oligodendrocyte maturation and CNS myelination. Neuron, 2020. [DOI | PubMed]
- S Yan, Y Peng, J Lu, S Shakil, Y Shi, DK Crossman, JrWH Johnson, S Liu, DG Rokosh, J Lincoln. Differential requirement for DICER1 activity during the development of mitral and tricuspid valves. J Cell Sci, 2022. [DOI | PubMed]
- D Yu, M-C Hung. Overexpression of ErbB2 in cancer and ErbB2-targeting strategies. Oncogene, 2000. [DOI | PubMed]
- B Zhao, T-Y Su, J Wang, QS Islam, K Song, SK Huang, M Allez, GJ Fonseca, CJ Baglole, J Ding. DENetwork unveils non-differentially expressed genes with functional relevance across conditions through information flow perturbation. Nucleic Acids Res, 2025. [DOI | PubMed]
- S-H Zhao, X-Y Ji, G-Z Yuan, T Cheng, H-Y Liang, S-Q Liu, F-Y Yang, Y Tang, S Shi. A bibliometric analysis of the spatial transcriptomics literature from 2006 to 2023. Cell Mol Neurobiol, 2024. [DOI | PubMed]
- Y Zhao, HZ Sheng, R Amini, A Grinberg, E Lee, S Huang, M Taira, H Westphal. Control of hippocampal morphogenesis and neuronal differentiation by the LIM homeobox gene Lhx5. Science, 1999. [DOI | PubMed]
- SC Zheng, G Stein-O’Brien, L Boukas, LA Goff, KD Hansen. Pumping the brakes on RNA velocity by understanding and interpreting RNA velocity estimates. Genome Biol, 2023. [DOI | PubMed]
- Zheng Y, Schupp JC, Adams T, Clair G, Justet A, Ahangari F, Yan X, Hansen P, Carlon M, Cortesi E (2025) A deep generative model for deciphering cellular dynamics and in silico drug discovery in complex diseases. Nat Biomed Eng: 9:1–26