
Impact of Cannabis and Cannabis Legalization on US Atrial Septal Defect Rates
Abstract
Atrial septal defect (ASD) affects 1:11.3 children in some US states; however, the antecedents of these trends are yet to be identified. A total of 1882 ASD rates (ASDRs) for 2003–2020 were sourced from the National Birth Defects Prevention Network reports. A total of 406,893 ASDs are reported. Substance (cigarettes, binge alcohol, cannabis, cannabinoids, analgesics, cocaine) exposure data were taken from the National Survey of Drug Use and Health. Income and ethnicity data were derived from the US Census. Adjustment was performed by mixed effects, survey and generalized additive regression. Causal analysis was by inverse probability weighting and E-values. Data were analyzed in RStudio. The highest ASDR of 884/10,000 live births was amongst Non-Hispanic Asians and Pacific Islanders in Nevada in 2016–2020. The 2005–2018 median ASDR rose >12-fold in Nevada and New Mexico, >6-fold in New York, and 4.2-fold nationally 1989–2020; it doubled in NY from 2012–2016 to 2016–2020. The average state ASDR rose supra-exponentially (p = 0.0075) and was associated with higher cannabis use states (p = Zero, Cohen’s D = 1.24), apparently driven by cannabis legalization (p = Zero). Estimated exposures to Δ9THC, cannabidiol and cannabigerol were implicated (from p = 2.67 × 10–68). Cannabis-legal states were compared with others (mean ASDR (C.I.) 178.15 (131.68, 224.62) vs. 74.28 (70.60, 77.96), p = Zero; O.R. 1.82 (1.81, 1.84), E-values 3.04 (lower C.I. 3.02), Cohen’s D 1.29 (0.96, 1.62)). Overall, 29/39 (74.4%) E-value estimates were >4; 39/39 (100%) were >1.25. Cannabis, cannabinoids and cannabis legalization are strong candidates for driving the US ASDR supra-exponentially. Estimates of many cannabinoids, including cannabidiol, Δ9THC, and cannabigerol, are implicated. The results are consistent with other large epidemiological studies. The importance of the results is magnified by the increasing legalization and penetration of cannabinoids into the US population. Since therapeutic abortion is not practiced for ASD, it may be used as a bellwether index of heritable transgenerational cannabinoid genotoxicity and epigenotoxicity associated with cannabinoid exposure.
Article type: Research Article
Keywords: cannabis, cannabinoid, congenital anomalies, cardiogenesis, genotoxicity, epigenotoxicity, transgenerational inheritance, teratogenesis, multigenerational
Affiliations: Division of Psychiatry, University of Western Australia, 35 Stirling Hwy., Crawley, WA 6009, Australia; gary.hulse@uwa.edu.au; School of Medical and Health Sciences, Edith Cowan University, 27 Joondalup Dr., Joondalup, WA 6027, Australia
License: © 2026 by the authors. CC BY 4.0 Licensee MDPI, Basel, Switzerland. This article is an open access article distributed under the terms and conditions of the Creative Commons Attribution (CC BY) license.
Article links: DOI: 10.3390/jox16020043 | PubMed: 41874114 | PMC: PMC13010746
Relevance: Relevant: mentioned in keywords or abstract
Full text: PDF (1.3 MB)
1. Introduction
Whilst much recent attention has focused on the severe negative impacts of cannabinoids on brain development [ref. 1,ref. 2,ref. 3,ref. 4,ref. 5,ref. 6], the cardiovascular impacts of cannabis are also well described, albeit less widely recognized [ref. 2,ref. 7,ref. 8,ref. 9,ref. 10,ref. 11].
Recent reports of atrial septal defect (ASD) secundum rates (ASDRs) show peak prevalence at 884/10,000 live births amongst Non-Hispanic Asians and Pacific Islanders (NHAsPI) 2016–2020 in Nevada [ref. 12]. Surprisingly, this daunting modern trend has not been explored by contemporary researchers, perhaps in part because the official ASDR figure quoted by CDC is 10.3/10,000 based upon data from Atlanta, Georgia, 1998–2005, which is one of the lowest incidence states [ref. 13,ref. 14].
ASD is an important disorder for several reasons. Atrial septal defect is the commonest of congenital cardiac anomalies, which are, in turn, the commonest of congenital anomalies. Early therapeutic termination of pregnancy for anomaly (ETOPFA) is not practiced for ASD as it is for more major congenital anomalies, making its prevalence data more reliable than for more serious defects, where reports of accurate ETOPFA rates are sparse. Several studies have now demonstrated a causal link between cannabis and ASD (C-ASD) [ref. 10,ref. 15,ref. 16,ref. 17,ref. 18,ref. 19,ref. 20] so that ASD is a useful biomarker not only of cannabis teratogenicity but also of cannabinoid genotoxicity more broadly. Several cannabinoids are known to have an exponential genotoxic dose–response curve [ref. 1,ref. 2,ref. 3,ref. 4]. Further, since ASD is a congenital anomaly, it represents intergenerational transmission of cannabinoid genotoxicity potentially via epigenetic inheritance [ref. 10,ref. 20,ref. 21,ref. 22,ref. 23,ref. 24].
ASD was first reported to be linked with cannabis exposure by Hawaiian epidemiologists who noted a rate ratio of 6.12 (95%C.I. 1.98, 14.35) [ref. 16]. This result is associated with an E-value estimate of 11.72, which is even stronger than the effect of tobacco on lung cancer (E-value of 9), with a 95% lower bound of 3.37, indicating both that causality is highly likely and that spurious explanation of the link by extraneous confounding is unlikely [ref. 25,ref. 26]. More recent investigations of USA data showed a close relationship across space and time between ASDRs and cannabis exposure and that the relationship fulfilled mechanistic and mathematical criteria for causality [ref. 5,ref. 15,ref. 20]. Previous laboratory and population-based studies demonstrated exponential dose–response relationships between cannabis exposure and ASDRs and many congenital anomalies [ref. 20]. Collectively, the association of cannabis with ASDRs has been confirmed by large population-based studies from Hawaii, Canada, Australia, Colorado, USA and Europe [ref. 10,ref. 15,ref. 16,ref. 17,ref. 18,ref. 19,ref. 20].
The pre-specified purposes tested by this study were: (1) to describe and dissect recent trends in atrial septal defects; (2) to explain their associations and causes; (3) to examine the impact of cannabinoids on ASDRs; and (4) to examine the effect of cannabis legalization on ASDRs.
2. Methods
2.1. Data
2.1.1. Congenital Anomalies
The complete dataset relating to atrial septal defect (secundum type) was downloaded from the Annual reports of the National Births Defects Prevention Network (NBDPN) [ref. 6], which is affiliated with the Centers for Disease Control, Atlanta, Georgia, USA. These data related to the rates by all ethnicities for all the years listed. Ethnicities studied were as listed in the NBDPN dataset, which were Non-Hispanic White (NHWhite), Non-Hispanic African American (NHBlack), Hispanic, Non-Hispanic Asian–Pacific Islanders (NHAsPI), Non-Hispanic American Indian/Alaskan Native (NHAIAN) and Total (Overall). The first available data was for the 1989–1990 biennium. Most of the data periods were over five years. The most recent was that for 2016–2020. In such cases, the central year (here, 2018) was taken as the “Indicative Year” and used for data analysis and display purposes in graphs. For periods such as biennia 1989–1990, the second year was used as the Indicative Year. Data for atrial septal defect rates appeared in 12 Annual Reports across this period. Ten of these datasets overlapped with the drug datasets (2005–2018), which were accordingly used in regression analyses. All available data were used. Missing data were casewise deleted.
2.1.2. Drugs
Drug use data by state for the period 2005–2018 were taken from the Restricted Use Dataset (RUD) of the National Survey of Drug Use and Health (NSDUH), conducted annually by the Substance Abuse and Mental Health Services Administration (SAMHSA) [ref. 7]. Indices of interest included the last month use of cigarettes (cigmon), the last month use of alcohol (alcmon), binge drinking in the last month (bngalc or bngdrkmon), alcohol use disorder in the past year (audyr, depndalc), the last month use of cannabis (mrjmon), the last year use of opioid analgesics (anlyr, pnrnmyr) and the last year use of cocaine (cocyr). The quanta for the covariate pairs of bngalc and bingdrkmon and for anlyr and pnrnmyr were not directly comparable due to changes in the survey questions applied in different iterations of the NSDUH. Small arithmetical corrections were applied to the second data series to induce direct comparability such that the last value of the mean of the two datasets nationally was comparable to the first mean value of the following dataset. NSDUH data collection was impacted by the COVID-19 pandemic and was reflected in part in these nomenclature differences.
2.1.3. Others
Data on population ethnicity and median income were downloaded from the US Census Bureau using the censusapi package in R Studio [ref. 8]. Data on the cannabinoid concentration of cannabis samples were derived from published reports of analysis of cannabis seizures by the Drug Enforcement Agency (DEA) [ref. 9,ref. 10,ref. 11,ref. 12,ref. 13]. Data relating to the percentage rate of high potency seizures (exceeding 12% Δ9THC (tetrahydrocannabinol) content) were also taken from recently published reports [ref. 10]. Data relating to the legal status of cannabis were taken from online resources [ref. 14,ref. 15,ref. 16]. The number of births in each state was taken from the CDC WONDER database [ref. 17].
2.1.4. Derived Variables
Percentage rates of ethnic drug use taken from the NSDUH were standardized against the national population overall for that year as a simple ratio. These national ratios were then multiplied by the state ratios of percent ethnicity to define an average index of ethnic drug exposure for that state. States were divided into high- and low-cannabis-exposure states by designating states in the top (numerical) tertile of cannabis use in the most recent drug sampling year (2018) as high-cannabis-exposure states. This incorporated the states of Alaska, Colorado, Maine, Massachusetts, Michigan, Nevada, New Hampshire, New Mexico, Oregon, Rhode Island and Vermont. The Δ9THC content was multiplied by the monthly cannabis use rate to derive a compound variable (d9THC_mrjmon). This parameter was then multiplied by the frequency of high-THC-potency seizures (>12%) to derive a further compound variable (d9THC_HiPot_mrjmon).
2.2. Data Analysis
Data analysis was conducted in R version 4.4.3 from the Central R Archive Network (CRAN) and performed in R Studio (2024.12.1 Build 563). Data were manipulated using dplyr from tidyverse (version 2.0.0) [ref. 18], and graphs were drawn in ggplot2, also from tidyverse, aided by ggpubr (version 0.6.0) [ref. 19], ggbreaks (version 0.1.4) [ref. 20], ggrepel (version 0.9.6) [ref. 21], patchwork (version 1.3.0) [ref. 22], grid (version 4.5.1 from R Base) and gridExtra (version2.3) [ref. 23]. Table 1 was compiled using the tableone package (version 0.13.2) [ref. 24]. Covariates such as ASD rate, last month cannabis use (mrjmon), annual analgesic abuse, annual cocaine abuse and median income were log-transformed in the interests of normality assumptions.
Table 1: Social, demographic and substance exposure baseline data.
| Covariate | High | Low | ∆SMD | p-Value |
|---|---|---|---|---|
| Sample Size (N) | 426 | 1456 | ||
| ASD Rate (median [IQR]) | 88.60 [27.58, 141.95] | 44.11 [24.72, 85.50] | 0.4042 | <0.001 |
| Log (ASD Rate) (median [IQR]) | 4.48 [3.32, 4.96] | 3.79 [3.21, 4.45] | 0.4456 | <0.001 |
| Numbers Atrial Septal Defect (total) | 72,513 | 334,380 | 0.5567 | <0.001 |
| Births (total) | 7,010,509 | 58,607,743 | 0.2286 | <0.001 |
| Cigarettes, Monthly (median [IQR]) | 0.24 [0.22, 0.26] | 0.25 [0.23, 0.29] | 0.4679 | <0.001 |
| Alcohol, Monthly (median [IQR]) | 0.63 [0.59, 0.66] | 0.54 [0.48, 0.59] | 1.4531 | <0.001 |
| Alcoholism (median [IQR]) | 0.08 [0.07, 0.09] | 0.07 [0.06, 0.08] | 0.9286 | <0.001 |
| Binge Alcohol (median [IQR]) | 0.27 [0.25, 0.28] | 0.24 [0.22, 0.26] | 0.8030 | <0.001 |
| Cannabis, Monthly (median [IQR]) | 0.11 [0.08, 0.13] | 0.06 [0.05, 0.07] | 2.0446 | <0.001 |
| Analgesics, Annual (median [IQR]) | 0.05 [0.04, 0.05] | 0.04 [0.04, 0.05] | 0.4807 | <0.001 |
| Cocaine, Annual (median [IQR]) | 0.02 [0.02, 0.03] | 0.02 [0.01, 0.02] | 1.0907 | <0.001 |
| ∆9THC Content (median [IQR]) | 13.40 [9.58, 14.60] | 12.30 [8.76, 14.10] | 0.1858 | 0.001 |
| Cannabidiol (median [IQR]) | 0.28 [0.17, 0.46] | 0.28 [0.20, 0.46] | 0.1923 | 0.423 |
| Cannabigerol (median [IQR]) | 0.43 [0.40, 0.47] | 0.43 [0.40, 0.46] | 0.1657 | 0.002 |
| Cannabinol (median [IQR]) | 0.56 [0.38, 0.65] | 0.45 [0.37, 0.63] | 0.1980 | <0.001 |
| Cannabichromene (median [IQR]) | 0.25 [0.24, 0.27] | 0.24 [0.24, 0.26] | 0.1179 | 0.196 |
| Tetrahydrocannabivarin (median [IQR]) | 0.09 [0.09, 0.10] | 0.09 [0.09, 0.10] | 0.1514 | 0.041 |
| ∆9THC * Cannabis, Monthly (median [IQR]) | 1.30 [0.87, 1.81] | 0.65 [0.49, 0.90] | 1.3607 | <0.001 |
| Median Income (median [IQR]) | 55,928.00 [51,258.50, 60,934.00] | 49,047.00 [43,307.00, 56,134.00] | 0.7464 | <0.001 |
| Ethnic Cigarette Exposure (median [IQR]) | 0.23 [0.18, 0.27] | 0.24 [0.17, 0.29] | 0.1087 | 0.025 |
| Ethnic Analgesic Exposure (median [IQR]) | 0.08 [0.07, 0.09] | 0.07 [0.05, 0.08] | 0.3168 | <0.001 |
| Ethnic Binge Alcohol (median [IQR]) | 0.25 [0.22, 0.27] | 0.22 [0.18, 0.25] | 0.2997 | <0.001 |
| Ethnic Cannabis Exposure (median [IQR]) | 0.10 [0.07, 0.13] | 0.06 [0.04, 0.07] | 1.1870 | <0.001 |
| Ethnic Analgesic Exposure (median [IQR]) | 0.04 [0.03, 0.05] | 0.04 [0.03, 0.05] | 0.2767 | <0.001 |
| Ethnic Cocaine Exposure (median [IQR]) | 0.02 [0.02, 0.03] | 0.02 [0.01, 0.02] | 0.6115 | <0.001 |
| Legal Status of Cannabis (%) | 4.48 [3.32, 4.96] | 3.79 [3.21, 4.45] | 0.4456 | <0.001 |
| Medical | 269 (63.1) | 177 (12.2) | <0.001 | |
| Legal | 64 (15.0) | 5 (0.3) | ||
| Illegal | 63 (14.8) | 1106 (76.0) | ||
| Decriminalized | 30 (7.0) | 168 (11.5) | ||
| Number Illegal (%) | 63 (14.8) | 1106 (76.0) | 1.5573 | <0.001 |
| Number Legal (%) | 64 (15.0) | 5 (0.3) | 0.5734 | <0.001 |
Table Key: IQR—Interquartile Range; SMD—Standardized Mean Difference; *—Interaction.
Regression models were fitted as appropriate using lme4 (version 1.1-37) [ref. 25] and lmerTest (version 3.1-3) [ref. 26], survey (version 4.4-2) [ref. 27,ref. 28], and the general additive model (gam) function from mgcv (version 1.9-3) [ref. 29,ref. 30,ref. 31], incorporating the negative binomial distribution function (negbin) from MASS (version 7.3-65) [ref. 32]. In models including ethnicity, the comparator population was NHAsPI unless otherwise noted. In mixed effects models, state was assigned as the random effect. Since data were sampled from similar populations over time, it was also appropriate to use survey glm (svyglm, generalized linear models) regression. In survey glm models, the design included state as a stratum. In view of the fact that ASD is notionally a rare event with rates related to underlying count data, the negative binomial distribution was chosen for the generalized additive models (mgcv::gam) with theta set to unity. The offset chosen was the number of births in each state. Parametric terms were smoothed. A smoothed term including time and state was also included in all gam models. Interaction terms in gam models were tensor product (te) or tensor product interactions (ti), which include lower-order effects, as indicated. Models became progressively more complex within each group, including the inclusion of more covariates, more cannabinoids and more interactive terms.
Models were compared by reviewing their Akaike Information Criterion (AIC) and directly via anova tests, as appropriate. The Bayesian Information Criterion (BIC) and Log Likelihood ratio (logLik) were also calculated. For each regression type, final models were obtained from initial full models by the classical method of the serial removal of the least significant term.
Multicollinearity among covariates was assessed using variance inflation factors (VIFs) using the R packages car (version 3.1-3) and performance (version 0.14.0) [ref. 33,ref. 34]. For models including multilevel categorical variables, generalized variance inflation factors (GVIFs) were calculated and adjusted using the standard transformation GVIF(1/(2×df)) to allow comparison with conventional VIF thresholds. Race was included as a social covariate reflecting structural and contextual factors rather than biological differences. Collinearity diagnostics were evaluated for the fixed-effects portion of mixed models, consistent with standard practice for mixed-effects regression.
Effect size was calculated using Cohen’s D derived from the R packages effectsize and emmeans (1.11.1) [ref. 35,ref. 36]. All t-tests were two-sided. p < 0.05 was considered significant.
2.3. Causal Inference
All mixed-effects, survey glm and gam models were inverse probability weighted using the ipwt function from the ipw package (version 1.2.1) [ref. 37]. E-values were calculated using the EValue package (version 4.1.3) [ref. 38,ref. 39,ref. 40] from regression models and bivariate comparisons to explore the magnitude of potentially causal relationships, taking 1.25 as the cut-off for causal association of the E-value estimate [ref. 38] and values of above 9 to be very elevated [ref. 39].
2.4. Ethics Approval
Ethical approval for this study was provided by the Human Research Ethics Committee of the University of Western Australia, number RA/4/20/4724, on 24 September 2021.
2.5. Generative Artificial Intelligence
Generative artificial intelligence was not used in the generation of this paper.
2.6. Data Availability
The data and computational code are openly available via Mendeley at doi: https://doi.org/10.17632/ny2j3msk86.2.
3. Results
3.1. ASD Rates
A total of 2251 ASDRs were obtained for the 1989–2020 period, of which 1882 fell in the period 2005–2018 when both congenital anomaly and drug use data were available. Table 1 shows the social and demographic data for the 2005–2018 dataset stratified into high- and low-cannabis-using states as described in the Methods. A total of 406,893 ASD cases were reported amongst 65,618,252 births (counting Hispanics) across 46 states. Many significant differences are shown. Interestingly, the legal status across the two sets of states is highly significantly different (ChiSqu.Trend = 1503.6, p = 7.33 × 10−321).
Figure 1 shows the trend over time of the 276 state–race combinations, together with the average. A general upward trend is noted. Table S1 shows the 12 time periods, including their Indicative Years for which NBDPN ASDR data are available from 1989 to 2020, together with the mean rates across all state and ethnicity combinations for each year. A 4.23-fold rise from 27.4/10,000 live births to 116.0 across this period is observed.
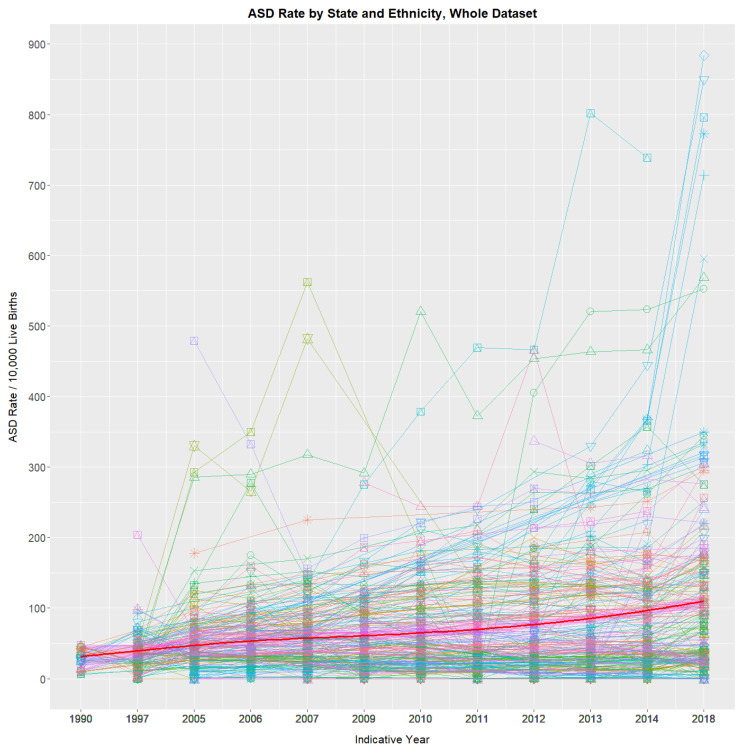
A straight line appearing on a log plot depicts an exponential rate of growth. Concerningly, when state rates are charted in this way, rates in states such as Nevada and New Mexico curve concave upwards on a log plot, which is indicative of supra-exponential increases (Figure S1).
ASDRs by ethnicity for each state are shown paneled in Figures S2 and S3. Figures S4–S16 illustrate detailed presentations of high ASD states, including Nevada, New York, Department of Defense, Kentucky, Michigan, Colorado, Tennessee, Alaska, Mississippi, Missouri, New Mexico and Oregon. The 2005–2018 ASDR has risen a median of 12.21-fold in Nevada (Figure S4; p = 7.95 × 10⁻⁶; overall ethnicity 67.82 to 772.8), 6.05-fold in New York (Figure S5; p = 4.9 × 10⁻⁴), 2.32-fold in the Department of Defense (Figure S7; p = 5.21 × 10⁻⁶), 3.8-fold in Colorado (Figure S10; p = 2.25 × 10⁻⁴), 12.48-fold in New Mexico (Figure S15, from 25.35 to 316.5, p = 5.39 × 10⁻⁶) and 1.99-fold in New York for just 2014–2018 (Figure S6; p = 1.9 × 10⁻⁴). The highest rate reported was 884 amongst Non-Hispanic Asians/Pacific Islanders in Nevada in 2016–2020.
Figures S17–S25 show ASDRs in various low-ASD states, including Florida, Utah, Texas, Georgia, Maryland, Minnesota, Iowa, South Carolina and New Jersey, which had rates in the most recent reporting period of 114.9, 32.2, 89.9, 25.8, 12.1, 27.8, 23.6, 9.2, and 39.0.
3.2. Bifurcation of ASD Rates
Figure 2A,C show the mean annual state ASDR on linear and logarithmic plots, respectively, together with regression lines fitted to their first four years. A clear departure is shown in each case from the linear trend, which, in the second case, is therefore supra-exponential. When models linear and quadratic in time are fitted to log ASDRs, the quadratic model demonstrates superior fit, confirming the visual appearance (AIC linear −21.14, AIC quadratic −30.04; Anova F = 13.82, p = 0.0075).
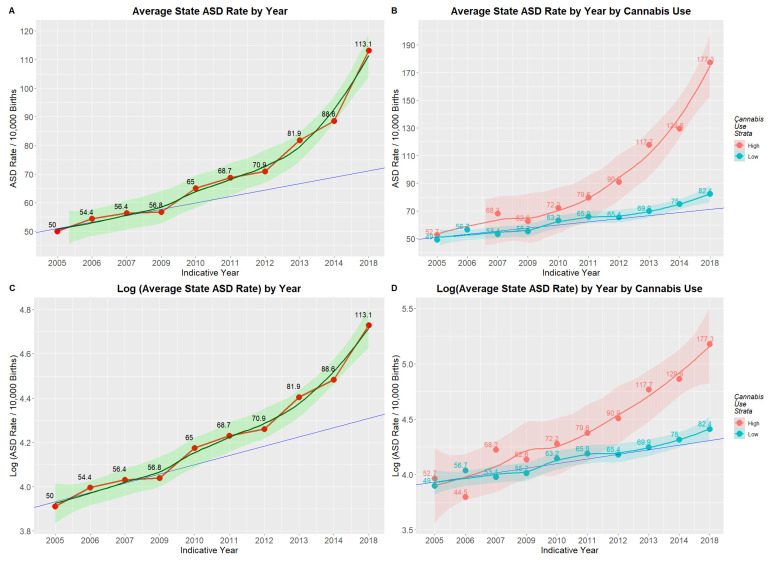
Figure 2B,D show that this departure from linearity is wholly attributable to rates in the high-cannabis-use states. A gam model shows that the divergence between high- and low-cannabis-using states has not arisen by chance (edf = 0.984, F = 62.77, p = Zero; model: AdjRSqu. = 0.323, GCV = 1.1531, n = 1882). In a mixed-effects model, Cohen’s D for this effect is 1.24 (C.I. 0.21, 2.27).
3.3. Substance Use
Figures S26–S29 illustrate US substance use. Most substance use has declined or is stationary, the sole exception being cannabis, which has risen 1.91-fold from 5.81% to 11.08%. National reports list the rate of high THC cannabis seizures and their THC concentration. When these are multiplied by monthly cannabis use, an index can be derived, which has risen 6.6-fold (1567.8 to 10,320.5; Table S2). Exposure to many cannabinoids has risen (Figure S30).
3.4. ASDR over Time vs. ASDR by Cannabis Exposure
Figure S31A–D show that the slope of the ASD by time line and the slope of the ASD by cannabis exposure line are very closely related (β-est. = 0.435, t = 15.24, p = 5.06 × 10⁻¹⁸; model Adj.R.Squ. = 0.853). They also show that in 2012–2018, more states at the high end of the regression zone moved to medical or legal cannabis.
3.5. Multivariate Modeling
3.5.1. Mixed-Effects Models
In multivariate mixed-effects modeling of cannabis use, Δ9THC and cannabigerol concentration were shown to be closely related to ASDRs (first five models; Table S3). When all the substances and incomes were considered, cannabis was the most significant term. Ethnicity was also significant, but its relative significance declined when ethnic drug exposure was considered. Cannabis interacted significantly with several ethnicities. In the final interactive model, cannabis was the most significant term. Increasingly complex mixed-effects regression models are shown in Table 2. Cannabis use is significant in all models. The final interactive model uses ethnic substance exposure and is not weighted to allow effect size calculation. Partial effect sizes are presented in Table S4 and Figure S32. Only terms involving ethnic cannabis use are found to significantly contribute to model power. Table S5 summarizes these data by covariate grouping, and cannabis is shown to have much higher total partial variance than cigarettes and ethnicity (9.0% vs. 1.7% and 1.2%, respectively, with seven, three and one terms each).
Table 2: Final inverse probability weighted mixed effects models.
| Parameter | Model | |||
|---|---|---|---|---|
| Parameter | Estimate (C.I.) | p-Value | Metric | Value |
| Additive in Drugs | ||||
| ASD ~ Cigarettes + Cannabis + Bnge.Alcohol + Analgesics + Cocaine | ||||
| Cigarettes | 4.04 (2.25, 5.83) | <0.001 | AIC | 3305 |
| LM.Cannabis | 0.70 (0.52, 0.88) | <0.001 | BIC | 3344 |
| Analgesics | −0.61 (−0.87, −0.35) | <0.001 | LogLik | −1646 |
| Cocaine | −0.13 (−0.25, −0.01) | 0.038 | S.D. | 3.850 |
| Additive in Drugs and Income | ||||
| ASD ~ Cigarettes + Cannabis + Bnge.Alcohol + Analgesics + Cocaine + Med.Income | ||||
| Cigarettes | 4.86 (2.99, 6.73) | <0.001 | AIC | 3294 |
| LM.Cannabis | 0.59 (0.39, 0.79) | <0.001 | BIC | 3338 |
| Bng.Alcohol | −2.75 (−5.10, −0.40) | 0.023 | LogLik | −1639 |
| Analgesics | −0.53 (−0.79, −0.27) | <0.001 | S.D. | 3.840 |
| Median.Income | 0.75 (0.27, 1.23) | 0.002 | ||
| Additive in Drugs, Income and Race | ||||
| ASD ~ Cigarettes + Cannabis + Bnge.Alcohol+ Analgesics + Cocaine + Med.Income + Race | ||||
| Cigarettes | 4.96 (3.15, 6.77) | <0.001 | AIC | 3163 |
| LM.Cannabis | 0.63 (0.44, 0.82) | <0.001 | BIC | 3241 |
| Bng.Alcohol | −2.51 (−4.78, −0.24) | <0.001 | LogLik | −1568 |
| Analgesics | −0.48 (−0.73, −0.22) | <0.001 | S.D. | 3.670 |
| Cocaine | −0.13 (−0.25, −0.01) | 0.038 | ||
| Median.Income | 0.75 (0.29, 1.20) | 0.001 | ||
| Race.Hispanic | 0.21 (0.13, 0.29) | <0.001 | ||
| Race.NHAIAN | 0.42 (0.33, 0.51) | <0.001 | ||
| Race.NHBlack | 0.47 (0.39, 0.55) | <0.001 | ||
| Race.NHWhite | 0.15 (0.07, 0.23) | <0.001 | ||
| Race.Total | 0.24 (0.16, 0.32) | <0.001 | ||
| Interactive–Unweighted | ||||
| Interactive in Drugs + Income and Race: Cannabis Interaction | ||||
| ASD ~ eCigarettes * eCannabis + eBnge.Alcohol + eAnalgesics + eCocaine + Med.Income + Race + Race: Cannabis | ||||
| eCigarettes | 0.16 (0.07, 0.25) | <0.001 | AIC | 1805 |
| eCannabis | 0.48 (0.37, 0.59) | <0.001 | BIC | 1910 |
| eBng.Alcohol | −0.10 (−0.18, −0.02) | 0.0143 | LogLik | −884 |
| eCocaine | −0.11 (−0.15, −0.07) | <0.001 | S.D. | 0.361 |
| Median.Income | 0.08 (0.02, 0.14) | 0.0089 | ||
| Race.NHAIAN | −0.35 (−0.50, −0.19) | <0.001 | ||
| Race.NHAsPI | 0.55 (0.13, 0.97) | 0.010 | ||
| Race.NHBlack | −0.18 (−0.28, −0.07) | 0.001 | ||
| Race.NHWhite | −0.30 (−0.40, −0.20) | <0.001 | ||
| Race.Total | −0.23 (−0.31, −0.14) | 2.12 × 10⁻⁷ | ||
| eCigarettes: eCannabis | 0.12 (0.03, 0.21) | <0.001 | ||
| eCannabis: Race.NHAIAN | −0.21 (−0.37, −0.05) | 0.010 | ||
| eCannabis: Race.NHAsPI | 0.53 (0.18, 0.88) | 0.003 | ||
| eCannabis: Race.NHBlack | −0.23 (−0.33, −0.12) | <0.001 | ||
| eCannabis: Race.NHWhite | −0.25 (−0.37, −0.13) | <0.001 | ||
| eCannabis: Race.Total | −0.18 (−0.29, −0.07) | 0.001 | ||
Table Key: *—Interaction.
3.5.2. Survey Regression Models
Survey regression was conducted to account for the temporal overlap in the data. Cannabis and cannabinoids Δ9THC, cannabidiol and cannabigerol were significant in increasingly complex models (Table S6). Generalized additive models were performed to account for the curvilinear nature of the data. Again, cannabis and cannabinoids were found to be highly significant in all models (Table S7). Nine p-values listed as Zero in this table signify p < 10−321.
3.6. Legal Status
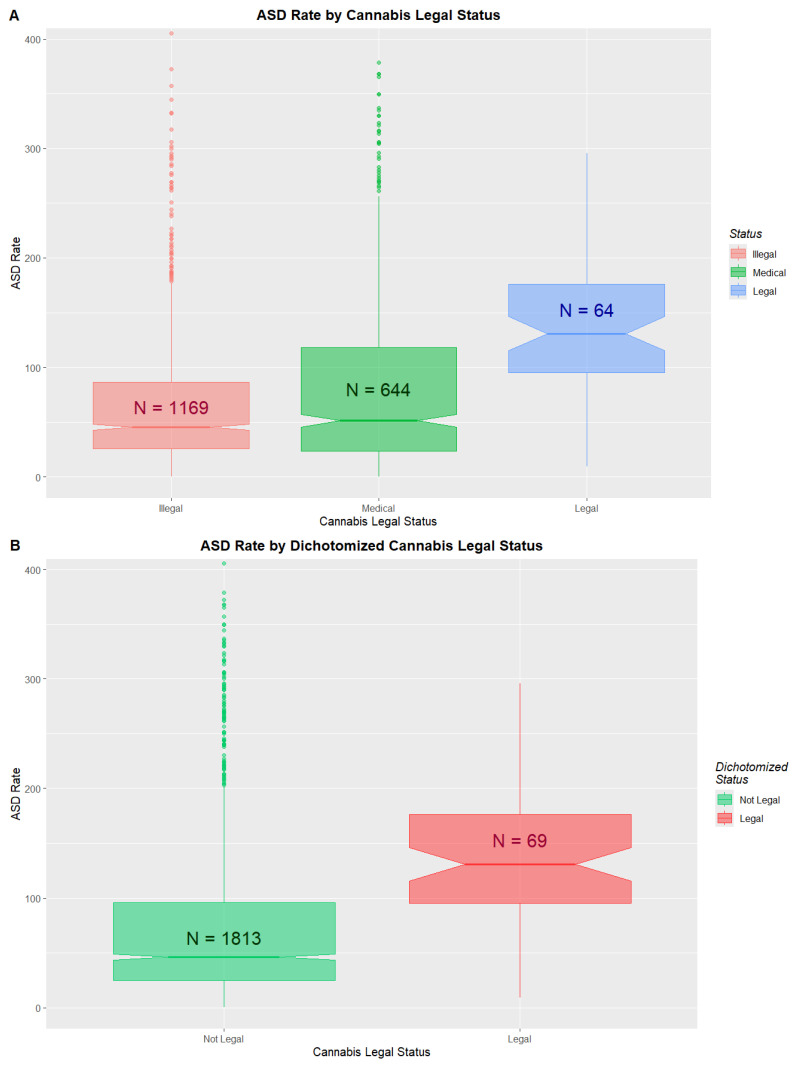
The changing legal status of cannabis across the USA is illustrated in Figure S33. ASDRs by legal status are shown in Figure 3 and Table S8. Medical and decriminalized have been combined here due to the small numbers in the decriminalized group. A clear trend to increased ASDRs with liberal cannabis paradigms is shown (ChiSqu.Trend = 2724, p = 0.0023; Figure 3A). When the data are dichotomized into ASDRs in legal states v others (mean (C.I.) 178.15 (131.68, 224.62) vs. 74.28 (70.60, 77.96)), significant differences are found (ChiSqu. = 22,194, p = Zero; O.R. 1.82 (1.81, 1.84)), Attributable Fraction in the Exposed 44.92% (44.48%, 45.35%), E-values 3.04 (lower C.I. 3.02) and number needed to harm 1 in 48 (48, 49) (Figure 3B).
3.7. Effect Sizes
Cohen’s D for the bivariate pairwise comparisons by legal status are shown in Table S9. Many are very high (legal–illegal 1.29 (0.96, 1.62), legal–decriminalized 1.10 (0.54, 1.66); interpretive note: Cohen’s D values > 0.8 are said to be large; those > 1.2 are said to be very large).
3.8. Within- and Between-States Mixed-Effects Modeling
A hybrid mixed-effects model was constructed, which includes terms for within-state and between-state cannabis variation separately using state–ethnicity as the random effect. Table S10 presents bivariate, additive and interactive hybrid models along with cannabis legal status. Progressively increasing model complexity and the contribution of cannabis variance rapidly negates the effects of cannabis legal status and increases the marginal variance attributable to measured covariates from 2.8% to 5.6% to 6.8%. Within-state variance was about twice as powerful a predictor as between-state variance. The final model explained 71.9% of the variance, mostly due to state–ethnicity contextual structure.
Cohens D’s from the pairwise comparisons in these hybrid models are presented (Table S11).
Cohen’s D similarly collapses with the inclusion of increasing cannabis variance: for the legal–illegal comparison, this falls from 1.29 to 0.43 to 0.06 (N.S).
3.9. Sensitivity Analysis
Many E-values can be calculated from these results (Table S12). E-value estimates and lower bounds were (median (IQR) 5.00 (4.00, 43.00)) and (4.00 (3.00, 10.00). Overall, 14/39 (35.9%), 29/39 (74.4%) and 39/39 (100%) of the E-value estimates are in the high (>9), moderate (>4) and causal (>1.25) ranges, respectively (Table S12). For the 95% E-value lower bounds, 11/39 (28.2%), 20/39 (51.3%) and 39/39 (100%) fall in these same ranges.
3.10. Variance Inflation Factors
Variance inflation factors may be assessed to assess potential covariate collinearity. Across all mixed-effects model specifications, there was no evidence of problematic multicollinearity (Table S13 refers to the mixed-effects models shown in Table 2). Collinearity diagnostics based on variance inflation factors (VIFs) and adjusted generalized VIFs (GVIFs) indicated consistently low to moderate correlations among fixed-effect predictors. In the primary mixed models (Models 1–3 in Table 2; VIFs shown in Table S13), all adjusted VIF values were below 2, with tolerance values well above commonly accepted thresholds, indicating low collinearity. In the interaction model (Model 4 in Table 2), which included higher-order terms and multilevel categorical variables, predictor-level adjusted GVIFs (GVIF(1/(2×df))) remained below 3 for all predictors, including race and substance use variables. Elevated raw GVIF values observed for some terms reflected model complexity and interaction structure rather than substantive multicollinearity. Although race participated in interaction terms, adjusted GVIF values for race were low across all models, indicating that race was not excessively collinear with socioeconomic or substance use predictors. Overall, collinearity diagnostics supported stable estimation of fixed effects across all model specifications.
4. Discussion
4.1. Main Results
The main findings were that the mean state ASDR has increased >four-fold from 27.4 to 116.0 in the 1989–2020 period, often increasing from rare to common in many states. The peak rate was NHAsPI in Nevada at 884.0/10,000. The state averages show a supra-exponential distribution, which is wholly attributable to high-cannabis-use states, which are increasingly dominated by liberal cannabinoid legal paradigms. The ASDRs in Nevada and New Mexico have each increased >12-fold, and in New York, the ASDR increased >6-fold. Substance exposure across the USA was generally stationary or declining, except for cannabis, which rose 1.9-fold. One ΔTHC exposure index rose 6.6-fold in 2009–2018. In a fully adjusted mixed model, cannabis was a much more powerful predictor than either tobacco or ethnicity. Cannabis was significant when considered as both a within- and between-states covariate. The results were cross-validated by inverse probability weighted mixed-effects, survey and generalized additive regression. The ASDR in states where cannabis was legal was much higher than elsewhere (O.R. 1.82 (1.81, 1.84); Cohen’s D 1.29 (0.96, 1.62)). C-ASD E-values were generally moderately elevated, which points towards strong associations and makes uncontrolled confounding unlikely.
4.2. Interpretation
These results strongly support the strong association of cannabis with ASDRs both mechanistically and epidemiologically, which is consistent with a number of large studies elsewhere [ref. 5,ref. 41,ref. 42,ref. 43,ref. 44,ref. 45,ref. 46].
Genotoxicity has been well established as a foundational issue in drug safety testing since the thalidomide “tragedy” of 1957. Genotoxicity is manifested clinically as congenital anomalies, cancerogenesis, mental retardation and aging.
4.3. Literature Review
The databases PubMed, Medline, Scopus, Embase, Web of Science, Toxline, Mendeley, Current Contents, Biomed Central, Elsevier, and Springer were searched for the terms “cannabis”, “marijuana” and “atrial septal defect” (ASD) across all languages. Seven studies were identified, providing moderate- to high-quality data, often fulfilling causal criteria mechanistically, algorithmically and analytically.
4.4. Cellular and Molecular Mechanisms
4.4.1. Morphological Cardiogenesis
Morphogenesis of central cardiovasculature is a complex, delicately orchestrated process involving cells from the primary, secondary and lateral heart fields and proepicardium, nuchal crest and parts of the pharyngeal arches [ref. 47]. Atrial septal formation involves the formation of a septum primum, its subsequent breakdown, the growth of the atrial septum secundum from the dorsal atrial roof, flap valve closure of the foramen ovale with life’s first breath and later anatomical fusion of the septa secundum and primum remnants in the first year of life. This complex cellular choreography is controlled by morphogen gradients, which signal to cardiogenic gene cassettes under epigenomic control. Clearly, anything that perturbs or disrupts the morphogen gradients, the genome or the epigenome can potentially have a large impact on both cardiogenesis and central vasculogenesis.
4.4.2. Cardiogenic Morphogens
Morphogens are signaling molecules that play a crucial role in the embryonic development of the heart in mammals. They form concentration gradients within developing tissues, guiding the differentiation and spatial organization of cells to ensure proper cardiac formation. Many primary morphogens are involved in heart development, including sonic hedgehog (SHH), bone morphogenetic proteins (BMPs), Lefty proteins, components of the Wnt signaling pathway, COUP-TF II (Chicken Ovalbumin Upstream Promoter Transcription Factor II), VEGF (Vascular Endothelial Growth Factor) and VEGFR, Eph, angiopoietin and notch [ref. 47]. Cannabis impairs sonic hedgehog function both directly [ref. 3,ref. 48,ref. 49,ref. 50] and epigenomically [ref. 51]. Cannabis impairs Wnt signaling directly [ref. 52,ref. 53,ref. 54,ref. 55,ref. 56,ref. 57,ref. 58] and epigenomically [ref. 51]. Cannabinoids impair BMP signaling directly [ref. 59,ref. 60,ref. 61,ref. 62] and epigenomically [ref. 51]. Cannabis inhibits COUP-TF II directly [ref. 63]. Cannabinoids interact with angiopoietin pathways directly [ref. 64,ref. 65,ref. 66,ref. 67,ref. 68]. Cannabinoids interact with notch both directly [ref. 69,ref. 70,ref. 71] and epigenomically [ref. 51]. A total of 427 epigenomic hits against Eph genes were noted in the North Carolina epigenome-wide association study (EWAS) [ref. 51].
Therefore, the conclusion that cannabinoids broadly disrupt cardiogenic morphogenic gradients in multiple dimensions becomes inescapable.
It is of interest to consider the retinoid pathway by way of example for one of these pathways specifically.
Retinoids, derivatives of vitamin A, play essential roles in cardiac development, influencing gene expression via retinoic acid (RA) signaling. During early embryogenesis, RA regulates the patterning of the anterior–posterior axis of the heart tube and contributes to chamber specification, myocardial proliferation, and outflow tract development [ref. 72]. RA signaling is mediated through nuclear RA receptors (RARs) and retinoid X receptors (RXRs), which modulate transcription of key developmental genes such as Tbx5, Nkx2.5, and Hox family members [ref. 73]. Disruption of RA signaling, whether through deficiency or excess, leads to congenital heart defects (CHDs), highlighting its dosage-sensitive role in cardiogenesis [ref. 74].
Specifically, retinoids are crucial in atrial septal development [ref. 75,ref. 76]. The atrial septum arises from multiple embryonic structures, including the septum primum and septum secundum, whose formation is regulated by RA signaling. RA is required for the correct expression of Tbx5, a transcription factor critical for septation of the atria [ref. 77]. Mouse models with impaired RA synthesis (e.g., Raldh2-null mice) or disrupted RAR function exhibit atrial septal defects (ASDs), indicating a direct role in atrial partitioning [ref. 78]. Furthermore, RA influences endocardial cushion formation and remodeling processes that are essential for complete septation [ref. 79].
Taken together, retinoids are indispensable for proper heart development, particularly in atrial septation. Both deficiency and excess of RA disrupt normal morphogenesis, emphasizing the need for tightly regulated RA signaling during cardiogenesis.
Whilst cannabinoid products are an emerging industry, cannabis has long been known to be directly toxic to genetic material, including the induction of breaks in DNA and chromosomes, nuclear blebs, nucleocytolasmic bridges and multipolar cell division. As these are also indices of genomic aging, this evidence also speaks to nuclear aging. Increasing attention has recently focused on widespread epigenomic disruption induced by cannabis intoxication and withdrawal relating to all body systems and fundamental cellular processes, including DNA maintenance, formation and control of the mitotic spindle, reading, writing and erasing of DNA methylation, histone synthesis and metabolism, cellular and organismal growth and mitochondrial metabolism. Since aging has now been shown to be caused by genomic and epigenomic disruption, this evidence also implies cellular and organismal aging [ref. 80,ref. 81,ref. 82,ref. 83]. Indeed, cannabis has been shown to drive aging at both the epigenomic and clinical levels and in eighteen other domains [ref. 84,ref. 85].
Concerningly, several studies implicate many cannabinoids based upon the genotoxicity of the olivetol ring on the C-ring common to all cannabinoid structures [ref. 86].
4.4.3. Cardiogenic Epigenomics
This subject has already been reviewed in detail elsewhere [ref. 5,ref. 44,ref. 84,ref. 85]. The following material is included to provide an introductory appreciation of the scope and depth of the cardiogenic epigenotoxic damage inflicted by cannabis and cannabinoids. The interested reader is referred to the published literature and the primary cited sources [ref. 51].
In chronicling over 20,000 cannabis-induced perturbations of human and rodent sperm DNA methylation, one recent epigenome-wide screen (EWAS) found that amongst the most impacted pathways and processes perturbed by cannabis dependence, cardiogenesis was ranked fifth, whilst neurodevelopmental disorders and cerebral disorders were ranked ninth and tenth [ref. 51]. Similarly, disruption of vasculogenesis was also featured in the top ten processes most disrupted by cannabis withdrawal [ref. 51]. Organismal growth and agenesis pathways were ranked sixth and seventh in cannabis dependence, and organismal death was ranked fifth in cannabis withdrawal [ref. 51]. Moreover, some of the key genes regulating heart development, including GATA and TBX, were also shown to be epigenomically disrupted [ref. 51].
As mentioned, cannabinoids interfere with the major readers, writers and erasers of the epigenomic machinery epigenomically [ref. 5,ref. 51,ref. 84,ref. 85,ref. 87]. In the case of TET1, the major eraser of DNA methylation, cannabidiol and cannabinol interfere with this eraser directly, both by binding ferrous iron in the catalytic pocket and by occupying the pocket itself with high binding affinity [ref. 88]. It is important to appreciate that cannabinoids not only damage the epigenome generally but also damage the machinery that operates and maintains it [ref. 51]. That is to say, the cell’s ability to correct and repair the epigenomic damage is further compromised.
Several detailed epigenome-wide association studies following PCE have been published [ref. 51,ref. 89]. Interestingly, cardiogenesis was one of the most strongly associated processes in cannabis dependence identified by the in-depth EWAS of the North Carolina group, with an even stronger signal than for brain development [ref. 51]. A total of 26 cardiogenic genes identified in their study were impacted by cannabinoid epigenotoxicity. Processes compromised by cannabinoids included morphology of the cardiovasculature, hypoplasia of the trabeculae carnae, number of cardiomyocytes, hypoplasia of the heart chambers, right heart hypoplasia, atrial development, atrial septal morphogenesis, atrial hypoplasia and abnormal atrial morphology, including 127 genes in all [ref. 51].
The cardiogenic core gene cassette series was strongly identified in this EWAS, including MEF2 (Myocyte Enhancer Factor 2) NKX2 (NK2 Homeobox 2) GATA (GATA transcription factor family) and TBX (T-box transcription factor family) [ref. 51]. This EWAS identified 395 epigenomic hits on this key gene cassette [ref. 5,ref. 51,ref. 84,ref. 85,ref. 90]. As in other tissues, one of the key cardiac morphogens is sonic hedgehog (SHH) [ref. 47]. Genes in the SHH pathway disrupted by cannabis included GLI3 (Gli family zinc finger 3), MEGF8 (multiple EGF-like domains 8), TMEM107 (transmembrane protein 107) and BMP4 (bone morphogenetic protein 4), totaling 583 hits in all [ref. 51].
The above introductory commentary thus provides solid evidence of the widespread disruption of key cardiogenic genes, both directly and particularly epigenomically.
4.5. Strength of Association
This study met all of the Hill criteria for causality, including particular consistency with external data [ref. 5,ref. 41,ref. 42,ref. 43,ref. 44,ref. 45,ref. 46], temporality and the presence of a host of cellular and molecular mechanisms to explain findings.
The use of inverse probability weighting throughout is a powerful pseudo-randomizing statistical technique from which it is appropriate to draw causal inferences within the limitations of the measured predictor covariate matrix. Similarly, the moderate to high E-values strongly support the strength of the association of the C-ASD relationship. Some of the E-values reported are up to 7.77 × 10−63, which can be seen when relationships are in fact of a causal nature.
Having said that, other covariates could be considered (listed in the Limitations Section below), which would further constrain the potential contribution of presently unmeasured confounding. As an ecological study, this study is not able to address individual-level exposures.
4.6. Generalizability
The size and duration of this dataset, its consistency with other large studies, the logic of its cellular mechanisms, the high E-values and the repeated confirmation of the association in pseudo-randomized inverse probability weighted analyses together indicate that these findings are broadly generalizable [ref. 5,ref. 41,ref. 42,ref. 43,ref. 44,ref. 45,ref. 46]. E-values suggested that currently unmeasured confounding would need to be substantial to fully explain the observed associations.
4.7. Comparisons to Known Teratogens
Since both tobacco and alcohol are known to have negative effects on fetal development, it is worth considering the impacts of cannabis relative to these known teratogens.
Cigarettes, including ethnic cigarette exposure, appeared in all models in Table 2; however, in each case, it was much less impactful than the effects of cannabis. In the summary VIF table, cannabis accounted for 9% of the total partial variance and tobacco for only 1.7% (Table S5). In the three multivariate survey regression models in Table S6, tobacco exposure was again usually less impactful and less strongly associated with ASDRs than cannabinoid covariates. This pattern was continued in the gam analysis in Table S7. This overall pattern, where cannabis appears to be a much more potent teratogen than tobacco, was continued in large surveys of congenital anomalies at the national and continental levels [ref. 5,ref. 45,ref. 91].
Binge alcohol use appeared in three of the four mixed-effects models shown in Table 2, but its effect was inversely related to ASDRs, which is consistent with a generally falling binge alcohol involvement in the population, generally in the context of a rising ASDR. Binge alcohol use appeared in the final interactive survey regression model, but again, this relationship was inverse (Table S3). When considered by variance decomposition, binge alcohol was twelfth out of fourteen variables considered in Table S4. It was not included amongst the final significant predictive covariates in the survey regressions in Table S6 or the gam regressions in Table S7. This again implies that cannabis is a much more potent teratogen than binge alcohol consumption. Other indices of alcohol exposure may be considered, but as shown in Figures S26–S29, these are likely to yield similar unimpressive results.
Thus, overall, it appears that cannabis is a much more potent cardiac teratogen than tobacco, which, in turn, is a much more potent teratogen than alcohol, as has been previously documented [ref. 5,ref. 45,ref. 91].
4.8. Strengths and Limitations
The strengths of this study include its large data size, the use of three different forms of regression, the application of E-values and inverse probability weighting cornerstone techniques of statistical causal inference and the detailed statistical analysis. Its weaknesses include its lack of detailed participant-level data, which is a limitation it shares in common with many epidemiological studies. This ecological study has not considered a number of covariates that are known to be related to congenital anomaly rates, including maternal age, comorbidities, socioeconomic status, education, smoking, alcohol use, access to prenatal care. Such datasets may be explored in subsequent research. Because analyses were conducted at the ecological level, results should be interpreted as population-level associations rather than individual-level causal effects. The present study does not include a space–time analysis nor a heavy ethnocentric focus, which will be addressed in companion papers [ref. 92,ref. 93]. Earlier single-center retrospective studies have questioned CDC ASDR data integrity based on the finding of 64.3% positive predictive value in juvenile populations [ref. 94]. Whilst this issue is of relevance to this work, it does not compromise its major conclusions.
5. Conclusions
Data confirm that cannabis is a strong candidate for potentially driving ASDRs, a result amplified by the key biomarker role played by ASD in cannabinoid teratogenicity and cannabinoid genotoxicity more generally. The implications of the exponential cannabinoid genotoxicity dose–response curve are generally overlooked in public health discussions relating to cannabinoid health risks, but based on this and related studies, they are likely very profound indeed. Community genomes and epigenomes are precious but fragile resources that should be carefully protected by strictly limiting cannabinoid exposure of the current generation to protect those of multiple generations to come.
References
- V.J. Koller, F. Ferk, H. Al-Serori, M. Misik, A. Nersesyan, V. Auwarter, T. Grummt, S. Knasmuller. Genotoxic properties of representatives of alkylindazoles and aminoalkyl-indoles which are consumed as synthetic cannabinoids. Food Chem. Toxicol., 2015. [DOI | PubMed]
- C. Russo, F. Ferk, M. Misik, N. Ropek, A. Nersesyan, D. Mejri, K. Holzmann, M. Lavorgna, M. Isidori, S. Knasmuller. Low doses of widely consumed cannabinoids (cannabidiol and cannabidivarin) cause DNA damage and chromosomal aberrations in human-derived cells. Arch. Toxicol., 2018. [DOI | PubMed]
- E.W. Fish, L.B. Murdaugh, C. Zhang, K.E. Boschen, O. Boa-Amponsem, H.N. Mendoza-Romero, M. Tarpley, L. Chdid, S. Mukhopadhyay, G.J. Cole. Cannabinoids Exacerbate Alcohol Teratogenesis by a CB1-Hedgehog Interaction. Sci. Rep., 2019. [DOI | PubMed]
- B.N. Hölzel, K. Pfannkuche, B. Allner, H.T. Allner, J. Hescheler, D. Derichsweiler, H. Hollert, A. Schiwy, J. Brendt, M. Schaffeld. Following the adverse outcome pathway from micronucleus to cancer using H2B-eGFP transgenic healthy stem cells. Arch. Toxicol., 2020. [DOI | PubMed]
- A.S. Reece, G.K. Hulse. Chapter 3: Geospatiotemporal and causal inferential analysis of United States congenital anomalies as a function of multiple cannabinoid-and substance-exposures: Phenocopying thalidomide and hundred megabase-scale genotoxicity. Epidemiology of Cannabis: Genotoxicity and Neurotoxicity, Epigenomics and Aging, 2025
- 6. National Birth Defects Prevention Network Major Birth Defects Data from Populatoin-Based Birth Defects Surveillance Programs in the United States, 2016–2020 NBDPN National Birth Defects Prevention Network, NBDPNHouston, TX, USA2024Volume 2020
- National Survey of Drug Use and Health (NSDUH 2020)
- censusapi: Retrieve Data from the Census APIs—R Package Version 0.8.0
- S. Chandra, M.M. Radwan, C.G. Majumdar, J.C. Church, T.P. Freeman, M.A. ElSohly. New trends in cannabis potency in USA and Europe during the last decade (2008–2017). Eur. Arch. Psychiatry Clin. Neurosci., 2019. [DOI | PubMed]
- M.A. ElSohly, S. Chandra, M. Radwan, C.G. Majumdar, J.C. Church. A Comprehensive Review of Cannabis Potency in the United States in the Last Decade. Biol. Psychiatry Cogn. Neurosci. Neuroimaging, 2021. [DOI | PubMed]
- M.A. ElSohly, Z. Mehmedic, S. Foster, C. Gon, S. Chandra, J.C. Church. Changes in Cannabis Potency Over the Last 2 Decades (1995–2014): Analysis of Current Data in the United States. Biol. Psychiatry, 2016. [DOI | PubMed]
- M.A. ElSohly, S.A. Ross, Z. Mehmedic, R. Arafat, B. Yi, B.F. Banahan. Potency trends of delta9-THC and other cannabinoids in confiscated marijuana from 1980–1997. J. Forensic Sci., 2000. [DOI | PubMed]
- T.P. Freeman, S. Craft, J. Wilson, S. Stylianou, M. ElSohly, M. Di Forti, M.T. Lynskey. Changes in delta-9-tetrahydrocannabinol (THC) and cannabidiol (CBD) concentrations in cannabis over time: Systematic review and meta-analysis. Addiction, 2021. [DOI | PubMed]
- L.O. Gostin, J.G. Hodge, S.A. Wetter. Enforcing Federal Drug Laws in States Where Medical Marijuana Is Lawful. JAMA, 2018. [DOI | PubMed]
- Cannabis Overview
- Timeline of Cannabis Laws in the United States
- Natality Information, Live Births
- H. Wickham, M. Averick, J. Bryan, W. Chang, L.D. McGowan, R. Francios, G. Groelmund, A. Hayes, L. Henry, J. Hester. Welcome to the Tidyverse. J. Open Source Softw., 2019. [DOI]
- ggpubr: ‘ggplot2’ Based Publication Ready Plots
- S. Xu, M. Chen, T. Feng, L. Zhan, L. Zhou, G. Yu. Use ggbreak to Effectively Utilize Plotting Space to Deal With Large Datasets and Outliers. Front. Genet., 2021. [DOI | PubMed]
- grepel: Automatically Position Non-Overlapping Text Labels with ‘ggplot2’. R package version 0.9.6
- Patchwork: The Composer of Plots. R Package Version 1.1.2
- gridExtra: Miscellaneous Functions for “Grid” Graphics. R Package Version 2.3
- tableone: Create ‘Table 1’ to Describe Baseline Characteristics with or Without Propensity Score Weights. R Package Version 0.13.2
- D. Bates, M. Mächler, B. Bolker, S. Walker. Fitting Linear Mixed-Effects Models Using lme4. J. Stat. Softw., 2015. [DOI]
- A. Kuznetsova, P.B. Brockhoff, R.H.B. Christensen. lmerTest Package: Tests in Linear Mixed Effects Models. J. Stat. Softw., 2017. [DOI]
- T. Lumley. Analysis of Complex Survey Samples. J. Stat. Softw., 2004. [DOI]
- T. Lumley. Complex Surveys: A Guide to Analysis Using R, 2010
- S.N. Wood. Stable and Efficient Multiple Smoothing Parameter Estimation for Generalized Additive Models. J. Am. Stat. Assoc., 2004. [DOI]
- S.N. Wood. Fast stable restricted maximum likelihood and marginal likelihood estimation of semiparametric generalized linear models. J. R. Stat. Soc. Ser. B Stat. Methodol., 2011. [DOI]
- S.N. Wood, P. Natalya, B. Säfken. Smoothing Parameter and Model Selection for General Smooth Models. J. Am. Stat. Assoc., 2016. [DOI]
- W.N. Venables, B.D. Ripley. MASS: Modern Applied Statistics with S, 2002
- D. Lüdecke, M.S. Ben-Shachar, I. Patil, P. Waggoner, D. Makowski. performance: An R Package for Assessment, Comparison and Testing of Statistical Models. J. Open Source Softw., 2021. [DOI]
- J. Fox, S. Weisberg. An R Companion to Applied Regression (CAR), 2019
- effzise: Efficient Effect Size Computation
- R.V. Lenth. emmeans: Estimated Marginal Means, aka Least-Squares Means. 2025
- W.M. Van der Wal, R.B. Geskus. ipw: An R Package for Inverse Probabilty Weighting. J. Stat. Softw., 2011
- T.J. VanderWeele, P. Ding. Sensitivity Analysis in Observational Research: Introducing the E-Value. Ann. Intern. Med., 2017. [DOI | PubMed]
- T.J. VanderWeele, P. Ding, M. Mathur. Technical Considerations in the Use of the E-Value. J. Causal Inference, 2019. [DOI]
- Package ‘EValue’
- A.S. Reece, G.K. Hulse. Contemporary epidemiology of rising atrial septal defect trends across USA 1991–2016: A combined ecological geospatiotemporal and causal inferential study. BMC Pediatr, 2020. [DOI | PubMed]
- M.B. Forrester, R.D. Merz. Risk of selected birth defects with prenatal illicit drug use, Hawaii, 1986–2002. J. Toxicol. Environ. Health, 2007. [DOI | PubMed]
- A.S. Reece, G.K. Hulse. Cannabis Teratology Explains Current Patterns of Coloradan Congenital Defects: The Contribution of Increased Cannabinoid Exposure to Rising Teratological Trends. Clin. Pediatr., 2019. [DOI | PubMed]
- A.S. Reece, G.K. Hulse. European Epidemiological Patterns of Cannabis- and Substance- Related Congenital Cardiovascular Anomalies: Geospatiotemporal and Causal Inferential Study. Environ. Epigenet., 2022. [DOI | PubMed]
- A.S. Reece, G.K. Hulse. Geotemporospatial and causal inference epidemiological analysis of US survey and overview of cannabis, cannabidiol and cannabinoid genotoxicity in relation to congenital anomalies 2001–2015. BMC Pediatr., 2022. [DOI | PubMed]
- A.S. Reece, G.K. Hulse. Canadian Cannabis Consumption and Patterns of Congenital Anomalies: An Ecological Geospatial Analysis. J. Addict. Med., 2020. [DOI | PubMed]
- B.M. Carlson. Human Embryology and Developmental Biology, 2019
- Y. Gheasuddin, G.L. Galea. Cannabidiol impairs neural tube closure in mouse whole embryo culture. Birth Defects Res., 2022. [DOI | PubMed]
- O. Boa-Amponsem, C. Zhang, S. Mukhopadhyay, I. Ardrey, G.J. Cole. Ethanol and cannabinoids interact to alter behavior in a zebrafish fetal alcohol spectrum disorder model. Birth Defects Res., 2019. [DOI | PubMed]
- O. Boa-Amponsem, C. Zhang, D. Burton, K.P. Williams, G.J. Cole. Ethanol and Cannabinoids Regulate Zebrafish GABAergic Neuron Development and Behavior in a Sonic Hedgehog and Fibroblast Growth Factor-Dependent Mechanism. Alcohol. Clin. Exp. Res., 2020. [DOI | PubMed]
- R. Schrott, S.K. Murphy, J.L. Modliszewski, D.E. King, B. Hill, N. Itchon-Ramos, D. Raburn, T. Price, E.D. Levin, R. Vandrey. Refraining from use diminishes cannabis-associated epigenetic changes in human sperm. Environ. Epigenet., 2021. [DOI | PubMed]
- H.L. Gao, Y. Yang, H. Tian, L.Y. Fu, K.L. Liu, X.Y. Jia, X.L. Shi, Y.M. Kang, X.J. Yu. Inhibition of CB1R in the Hypothalamic Paraventricular Nucleus Ameliorates Hypertension Through Wnt/β-Catenin/RAS Pathway. Cardiovasc. Toxicol., 2025. [DOI | PubMed]
- D. Zhu, J. Zhang, J. Hashem, F. Gao, C. Chen. Inhibition of 2-arachidonoylglycerol degradation enhances glial immunity by single-cell transcriptomic analysis. J. Neuroinflamm., 2023. [DOI | PubMed]
- I. Muhammad, M.A. Ibrahim, M. Kumarihamy, J.A. Lambert, J. Zhang, M.H. Mohammad, S.I. Khan, D.S. Pasco, P. Balachandran. Cannabinoid and Opioid Receptor Affinity and Modulation of Cancer-Related Signaling Pathways of Machaeriols and Machaeridiols from Machaerium Pers. Molecules, 2023. [DOI | PubMed]
- N.G. Hösch, B.B. Martins, Q.A. Alcantara, M.C. Bufalo, B.S. Neto, A.M. Chudzinki-Tavassi, F.V. Santa-Cecilia, Y. Cury, V.O. Zambelli. Wnt signaling is involved in crotalphine-induced analgesia in a rat model of neuropathic pain. Eur. J. Pharmacol., 2023. [DOI | PubMed]
- P. Feng, L. Zhu, J. Jie, P. Yang, N. Sheng, X. Chen, X. Chen. Cannabidiol inhibits invasion and metastasis in colorectal cancer cells by reversing epithelial-mesenchymal transition through the Wnt/β-catenin signaling pathway. J. Cancer Res. Clin. Oncol., 2023. [DOI | PubMed]
- K. Yui, G. Imataka, S. Yoshihara. Lipid-Based Molecules on Signaling Pathways in Autism Spectrum Disorder. Int J Mol Sci, 2022. [DOI | PubMed]
- A. Vallée, Y. Lecarpentier, J.N. Vallée. Possible actions of cannabidiol in obsessive-compulsive disorder by targeting the WNT/β-catenin pathway. Mol. Psychiatry, 2022. [DOI | PubMed]
- C. Yun, M.S. Haleem, S. Jeong, M.A. Oyer, A.J. Driscoll, K.Y. Chang, J. Yun, J. Paul, R.J. Lubbe, S.R. Stock. Effect of Postoperative Analgesic Exposure to the Cannabinoid Receptor Agonist WIN55 on Osteogenic Differentiation and Spinal Fusion in Rats. J. Bone Jt. Surg. Am., 2021. [DOI | PubMed]
- T.R. Xu, Y. Yang, R. Ward, L. Gao, Y. Liu. Orexin receptors: Multi-functional therapeutic targets for sleeping disorders, eating disorders, drug addiction, cancers and other physiological disorders. Cell. Signal., 2013. [DOI | PubMed]
- A. Birerdinc, M. Jarrar, T. Stotish, M. Randhawa, A. Baranova. Manipulating molecular switches in brown adipocytes and their precursors: A therapeutic potential. Prog. Lipid Res., 2013. [DOI | PubMed]
- D. Richard, F. Picard. Brown fat biology and thermogenesis. Front. Biosci., 2011. [DOI]
- J. Díaz-Alonso, T. Aguado, C.S. Wu, J. Palazuelos, C. Hofmann, P. Garcez, F. Guillemot, H.C. Lu, B. Lutz, M. Guzmán. The CB(1) cannabinoid receptor drives corticospinal motor neuron differentiation through the Ctip2/Satb2 transcriptional regulation axis. J. Neurosci., 2012. [DOI | PubMed]
- A. Gęgotek, S. Atalay, A. Wroński, A. Markowska, E. Skrzydlewska. Cannabidiol Decreases Metalloproteinase Activity and Normalizes Angiogenesis Factor Expression in UVB-Irradiated Keratinocytes from Psoriatic Patients. Oxid. Med. Cell. Longev., 2021. [DOI | PubMed]
- M. Hirao-Suzuki, K. Takayuki, M. Takiguchi, J.M. Peters, S. Takeda. Cannabidiolic acid activates the expression of the PPARβ/δ target genes in MDA-MB-231 cells. Arch. Biochem. Biophys., 2022. [DOI | PubMed]
- L. Al-Eitan, S. Alahmad. The expression analyses of GSK3B, VEGF, ANG1, and ANG2 in human brain microvascular endothelial cells treated with the synthetic cannabinoid XLR-11. Gene, 2023. [DOI | PubMed]
- L.N. Al-Eitan, S.Z. Alahmad, M.F.M. ElMotasem, M.A. Alghamdi. The synthetic cannabinoid 5F-MDMB-PICA enhances the metabolic activity and angiogenesis in human brain microvascular endothelial cells by upregulation of VEGF, ANG-1, and ANG-2. Toxicol. Res., 2023. [DOI]
- L.N. Al-Eitan, S.Z. Alahmad, S.A. Ajeen, A.Y. Altawil, I.Y. Khair, H.S.A. Kharmah, M.A. Alghamdi. Evaluation of the metabolic activity, angiogenic impacts, and GSK-3β signaling of the synthetic cannabinoid MMB-2201 on human cerebral microvascular endothelial cells. J. Cannabis Res., 2024. [DOI | PubMed]
- C.A. Newton, P.J. Chou, I. Perkins, T.W. Klein. CB(1) and CB(2) cannabinoid receptors mediate different aspects of delta-9-tetrahydrocannabinol (THC)-induced T helper cell shift following immune activation by Legionella pneumophila infection. J. Neuroimmune Pharmacol., 2009. [DOI | PubMed]
- K. Miranda, P. Mehrpouya-Bahrami, P.S. Nagarkatti, M. Nagarkatti. Cannabinoid Receptor 1 Blockade Attenuates Obesity and Adipose Tissue Type 1 Inflammation Through miR-30e-5p Regulation of Delta-Like-4 in Macrophages and Consequently Downregulation of Th1 Cells. Front. Immunol., 2019. [DOI | PubMed]
- E. Besser, A. Gelfand, S. Procaccia, P. Berman, D. Meiri. Cannabinoid combination targets NOTCH1-mutated T-cell acute lymphoblastic leukemia through the integrated stress response pathway. Elife, 2024. [DOI | PubMed]
- L. Ryckebusch, Z. Wang, N. Bertrand, S.C. Lin, X. Chi, R. Schwartz, S. Zaffran, K. Niederreither. Retinoic acid deficiency alters second heart field formation. Proc. Natl. Acad. Sci. USA, 2008. [DOI | PubMed]
- J. Xavier-Neto, N. Rosenthal, F.A. Silva, T.G. Matos, T. Hochgreb, V.L. Linhares. Retinoid signaling and cardiac anteroposterior segmentation. Genesis, 2001. [DOI | PubMed]
- M.H. Zile. Function of vitamin A in vertebrate embryonic development. J. Nutr., 2001. [DOI | PubMed]
- E. Abraham, A. Kostina, B. Volmert, T. Roule, L. Huang, J. Yu, A.E. Williams, E. Megill, A. Douglas, O.M. Pericak. A retinoic acid:YAP1 signaling axis controls atrial lineage commitment. Cell Rep., 2025. [DOI | PubMed]
- H. Zhang, P. Sen, J. Hamers, T. Sittig, B. Woestenburg, A. Moretti, A. Dendorfer, D. Merkus. Retinoic acid modulation guides human-induced pluripotent stem cell differentiation towards left or right ventricle-like cardiomyocytes. Stem Cell Res. Ther., 2024. [DOI | PubMed]
- B.G. Bruneau, G. Nemer, J.P. Schmitt, F. Charron, L. Robitaille, S. Caron, D.A. Conner, M. Gessler, M. Nemer, C.E. Seidman. A murine model of Holt-Oram syndrome defines roles of the T-box transcription factor Tbx5 in cardiogenesis and disease. Cell, 2001. [DOI | PubMed]
- K. Niederreither, V. Subbarayan, P. Dollé, P. Chambon. Embryonic retinoic acid synthesis is essential for early mouse post-implantation development. Nat. Genet., 1999. [DOI | PubMed]
- S.C. Lin, P. Dollé, L. Ryckebüsch, M. Noseda, S. Zaffran, M.D. Schneider, K. Niederreither. Endogenous retinoic acid regulates cardiac progenitor differentiation. Proc. Natl. Acad. Sci. USA, 2010. [DOI | PubMed]
- M.B. Schultz, D.A. Sinclair. When stem cells grow old: Phenotypes and mechanisms of stem cell aging. Development, 2016. [DOI | PubMed]
- S. Lautrup, D.A. Sinclair, M.P. Mattson, E.F. Fang. NAD(+) in Brain Aging and Neurodegenerative Disorders. Cell Metab., 2019. [DOI | PubMed]
- Y. Lu, B. Brommer, X. Tian, A. Krishnan, M. Meer, C. Wang, D.L. Vera, Q. Zeng, D. Yu, M.S. Bonkowski. Reprogramming to recover youthful epigenetic information and restore vision. Nature, 2020. [DOI | PubMed]
- J.H. Yang, M. Hayano, P.T. Griffin, J.A. Amorim, M.S. Bonkowski, J.K. Apostolides, E.L. Salfati, M. Blanchette, E.M. Munding, M. Bhakta. Loss of epigenetic information as a cause of mammalian aging. Cell, 2023. [DOI | PubMed]
- A.S. Reece, G.K. Hulse. Epigenomic and Other Evidence for Cannabis-Induced Aging Contextualized in a Synthetic Epidemiologic Overview of Cannabinoid-Related Teratogenesis and Cannabinoid-Related Carcinogenesis. Int. J. Environ. Res. Public Health, 2022. [DOI | PubMed]
- A.S. Reece, G.K. Hulse. Chapter 5: Multivalent Cannabinoid Epigenotoxicities and Multigenerational Aging. Epidemiology of Cannabis: Genotoxicity and Neurotoxicity, Epigenomics and Aging, 2025
- A. Morishima, R.T. Henrich, J. Jayaraman, G.G. Nahas. Hypoploid metaphases in cultured lymphocytes of marihuana smokers. Adv. Biosci., 1978. [PubMed]
- A.S. Reece, G.K. Hulse. Impacts of cannabinoid epigenetics on human development: Reflections on Murphy et. al. ‘cannabinoid exposure and altered DNA methylation in rat and human sperm’ epigenetics 2018; 13: 1208–1221. Epigenetics, 2019. [DOI | PubMed]
- V. Antonyová, Z. Kejík, T. Brogyanyi, R. Kaplánek, K. Veselá, N. Abramenko, T. Ocelka, M. Masařík, A. Matkowski, J. Gburek. Non-psychotropic cannabinoids as inhibitors of TET1 protein. Bioorg. Chem., 2022. [DOI | PubMed]
- N. Fuchs Weizman, B.A. Wyse, J. Montbriand, S. Jahangiri, C.L. Librach. Cannabis significantly alters DNA methylation of the human ovarian follicle in a concentration-dependent manner. Mol. Hum. Reprod., 2022. [DOI | PubMed]
- A.S. Reece, G.K. Hulse. Perturbation of 3D nuclear architecture, epigenomic dysregulation and aging, and cannabinoid synaptopathy reconfigures conceptualization of cannabinoid pathophysiology: Part 1-aging and epigenomics. Front. Psychiatry, 2023. [DOI | PubMed]
- A.S. Reece, G.K. Hulse. Cannabinoid- and Substance- Relationships of European Congenital Anomaly Patterns: A Space-Time Panel Regression and Causal Inferential Study. Environ. Epigenet., 2022. [DOI | PubMed]
- A.S. Reece, G.K. Hulse. Space-Time Analysis of Burgeoning US Atrial Septal Defect Rates. J. Xenobiotics, 2026
- A.S. Reece, G.K. Hulse. Cannabinoid Impacts on Ethnic Modulation of Atrial Septal Defect Prevalence USA. J. Perinatol., 2026
- F.H. Rodriguez, G. Ephrem, J.F. Gerardin, C. Raskind-Hood, C. Hogue, W. Book. The 745.5 issue in code-based, adult congenital heart disease population studies: Relevance to current and future ICD-9-CM and ICD-10-CM studies. Congenit. Heart Dis., 2018. [DOI | PubMed]