A Multicenter Study on the Prognostic Value of Indicators Derived From Complete Blood Count in Glioblastoma
Abstract
Background:
Previous studies have found that some indices derived from preoperative complete blood count (CBC) are closely related to the prognosis of glioma, but the results are inconsistent. This study comprehensively discussed the prognostic significance of the preoperative CBC index in patients with glioblastoma (GBM) through a multicenter study.
Methods:
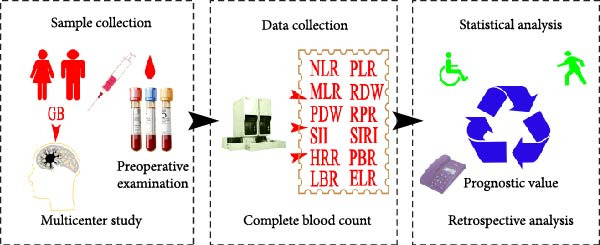
In this multicenter study, we retrospectively analyzed clinical data from 143 GBM patients to evaluate the prognostic value of 12 preoperative CBC‐derived indicators: Neutrophil‐to‐lymphocyte ratio (NLR), platelet‐to‐lymphocyte ratio (PLR), monocyte‐to‐lymphocyte ratio (MLR), red cell distribution width (RDW), platelet distribution width (PDW), RDW‐to‐PDW (RPR), systemic inflammation index (SII), systemic inflammation response index (SIRI), hemoglobin‐to‐red cell distribution width ratio (HRR), platelet‐to‐basophil ratio (PBR), lymphocyte‐to‐basophil ratio (LBR), and eosinophil‐to‐lymphocyte ratio (ELR). Optimal cut‐off values for each indicator were determined using maximally selected rank statistics (MSRS). Survival outcomes were assessed by Kaplan–Meier analysis, and univariate and multivariate Cox regression were employed to identify independent prognostic factors. Furthermore, a nomogram was developed by integrating significant prognostic indicators to facilitate individualized prediction of survival in GBM patients.
Results:
The results showed that higher levels of NLR, PLR, MLR, RDW, PDW, and RPR were associated with shorter survival in GBM patients. In contrast, lower levels of ELR were associated with shorter survival in GBM patients. Among these, RDW (HR 1.905, 95% CI 1.114–3.258, p = 0.019), MLR (HR 1.603, 95% CI 1.029–2.496, p = 0.037), and ELR (HR 0.380, 95% CI 0.193–0.747, p = 0.005) emerged as an independent prognostic factors. The prognostic nomogram was constructed according to the three independent factors, which improved the accuracy of prognosis prediction (AUC = 0.702).
Conclusion:
Routine preoperative CBC parameters, particularly RDW, MLR, and ELR, serve as valuable complementary prognostic indicators for GBM patients. These accessible biomarkers warrant further validation through large‐sample, multicenter studies to solidify their clinical utility.
Article type: Research Article
Keywords: complete blood count, glioblastoma, indicator, prognosis, RDW
Affiliations: Department of Neurosurgery, The Affiliated Chuzhou Hospital of Anhui Medical University, The First People’s Hospital of Chuzhou, Chuzhou, 239000, China; School of Public Health, Nantong University, Nantong, China, ntu.edu.cn; Laboratory Medicine Center, The First Affiliated Hospital of Nanjing Medical University, Jiangsu Province Hospital, Nanjing, China, jsph.net; Laboratory Medicine Center, The Affiliated Chuzhou Hospital of Anhui Medical University, The First People’s Hospital of Chuzhou, Chuzhou, 239000, China
License: Copyright © 2025 Shiqiang Hou et al. Mediators of Inflammation published by John Wiley & Sons Ltd. CC BY 4.0 This is an open access article under the terms of the http://creativecommons.org/licenses/by/4.0/, which permits use, distribution and reproduction in any medium, provided the original work is properly cited.
Article links: DOI: 10.1155/mi/5588098 | PubMed: 41498042 | PMC: PMC12767395
Relevance: Relevant: mentioned in keywords or abstract
Full text: PDF (686 KB)
1. Introduction
Glioblastoma (GBM), a common primary brain tumor classified as WHO grade IV, predominantly arises in the frontal or temporal lobes, though it may develop throughout the central nervous system [ref. 1]. GBM is a highly malignant form of glioma classified as WHO grade IV, characterized by a rapid rate of cell division, vascular proliferation, and invasiveness [ref. 2]. Current therapeutic modalities for GBM consist of a combination of surgery (with the goal of maximal tumor resection), radiotherapy, and chemotherapy [ref. 3]. Despite therapeutic advances in the twenty‐first century, prognosis remains poor, with a median survival of approximately 15 months and a 5‐year survival rate below 5% [ref. 1, ref. 4]. Given that nearly all patients experience disease recurrence, accurate assessment of prognosis, tumor burden, and risk stratification is essential for treatment planning. It is critical to find strong and trustworthy prognostic markers as soon as feasible to assist doctors in modifying the course of treatment to enhance the patient’s quality of life and extend their prognosis [ref. 5].
Existing research has highlighted limitations in current biomarker approaches for GBM. Many protein‐based biomarkers demonstrate poor detectability and reproducibility [ref. 6]. In addition, the few highly accurate genetic biomarkers have limited clinical application due to testing conditions and high costs [ref. 7]. In recent years, increasing attention has been focused on liquid biopsy—the development of noninvasive predictive biomarkers derived from hematological and serological parameters for various inflammatory diseases and malignancies [ref. 8–ref. 10]. Preoperative hematologic biomarkers are crucial indicators for cancer diagnosis and prognosis evaluation [ref. 11, ref. 12]. Because they may partially represent the body’s tumor microenvironment [ref. 4, ref. 13]. The preoperative complete blood count (CBC) test is mandatory for patients in almost all hospitals around the world and widely used as a common and simple test for cancer patients. Substantial evidence from numerous studies and meta‐analyses has established that multiple prognostic indicators derived from CBC are significantly associated with GBM outcomes [ref. 4, ref. 14, ref. 15].
Neutrophil‐to‐lymphocyte ratio (NLR), platelet‐to‐lymphocyte ratio (PLR), monocyte‐to‐lymphocyte ratio (MLR), systemic inflammation index (SII), and systemic inflammation response index (SIRI) are common immune‐inflammatory variables that may be useful as prognostic markers for a range of solid tumors [ref. 8, ref. 16, ref. 17]. Additionally, red cell distribution width (RDW) is also an important parameter of CBC. It is frequently used in clinical settings to identify the precise kind of anemia since it shows the variability of red blood cell size [ref. 18]. For a number of malignancies, increased RDW has been demonstrated to be a prognostic biomarker [ref. 19]. Similarly, platelet distribution width (PDW) is a direct parameter of platelet size variability in CBC. Inflammatory mediators can activate platelets, changing their shape from discoid to spherical and forming pseudopodia, which can raise PDW levels [ref. 12]. According to one research, PDW and RDW were both independent prognostic markers in GC, and the RDW‐to‐PDW (RPR) score may be used to accurately predict the prognosis of GC patients [ref. 20]. As for GBM, most of the published literature has similar findings. Clavreul et al. [ref. 4] discovered that preoperative NLR value was an independent risk factor for poor prognosis of GBM in multivariate analyses. Duan et al. [ref. 21] and Shi et al. [ref. 22] found that although high preoperative levels of NLR, MLR, PLR, and SII were prognostic risk factors for GBM patients, only SII was an independent risk factor.
Nevertheless, the prognostic significance of the aforementioned inflammatory indicators in GBM remains inconsistent across existing studies. Reports about these biomarkers in GBM are still relatively few, and the sample size is not enough. Thus, the goal of this research is to use multicenter studies to investigate and unearth the link between those indicators from CBC and GBM. Several new significant biomarkers derived from CBC are found in recent studies, including hemoglobin‐to‐red cell distribution width ratio (HRR), platelet‐to‐basophil ratio (PBR), lymphocyte‐to‐basophil ratio (LBR), and eosinophil‐to‐lymphocyte ratio (ELR). They have few reports in GBM, and their value is not well defined [ref. 23–ref. 25]. Accordingly, our study incorporates these novel markers as part of a systematic exploratory analysis.
2. Methods
2.1. Study Population
Retrospective clinical data from three medical centers between January 2017 and December 2021 made up the study population. The three medical centers were Jiangsu Province Hospital, Affiliated Hospital of Nantong University, and the First People’s Hospital of Chuzhou. Only patients who had surgical resection were included in this study to homogenize the patient cohort; patients who had a biopsy alone or no surgical intervention at all were excluded. Additionally, only patients with complete preoperative CBC information were included in further analyses. Following a cascade of censoring, 143 individuals with GBM were ultimately included in this research based on the following inclusion and exclusion criteria. The Institutional Review Board of the First People’s Hospital of Chuzhou approved this report and waived the need for obtaining informed consent. Ethical approval for this study was obtained and adhered to national and institutional research committee ethical standards and the Declaration of Helsinki.
2.2. Inclusion Criteria
(1) Patients with a primary diagnosis of GBM, that is, without radiation, chemotherapy, or resection, whose diagnosis was confirmed by pathologic evaluation. (2) Patients with completed routine pretreatment blood tests and adequate laboratory data. (3) Medical records provided baseline clinicopathologic information, such as age, sex, tumor size, and tumor grade, which was determined by immunohistochemistry staining. (4) The patient received routine radiation and chemotherapy after surgery. MGMT status was not mandatory for routine pathology reports at the centers, and IDH 1/2 mutation was not detected in the First People’s Hospital of Chuzhou before 2020. Therefore, the correlation with MGMT and IDH 1/2 mutation status was not analyzed in this study.
2.3. Exclusion Criteria
(1) individuals with comorbid conditions (hematologic illness, autoimmune disease, cardiovascular disease, and renal impairment). (2) A confirmed cancer. (3) Patients who do not have hyperpyrexia or overt infection. (4) Those who have a systemic or local infection. (5) Individuals using drugs for inflammatory conditions. (6) Absent follow‐up information.
2.4. Data Collection and Laboratory Measurements
Retrospective evaluation of the medical data of 792 patients undergoing curative resection for GBM between January 2017 and December 2021 was permitted by the institutional review board. As part of a standard preoperative workup, every patient had a full blood count taken 1–7 days after being admitted to the hospital. The CBC included measurement of neutrophils, lymphocytes, monocytes, platelets, hemoglobin (Hb), RDW, and PDW using the Sysmex XN‐1000 hematology analyzer (Sysmex Corp, Kobe, Japan). The calculation methods of these indicators derived from the CBC are described in Table 1.
Table 1: The calculation methods of the indicators derived from the CBC.
| Name | Calculation methods | Name | Calculation methods |
|---|---|---|---|
| NLR | Neutrophils/lymphocytes | SII | Platelets × NLR |
| PLR | Platelets/lymphocytes | SIRI | Monocytes × NLR |
| MLR | Monocytes/lymphocytes | ELR | Eosinophils/lymphocytes |
| RPR | RDW/platelets | LBR | Lymphocytes/basophils |
| HRR | Hb/RDW | PBR | Platelets/basophils |
Telephone interviews were used to check in with each patient on a regular basis. The most recent follow‐up was placed in December 2021. The date of the final follow‐up for survivors was used to determine the overall survival (OS), which was computed from the date of diagnosis to the date of death. The scheme of this study is shown in Figure 1.
2.5. Statistical Analysis
Categorical variables are shown as frequencies and percentages, whereas continuous variables are shown as medians. The data’s normality was evaluated using the Kolmogorov–Smirnov test. The chi‐squared test was used to assess categorical variables. The Spearman’s correlation coefficient was utilized to evaluate the connection between continuous variables. Implementing maximally selected rank statistics (MSRS) to identify the best cutoff thresholds for the hematological indices. Statistical significance of each identified cut‐off was rigorously assessed via permutation testing (1000 permutations, p < 0.05 required). Plotting Kaplan–Meier curves for patients with high and low hematological indicator values allowed for the analysis of survival differences between groups using the Wilcoxon test. By the log‐rank test in both univariate and multivariate Cox analyses, the predictive significance of hematological markers for survival was assessed. All variables that showed a potential association with OS in univariate analysis (p < 0.05) were initially considered for inclusion in the multivariate Cox proportional hazards model. Later, an enter selection procedure with a significance level of p < 0.05 was used to identify the most parsimonious set of independent prognostic factors. Sangerbox 3.0 is used to construct and test the nomogram, including Kaplan–Meier curve. All statistical analyses in this investigation were conducted using the Statistical Package for the Social Sciences (version 21 SPSS, Inc., Chicago, IL, USA) and R soft (R language 4.1.3 version, R Core Team, 2021), with p < 0.05 being deemed statistically significant.
3. Result
3.1. Patient Characteristics
The study comprised 143 GBM patients who had no systemic comorbidities or preoperative infectious illnesses and comprehensive preoperative hematologic markers. Table 2 summarizes the patients’ initial clinical and pathologic features. The maximal diameter of the contrast‐enhancing tumor was measured on axial slices of preoperative T1‐weighted gadolinium‐enhanced MRI. Tumor location was categorized by laterality (left or right hemisphere). The 143 research participants had a median age of 60 (9–84), of which 69 (48.25%) were under 60 and 74 (51.75%) were over 60. 65 (45.45%) of these patients were female, and 78 (54.55%) were male. The median values of preoperative NLR, PLR, MLR, RDW, PDW, RPR, SII, SIRI, HRR, PBR, LBR, and ELR were 2.64, 132.05, 0.27, 12.96, 15.60, 0.064, 528.21, 1.08, 10.55, 6700, 56, and 0.047, respectively.
Table 2: Clinical characteristics of 143 GBM patients.
| Variables | Patients (range or %) | Variables | Patients (range or %) |
|---|---|---|---|
| Median age (year) | 60.00 (9–84) | — | — |
| Gender | — | PDW | 15.60 (9.30–22.10) |
| Male | 78 (54.55) | <14.00 | 53 (37.10) |
| Female | 65 (45.45) | ≥14.00 | 90 (62.90) |
| Age (yr) | — | RPR | 0.064 (0.41–0.184) |
| <60 | 69 (48.25) | <0.065 | 77 (53.80) |
| ≥60 | 74 (51.75) | ≥0.065 | 66 (46.20) |
| Tumor size (cm) | — | SII | 528.21 (114.92–4022.16) |
| <3 | 58 (40.56) | <393.09 | 51 (35.70) |
| ≥3 | 85 (59.44) | ≥393.09 | 92 (64.30) |
| Tumor site | — | SIRI | 1.08 (0.25–17.75) |
| Left | 69 (48.25) | <1.89 | 110 (76.90) |
| Right | 74 (51.75) | ≥1.89 | 33 (23.10) |
| NLR | 2.64 (0.62–17.72) | HRR | 10.55 (4.60–14.19) |
| <2.35 | 59 (41.30) | <10.53 | 68 (47.60) |
| ≥2.35 | 84 (58.70) | ≥10.53 | 75 (52.40) |
| PLR | 132.05 (27.38–474.47) | PBR | 6700 (482–2,540,000) |
| <156.38 | 100 (69.90) | <5355 | 45 (31.50) |
| ≥156.38 | 43 (30.10) | ≥5355 | 98 (68.50) |
| MLR | 0.27 (0.096–1.67) | LBR | 56 (3.70–18,700) |
| <0.27 | 70 (49.00) | <33.58 | 26 (18.20) |
| ≥0.27 | 73 (51.00) | ≥33.58 | 117 (81.80) |
| RDW | 12.96 (11.30–20.63) | ELR | 0.047 (0.00–0.458) |
| <12.68 | 52 (36.40) | <0.01 | 21 (14.70) |
| ≥12.68 | 91 (63.60) | ≥0.01 | 122 (85.70) |
3.2. Optimal Cutoff Values for the 12 Hematological Indicators
We implemented MSRS, the optimal method for survival data for cut‐off determination. As shown in Table 3, MSRS identified statistically significant cut‐offs (permutation p < 0.05) for three indicators, including NLR, PDW, and RDW. The optimal cutoff values were 1.801, 13.900, and 12.650, respectively.
Table 3: MSRS‐derived cutoff values for the 12 hematological indicators.
| Variables | Maxstat (M) | p‐Value (condMC) | Optimal cutoff |
|---|---|---|---|
| NLR | 3.0149 | 0.045 ∗ | 1.801 |
| PLR | 2.339 | 0.211 | 160.214 |
| MLR | 2.3342 | 0.214 | 0.2701149 |
| RDW | 3.2676 | 0.012 ∗ | 12.65 |
| PDW | 2.9254 | 0.046 ∗ | 13.9 |
| RPR | 2.4012 | 0.151 | 0.0804878 |
| HRR | 1.6805 | 0.624 | 8.985507 |
| SIRI | 1.6067 | 0.702 | 1.453053 |
| SII | 1.9349 | 0.441 | 488.7349 |
| ELR | 2.8936 | 0.056 | 0.1049383 |
| LBR | 1.9844 | 0.41 | 51 |
| PBR | 1.7395 | 0.568 | 5300 |
Note: Bold indicates statistical significance.
∗Represents p < 0.05.
3.3. Prognostic Role of Hematological Parameters on Kaplan–Meier Analysis
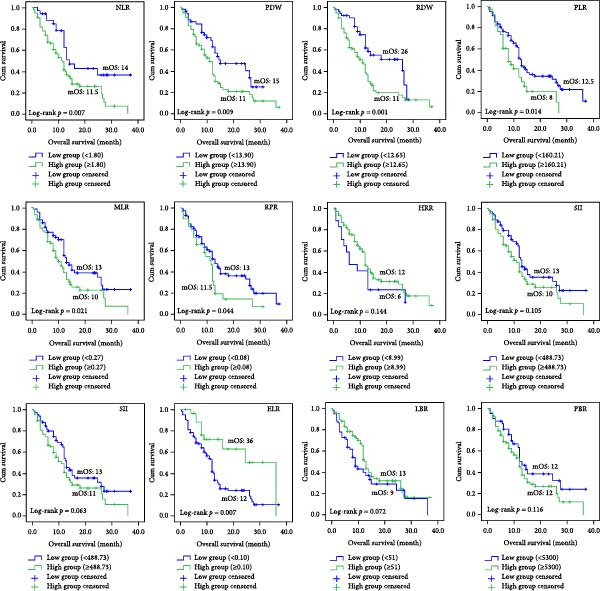
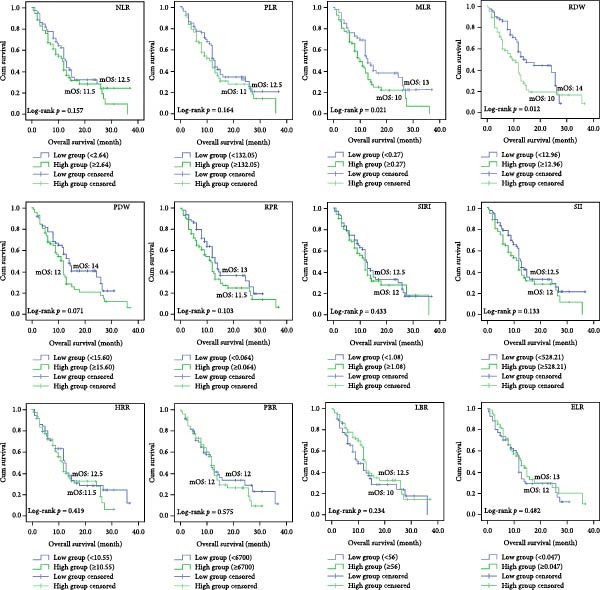
We separated the 12 indicators obtained from CBC into two groups: high group and low group, based on the best cut‐off values by MSRS (Table 3). Then we performed the Kaplan–Meier survival analyses. According to the findings, the NLR high expression group’s median OS (mOS) time was 11.5 months, whereas the NLR low expression group’s mOS time was 14 months (p = 0.007). Patients in the low RDW group had an mOS of 26 months, while those in the high group with RDW ≥ 12.650 had a lower median OS of 11 months (p = 0.001). Patients in the low PDW group had a mOS of 15 months, whereas those in the high group with PDW > 13.900 had a poorer mOS of 11 months (p = 0.009, Figure 2). For the remaining nine markers without significant MSRS cut‐offs (Table 3), we found that the PLR high expression group’s mOS time was 8 months, whereas the PLR low expression group’s mOS time was 12.5 months (p = 0.014). The MLR high expression group’s mOS time was 10 months, whereas the MLR low expression group’s mOS time was 13 months (p = 0.021). The RPR high expression group’s mOS time was 11.5 months, whereas the RPR low expression group’s mOS time was 13 months (p = 0.044). The ELR high expression group’s mOS time was 36 months, whereas the ELR low expression group’s mOS time was 12 months (p = 0.007). Finally, we performed an additional sensitivity analysis using the cohort median value as an alternative threshold (Figure 3). Consistent with our primary findings, patients with RDW and MLR above the median continued to show significantly worse OS (p = 0.012 and p = 0.021, respectively).
3.4. Effects on Outcomes of Various Clinicopathological Factors and Hematological Indicators
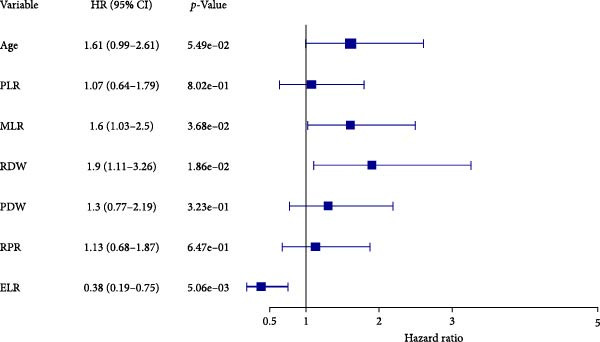
The Cox proportional hazards models were employed to assess the factors that affect mortality. The univariate analysis revealed that the following were risk factors for a poor outcome: age > 60 years (HR 1.809, 95% CI 1.169–2.799; p = 0.008), NLR > 1.801 (HR 2.04, 95% CI 1.195–3.483, p = 0.009), PLR > 160.214 (HR 1.772, 95% CI 1.124–2.794, p = 0.014), MLR > 0.270 (HR 1.625, 95% CI 1.062–2.485, p = 0.025), RDW > 12.650 (HR 2.151, 95% CI 1.323–3.496, p = 0.002), PDW > 13.900 (HR 1.846, 95% CI 1.158–2.943, p = 0.010), RPR > 0.080 (HR 1.620, 95% CI 1.011–2.598, p = 0.045) and ELR > 0.105 (HR 0.411, 95% CI 0.212–0.796, p = 0.008 (Table 4). In the subsequent stage of multivariate analysis, we included components with p‐values less than 0.05 to prevent omitting clinically possible prognostic factors. Before multivariate analysis, we conducted variance inflation factor tests avoiding collinearity. The VIF of age, NLR, PLR, MLR, RDW, PDW, RPR, and ELR were 1.029, 5.127, 2.810, 3.437, 1.226, 1.277, 1.577, and 1.167, respectively. Hence, we exclude NLR (VIF > 5) from the final multivariate model. Age and preoperative PLR, MLR, RPR, and PDW xlost independent significance in the final multivariate model. The final results showed that RDW (HR 1.905, 95% CI 1.114–3.258, p = 0.019), MLR (HR 1.603, 95% CI 1.029–2.496, p = 0.037), and ELR (HR 0.380, 95% CI 0.193–0.747, p = 0.005) were independent risk factors, which is noteworthy that ELR was a protective factor (Table 4 and Figure 4).
Table 4: Univariate and multivariate Cox proportional hazards analyses of overall survival.
| Variables | Univariate analysis | Multivariate analysis | ||||
|---|---|---|---|---|---|---|
| HR | 95% CI of HR | p‐Value | HR | 95% CI of HR | p‐Value | |
| Age > 60 years | 1.809 | 1.169–2.799 | 0.008 ∗ | 1.608 | 0.990–2.613 | 0.055 |
| Gender | 0.767 | 0.503–1.169 | 0.218 | — | — | — |
| Tumor site | 0.887 | 0.581–1.353 | 0.577 | — | — | — |
| Tumor diameter | 1.074 | 0.699–1.648 | 0.746 | — | — | — |
| NLR | 2.04 | 1.195–3.483 | 0.009 ∗ | — | — | — |
| PLR | 1.772 | 1.124–2.794 | 0.014 ∗ | 1.068 | 0.636–1.795 | 0.802 |
| MLR | 1.625 | 1.062–2.485 | 0.025 ∗ | 1.603 | 1.029–2.496 | 0.037 ∗ |
| RDW | 2.151 | 1.323–3.496 | 0.002 ∗ | 1.905 | 1.114–3.258 | 0.019 ∗ |
| PDW | 1.846 | 1.158–2.943 | 0.010 ∗ | 1.301 | 0.772–2.190 | 0.323 |
| RPR | 1.620 | 1.011–2.598 | 0.045 ∗ | 1.126 | 0.677–1.875 | 0.647 |
| SII | 1.491 | 0.974–2.282 | 0.066 | — | — | — |
| SIRI | 1.432 | 0.923–2.221 | 0.109 | — | — | — |
| HRR | 0.655 | 0.368–1.164 | 0.149 | — | — | — |
| PBR | 1.459 | 0.904–2.353 | 0.122 | — | — | — |
| LBR | 0.684 | 0.447–1.046 | 0.080 | — | — | — |
| ELR | 0.411 | 0.212–0.796 | 0.008 ∗ | 0.380 | 0.193–0.747 | 0.005 ∗ |
Note: Bold indicates statistical significance.
∗Represents p < 0.05.
3.5. Predictive Nomogram for Prognosis in Patients With GBM
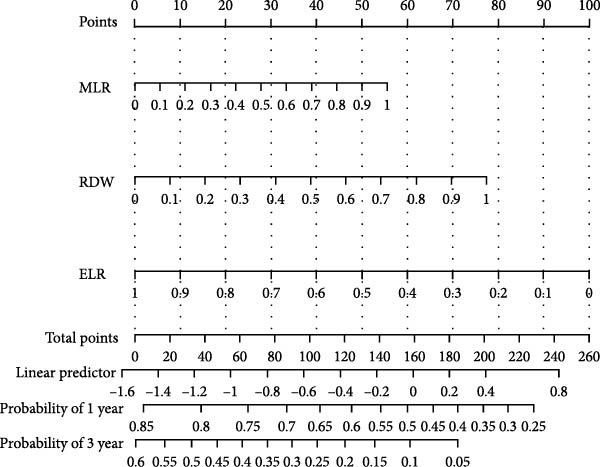
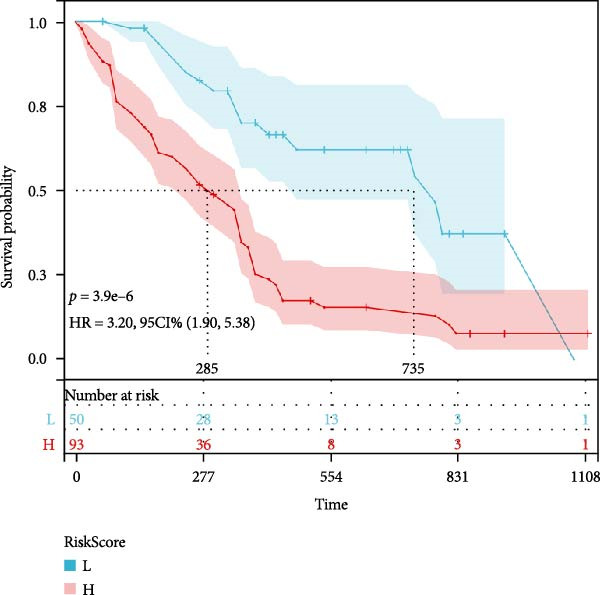
Based on three key prognostic factors—ELR, MLR, and RDW—a nomogram was developed to predict prognosis in GBM patients by integrating survival time, survival status, and these hematological parameters (Figure 5a). The nomogram demonstrated good discriminative ability, with a concordance index (C‐index) of 0.702. Kaplan–Meier survival analysis further validated the model, revealing significantly longer OS in the low‐risk group compared to the high‐risk group (p < 0.05, Figure 5b).
Figure 5Construction of the nomogram. (a) Nomogram, (b) Kaplan–Meier curves.(a)(b)
4. Discussion
RDW, MLR, and ELR were the independent prognosticators of GBM among the 12 inflammatory markers included in this investigation, while age, NLR, PLR, PDW, and RPR significantly negatively impacted patients’ OS in the Kaplan–Meier or univariate Cox regression models. Furthermore, a prognostic nomogram was developed by integrating the three identified independent factors: MLR, RDW, and ELR. Despite the stringent inclusion criteria which limited the study population to GBM patients only and precluded the incorporation of broader established risk factors (e.g., WHO grade I–IV), the nomogram maintained good discriminative ability, achieving a C‐index of 0.702.
In recent years, the immune‐inflammatory response in cellular carcinogenesis and tumor progression has been gradually investigated [ref. 26]. The host inflammatory response can induce the cellular microenvironment to produce inflammatory factors, thereby promoting tumorigenesis [ref. 27]. The tumor microenvironment can also produce inflammatory factors that regulate angiogenesis, apoptosis, and cell injury [ref. 18]. Therefore, the causal relationship between cancer and inflammation has attracted the attention of many scientists, and studies focusing on novel cancer‐associated inflammatory indicators are increasing [ref. 12]. Traditional methods for detecting inflammatory factors have some shortcomings, such as high testing costs, subjective analysis, unstable results, and are not suitable for screening high‐risk groups. As a routine test in all hospitals, CBC is a simple and inexpensive test that provides rapid detection of parameters relating to white blood cells, red blood cells, and platelets. As a sensitive reflection of immunohematologic changes, it has important clinical applications [ref. 28]. However, absolute single cell counts have poor specificity and are often influenced by various internal body environments. Therefore, most of the indicators included in this experiment are ratios of important parameters in the CBC, thus responding more accurately and comprehensively to the inflammatory response of the organism.
In our study, almost all CBC metrics that are closely associated with the diagnosis or prognosis of glioma or GBM in the existing literature were covered. NLR, PLR, and MLR, as the most reported metrics, they are valuable in the prognosis of various cancers, including glioma, especially NLR [ref. 11, ref. 29]. According to a meta‐analysis, almost 30% of the studies have demonstrated a strong correlation between the NLR and cancer patients’ OS [ref. 30]. A robust connection was observed by Weng et al. [ref. 31] between glioma grade and preoperative NLR. Consistent with these studies, our previous study found that NLR was an independent predictor of OS in glioma patients compared with PLR and MLR [ref. 11]. As CBC‐derived markers of inflammation, SII and SIRI are often thought to be highly correlated with all‐cause and cardiovascular mortality [ref. 32, ref. 33]. While both SIRI and NLR were reported to be independent prognostic markers in GBM, Model SIRI had better predictive power than Model NLR [ref. 34]. In glioma, there were inconsistent conclusions on RDW studies. RDW > 14.10% was reported by Liang et al. [ref. 35] to be a poor prognostic factor in 109 newly diagnosed GBM patients, and this assertion was subsequently supported by Kaisman‐Elbaz [ref. 36]. They found that normal Hb levels and RDW > 14% doubled postoperative survival in GBM patients (from 10.8 to 21.1 months) compared with normal Hb levels and RDW < 14%. Nevertheless, it has been argued that the immediate preoperative RDW value does not improve prognostic models in GBM by Kelly et al. [ref. 37]. These discrepancies may be due to differences in the method of determining thresholds, sample sizes, and inclusion of populations.
In addition, relatively few novel inflammatory markers RPR, PBR, LBR, ELR, and HRR have been reported in glioma or GBM. Schneider et al. [ref. 38] found that preoperative RPR can be utilized as an adjunctive prognostic predictor in GBM. According to Yang et al. [ref. 25], glioma patients with high PBR values had a worse prognosis. They also discovered that a forecast that combined PBR with a column–line graphic was accurate. Madhugiri et al. [ref. 23]. found that LBR was independently predictive of patient survival in GBM. ELR was discovered to be lower in high‐grade glioma patients than in low‐grade glioma patients by Huang et al. [ref. 24]. HRR, although not yet reported in glioma, has good predictive value in solid tumors, such as gastric [ref. 17], nasopharyngeal [ref. 39], and lung cancers [ref. 40]. Because the reported prognostic value of these important or novel inflammatory indicators in glioma or GBM varies widely, some are mutually supportive, and some are contradictory [ref. 41]. Therefore, we also included these indicators as exploratory factors in our multicenter study to further observe the value of these inflammatory indicators derived from CBC in the prognosis of GBM. Our primary analysis confirmed the prognostic value of novel ratios ELR as an independent protective factor for GBM. It may suggest that these specific cell types play a role in the GBM microenvironment. Nonetheless, as one of the first studies to report on these ratios in GBM, these findings provide a valuable reference for the field and highlight the need for further investigation in larger, independent cohorts.
Our research identifies a straightforward and trustworthy technique with clinical translational utility for predicting the prognosis of GBM patients. However, our study has some shortcomings. First, the main limitation of this study is the retrospective design, so we can’t completely exclude other situations that may affect the results, although we were very strict in the selection of patients. Second, due to the incidence of malignant brain tumors and strict inclusion and exclusion criteria, the number of patients included is not sufficient. Third, the most significant limitation of our study is the lack of comprehensive, uniformly tested MGMT promoter methylation and IDH mutation status data. These are cornerstone prognostic factors in GBM. Our inability to fully adjust for them in the primary multivariate model weakens the claim of the indicator’s complete “independence.” However, the biological rationale for the indicators reflecting systemic host factors (inflammation, nutrition) distinct from tumor‐intrinsic molecular pathways (MGMT/IDH), combined with extreme accessibility and low cost, suggests they could still offer valuable complementary or practical prognostic information, especially where molecular testing is unavailable. Future studies must prioritize concurrent evaluation of the CBC‐derived indicators and molecular markers. Prospective, multicenter, large‐scale tests are valuable for future monitoring and for in‐depth research on its molecular underpinnings. Of course, the mechanism of action between these factors and GBM also needs to be explored in depth.
5. Conclusion
12 potentially useful indicators obtained from CBC were examined in this study, and the findings demonstrated that RDW, MLR, and ELR are independent prognostic factors for GBM patients. The CBC test offers advantages of high reproducibility, widespread availability, and low cost. Consequently, it merits further investigation as it may serve, as a significant indicators of the dynamic status of GBM patients and support physicians in their decision‐making and therapy management.
Nomenclature
AUC:
Area under the curve
ELR:
Eosinophil‐to‐lymphocyte ratio
HRR:
Hemoglobin‐to‐red cell distribution width
LBR:
Lymphocyte‐to‐basophil ratio
MLR:
Monocyte‐to‐lymphocyte ratio
NLR:
Neutrophil‐to‐lymphocyte ratio
PDW:
Platelet distribution width
PBR:
Platelet‐to‐basophil ratio
PLR:
Platelet‐to‐lymphocyte ratio
RDW:
Red cell distribution width
RPR:
Red cell distribution width‐to‐platelet ratio
SII:
Systemic inflammation index
SIRI:
Systemic inflammation response index.
Ethics Statement
This study was approved by the Ethics Committee of the First People’s Hospital of Chuzhou (No. 83220464).
Consent
The authors have nothing to report
Disclosure
All authors reviewed the manuscript.
Conflicts of Interest
The authors declares no conflicts of interest.
Author Contributions
Shiqiang Hou and Chunjing Jin wrote the main manuscript text. Shiqiang Hou, Tao Yang, and Min Wang prepared figures and Tables. Qihong Gu, Yiwen Hou and Yu Pan conducted R software analysis and statistical analysis. Chunjing Jin and Ning Lin provided the revision for important intellectual content. Ning Lin provided the conception. Shiqiang Hou and Qihong Gu contributed equally to this work.
Funding
This work was supported by the Scientific Research Foundation of Education Department of Anhui Province of China (Grant 2024AH040093), the Health Research Program of Anhui (Grant AHWJ2023A30052), the Chuzhou Science and Technology Program (Grants 2024YF007 and 2023ZD032), and the Health Research Program of Chuzhou (Grant CZWJ2024A001).
References
- Glioblastoma: Clinical Presentation, Diagnosis, and Management,. BMJ. (, 2021. [DOI]
- BIRB796, an Inhibitor of p38 Mitogen-Activated Protein Kinase, Inhibits Proliferation and Invasion in Glioblastoma Cells,. ACS Omega. (, 2021. [DOI | PubMed]
- Nanobiotechnology-Based Treatment Strategies for Malignant Relapsed Glioma,. Journal of Controlled Release. (, 2023. [DOI | PubMed]
- A Simple Preoperative Blood Count to Stratify Prognosis in Isocitrate Dehydrogenase-Wildtype Glioblastoma Patients Treated With Radiotherapy Plus Concomitant and Adjuvant Temozolomide,. Cancers. (, 2021. [DOI]
- Promising Prognosis Marker Candidates on the Status of Epithelial–Mesenchymal Transition and Glioma Stem Cells in Glioblastoma,. Cells. (, 2019. [DOI]
- CD276 and the Gene Signature Composed of GATA3 and LGALS3 Enable Prognosis Prediction of Glioblastoma Multiforme,. PLoS One. (, 2019. [DOI | PubMed]
- Preoperative Albumin-to-Globulin Ratio and Prognostic Nutrition Index Predict Prognosis for Glioblastoma,. OncoTargets and Therapy. (, 2017. [DOI | PubMed]
- Prognostic Values of Combined Ratios of White Blood Cells in Glioblastoma: A Retrospective Study,. Journal of Clinical Medicine. (, 2022. [DOI]
- Inflammatory Predictors of Prognosis in Patients With Traumatic Cerebral Haemorrhage: Retrospective Study,. Journal of Clinical Medicine. (, 2022. [DOI]
- Prognostic Significance of Preoperative Systemic Cellular Inflammatory Markers in Gliomas: A Systematic Review and Meta-Analysis,. Clinical and Translational Science. (, 2020. [DOI | PubMed]
- Preoperative Hematologic Inflammatory Markers as Prognostic Factors in Patients With Glioma,. World Neurosurgery. (, 2018. [DOI | PubMed]
- The Red Distribution Width and the Platelet Distribution Width as Prognostic Predictors in Gastric Cancer,. BMC Gastroenterology. (, 2017. [DOI]
- The Predictive Value of Inflammation-Related Peripheral Blood Measurements in Cancer Staging and Prognosis,. Frontiers in Oncology. (, 2018. [DOI]
- Role of Neutrophil-Lymphocyte Ratio as a Predictive Factor of Glioma Tumor Grade: A Systematic Review,. Critical Reviews in Oncology/Hematology. (, 2021. [DOI | PubMed]
- Systemic Inflammatory Indicators as Prognosticators in Glioblastoma Patients: A Comprehensive Meta-Analysis,. Frontiers in Neurology. (, 2020. [DOI | PubMed]
- Preoperative Neutrophil to Lymphocyte Ratio and Platelet to Lymphocyte Ratio are Associated With the Prognosis of Group 3 and Group 4 Medulloblastoma,. Scientific Reports. (, 2019. [DOI | PubMed]
- The Ratio of Hemoglobin to Red Cell Distribution Width Predicts Survival in Patients With Gastric Cancer Treated by Neoadjuvant FLOT: A Retrospective Study,. Irish Journal of Medical Sciences. (, 2020. [DOI]
- Association of Preoperative Levels of Selected Blood Inflammatory Markers With Prognosis in Gliomas,. OncoTargets and Therapy. (, 2016. [DOI | PubMed]
- Red Blood Cell Distribution Width: A Simple Parameter With Multiple Clinical Applications,. Critical Reviews in Clinical Laboratory Sciences. (, 2015. [DOI | PubMed]
- Prognostic Significance of the Combination of Preoperative Red Cell Distribution Width and Platelet Distribution Width in Patients With Gastric Cancer,. BMC Cancer. (, 2021. [DOI]
- Prognostic Value of Preoperative Hematological Markers in Patients With Glioblastoma Multiforme and Construction of Random Survival Forest Model,. BMC Cancer. (, 2023. [DOI]
- The Prognostic Value of the Preoperative Inflammatory Index on the Survival of Glioblastoma Patients,. Neurological Sciences. (, 2022. [DOI | PubMed]
- An Analysis of Eosinophil- and Basophil-Based Indices in Patients With Glioblastoma and Their Correlation With Survival,. World Neurosurgery. (, 2023. [DOI | PubMed]
- Eosinophils and Other Peripheral Blood Biomarkers in Glioma Grading: A Preliminary Study,. BMC Neurology. (, 2019. [DOI]
- Prognostic Value of Platelet-to-Basophil Ratio (PBR) in Patients With Primary Glioblastoma,. Medicine. (, 2023. [DOI | PubMed]
- Preoperative Platelet Distribution Width-to-Platelet Count Ratio as a Prognostic Factor in Patients With Glioblastoma Multiforme,. The British Journal of Neurosurgery. (, 2024. [DOI | PubMed]
- Inflammation and Cancer: Triggers, Mechanisms, and Consequences,. Immunity. (, 2019. [DOI | PubMed]
- Inflammation-Related Biomarkers for the Prediction of Prognosis in Colorectal Cancer Patients,. International Journal of Molecular Sciences. (, 2021. [DOI]
- Neutrophil/Lymphocyte Ratio is an Independent Prognostic Factor in Elderly Patients With High-Grade Gliomas,. World Neurosurgery. (, 2019. [DOI | PubMed]
- Neutrophil to Lymphocyte Ratio and Cancer Prognosis: An Umbrella Review of Systematic Reviews and Meta-Analyses of Observational Studies,. BMC Medicine. (, 2020. [DOI]
- Preoperative Neutrophil-Lymphocyte Ratio Correlated With Glioma Grading and Glioblastoma Survival,. Neurological Research. (, 2018. [DOI | PubMed]
- Association of Systemic Immune Inflammatory Index With All-Cause and Cause-Specific Mortality in Hypertensive Individuals: Results From NHANES,. Frontiers in Immunology. (, 2023. [PubMed]
- Systemic Immune Inflammation Index (SII), System Inflammation Response Index (SIRI) and Risk of All-Cause Mortality and Cardiovascular Mortality: A 20-Year Follow-up Cohort Study of 42,875 US Adults,. Journal of Clinical Medicine. (, 2023. [DOI]
- Prognostic Significance of Preoperative Systemic Inflammation Response Index in Newly Diagnosed Glioblastoma Patients Underwent Gross Total Resection: A Propensity Score Matching Analysis,. World Journal of Surgical Oncology. (, 2022. [DOI]
- Significance of Pretreatment Red Blood Cell Distribution Width in Patients With Newly Diagnosed Glioblastoma,. Medical Science Monitor. (, 2017. [DOI | PubMed]
- Hemoglobin Levels and Red Blood Cells Distribution Width Highlights Glioblastoma Patients Subgroup With Improved Median Overall Survival,. Frontiers in Oncology. (, 2020. [DOI]
- Red Blood Cell Distribution Width in Glioblastoma,. Clinical Neurology and Neurosurgery. (, 2022. [DOI | PubMed]
- Red Blood Cell Distribution Width to Platelet Ratio Substantiates Preoperative Survival Prediction in Patients With Newly-Diagnosed Glioblastoma,. The Journal of Neuro-Oncology. (, 2021. [DOI | PubMed]
- The Value of Hemoglobin-to-Red Blood Cell Distribution Width Ratio (Hb/RDW), Neutrophil-to-Lymphocyte Ratio (NLR), and Platelet-to-Lymphocyte Ratio (PLR) for the Diagnosis of Nasopharyngeal Cancer,. Medicine. (, 2021. [DOI | PubMed]
- A Prognostic Parameter in Advanced Non-Small Cell Lung Cancer: The Ratio of Hemoglobin-to-Red Cell Distribution Width,. International Journal of Clinical Oncology. (, 2019. [DOI | PubMed]
- The Effect of Indicators of Systemic Inflammatory Response on Survival in Glioblastoma Multiforme,. Turkish Neurosurgery. (, 2020. [DOI | PubMed]