
Effect of Gamma Irradiation on Cannabinoid, Terpene, and Moisture Content of Cannabis Biomass
Abstract
In recent years, cannabis has been proposed and promoted not only as a medicine for the treatment of a variety of illnesses, but also as an industrial crop for different purposes. Being an agricultural product, cannabis inflorescences may be contaminated by environmental pathogens at high concentrations, which might cause health problems if not controlled. Therefore, limits have to be placed on the levels of aerobic bacteria as well as yeast and mold. To ensure the safety of cannabis plant material and related products, a remediation process has to be put in place. Gamma irradiation is a sterilization process mainly used for pharmaceuticals, foods, cosmetics, agricultural, and herbal products including cannabis plant material. This study was designed to determine the effect of irradiation on the microbial count as well as on the chemical and physical profiles of the cannabis biomass, particularly cannabinoids, terpenes, and moisture content. The full cannabinoid profile was measured by GC/FID and HPLC analysis, while terpene profile and moisture content were determined using GC/MS and Loss on Drying (LoD) methods, respectively. Analyses were conducted on the samples before and after gamma irradiation. The results showed that the minimum and maximum doses were 15 and 20.8 KiloGray (KGY), respectively. Total Aerobic Microbial Count (TAMC) and Total Yeast and Mold Count (TYMC) were determined. The study showed that irradiation has no effect on the cannabinoids and little effect on terpenes and moisture content, but it did result in the virtual sterilization of the plant material, as evidenced by the low levels of bacterial and fungal colony-forming units (CFUs) < 10 after gamma irradiation.
Article type: Research Article
Keywords: cannabis, gamma irradiation, cannabinoids, terpenes, moisture content
Affiliations: National Center for Natural Products Research, School of Pharmacy, University of Mississippi, University, MS 38677, USA; cgon@olemiss.edu (C.G.M.); melsohly@olemiss.edu (M.A.E.); eibrahim@olemiss.edu (E.A.I.); suman@olemiss.edu (S.C.); aswanas@olemiss.edu (A.S.W.); Department of Pharmaceutics and Drug Delivery, School of Pharmacy, University of Mississippi, University, MS 38677, USA; Department of Pharmaceutical Analytical Chemistry, Faculty of Pharmacy, Suez Canal University, Ismailia 41522, Egypt; Department of Chemistry and Biochemistry, University of Mississippi, University, MS 38677, USA; maelhend@olemiss.edu; Department of Agriculture Biotechnology, Faculty of Agriculture, Damietta University, Damietta 34511, Egypt
License: © 2023 by the authors. CC BY 4.0 Licensee MDPI, Basel, Switzerland. This article is an open access article distributed under the terms and conditions of the Creative Commons Attribution (CC BY) license (https://creativecommons.org/licenses/by/4.0/).
Article links: DOI: 10.3390/molecules28237710 | PubMed: 38067441 | PMC: PMC10707833
Relevance: Moderate: mentioned 3+ times in text
Full text: PDF (1.5 MB)
1. Introduction
Cannabis (Cannabis sativa L.) is an annual flowering plant indigenous to Central Asia and has a rich and a fascinating recorded history [ref. 1]. Cannabis has played a significant role in many cultures for recreational and medicinal purposes and as a source of industrial fibers [ref. 2].
The dried resinous flowering buds of the cannabis plant are commonly known as “marijuana” [ref. 3].
In recent years, research on hemp has been progressively growing due to its use in various products, such as composites, plastics, and lubricants. Hemp has been used to produce textiles and fiber, in building materials like hempcrete and as a source of biofuel. Furthermore, hemp seeds can serve as a rich source of nutrition in different food products [ref. 4,ref. 5,ref. 6,ref. 7,ref. 8,ref. 9].
Cannabis contains hundreds of secondary metabolites, mainly cannabinoids, in addition to phenolic compounds, mono- and sesquiterpenoids, flavonoids, and alkaloids [ref. 10]. The unique chemicals (cannabinoids) include different types and concentrations, particularly THC, which is the main psychotropic cannabinoid and is responsible for the plant’s mind-altering effects [ref. 11]. Other cannabinoids including cannabidiol (CBD), cannabigerol (CBG), cannabichromene (CBC), and other minor compounds have comparable therapeutic benefits to THC without its side effects, as these cannabinoids could be used in the treatment of glaucoma, chronic musculoskeletal pain, spasm, nausea, spasticity of multiple sclerosis, and many others [ref. 12,ref. 13,ref. 14]. Cannabis can be divided into three main chemotypes, namely THC-dominant (type I), THC/CBD intermediate (type II), and CBD-dominant (type III) [ref. 15].
As an agricultural product, cannabis can be exposed to contamination with pathogenic fungi, bacteria, yeast, and mold during growing, drying, packing, and/or delivery, which may put consumers at health risk [ref. 16,ref. 17]. Fatal pulmonary Aspergillosis has been reported in some immunocompromised patients treated with inhaled marijuana [ref. 18,ref. 19]. Also, multistate outbreak enteritis caused by Salmonella muenchen has been reported [ref. 20]. Furthermore, Clostridium botulinum has been identified in some cannabis extracts [ref. 21].
Since cannabis legalization has progressed dramatically in recent years, and several cannabis-based products are now flooding the US market, contaminated cannabis may be found among these products, rendering them unsafe for consumers [ref. 22].
Although the federal government in the United States still considers cannabis illegal [ref. 23], nineteen U.S. states have legalized marijuana for recreational use [ref. 24]. Furthermore, a total of 37 states, three territories, and the District of Columbia allow cannabis products to be used medically [ref. 25].
Recently, the United States Food and Drug Administration (FDA) published guidance on cannabis and cannabis-derived products in which it is recommended that these products should be regulated by the same standards as any other botanical raw material, botanical drug substance, or botanical drug product [ref. 26]. In addition, many states provide their own guidelines to protect cannabis consumers for either medicinal, recreational, or both purposes [ref. 27]. Consequently, cannabis and cannabis-based products have to be free from contaminants—pesticides, microbes, molds, bacteria, heavy metals, and solvents—to protect the safety of cannabis consumers.
Several approved technologies are commonly used to reduce microbial contamination in foods and pharmaceutical products, including ethylene oxide gas, gamma irradiation, and X-ray irradiation [ref. 28]. Gamma irradiation remains the recommended method for decontaminating herbal products including cannabis [ref. 29]. However, in addition to gamma irradiation, other sterilization methods have been employed in the decontamination of medical cannabis such as beta irradiation (e-beam) and cold plasma [ref. 30].
Gamma irradiation is a form of electromagnetic energy that kills microorganisms throughout a product and its packaging. This technology, which offers deep penetration at low dose rates, was chosen as the most suitable for treating the multiple lots of National Institute on Drug Abuse (NIDA) and Drug Supply Program (DSP) plant material, as each lot varies somewhat in density and quantity. This treatment has little temperature effect on the product [ref. 31,ref. 32]. A given dose of gamma radiation takes time to deliver and, depending on the thickness and volume of the product, it may take minutes to hours [ref. 33]. The dose of gamma irradiation delivered to a packaged product unit is expressed in Kilo gray (KGY), the standard unit of measurement of ionizing radiation [ref. 28]. The irradiation process has been used commercially for more than forty years. To be effective, gamma irradiation needs time, contact, and temperature. The effectiveness of gamma irradiation is also dependent on the type of microorganism present [ref. 32]. Irradiation helps to reduce post-harvest losses through suppressing sprouting and contamination and enabling the eradication or control of insect pests, reductions in food-borne diseases, and the extension of shelf lives [ref. 34,ref. 35].
Gamma irradiation is used in the cannabis industry to develop biomass and products that are safe to consumers. With cannabis containing various types of bioactive phytochemicals including cannabinoids and terpenes (plus others) [ref. 36], it is important to ascertain the effect of gamma irradiation on these constituents.
According to the United States Pharmacopeia (USP), methods and specifications for the absence of Salmonella spp. and Escherichia coli are included in general chapter <62>, Microbiological Examination of Nonsterile Products. Meanwhile, the USP general chapter <61> includes the methods for enumerating total aerobic bacterial count and the total yeasts and molds count [ref. 37]. The Cannabis Expert Panel recommended specifications for the microbial quality control of cannabis plant material. The total aerobic bacterial count should be NMT 105 CFU/g, and the total combined mold and yeast count should be NMT 104 CFU/g, in addition to the absence of Salmonella spp. and Escherichia coli [ref. 38].
In this work, we aimed to determine the effect of irradiation on the microbial content (bacterial and fungal) and on the chemical and physical profile of the cannabis biomass, particularly the cannabinoids content, terpenes, and moisture content. Moreover, this study explores the effects of gamma irradiation on cannabis biomass, as this specific aspect of gamma irradiation’s effect on the major cannabinoids and terpenes may not have been extensively studied before compared to the previously published studies. Furthermore, testing the impact of gamma irradiation on moisture content in cannabis biomass may give an idea of the storage conditions of cannabis products, which represents an important area for the cannabis industry.
2. Results and Discussion
More than 2000 kg of cannabis plant material in 150 barrels was subjected to gamma irradiation to lower its microbial burden since these plant materials can be used in human clinical trials that might include immunocompromised subjects. All dosimetry results were in the range of 15.0 to 20.8 KGY (target range 10 to 30 KGY).
2.1. Microbial Decontamination Test Results
The microbial loads of three samples of cannabis plant material before and after gamma irradiation are displayed in Table 1. The Total Yeast and Mold Count (TYMC) was reduced from 13,000, 10,050, and 4500 CFU/g to less than 100 CFU/g, and the bacterial load (Total Aerobic Microbial Count (TAMC)) was also significantly reduced to less than 100 CFU/g by the gamma irradiation treatment. Although neither E. coli nor Salmonella spp. were detected in any lot before or after the irradiation treatment, these tests were included in the study because these tests are common in cannabis quality testing protocols.
Table 1: Microbial test results, before and after irradiation treatment for three representative samples expressed as CFU/g.
| TYMC (CFU/g) | TAMC (CFU/g) | E. coli and Salmonella spp. | ||||
|---|---|---|---|---|---|---|
| Sample # | Before Irradiation | After Irradiation | Before Irradiation | After Irradiation | Before Irradiation | After Irradiation |
| CS-464 | 13,000 | <10 * | 1000 | No growth | Absent/g | Absent/g |
| CS-481 | 10,050 | <100 * | 4100 | <100 | Absent/g | Absent/g |
| CS-483 | 4500 | <100 * | 3950 | <100 | Absent/g | Absent/g |
CFU/g = colony-forming unit per gram. * Significant (p < 0.05). TYMC = Total Yeast and Mold Count. TAMC = Total Aerobic Microbial Count. # = number.
2.2. Cannabinoid Acid Content
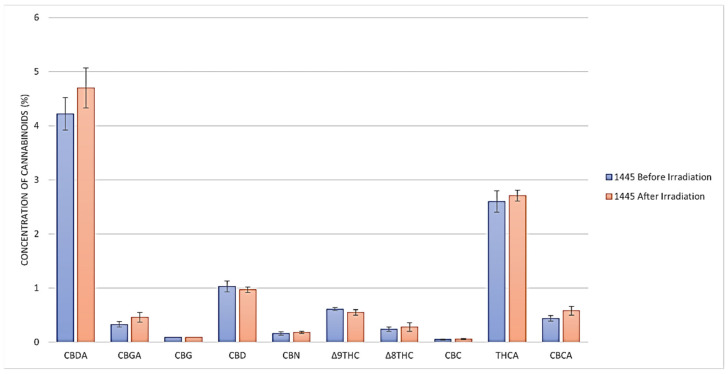
The concentrations of eleven cannabinoids (neutral and acid) including Δ9-THC, Δ9-THCA, CBD, CBDA, CBG, CBGA, Δ8-THC, CBN, CBC, CBCA, and THCV as % w/w were determined using our previously reported HPLC method [ref. 39].
The cannabinoid content before and after the gamma irradiation treatment of a representative sample (#CS-445) is illustrated in Figure 1. No significant change (p > 0.05) in any of the cannabinoid concentrations was evident in any of the materials before and after irradiation. Δ8-THC was not detected before and after the irradiation of the THC/CBD cannabis chemovar.
2.3. Total Cannabinoid Content
The results in Figure 2 and Table 2 show the THC and CBD concentrations for various cannabis batches of all three chemovars (high THC, high CBD, and THC/CBD chemovars), before and after the irradiation treatment. The total cannabinoid content was determined using our previously published method [ref. 40].
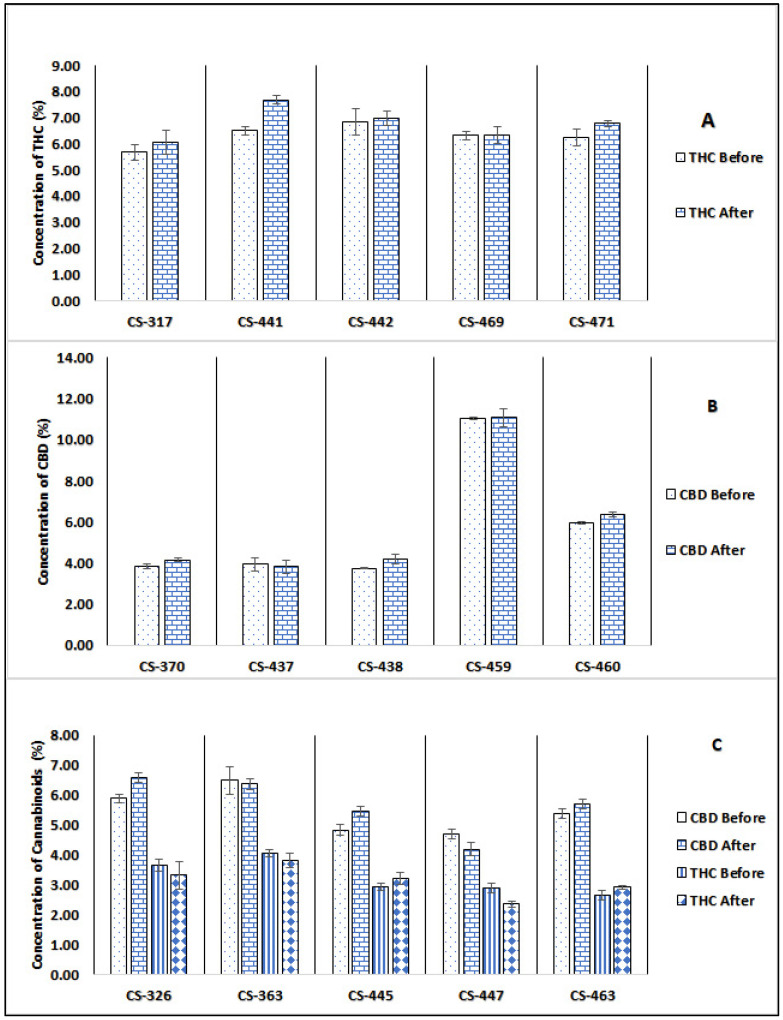
Table 2: Cannabinoid and moisture content (%w/w) of different cannabis chemovars after and before gamma irradiation (analyzed by GC/FID).
| Sample # | Variety | CBD * | Δ9-THC * | CBN | THCV | CBC | CBG | Moisture Content | |||||||
|---|---|---|---|---|---|---|---|---|---|---|---|---|---|---|---|
| B | A | B | A | B | A | B | A | B | A | B | A | B | A | ||
| CS-326 | THC/CBD Chemovar | 5.97 ± 0.13 | 6.42 ± 0.16 | 3.64 ± 0.20 | 3.85 ± 0.45 | 0.29 | 0.33 | 0.04 | 0.04 | 0.28 | 0.31 | 0.36 | 0.40 | 7.73 | 8.03 |
| CS-363 | 6.57 ± 0.45 | 6.49 ± 0.19 | 3.95 ± 0.11 | 3.85 ± 0.25 | 0.26 | 0.28 | 0.03 | 0.03 | 0.31 | 0.31 | 0.28 | 0.28 | 7.93 | 7.90 | |
| CS-445 | 4.65 ± 0.16 | 5.23 ± 0.16 | 2.82 ± 0.12 | 3.07 ± 0.20 | 0.24 | 0.23 | 0.03 | 0.03 | 0.25 | 0.21 | 0.29 | 0.25 | 8.05 | 8.22 | |
| CS-447 | 4.54 ± 0.16 | 3.96 ± 0.23 | 2.67 ± 0.18 | 2.27 ± 0.10 | 0.20 | 0.19 | ND | ND | 0.21 | 0.18 | 0.21 | 0.18 | 8.28 | 8.37 | |
| CS-463 | 5.32 ± 0.17 | 5.73 ± 0.16 | 2.73 ± 0.17 | 2.85 ± 0.06 | 0.37 | 0.43 | ND | ND | 0.23 | 0.25 | 0.22 | 0.24 | 8.1 | 8.23 | |
| CS-464 | 4.61 ± 0.27 | 5.03 ± 0.01 | 2.38 ± 0.10 | 2.48 ± 0.27 | 0.34 | 0.43 | ND | ND | 0.18 | 0.26 | 0.31 | 0.28 | 8.01 | 7.65 | |
| CS-465 | 4.75 ± 0.17 | 4.13 ± 0.08 | 1.97 ± 0.12 | 1.60 ± 0.10 | 0.40 | 0.35 | ND | ND | 0.20 | 0.18 | 0.21 | 0.18 | 8.14 | 8.47 | |
| CS-466 | 3.58 ± 0.15 | 4.12 ± 0.09 | 1.73 ± 0.15 | 1.94 ± 0.14 | 0.22 | 0.27 | ND | ND | 0.17 | 0.14 | 0.27 | 0.25 | 8.45 | 8.55 | |
| CS-467 | 3.43 ± 0.17 | 3.77 ± 0.08 | 1.25 ± 0.18 | 1.39 ± 0.11 | 0.25 | 0.28 | ND | ND | 0.16 | 0.13 | 0.11 | 0.11 | 8.18 | 8.10 | |
| CS-370 | High CBD Chemovar | 3.79 ± 0.12 | 4.06 ± 0.10 | 0.10 ± 0.08 | 0.11 ± 0.07 | ND | ND | ND | ND | 0.12 | 0.13 | 0.07 | 0.08 | 7.82 | 8.11 |
| CS-437 | 3.86 ± 0.32 | 3.75 ± 0.30 | 0.18 ± 0.12 | 0.16 ± 0.09 | 0.02 | 0.01 | ND | ND | 0.14 | 0.16 | 0.14 | 0.16 | 8.66 | 8.35 | |
| CS-438 | 3.70 ± 0.04 | 4.00 ± 0.22 | 0.12 ± 0.10 | 0.12 ± 0.03 | 0.07 | 0.08 | ND | ND | 0.14 | 0.14 | 0.07 | 0.08 | 8.94 | 8.27 | |
| CS-459 | 10.96 ± 0.06 | 11.14 ± 0.45 | 0.39 ± 0.14 | 0.36 ± 0.03 | 0.06 | 0.05 | 0.03 | 0.03 | 0.36 | 0.36 | 0.32 | 0.29 | 8.04 | 8.12 | |
| CS-460 | 5.89 ± 0.05 | 6.22 ± 0.12 | 0.20 ± 0.15 | 0.18 ± 0.08 | ND | ND | ND | ND | 0.21 | 0.25 | 0.15 | 0.16 | 7.77 | 7.90 | |
| CS-461 | 5.74 ± 0.12 | 5.71 ± 0.05 | 0.16 ± 0.11 | 0.15 ± 0.04 | ND | ND | ND | ND | 0.20 | 0.20 | 0.12 | 0.12 | 7.75 | 8.05 | |
| CS-468 | 3.00 ± 0.12 | 3.17 ± 0.02 | 0.86 ± 0.16 | 0.87 ± 0.07 | 0.20 | 0.21 | ND | ND | 0.11 | 0.12 | 0.11 | 0.11 | 8.61 | 9.34 | |
| CS-481 | 4.70 ± 0.11 | 5.49 ± 0.07 | 0.35 ± 0.17 | 0.37 ± 0.08 | 0.03 | 0.03 | 0.01 | 0.01 | 0.24 | 0.27 | 0.12 | 0.14 | 8.00 | 8.16 | |
| CS-483 | 5.26 ± 0.13 | 5.44 ± 0.04 | 0.10 ± 0.08 | 0.10 ± 0.02 | 0.14 | 0.16 | 0.01 | 0.01 | 0.31 | 0.30 | 0.25 | 0.24 | 6.41 | 6.40 | |
| CS-506 | 4.50 ± 0.08 | 4.37 ± 0.02 | 0.20 ± 0.11 | 0.20 ± 0.01 | 0.03 | 0.04 | 0.01 | 0.01 | 0.30 | 0.24 | 0.09 | 0.08 | 5.64 | 6.28 | |
| CS-317 | High THC Chemovar | 0.09 ± 0.01 | ND | 5.61 ± 0.30 | 6.08 ± 0.44 | 0.16 | 0.23 | 0.04 | 0.04 | 0.10 | 0.10 | 0.08 | 0.10 | 10.47 | 10.18 |
| CS-441 | 0.15 ± 0.04 | 0.16 ± 0.08 | 6.49 ± 0.16 | 7.52 ± 0.16 | 0.52 | 0.54 | 0.04 | 0.05 | 0.31 | 0.33 | 0.16 | 0.18 | 8.74 | 8.26 | |
| CS-442 | 0.06 ± 0.01 | 0.06 ± 0.01 | 6.58 ± 0.50 | 7.02 ± 0.28 | 0.53 | 0.64 | 0.07 | 0.07 | 0.28 | 0.32 | 0.13 | 0.19 | 7.28 | 7.65 | |
| CS-469 | ND | ND | 6.54 ± 0.18 | 6.60 ± 0.31 | 0.66 | 0.60 | 0.09 | 0.07 | 0.20 | 0.19 | 0.21 | 0.23 | 8.43 | 8.65 | |
| CS-471 | ND | ND | 6.12 ± 0.34 | 6.62 ± 0.12 | 0.54 | 0.57 | 0.05 | 0.04 | 0.19 | 0.16 | 0.18 | 0.17 | 7.44 | 8.14 | |
| CS-472 | ND | ND | 7.39 ± 0.10 | 5.97 ± 0.02 | 0.70 | 0.66 | 0.05 | 0.04 | 0.26 | 0.23 | 0.28 | 0.23 | 8.51 | 8.04 | |
| CS-473 | ND | ND | 5.49 ± 0.04 | 5.45 ± 0.12 | 0.52 | 0.58 | 0.04 | 0.04 | 0.22 | 0.19 | 0.16 | 0.16 | 7.97 | 7.95 | |
| CS-474 | ND | ND | 4.97 ± 0.05 | 5.24 ± 0.02 | 0.49 | 0.58 | 0.03 | 0.03 | 0.18 | 0.19 | 0.14 | 0.15 | 7.92 | 8.13 | |
| CS-475 | ND | ND | 5.78 ± 0.15 | 5.87 ± 0.09 | 0.50 | 0.55 | 0.04 | 0.04 | 0.21 | 0.20 | 0.17 | 0.18 | 8.44 | 8.01 | |
| CS-476 | ND | ND | 3.40 ± 0.18 | 3.91 ± 0.05 | 0.46 | 0.44 | ND | ND | 0.16 | 0.18 | 0.11 | 0.13 | 7.32 | 7.30 | |
| CS-477 | ND | ND | 6.01 ± 0.13 | 5.22 ± 0.10 | 0.57 | 0.55 | 0.05 | 0.04 | 0.22 | 0.19 | 0.18 | 0.16 | 7.9 | 7.52 | |
| CS-478 | ND | ND | 2.42 ± 0.07 | 2.63 ± 0.15 | 0.27 | 0.31 | ND | ND | 0.15 | 0.15 | 0.06 | 0.07 | 7.56 | 7.87 | |
| CS-479 | ND | ND | 2.22 ± 0.06 | 2.50 ± 0.09 | 0.28 | 0.35 | ND | ND | 0.16 | 0.19 | 0.06 | 0.06 | 7.85 | 7.85 | |
| CS-480 | 0.05 ± 0.01 | 0.05 ± 0.04 | 1.44 ± 0.14 | 1.32 ± 0.03 | 0.44 | 0.39 | 0.04 | 0.04 | 0.13 | 0.15 | 0.04 | 0.04 | 7.58 | 7.81 | |
# = number. B = before irradiation, A = after irradiation, ND = not detected, Δ8-THC was not detected in any sample. * Concentration % w/w ± standard error.
As demonstrated in Table 3, a paired t-test was employed to assess the variations in total cannabinoid concentrations within the samples before and after irradiation. The results indicate that there were no statistically significant changes, as all calculated p-values exceeded the 0.05 significance threshold (Table 3).
Table 3: Paired sample t-test of total cannabinoids in cannabis samples analyzed by GC/FID.
| Before Irradiation | After Irradiation | t | df | p-Value |
|---|---|---|---|---|
| CS-326B | CS-326A | −2.354 | 6 | 0.057 |
| CS-363B | CS-363A | 1.571 | 6 | 0.167 |
| CS-445B | CS-445A | −1.506 | 6 | 0.183 |
| CS-447B | CS-447A | 1.475 | 5 | 0.200 |
| CS-463B | CS-463A | −2.116 | 5 | 0.088 |
| CS-464B | CS-464A | −0.487 | 5 | 0.647 |
| CS-465B | CS-465A | 0.946 | 5 | 0.388 |
| CS-466B | CS-466A | −1.621 | 5 | 0.166 |
| CS-467B | CS-467A | −1.069 | 5 | 0.334 |
| CS-370B | CS-370A | −1.782 | 4 | 0.149 |
| CS-437B | CS-437A | 1.286 | 4 | 0.268 |
| CS-438B | CS-438A | 0.444 | 5 | 0.676 |
| CS-459B | CS-459A | −0.933 | 6 | 0.387 |
| CS-460B | CS-460A | −1.551 | 4 | 0.196 |
| CS-461B | CS-461A | −0.835 | 4 | 0.450 |
| CS-468B | CS-468A | −1.313 | 5 | 0.246 |
| CS-481B | CS-481A | −1.332 | 6 | 0.231 |
| CS-483B | CS-483A | −0.925 | 6 | 0.391 |
| CS-506B | CS-506A | −0.658 | 6 | 0.535 |
| CS-317B | CS-317A | −0.451 | 5 | 0.671 |
| CS-441B | CS-441A | −0.525 | 6 | 0.619 |
| CS-442B | CS-442A | −2.116 | 6 | 0.079 |
| CS-469B | CS-469A | −0.865 | 5 | 0.427 |
| CS-471B | CS-471A | −1.508 | 5 | 0.192 |
| CS-472B | CS-472A | 1.475 | 5 | 0.200 |
| CS-473B | CS-473A | 0.344 | 5 | 0.745 |
| CS-474B | CS-474A | −2.076 | 5 | 0.092 |
| CS-475B | CS-475A | 0.621 | 5 | 0.562 |
| CS-476B | CS-476A | −0.996 | 4 | 0.376 |
| CS-477B | CS-477A | 1.598 | 5 | 0.171 |
| CS-478B | CS-478A | −1.838 | 4 | 0.140 |
| CS-479B | CS-479A | −1.445 | 4 | 0.222 |
| CS-480B | CS-480A | −0.281 | 6 | 0.788 |
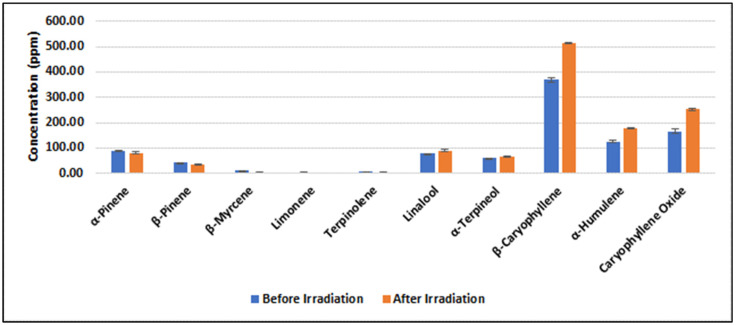
2.4. Terpene Content
The quantitative analysis of terpenes was performed by GC/MS [ref. 41]. For a representative sample (#CS173, Figure 3), a paired t-test was utilized to evaluate the changes in terpene concentrations before and after irradiation. The analysis shows a p-value of 0.13, indicating that no statistically significant alteration in terpene concentration was observed within the sample, confirming the results of a previous study [ref. 29]. All samples were analyzed in triplicate.
2.5. Moisture Content
Among measurement standards for foodstuffs and agricultural products, Loss on Drying continues to be the most widely used method for moisture content [ref. 38]. The technical simplicity of the technique probably accounts for its popularity [ref. 38]. The results of moisture content are illustrated in Table 2.
The moisture content was calculated from the following equation:
where Mb and Ma are the mass of the sample before and after drying, respectively. The difference denotes the moisture content of the sample. From the results, no significant change (p > 0.05) in the moisture content of any of the samples was observed due to the irradiation treatment (Table 3).
3. Materials and Methods
3.1. Cannabis Plant Material
Cannabis plants were grown in the field at the University of Mississippi, United States of America. Female cuttings of screened and selected high-yielding chemovars (high THC, THC/CBD, and high CBD) were grown indoors in four-inch biodegradable jiffy pots. Well-rooted cuttings were then transferred to an outdoor field for further growth. At maturity, plants were harvested, dried (for 24 h at 40 °C in a ventilated oven), processed, and stored in FDA-approved barrels. These barrels were stored at 25 °C for future use. Samples were taken from each barrel and ground in a stainless-steel coffee grinder and used for subsequent analyses.
3.2. Gamma Irradiation Treatment Procedures
Sterigenics is a contract sterilization company that operates a gamma irradiation facility located in West Memphis, Arkansas, 145 km from the National Center of Natural Products Research (NCNPR), at the University of Mississippi. The facility normally operates continuously, receiving commercial products in large shipments trucked to the facility for treatment. The Drug Enforcement Agency (DEA) Schedule-I control status of most of the DSP materials required special handling and security measures for the treatment, including authorizations by DEA, the National Institute on Drug Abuse (NIDA), and the Arkansas State Board of Pharmacy. The materials were transported in a cargo truck with security escorts.
The Sterigenics facility uses a hanging tote irradiator system with eighteen Cobalt-60 source stations. Each tote can accommodate products in packages of up to 30′ × 24′ × 40′ dimensions and 23 kg in weight. To prepare the packaged materials to fit the totes, the polyethylene bags containing the plant material were transferred to appropriate-size cardboard boxes before transportation to the facility. At the facility, a dosimeter was attached to each box which was then loaded onto a tote. The totes were carried by a conveyor system through a radiation shield into the irradiation chamber where they passed by the source stations following a serpentine route to expose all sides of the boxes to the gamma rays. The target dose for each box was specified to be in the range of 10 to 30 KGY based on recommendations by Sterigenics specialists. When the totes carrying the boxes exited the irradiation chamber after several hours of treatment, each dosimeter was read to verify that each box had received the specified dose.
3.2.1. NIDA DSP Materials Currently Treated
As of August 2020, all the DSP plant material supplies stocked at NCNPR have undergone gamma irradiation treatment. A total of 2016 kg of plant material in 150 different barrel lots was treated on three different occasions.
3.2.2. Microbial Contamination
Microbial testing was performed in duplicate following USP <61> and <62> procedures for Total Yeast and Mold Count (TYMC), Total Aerobic Microbial Count (TAMC), E. coli, and Salmonella spp. [ref. 38].
3.2.3. Treatment Study
In order to measure the effect of gamma irradiation treatment on the chemical and physical characteristics of cannabis plant material, thirty-three barrel lots of the three cannabis chemovars were analyzed at NCNPR before and after the treatment for cannabinoids, terpenes, and moisture content. In order to verify the effectiveness of the treatment in reducing microbial contaminants, three barrel lots were tested for microbes before and after the treatment.
3.2.4. Dose Verification
A scintillation counter was used to measure the exposure of each dosimeter to verify that each box had received the specified dose.
3.3. Cannabinoid and Terpene Standards
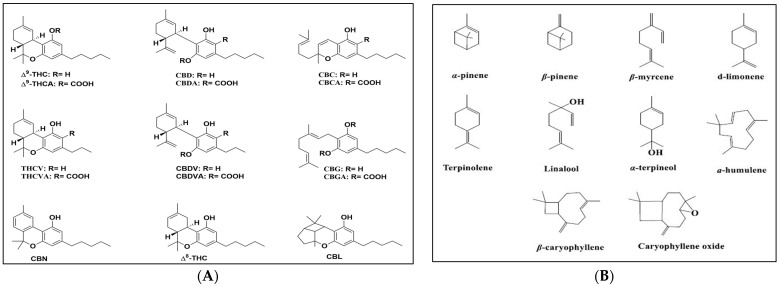
Cannabidiol (CBD), Cannabidiolic acid (CBDA), trans-Δ9-tetrahydrocannabinol (Δ9-THC), trans-Δ9-tetrahydrocannabinolic acid A (THCAA), Cannabigerol (CBG), Cannabigerolic acid (CBGA), trans-Δ8-tetrahydrocannabinol (Δ8-THC), cannabichromene (CBC), cannabinol (CBN), and trans-Δ9-tetrahydrocannabivarin (THCV) were isolated from different cannabis varieties at the University of Mississippi. Cannabichromic acid (CBCA) was purchased from Cayman® (Ann Arbor, MI, USA). All cannabinoid standards were checked for their purity by GC/MS and HPLC (purity ≥ 99%). Terpene standards—α-pinene, β-pinene, β-myrcene, d-limonene, terpinolene, linalool, terpineol, β-caryophyllene, α-humulene, and caryophyllene oxide—were purchased from Sigma-Aldrich® (Burlington, MA, USA). The purity of all standards was checked by GC-MS and found to be ≥ 90%, except terpinolene, which was ≥85%. n-tridecane (purity ≥ 99%) was used as the internal standard and purchased from Sigma-Aldrich®.
The chemical structures of the tested cannabinoids and terpenes are shown in Figure 4.
3.4. Solvents and Reagents
The solvents including MeOH, ACN, and EtOAc were of HPLC grade and purchased from Fisher Scientific® (Waltham, MA, USA). Chloroform was of analytical grade and purchased from Sigma-Aldrich®.
3.5. Determination of Total Cannabinoids Using GC-FID
The method used by NCNPR for the routine analysis of cannabinoids uses a gas chromatograph with a flame ionization detector (GC/FID) to quantitate seven different cannabinoids: Δ9-tetrahydrocannabinol (Δ9-THC), Δ8-tetrahydrocannabinol (Δ8-THC), cannabidiol (CBD), cannabinol (CBN), tetrahydrocannabivarin (THCV), cannabichromene (CBC), and cannabigerol (CBG) [ref. 40]. All 33 barrel lots were tested by this validated method which directly determines the “total cannabinoid” profile which reflects the cannabinoid amounts available to a person through smoking. All samples were analyzed in triplicate.
GC analyses were performed using a Varian CP-3380 gas chromatograph equipped with Varian CP-8400 automatic liquid samplers, capillary injectors, and dual-flame ionization detectors. The analysis was carried out using a DB-1MS column (15 m × 0.25 mm I.D., 0.25 µm film thickness; Agilent, Santa Clara, CA, USA). Data were acquired using a Dell Optiplex GX1 computer and Varian Star workstation software (version 6.1). Helium was used as the carrier and detector makeup gas at a flow rate of 1 mL/min with an upstream split ratio of 50:1. The injector temperature and the detector temperature were 240 °C and 270 °C, respectively. The temperature program was 170 °C (hold 1 min) to 250 °C at 10 °C/min (hold 3 min); run time, 12 min; injection volume, 1 µL. The instrument was calibrated daily to ensure a Δ9-THC/internal standard response factor ratio of one.
Calculation of Concentrations
The concentration of a specific cannabinoid was calculated as follows:
In order to remove seeds and stems, the samples were manicured in a 14-mesh metal sieve. Triplicate samples (100 mg) were extracted with internal standard solution (IS) (3 mL, 4-androstene-3,17-dione in chloroform: methanol (100 mL, 1:9, v/v), 1 mg/mL) at room temperature for 1 h. The extracts were filtered through a cotton plug and then transferred to GC vials, ready for analysis. An aliquot of 1 μL was injected into the GC/FID.
3.6. Quantitative Analysis of Cannabinoid Acids Using HPLC-PDA
Cannabis samples were analyzed for both the free and acid forms of cannabinoids using a high-performance liquid chromatograph equipped with a photodiode array detector (HPLC/PDA), and eleven different cannabinoids were quantitated according to our validated method [ref. 39]. All samples were analyzed in triplicate. The chromatographic conditions are shown in Table 4.
Table 4: HPLC/PDA conditions for the analysis of cannabinoid acids.
| Parameter | Description |
|---|---|
| HPLC instrument | Waters Alliance 2695e HPLC system with a binary HPLC pump and a Waters 2996 PDA detector. |
| Column and guard column | Luna C18(2) column (150 × 4.60 mm, 3 µm; Phenomenex, Torrance, CA) equipped with a C18 guard column cartridge (Phenomenex). |
| Mobile phase | of 0.1% (v/v) formic acid in water (mobile phase A) and 0.1% (v/v) formic acid in acetonitrile (mobile phase B) according to a gradient elution started at 70% B from 0 to 6 min; then 77% B in 6 min; kept 77% B for 10 min; afterwards, the system was returned to the initial conditions with a total run time of 22.2 min. |
| Flow rate | 1.2 mL/min. |
| Injection volume | 10 µL. |
| PDA wavelength | 220 nm. |
| Software | Empower 3 software. |
Manicured plant samples (50 mg each) were weighed into glass scintillation vials and extracted each with 10 mL of I.S. solution (100 µg/mL) by sonication for 20 min at 30 °C. The samples were filtered through 45 µm nylon syringe filters. An aliquot of 10 μL of each sample was injected into the HPLC-PDA. All analyses were performed in triplicate.
3.7. GC/MS Analysis of Terpenes
The terpene profile was determined using the previously validated GC-MS method according to the following conditions [ref. 41]. The used chromatographic and mass spectrometric conditions are shown in Table 5.
Table 5: GC/FID parameters for the analysis of cannabis terpenes.
| Parameter | Description |
|---|---|
| Instrument/Software | Agilent 7890A series (Agilent) GC. Software (NIST) (Version 2.0f; Standard Reference Data Program of the National Institute ofStandards and Technology, as distributed by Agilent Technologies). |
| Column | DB-5MS capillary column (30 m × 0.25 mm I.D., 0.25 µm film thickness; Agilent). |
| Carrier gas | Helium; flow rate of 1 mL/min. |
| Inlet temperature/Split mode | 250 °C/split ratio 15:1. |
| Injection volume | 2 µL. |
| Temperatureprogram | The temperature program initiated at 50 °C (held for 2 min), then increased to 85 °C at a rate of 2 °C/min, followed by a ramp to 165 °C at 3 °C/min. Post-run, the temperature was held at 280 °C for 10 min. |
| Mass conditions | Full scan mode; from 40 to 450 atomic mass units (amu). The ionization energy = 70 eV. Ion source temperature = 230 °C. Quadrupole temperature = 150 °C. Solvent delay was set to 4 min. Transfer line temperature was 280 °C. Total run time was 56.16 min. |
Preparation of Standard and Sample Solutions for the Analysis of Major Terpenes
A stock standard solution of each terpene (α-pinene, β-pinene, myrcene, d-limonene, terpinolene, linalool, α-terpineol, β-caryophyllene, α-humulene, and caryophyllene oxide) was prepared in ethyl acetate. The standard terpenes were mixed, and the concentration of each terpene was adjusted to be 1.0 mg/mL, from which, serial dilutions were made to prepare the individual points of the calibration curves. Five calibration points ranging from 0.75 to 100 µg/mL were prepared from the previously mentioned stock standard solutions and IS (100 µg/mL).
Samples from three chemovars of C. sativa (high THC chemovar, THC/CBD chemovar, and high CBD chemovar) were dried for 24 h at 40 °C in a ventilated oven and then ground in a stainless-steel coffee grinder. Triplicates (1.0 g each) of the powdered samples were weighed in a 15 mL centrifuge tube, and each was extracted with 10 mL of the extraction solution (100 µg/mL of n-tridecane as the IS in ethyl acetate) by sonication for 15 min. The mixture was centrifuged for 5 min at 1252× g, and the supernatants (without filtration) were used for the GC/MS analysis.
3.8. Determination of Moisture Content
The moisture content of biomass is critical to the quality of stored cannabis plant material as excessive moisture promotes the growth of mold. Moisture content was measured for all 33-barrel lots in triplicate using a validated Loss on Drying (LoD) method [ref. 38].
3.9. Statistical Analysis
In this study, a paired t-test was conducted to compare the mean concentrations of cannabinoids and terpenes before and after gamma irradiation. The null hypothesis (H0) stated that there is no significant difference in the concentrations, while the alternative hypothesis (H1) posited the presence of a significant difference. A paired t-test was chosen due to its suitability for comparing paired data. The test was executed using the ‘paired t-test’ function in JASP software (version 0.18.1.0) with a significance level of α = 0.05.
4. Conclusions
The results suggest that the gamma irradiation treatment of bulk cannabis plant material does not significantly affect their chemical or physical properties but does effectively reduce microbial contamination to levels considered safe for human use. Although gamma irradiation treatment is practical for the decontamination of large quantities of materials, other technologies such as X-ray irradiation may be considered for smaller quantities of cannabis. Upon irradiation, cannabinoids, terpenes, and moisture content were not changed by the irradiation treatment.
References
- E.B. Russo. History of cannabis and its preparations in saga, science, and sobriquet. Chem. Biodivers., 2007. [DOI | PubMed]
- C.M. Andre, J.F. Hausman, G. Guerriero. Cannabis sativa: The plant of the thousand and one molecules. Front. Plant Sci., 2016. [DOI | PubMed]
- E. Small. Evolution and classification of Cannabis sativa (marijuana, hemp) in relation to human utilization. Bot. Rev., 2015. [DOI]
- G. Crini, E. Lichtfouse, G. Chanet, N. Morin-Crini. Applications of hemp in textiles, paper industry, insulation and building materials, horticulture, animal nutrition, food and beverages, nutraceuticals, cosmetics and hygiene, medicine, agrochemistry, energy production and environment: A review. Environ. Chem. Lett., 2020. [DOI]
- S.A. Salami, F. Martinelli, A. Giovino, A. Bachari, N. Arad, N. Mantri. It is our turn to get cannabis high: Put cannabinoids in food and health baskets. Molecules, 2020. [DOI | PubMed]
- F. Zandkarimi, J. Decatur, J. Casali, T. Gordon, C. Skibola, C. Nuckolls. Comparison of the cannabinoid and terpene profiles in commercial cannabis from natural and artificial cultivation. Molecules, 2023. [DOI | PubMed]
- J. Korus, M. Witczak, R. Ziobro, L. Juszczak. Hemp (Cannabis sativa subsp. sativa) flour and protein preparation as natural nutrients and structure forming agents in starch based gluten-free bread. LWT, 2017. [DOI]
- H. Burczyk, L. Grabowska, J. Kołodziej, M. Strybe. Industrial hemp as a raw material for energy production. J. Ind. Hemp, 2008. [DOI]
- X.A. Casas, J. Rieradevall i Pons. Environmental analysis of the energy use of hemp–Analysis of the comparative life cycle: Diesel oil vs. hemp–diesel. Int. J. Agric. Resour. Gov. Ecol., 2005. [DOI]
- I.J. Flores-Sanchez, R. Verpoorte. Secondary metabolism in cannabis. Phytochem. Rev., 2008. [DOI]
- S.J. Livingston, T.D. Quilichini, J.K. Booth, D.C. Wong, K.H. Rensing, J. Laflamme-Yonkman, S.D. Castellarin, J. Bohlmann, J.E. Page, A.L. Samuels. Cannabis glandular trichomes alter morphology and metabolite content during flower maturation. Plant J., 2020. [DOI | PubMed]
- M.S. Chauhan, M. Karat, S. Binorkar, R.A. Lambat. Review on Mechanism, Therapeutic Uses and Pharmacological Activities of Cannabis sativa. Acta Sci. Med. Sci., 2022. [DOI]
- E. Russo, M.L. Mathre, A. Byrne, R. Velin, P.J. Bach, J. Sanchez-Ramos, K.A. Kirlin. Chronic Cannabis Use in the Compassionate Investigational New Drug Program. J. Cannabis Ther., 2002. [DOI]
- F. Grotenhermen. Cannabinoids and the endocannabinoid system. Cannabinoids, 2006
- D.M. Mostafaei, A. Ebadi, A. Peirovi, G. Taylor, S.A. Salami. THC and CBD Fingerprinting of an Elite Cannabis Collection from Iran: Quantifying Diversity to Underpin Future Cannabis Breeding. Plants, 2022. [DOI | PubMed]
- T. Cundell. Microbiological attributes of powdered cannabis. Am. Pharm. Rev., 2015
- K. McKernan, J. Spangler, Y. Helbert, R.C. Lynch, A. Devitt-Lee, L. Zhang, W. Orphe, J. Warner, T. Foss, C.J. Hudalla. Metagenomic analysis of medicinal Cannabis samples; pathogenic bacteria, toxigenic fungi, and beneficial microbes grow in culture-based yeast and mold tests. F1000Research, 2016. [DOI | PubMed]
- R. Ruchlemer, M. Amit-Kohn, D. Raveh, L. Hanuš. Inhaled medicinal cannabis and the immunocompromised patient. Support. Care Cancer, 2015. [DOI | PubMed]
- A. Bal, A.N. Agarwal, A. Das, V. Suri, S. Varma. Chronic necrotising pulmonary aspergillosis in a marijuana addict: A new cause of amyloidosis. Pathology, 2010. [DOI | PubMed]
- D.N. Taylor, I.K. Wachsmuth, Y.-H. Shangkuan, E.V. Schmidt, T.J. Barrett, J.S. Schrader, C.S. Scherach, H.B. McGee, R.A. Feldman, D.J. Brenner. Salmonellosis associated with marijuana: A multistate outbreak traced by plasmid fingerprinting. N. Engl. J. Med., 1982. [DOI | PubMed]
- Special Concerns Associated with Marijuana Extractions, Concentrations, Infusions, and Infused Foods
- C.A. Legare, W.M. Raup-Konsavage, K.E. Vrana. Therapeutic potential of cannabis, cannabidiol, and cannabinoid-based pharmaceuticals. Pharmacology, 2022. [DOI | PubMed]
- U.S. Drug Enforcement Agency Drug Scheduling
- Cannabis Overview
- National Conference of State Legislatures. 2022
- FDA Cannabis and Cannabis-Derived Compounds: Quality Considerations for Clinical Research Guidance for Industry
- L. Carroll. One in Seven U.S. Adults Used Marijuana in 2017
- J.F. Diehl. Radiation Sources and Process Control. Safety of Irradiated Foods, 1995
- A. Hazekamp. Evaluating the effects of gamma-irradiation for decontamination of medicinal cannabis. Front. Pharmacol., 2016. [DOI | PubMed]
- S. Jerushalmi, M. Maymon, A. Dombrovsky, S. Freeman. Effects of cold plasma, gamma and e-beam irradiations on reduction of fungal colony forming unit levels in medical cannabis inflorescences. J. Cannabis Res., 2020. [DOI | PubMed]
- Sterigenics General Guide to Gamma Irradiation
- K.A. da Silva Aquino. Sterilization by gamma irradiation. Gamma Radiation, 2012
- E.L. Andress, K.S. Delaplane, G.A. Schuler. Food Irradiation, 1998
- E. Kovacs, A. Keresztes. Effect of gamma and UV-B/C radiation on plant cells. Micron, 2002. [DOI | PubMed]
- E. Emovon. Keynote Address: Symposium Irradiation for National Development, 1996
- M.M. Radwan, S. Chandra, S. Gul, M.A. ElSohly. Cannabinoids, phenolics, terpenes and alkaloids of cannabis. Molecules, 2021. [DOI | PubMed]
- General Chapter <61> Microbiological Examination of Nonsterile Products: Microbial Enumeration Tests. USP 42–NF 37
- N.D. Sarma, A. Waye, M.A. ElSohly, P.N. Brown, S. Elzinga, H.E. Johnson, R.J. Marles, J.E. Melanson, E. Russo, L. Deyton. Cannabis inflorescence for medical purposes: USP considerations for quality attributes. J. Nat. Prod., 2020. [DOI | PubMed]
- W. Gul, S.W. Gul, M.M. Radwan, A.S. Wanas, Z. Mehmedic, I.I. Khan, M.H.M. Sharaf, M.A. El Sohly. Determination of 11 cannabinoids in biomass and extracts of different varieties of cannabis using high-performance liquid chromatography. J. AOAC Int., 2015. [DOI | PubMed]
- Z. Mehmedic, S. Chandra, D. Slade, H. Denham, S. Foster, A.S. Patel, S.A. Ross, I.A. Khan, M.A. ElSohly. Potency trends of Δ9-THC and other cannabinoids in confiscated cannabis preparations from 1993 to 2008. J. Forensic Sci., 2010. [DOI | PubMed]
- E.A. Ibrahim, M. Wang, M.M. Radwan, A.S. Wanas, C.G. Majumdar, B. Avula, Y.-H. Wang, I.A. Khan, S. Chandra, H. Lata. Analysis of terpenes in Cannabis sativa L. using GC/MS: Method development, validation, and application. Planta Med., 2019. [DOI | PubMed]