Deciphering the multifaceted role of EXO1 in female-related cancers: implications for prognosis and therapeutic responsiveness
Abstract
Background:
Aberrant function or overactivation of exonuclease 1 (EXO1) may be associated with cancer tumor development, drug resistance, and response to immunotherapy in female-related cancers.
Methods:
By analyzing RNA-sequencing data from The Cancer Genome Atlas database, combined with validation through quantitative polymerase chain reaction experiments, we explored the expression levels of EXO1 in breast cancer (BRCA) cell lines and assessed its multidimensional roles in various female-related cancers.
Results:
Our experiments revealed elevated expression of EXO1 in BRCA cell lines, consistent with the RNA-sequencing data. The high expression of EXO1 is associated with poor prognosis in various female-related cancers, especially in BRCA and UCEC. It significantly correlates with clinical and pathological characteristics. In specific cancer subtypes like the basal-like subtype of BRCA, high EXO1 expression is associated with a better prognosis. Genetic mutation analysis indicates a higher frequency of EXO1 gene mutations in uterine sarcoma and BRCA. DNA methylation levels may play a role in the regulation of EXO1 gene expression in some cancers. EXO1 expression is correlated with various factors within the tumor immune microenvironment and may be associated with the sensitivity to anticancer drugs.
Conclusion:
EXO1 exhibits multidimensional roles in female-related cancers as a prognostic biomarker and potentially influences tumor immune therapy responses and drug sensitivities. Further studies are needed to fully understand the complex mechanisms underlying these associations and to explore potential therapeutic strategies targeting EXO1.
Article type: Research Article
Keywords: female-related cancers, prognostic biomarkers, tumor immune microenvironment, drug sensitivity prediction
License: Copyright © 2025 Yu and Wu CC BY 4.0 This is an open-access article distributed under the terms of the Creative Commons Attribution License (CC BY). The use, distribution or reproduction in other forums is permitted, provided the original author(s) and the copyright owner(s) are credited and that the original publication in this journal is cited, in accordance with accepted academic practice. No use, distribution or reproduction is permitted which does not comply with these terms.
Article links: DOI: 10.3389/fimmu.2025.1591505 | PubMed: 40433389 | PMC: PMC12107352
Relevance: Moderate: mentioned 3+ times in text
Full text: PDF (9.2 MB)
Introduction
In recent years, there has been a continuous increase in the number of patients with cancer globally. By 2020, the number of patients with cancer worldwide had reached 19.3 million, with 9.228 million being women, representing 47.8% of the total patient population (ref. 1). The most prevalent types of cancer in women are breast cancer (BRCA), cervical cancer (CESC), uterine corpus endometrial cancer (UCEC), ovarian cancer (OV), thyroid cancer (THCA), uterine sarcoma (UCS), etc. These cancers account for 44.5% of all female-related cancer cases and have a mortality rate of 31.3% (ref. 1). BRCA ranks among the most prevalent malignancies in women. In 2024, it was projected that there would be 310,720 new cases of female BRCA, surpassing lung cancer 118,270) and becoming the leading type of cancer in the United States, representing approximately 32% of all new cancer cases (ref. 2). In China, there are 269,000 new cases of BRCA and 70,000 deaths annually, placing it at the top with regard to incidence and fourth in terms of mortality among female-related malignancies (ref. 3). CESC (including squamous cell carcinoma and adenocarcinoma), UCEC, and OV are prevalent gynecologic malignancies. The incidence of these cancers has been on the rise over time, with a gradual decrease in the average age at which they occur (ref. 4–ref. 6). The incidence of THCA in females has risen rapidly since 2000, and with an incidence 3-4 times higher in females compared to males (ref. 7–ref. 9). Therefore, similar to breast cancer, THCA is regarded as a female-related cancer in our study.
Exonuclease 1 (EXO1), a 5′-3′ exonuclease, exists in two isoforms (i.e., EXO1a and EXO1b), which share similar functions (ref. 10). The EXO1 protein exhibits both 5’ end-3’ end exonuclease activity and 5’ end structure-specific endonuclease activity. It is classified within the radiation-sensitive 2/xeroderma pigmentosum complementation group G (Rad2/XPG) family (ref. 11). EXO1 plays a vital role in various DNA repair processes, such as mismatch repair, translation synthesis, nucleotide excision repair, DNA double-strand break repair, meiotic recombination repair, and telomere maintenance (ref. 12). Research has demonstrated that the absence of the MutL homolog 1 (MLH1) subunit of MutLα disrupts its specific regulation of EXO1 during DNA repair, resulting in uncontrolled DNA excision, which encompasses elevated single-stranded DNA formation, depletion of replication protein A (RPA), DNA breaks, and abnormal DNA repair intermediates (ref. 13). While DNA processing is crucial for repair, excessive activity can cause heightened genome instability and disruptions to cellular function (ref. 14). Considering that platinum-based chemotherapeutic drugs primarily induce DNA damage, the capacity of tumor cells to repair such damage plays a pivotal role in their resistance to these drugs. Cancer recurrence and chemotherapy resistance are frequent factors contributing to mortality among patients with cancer. Research has revealed that deficiency of the EXO1 gene can heighten susceptibility and chemotherapy resistance in various malignancies, including BRCA, OV, and lung cancer. Additionally, its polymorphism can serve as a prognostic indicator for squamous cell carcinoma, epithelial OV, nonsmall cell lung cancer, pancreatic cancer, and head and neck cancer (ref. 15, ref. 16). Disruption of the EXO1 gene resulted in heightened microsatellite instability in cells and increased tumor susceptibility in mice (ref. 17). Hence, the EXO1 protein likely plays a significant role in cancer chemoresistance and holds promise as a therapeutic target for enhancing chemosensitivity in drug-resistant patients. Nevertheless, further investigation is required to elucidate the precise signaling pathway through which the EXO1 protein operates in DNA damage repair mechanisms and its involvement in tumor chemoresistance.
This study comprehensively examined the expression profile, genetic alterations, and molecular functions of EXO1, along with its correlation with clinicopathological characteristics, prognostic significance, and infiltration of cancer-associated immune cells in various types of female-related tumors.
Materials and methods
Cell culture
MCF-7 cells were cultured in cell-specific culture medium (CM-0149, Procell Co., Ltd, Wuhan, China). MCF-10A cells were cultured in specific epithelial culture medium (CM-0525, Procell Co., Ltd). All cells were maintained at 37°C in a humidified atmosphere composed of 95% air and 5% CO2; the media were changed every 2 days.
Real-time quantitative polymerase chain reaction
RNA was extracted from the cells using AG RNAex Pro reagent (AG21101, Accurate Biotechnology Co., Ltd, Changsha, China) and reversely transcribed to cDNA using an RT Kit (AG11728, Accurate Biotechnology Co., Ltd). Subsequently, the mRNA levels of the targeted gene (EXO1) relative to those of control glyceraldehyde-3-phosphate dehydrogenase (GAPDH) were quantified by qPCR using specific primers synthesized by Sangon Biotech (Shanghai, China). The sequences of the primers were EXO1-1: forward: 5’-CTGAAGTGTTTGTGCCTGAC-3’ and reverse: 5′-GTGGGTGGTGAAATGGTC-3’; EXO1-2: forward: 5’- TACTGTGGGAGTGGAACG-3’ and reverse: 5′- TCCATTTACCAGGTCAGG-3’; EXO1-3: forward: 5’- ATTGCCTCGTGGCTCCCTAT-3’ and reverse: 5′- ACCCGTTGATGTAATCCTCTGG-3’.
Data acquisition and gene expression analyses
RNA-sequencing (RNA-seq) data along with patient-specific clinical information, were obtained from The Cancer Genome Atlas (TCGA) database (https://prtal.gdc.cancer.gov/) for patients with cancer enrolled in the BRCA, CESC, OV, THCA, UCEC, and UCS projects. RNA-seq data were processed uniformly using TCGA Toil application (ref. 18). Gene Expression Profiling Interactive Analysis (GEPIA; gepia2.cancer-pku.cn) was employed to conduct expression analysis by generating box plots comparing the expression levels of EXO1 in cancer samples and healthy control samples (ref. 19). Wilcoxon rank sum and signed rank tests were utilized to compare the expression levels of EXO1 between tumor samples and paired or unpaired control samples. To assess the discriminatory power of EXO1 expression levels (high or low) in distinguishing tumor samples from control samples, receiver operating characteristic (ROC) analysis was conducted using the “pROC” package (ref. 20). This study was carried out following the publication guidelines established by TCGA.
Clinicopathological characteristics analyses
Differences in clinicopathological characteristics were assessed between the high and low EXO1 expression groups using various statistical tests, such as Pearson’s χ2 test, Fisher’s exact test, or Wilcoxon rank sum test. Logistic regression analysis was applied to evaluate the association between EXO1 expression levels and clinicopathological variables among female patients with cancer. Visualization of the statistical data was accomplished using the R package “ggplot2”.
Survival and prognostic analyses
The objective was to evaluate the potential of EXO1 as a predictor of overall survival (OS), disease-specific survival (DSS), and progression-free interval (PFI) in female patients with cancer and subgroups. Survival differences between the high and low EXO1 expression groups were assessed, and Kaplan–Meier curves were constructed using data from TCGA. The “survival” package and the “survminer” package in R were utilized for these analyses. Univariate and multivariate Cox regression analyses were performed to identify independent prognostic factors associated with survival. Variables with P-values <0.1 in the univariate analysis were included in the multivariate Cox regression model. Hazard ratios (HR) with their corresponding 95% confidence intervals (CI) were calculated to estimate the risk associated with each factor.
Nomogram construction and evaluation
Following a previous Cox multifactorial regression model, nomograms were constructed using the “rms” package in R to identify independent prognostic factors. Calibration plots were subsequently constructed to assess the predictive accuracy of the nomogram according to the concordance between predicted and actual OS, DSS, and PFI at 1, 3, and 5 years. A concordance index was calculated using a bootstrap approach with 1,000 resamples to determine the discriminatory power of the nomogram (ref. 21). A time-dependent survival ROC curve was produced using the “timeROC” and “ggplot2” packages in R to assess the predictive value of EXO1 expression for 1-, 3-, and 5-year survival in female-related cancers in TCGA (ref. 22).
Genetic alteration analyses
The genetic alterations of EXO1 gene were analyzed using the cBioPortal (www.cbioportal.org/) and TIMER2.0 (http://timer.cistrome.org/) in databases of female-related cancers. Kaplan–Meier curves were drawn based on the log-rank test using cBioPortal to analyze the different prognostic significance between EXO1 altered and unaltered groups among various female-related cancers (ref. 23).
DNA methylation status analyses
The UALCAN online tool (http://ualcan.path.uab.edu/) was employed to analyze and compare the methylation levels of EXO1 in female-related cancers and normal tissues using TCGA data (ref. 24). The association between different DNA methylation probes and EXO1 expression was assessed using the “ggplot2” package in R. Additionally, the beta value, P-value, and Pearson correlation coefficient were evaluated for each individual probe. The prognostic value of the EXO1 methylation level in female-related cancers was analyzed using the SurvivalMeth online tool (http://bio-bigdata.hrbmn.edu.cn/survivalmeth/) with TCGA data (ref. 25).
Differentially expressed genes and enrichment analysis
Tumor samples were classified into high and low expression subgroups based on the median EXO1 expression. DEGs were identified from HTSeq-Counts using the DESeq2 software, with thresholds of |log2 fold change| >2 and adjusted P-values <0.01 (ref. 26). Results of DEG analysis are presented as volcano plots. The R package ClusterProfiler (3.14.3) was utilized for Gene Ontology (GO) classification, including biological process, cellular components, and molecular function, as well as for Kyoto Encyclopedia of Genes and Genomes (KEGG) pathway enrichment analysis of DEGs between the high and low EXO1 expression groups (ref. 27). Terms with P-values <0.05 after adjustment using the Benjamini and Hochberg method were considered significant. The R package ClusterProfiles (3.14.3) was used to perform gene set enrichment analysis (GSEA) between high and low EXO1 expression groups. The expression level of EXO1 was used as a phenotype label, and enriched pathways were identified according to |normalized enrichment score| >1, adjusted P-values <0.05, and false discovery rate q-value <0.25. Pearson correlation analysis was performed between EXO1 and all other molecules, and the top 100 most significantly correlated genes were selected. The overlapping genes across all groups were identified, and the intersection results were visualized as a flower plot using the ggplot2 package (v3.4.2). Protein-protein interaction (PPI) networks were subsequently analyzed through the STRING database (https://string-db.org, v12.0) with high-confidence interaction thresholds (score ≥0.7).
Cancer immune analysis
The TISIDB database was used to analyze the correlations between EXO1 expression and immune subtypes in female-related cancers (ref. 28). Immune infiltration analysis of 24 distinct immune cell types within tumor samples was performed using the single-sample GSEA method with gene set variation analysis software in the R environment. Relative enrichment scores were calculated for each tumor sample based on the characteristic genes of these 24 immune cell types (ref. 29). Spearman correlation analysis was employed to assess associations between EXO1 expression and the infiltration of each immune cell type. The Wilcoxon rank sum test was used to compare cell immune infiltration between high and low EXO1 expression groups. The potential association of EXO1 expression with immune inhibitors, immune stimulators, chemokines, and chemokine receptors in female-related cancers were determined using Spearman’s rank correlation test.
Drug sensitivity analysis
The relationship between the sensitivity of hundreds of drugs and the relative expression levels of EXO1 was analyzed using The Genomics of Drug Sensitivity of Cancer (GDSC) and The Cancer Therapeutics Response Portal (CTRP) database (http://bioinfo.life.hust.edu.cn/GSCA/#/).
Results
Expression of EXO1 in multiple female-related cancers
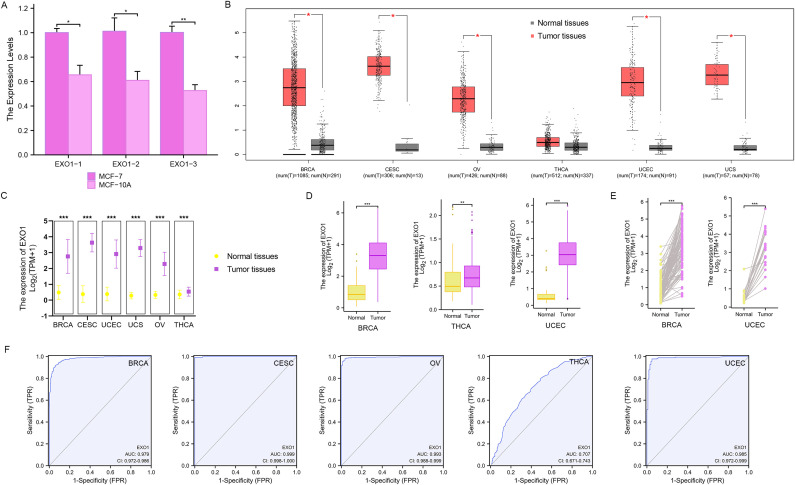
The qPCR analyses revealed that the relative levels of EXO1 expression in MCF-7 cells were significantly higher than those in MCF-10A cells (P < 0.001) (f1). The expression of EXO1 in multiple female-related cancers, including BRCA, CESC, OV, THCA, UCEC, and UCS, was analyzed using GEPIA. The results demonstrated that EXO1 expression levels were significantly higher in patients with BRCA, CESC, OV, UCEC, and UCS, compared to healthy controls (P < 0.001) (f1). The expression of EXO1 in these female-related cancers was further analyzed using R based on data from TCGA and other databases. The analysis revealed that EXO1 was significantly upregulated in tumor tissues versus normal tissues for BRCA, CESC, OV, THCA, UCEC, and UCS based on a combined dataset from the Genotype-Tissue Expression Project (GTEx) and TCGA (P < 0.001) (f1). Moreover, EXO1 mRNA expression was found to be elevated in tumor tissues compared to paracancerous tissues specifically in BRCA, THCA, and UCEC using data from TCGA database (P < 0.001) (f1). Furthermore, when comparing individual tissue samples to their corresponding adjacent tissues within the BRCA and UCEC datasets from TCGA, elevated EXO1 mRNA expression was observed (P < 0.001) (f1). To evaluate the discriminatory capability of EXO1 expression levels between tumor and non-tumor tissues, ROC analysis was performed using combined TCGA and GTEx data. The areas under the curve (AUC) were 0.979 for BRCA, 0.999 for CESC, 0.993 for OV, 0.707 for THCA, and 0.985 for UCEC (f1). These results suggest that EXO1 is significantly upregulated in a variety of tumors related to females and possesses a good ability to distinguish between tumor and non-tumor tissues.
Associations of EXO1 expression levels with clinicopathologic characteristics
Given the high expression of EXO1 in female-related cancers, we investigated the associations between EXO1 expression and clinicopathological characteristics of patients based on TCGA data. T1 presents the significant differences in various clinicopathological characteristics between patients with high or low EXO1 expression levels in female-related cancers. In patients with BRCA, there were significant differences in T stage (P < 0.001), pathologic stage (P = 0.008), race (P < 0.001), age (P < 0.001), histologic type (P < 0.001), progesterone receptor (PR) status (P < 0.001), estrogen receptor (ER) status (P < 0.001), human epidermal growth factor receptor 2 (HER2) status (P < 0.001), PAM50 (P < 0.001), anatomic neoplasm subdivisions (P = 0.001), OS event (P = 0.046), and DSS event (P = 0.034) between different EXO1 expression groups. In patients with UCEC, significant differences were observed in weight (P = 0.004), histological type (P < 0.001), histologic grade (P < 0.001), OS event (P = 0.017), and PFI event (P = 0.003) between different EXO1 expression groups. THCA patients with different EXO1 expression levels displayed significant differences in histological type (P = 0.001) and PFI event (P = 0.031). However, no significant differences were found between the high and low EXO1 expression groups in CESC, OV, and UCS.
Table 1: Clinicopathological characteristics of female related cancers patients with high- and low- EXO1 expression.
| Cancer type | Characteristic | EXO1 expression | P | Statistic Value | |
|---|---|---|---|---|---|
| Low | High | ||||
| BRCA | n | 541 | 542 | ||
| T stage, n (%) | < 0.001 | 29.81fnT1_1 | |||
| T1 | 174 (16.1%) | 103 (9.5%) | |||
| T2 | 280 (25.9%) | 349 (32.3%) | |||
| T3 | 74 (6.9%) | 65 (6%) | |||
| T4 | 12 (1.1%) | 23 (2.1%) | |||
| Pathologic stage, n (%) | 0.008 | 11.81 fnT1_1 | |||
| Stage I | 111 (10.5%) | 70 (6.6%) | |||
| Stage II | 290 (27.4%) | 329 (31%) | |||
| Stage III | 119 (11.2%) | 123 (11.6%) | |||
| Stage IV | 9 (0.8%) | 9 (0.8%) | |||
| Race, n (%) | < 0.001 | 26.62 fnT1_1 | |||
| Asian | 16 (1.6%) | 44 (4.4%) | |||
| Black or African American | 75 (7.5%) | 106 (10.7%) | |||
| White | 417 (42%) | 336 (33.8%) | |||
| Age, n (%) | < 0.001 | 11.49 fnT1_1 | |||
| <=60 | 272 (25.1%) | 329 (30.4%) | |||
| >60 | 269 (24.8%) | 213 (19.7%) | |||
| Histological type, n (%) | < 0.001 | 66.24 fnT1_1 | |||
| Infiltrating Ductal Carcinoma | 327 (33.5%) | 445 (45.5%) | |||
| Infiltrating Lobular Carcinoma | 153 (15.7%) | 52 (5.3%) | |||
| PR status, n (%) | < 0.001 | ||||
| Negative | 100 (9.7%) | 242 (23.4%) | |||
| Indeterminate | 2 (0.2%) | 2 (0.2%) | |||
| Positive | 415 (40.1%) | 273 (26.4%) | |||
| ER status, n (%) | < 0.001 | ||||
| Negative | 46 (4.4%) | 194 (18.7%) | |||
| Indeterminate | 0 (0%) | 2 (0.2%) | |||
| Positive | 471 (45.5%) | 322 (31.1%) | |||
| HER2 status, n (%) | < 0.001 | 14.33 fnT1_1 | |||
| Negative | 293 (40.3%) | 265 (36.5%) | |||
| Indeterminate | 7 (1%) | 5 (0.7%) | |||
| Positive | 56 (7.7%) | 101 (13.9%) | |||
| PAM50, n (%) | < 0.001 | 428.14 fnT1_1 | |||
| Normal | 35 (3.2%) | 5 (0.5%) | |||
| LumA | 434 (40.1%) | 128 (11.8%) | |||
| LumB | 37 (3.4%) | 167 (15.4%) | |||
| Her2 | 15 (1.4%) | 67 (6.2%) | |||
| Basal | 20 (1.8%) | 175 (16.2%) | |||
| Anatomic neoplasm subdivisions, n (%) | 0.001 | 10.58 fnT1_1 | |||
| Left | 254 (23.5%) | 309 (28.5%) | |||
| Right | 287 (26.5%) | 233 (21.5%) | |||
| OS event, n (%) | 0.046 | 4 fnT1_1 | |||
| Alive | 477 (44%) | 454 (41.9%) | |||
| Dead | 64 (5.9%) | 88 (8.1%) | |||
| DSS event, n (%) | 0.034 | 4.48 fnT1_1 | |||
| Alive | 503 (47.3%) | 475 (44.7%) | |||
| Dead | 33 (3.1%) | 52 (4.9%) | |||
| UCEC | n | 276 | 276 | ||
| Weight, n (%) | 0.004 | 8.26 fnT1_1 | |||
| <=80 | 105 (19.9%) | 138 (26.1%) | |||
| >80 | 160 (30.3%) | 125 (23.7%) | |||
| Histological type, n (%) | < 0.001 | 15.55 fnT1_1 | |||
| Endometrioid | 225 (40.8%) | 185 (33.5%) | |||
| Mixed | 10 (1.8%) | 14 (2.5%) | |||
| Serous | 41 (7.4%) | 77 (13.9%) | |||
| Histologic grade, n (%) | < 0.001 | 58.43 fnT1_1 | |||
| G1 | 78 (14.4%) | 20 (3.7%) | |||
| G2 | 72 (13.3%) | 48 (8.9%) | |||
| G3 | 122 (22.6%) | 201 (37.2%) | |||
| OS event, n (%) | 0.017 | 5.65 fnT1_1 | |||
| Alive | 240 (43.5%) | 218 (39.5%) | |||
| Dead | 36 (6.5%) | 58 (10.5%) | |||
| PFI event, n (%) | 0.003 | 9.1 fnT1_1 | |||
| Alive | 227 (41.1%) | 196 (35.5%) | |||
| Dead | 49 (8.9%) | 80 (14.5%) | |||
| THCA | n | 255 | 255 | ||
| Histological type, n (%) | 0.001 | ||||
| Classical | 170 (33.3%) | 194 (38%) | |||
| Follicular | 67 (13.1%) | 34 (6.7%) | |||
| Other | 5 (1%) | 4 (0.8%) | |||
| Tall Cell | 13 (2.5%) | 23 (4.5%) | |||
| PFI event, n (%) | 0.031 | 4.66 fnT1_1 | |||
| Alive | 236 (46.3%) | 220 (43.1%) | |||
| Dead | 19 (3.7%) | 35 (6.9%) | |||
a Chisq.test; others, Fisher.test.
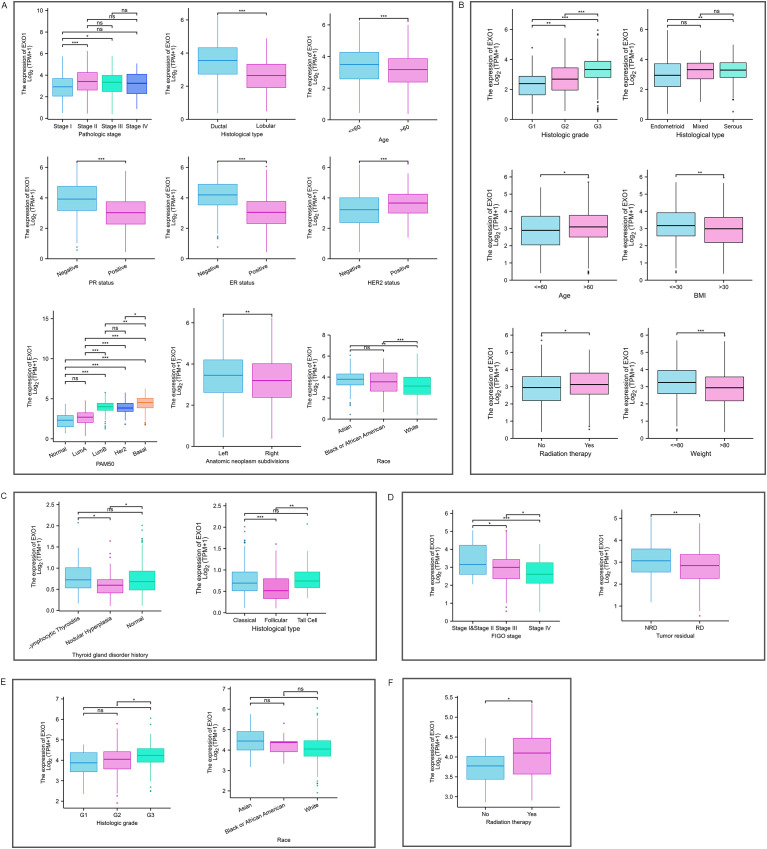
The Kruskal–Wallis rank sum test indicated that the mRNA expression levels of EXO1 were related to pathologic stage, histological type, age, race, PR status, ER status, HER2 status, and PAM50 in patients with BRCA (f2). Expression of EXO1 was higher in BRCA patients with pathologic stage II/III, infiltrating ductal carcinoma, age ≤60 years, PR-negative, ER-negative, HER2-positive, basal-like of PAM50 classification, and non-White race. In patients with UCEC (f2), higher EXO1 expression was correlated with higher histologic grade, serous tumors, age >60 years, body mass index >30 kg/m2, weight <80 kg, and undergoing radiation therapy. In patients with THCA (f2), the expression levels of EXO1 were higher in those with a history of lymphocytic thyroiditis in the thyroid gland disorder than in patients with nodular hyperplasia. Additionally, the EXO1 expression levels were higher in THCA patients with the classical type and tall cell variant compared to the follicular variant. In patients with OV (f2), higher EXO1 expression showed an inverse correlation with both International Federation of Gynecology and Obstetrics (FIGO) stage and the presence of residual tumor. In patients with CESC (f2), higher EXO1 expression was associated with higher histologic grade and Asian race. Moreover, in patients with UCS (f2), higher EXO1 expression was related to radiation therapy.
Logistic regression analysis revealed that EXO1 expression was significantly associated with T stage, race, age, histological type, PR status, ER status, HER2 status, PAM50 classification, and anatomic neoplasm subdivisions in BRCA. In UCEC, EXO1 expression was associated with clinical stage, weight, histological type, and histologic grade. In THCA, EXO1 expression was associated with age, histological type, and a history of thyroid gland disorder. In CESC, EXO1 expression was associated with histologic grade (T2). However, EXO1 expression showed no correlation with clinicopathological characteristics in OV and UCS based on logistic regression analysis.
Table 2: Relationship between EXO1 expression levels and clinicopathological characteristics according to logistic regression analyses in female related cancers.
| Cancer type | Characteristics | Total (N) | Odds Ratio (OR) | P-value |
|---|---|---|---|---|
| BRCA | T stage (T2&T3&T4 vs. T1) | 1080 | 2.017 (1.526-2.676) | <0.001 |
| Race (White vs. Asian&Black or African American) | 994 | 0.489 (0.362-0.657) | <0.001 | |
| Age (>60 vs. <=60) | 1083 | 0.655 (0.514-0.833) | <0.001 | |
| Histological type (Infiltrating Lobular Carcinoma vs. Infiltrating Ductal Carcinoma) | 977 | 0.250 (0.175-0.351) | <0.001 | |
| PR status (Positive vs. Negative) | 1030 | 0.272 (0.205-0.358) | <0.001 | |
| ER status (Positive vs. Negative) | 1033 | 0.162 (0.113-0.228) | <0.001 | |
| HER2 status (Positive vs. Negative) | 715 | 1.994 (1.387-2.890) | <0.001 | |
| PAM50 (Her2&Basal vs. LumA&LumB) | 1043 | 11.039 (7.621-16.432) | <0.001 | |
| Anatomic neoplasm subdivisions (Right vs. Left) | 1083 | 0.667 (0.525-0.848) | <0.001 | |
| UCEC | Clinical stage (Stage II&Stage III&Stage IV vs. Stage I) | 552 | 1.494 (1.058-2.114) | 0.023 |
| Weight (>80 vs. <=80) | 528 | 0.594 (0.420-0.839) | 0.003 | |
| Histological type (Serous vs. Endometrioid) | 528 | 2.284 (1.499-3.521) | <0.001 | |
| Histologic grade (G3 vs. G1&G2) | 541 | 3.634 (2.534-5.254) | <0.001 | |
| THCA | Age (>45 vs. <=45) | 510 | 0.696 (0.490-0.986) | 0.042 |
| Histological type (Follicular vs. Classical) | 465 | 0.445 (0.278-0.701) | <0.001 | |
| Thyroid gland disorder history (Nodular Hyperplasia vs. Lymphocytic Thyroiditis) | 142 | 0.439 (0.221-0.858) | 0.017 | |
| CESC | Histologic grade (G3&G4 vs. G1&G2) | 274 | 1.698 (1.051-2.757) | 0.031 |
a Categorical dependent variable, greater or less than the median expression level.
Prognostic value of EXO1 expression in UCEC
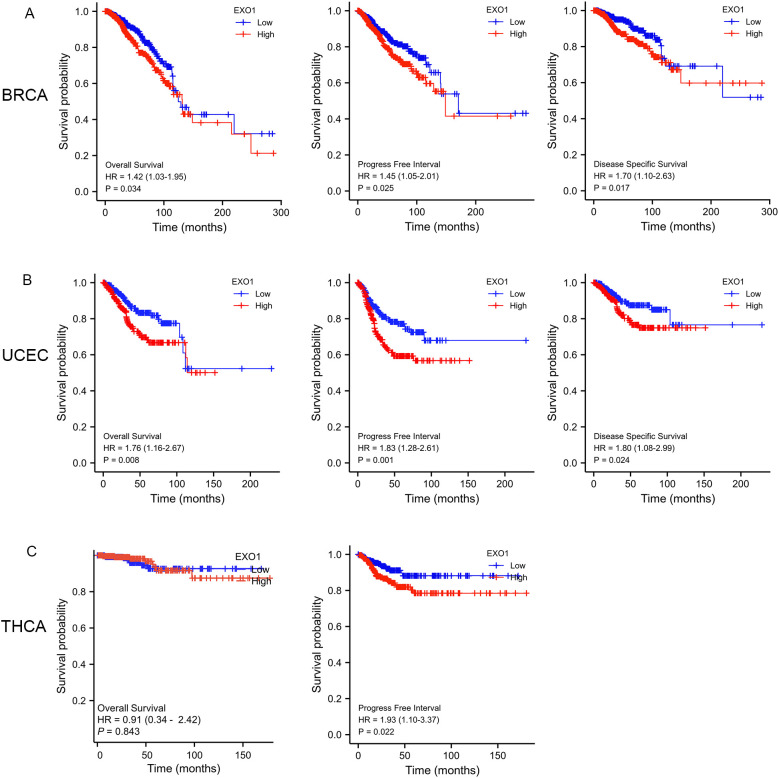
To determine the prognostic significance of EXO1 expression in female-related cancers, we investigated the correlation between EXO1 expression and patient prognosis. Patients were categorized into high and low EXO1 expression groups based on their EXO1 expression levels. Kaplan–Meier analyses revealed that higher EXO1 expression in patients with BRCA was associated with poorer OS (HR = 1.42 [95% CI: 1.03–1.95], P = 0.034), PFI (HR = 1.45 [95% CI: 1.05–2.01], P = 0.025), and DSS (HR = 1.70 [95% CI: 1.10–2.63], P = 0.017) (f3). Similarly, in patients with UCEC (f3), higher EXO1 expression was correlated with poorer OS (HR = 1.76 [95% CI: 1.16–2.67], P = 0.008), PFI (HR = 1.83 [95% CI: 1.28–2.61], P = 0.001), and DSS (HR = 1.80 [95% CI: 1.08–2.99], P = 0.024), as well as with poorer PFI (HR = 1.93 [95% CI: 1.10–3.37], P = 0.022) in patients with THCA (f3). However, no significant associations were found between EXO1 expression and prognosis in patients with CESC, OV, and UCS based on data from TCGA database.
Subgroup analysis further revealed that high EXO1 expression was associated with poor OS in specific subgroups of patients with BRCA, including those with T2 stage, N1 stage, M0 stage, pathologic stage II, luminal B subtype of PAM50 classification, age <60 years, and infiltrating ductal carcinoma histological type (Supplementary Figures S1A–G). Additionally, high EXO1 expression levels were associated with poor PFI in female patients with THCA, as well as in THCA patients with left lobe of neoplasm location, no extrathyroidal extension, residual tumor classification of R0, and multifocal of primary neoplasm focus type (Supplementary Figures S1H–L). However, for BRCA patients with basal type of PAM50 classification (Supplementary Figure S1M), CESC patients with T2 stage, squamous cell carcinoma of histological type (Supplementary Figures S1N, O), and OV patients with FIGO stage IV (Supplementary Figure S1P), high EXO1 expression was associated with better OS.
In addition, high EXO1 expression was associated with worse OS in UCEC patients with clinical stage I, tumor invasion >50%, open surgical approach, residual tumor classification of R0, and histological type of endometroid (Supplementary Figures S2A–E). Furthermore, high expression levels of EXO1 were correlated with poor OS in patients with UCEC without radiation or hormonal therapy, or without diabetes (Supplementary Figures S2F–H). Within specific subgroups, high EXO1 expression was associated with poorer OS for White patients, or patients aged >60 years, post-menopausal, with height >160 cm, or weighing <80 kg (Supplementary Figures S2I–M).
To further illustrate the relationship between EXO1 expression, clinicopathological parameters, and prognosis in female-related cancers, univariate and multivariate Cox analyses were performed using TCGA data. The results revealed several independent risk factors for OS, PFI, and DSS in different cancer types. For predicting OS, M stage, age, menopause status, and radiation therapy were independent risk factors in BRCA. In UCEC, clinical stage and radiation therapy were independent risk factors. Pathologic stage and residual tumor were independent risk factors in THCA. Primary therapy outcome and tumor status were independent risk factors in OV. In CESC, T stage, N stage, tumor protein p53 (TP53) status, and primary therapy outcome were independent risk factors.
Lastly, primary therapy outcome was an independent risk factor in UCS (T3). Regarding PFI, M stage and PR status were independent risk factors in BRCA. In UCEC, clinical stage, primary therapy outcome, histological type, residual tumor and EXO1 were identified as independent risk factors. Similarly, M stage and EXO1 were independent risk factors in THCA. Primary therapy outcome and tumor status were independent risk factors in OV. For CESC, primary therapy outcome was an independent risk factor. TP53 status and radiation therapy were independent risk factors in UCS (Supplementary Table S1). For predicting DSS, N stage, M stage and EXO1 were identified as independent risk factors in BRCA. In UCEC, clinical stage, primary therapy outcome, histological type, residual tumor and radiation therapy were independent risk factors. Primary therapy outcome and tumor residual were independent risk factors in OV (Supplementary Table S2). Therefore, high EXO1 expression serves as a strong independent predictor of PFI in UCEC and THCA, as well as DSS in BRCA.
Table 3: Associations of overall survival (OS) with clinicopathologic characteristics in TCGA patients by univariate and multivariate analyses.
| Characteristics | Univariate analysis | Multivariate analysis | ||
|---|---|---|---|---|
| HR (95% CI) | P-value | HR (95% CI) | P-value | |
| BRCA | ||||
| T stage (T1 vs. T3&T4) | 1.953 (1.221-3.123) | 0.005 | 1.310 (0.372-4.606) | 0.674 |
| N stage | ||||
| N0 vs. N1 | 1.956 (1.329-2.879) | <0.001 | 0.740 (0.255-2.150) | 0.580 |
| N0 vs. N2 | 2.519 (1.482-4.281) | <0.001 | 1.377 (0.251-7.543) | 0.712 |
| N0 vs. N3 | 4.188 (2.316-7.574) | <0.001 | 3.070 (0.534-17.666) | 0.209 |
| M stage (M0 vs.M1) | 4.254 (2.468-7.334) | <0.001 | 18.655 (1.571-221.537) | 0.020 |
| Patdologic stage | ||||
| Stage I vs. Stage II | 1.697 (0.985-2.922) | 0.057 | 3.359 (0.709-15.914) | 0.127 |
| Stage I vs. Stage III | 2.962 (1.664-5.273) | <0.001 | 7.399 (0.773-70.798) | 0.082 |
| Stage I vs. Stage IV | 11.607 (5.569-24.190) | <0.001 | ||
| Age (<=60 vs. >60) | 2.020 (1.465-2.784) | <0.001 | 2.582 (1.232-5.411) | 0.012 |
| Menopause status (Pre vs. Post) | 2.162 (1.300-3.595) | 0.003 | 3.197 (1.089-9.386) | 0.034 |
| Radiation tderapy (No vs. Yes) | 0.576 (0.394-0.841) | 0.004 | 0.475 (0.236-0.956) | 0.037 |
| EXO1 (Low vs. High) | 1.416 (1.026-1.955) | 0.034 | 1.583 (0.688-3.641) | 0.280 |
| UCEC | ||||
| Clinical stage | ||||
| Stage I vs. Stage III | 3.078 (1.907-4.968) | <0.001 | 2.689 (1.123-6.442) | 0.026 |
| Stage I vs. Stage IV | 8.065 (4.488-14.495) | <0.001 | 2.686 (0.750-9.620) | 0.129 |
| Primary tderapy outcome (PD vs. CR) | 0.111 (0.060-0.205) | <0.001 | 0.353 (0.106-1.176) | 0.090 |
| Histological type | ||||
| Endometrioid vs. Mixed | 2.421 (1.036-5.655) | 0.041 | 3.382 (0.899-12.715) | 0.071 |
| Endometrioid vs. Serous | 2.667 (1.739-4.088) | <0.001 | 1.207 (0.533-2.735) | 0.652 |
| Histologic grade | ||||
| G1 vs. G2 | 7.117 (1.617-31.326) | 0.009 | 8.736 (1.088-70.150) | 0.041 |
| G1 vs. G3 | 13.241 (3.247-53.993) | <0.001 | 7.016 (0.876-56.189) | 0.066 |
| Age (<=60 vs. >60) | 1.847 (1.160-2.940) | 0.010 | 2.071 (0.952-4.502) | 0.066 |
| Tumor invasion (%) | 1.012 (1.008-1.016) | <0.001 | 1.006 (0.998-1.014) | 0.167 |
| Residual tumor (R0 vs. R2) | 5.527 (2.879-10.612) | <0.001 | 2.857 (0.843-9.683) | 0.092 |
| Radiation tderapy (No vs. Yes) | 0.594 (0.385-0.915) | 0.018 | 0.344 (0.167-0.707) | 0.004 |
| EXO1 (Low vs. High) | 1.761 (1.161-2.671) | 0.008 | 1.402 (0.745-2.638) | 0.294 |
| THCA | ||||
| Patdologic stage | ||||
| Stage I vs. Stage III | 9.733 (2.018-46.944) | 0.005 | 7.390 (0.782-69.860) | 0.081 |
| Stage I vs. Stage IV | 18.760 (3.601-97.751) | <0.001 | 18.800 (1.563-226.139) | 0.021 |
| Residual tumor (R0 vs. R1) | 4.033 (1.214-13.402) | 0.023 | 5.612 (1.142-27.574) | 0.034 |
| OV | ||||
| FIGO stage (Stage I&Stage II vs. Stage IV) | 2.495 (1.057-5.889) | 0.037 | 1.753 (0.399-7.709) | 0.457 |
| Primary tderapy outcome | ||||
| PD vs. SD | 0.441 (0.217-0.895) | 0.023 | 0.579 (0.269-1.246) | 0.162 |
| PD vs. CR | 0.152 (0.093-0.247) | <0.001 | 0.209 (0.119-0.367) | <0.001 |
| ERBB2 (Low vs. High) | 1.505 (1.160-1.952) | 0.002 | 1.299 (0.927-1.821) | 0.129 |
| Age (<=60 vs. >60) | 1.355 (1.046-1.754) | 0.021 | 1.323 (0.950-1.843) | 0.098 |
| Tumor residual (NRD vs. RD) | 2.313 (1.486-3.599) | <0.001 | 1.097 (0.636-1.892) | 0.739 |
| Tumor status (Tumor free vs. Witd tumor) | 9.576 (4.476-20.486) | <0.001 | 17.564 (4.270-72.248) | <0.001 |
| CESC | ||||
| T stage (T1 vs. T3&T4) | 4.019 (2.072-7.797) | <0.001 | 4736 (542 –41347) | <0.001 |
| N stage (N0 vs. N1) | 2.844 (1.446-5.593) | 0.002 | 0.028 (0.006-0.131) | <0.001 |
| TP53 | 0.757 (0.564-1.018) | 0.065 | 0.097 (0.054-0.173) | <0.001 |
| Clinical stage (Stage I vs. Stage IV) | 4.376 (2.354-8.137) | <0.001 | 1541253 (0.000-Inf) | 1.000 |
| Primary tderapy outcome (PD vs. CR) | 0.042 (0.022-0.082) | <0.001 | 0.000 (0.000-0.004) | <0.001 |
| UCS | ||||
| Clinical stage | ||||
| Stage I vs. Stage II&Stage III | 2.354 (1.020-5.435) | 0.045 | 0.109 (0.003-4.086) | 0.231 |
| Stage I vs. Stage IV | 2.817 (1.006-7.891) | 0.049 | 0.000 (0.000-Inf) | 0.999 |
| Primary tderapy outcome (PD vs. SD&PR&CR) | 0.105 (0.042-0.265) | <0.001 | 0.010 (0.000-0.422) | 0.016 |
| Histological type | ||||
| Heterologous Type vs. Homologous Type | 0.261 (0.094-0.723) | 0.010 | 0.473 (0.062-3.593) | 0.469 |
| Heterologous Type vs. NOS | 0.461 (0.219-0.971) | 0.042 | 0.183 (0.026-1.296) | 0.089 |
| Radiation tderapy (No vs. Yes) | 0.404 (0.197-0.829) | 0.013 | 9.174 (0.571-147.294) | 0.118 |
| Peritoneal wash (Negative vs. Positive) | 3.460 (1.415-8.459) | 0.007 | 6.150 (0.826-45.820) | 0.076 |
Development of a prognostic model based on EXO1 and clinical factors
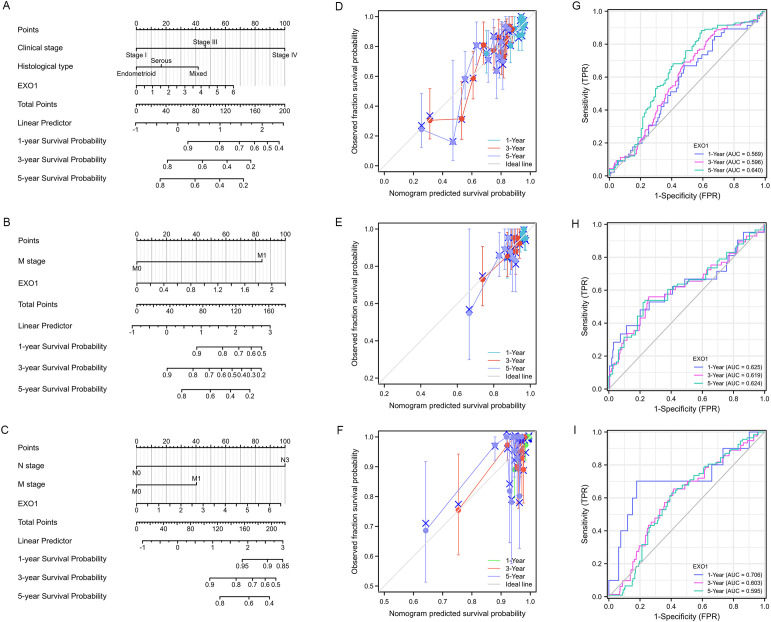
To improve the prognostic prediction of patient outcomes, nomograms were constructed as prediction models by integrating EXO1 expression and other significant clinical parameters determined by multivariate Cox analysis for PFI in UCEC (f4), THCA (f4), and DSS in BRCA (f4). The concordance-index values for the nomograms were 0.688, 0.648, and 0.721 for UCEC, THCA, and BRCA, respectively, indicating good agreement between the predicted outcomes and observed outcomes (f4). Additionally, the predictive performance of EXO1 expression was assessed using time-dependent ROC curves. In UCEC, the AUC values for predicting PFI were 0.569, 0.596, and 0.640 at 1, 3, and 5 years, respectively (f4). In THCA, the AUC values for predicting PFI were 0.625, 0.619, and 0.624 at 1, 3, and 5 years, respectively (f4). Moreover, in BRCA, the AUC values for predicting DSS were 0.706, 0.603, and 0.595 at 1, 3, and 5 years, respectively (f4). These findings suggest that the nomograms incorporating EXO1 expression may serve as useful models for predicting survival outcomes in UCEC, THCA, and BRCA.
Correlation between EXO1 mutation and prognosis in female-related cancers
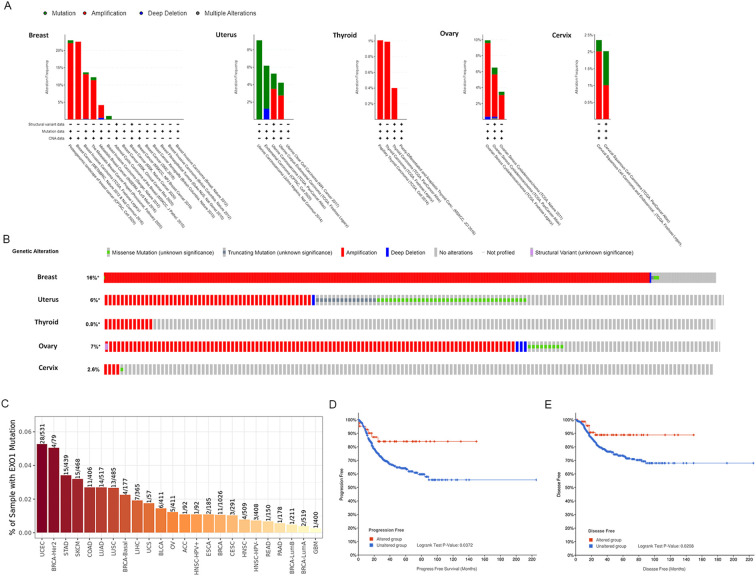
After confirming the prognostic value of EXO1, we utilized cBioPortal and TIMER 2.0 to analyze the genetic alterations in EXO1 across various female-related cancers. Analysis using the cBioPortal online tool revealed the presence of two or more alterations in EXO1 in different female-related cancers, with amplification and deep deletion alterations being more common in uterine, breast, thyroid, and OV samples (f5). The percentage of EXO1 gene alterations was 16% in BRCA samples, 6% in uterus cancer samples, 0.8% in THCA samples, 7% in OV samples and 2.6% in cervix cancer samples (f5). Results from TIMER 2.0 database demonstrated that among various types of cancers, UCEC had the highest mutation frequency for EXO1, with 28/531 cases showing mutations. The mutation frequencies for other cancers were as follows: 1/57, 5/411, and 3/291 cases in UCS, OV, and CESC, respectively (f5). In BRCA, the mutation frequency for EXO1 was 11/1,026 cases. Further analysis based on molecular subtypes revealed the following mutation frequencies: 4/177, 4/79, 2/519, and 1/211 cases in basal-like BRCA, BRCA-HER2, luminal A BRCA, and luminal B BRCA, respectively (f5). Subsequently, we assessed the genetic alterations in EXO1 and their associations with the prognosis of patients with female-related cancer. Our findings indicated that genetic alterations in EXO1 were associated with improved progression-free survival and disease-free survival in patients with UCEC (f5). These results suggest that the genetic mutations of EXO1 also impact the prognosis of patients with UCEC.
Correlation between EXO1 methylation status and prognosis in female-related cancers
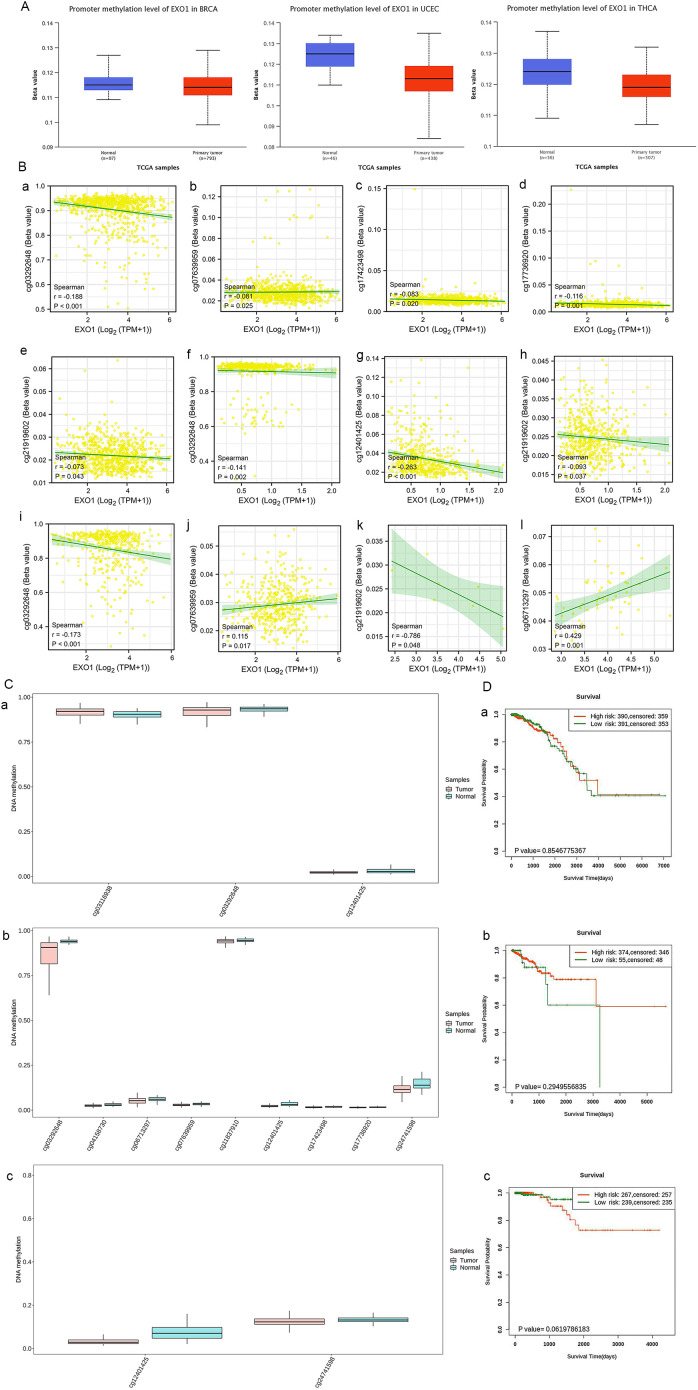
After confirming the presence of EXO1 alterations, we investigated the association between mRNA expression of EXO1 and its methylation status in selected cancers. Analysis of data from TCGA database through the UALCAN webpage revealed that the promoter methylation level of EXO1 was significantly lower in tumor tissues compared to normal tissues in various cancers, including BRCA, UCEC, and THCA (f6). Further analysis was conducted to examine the relationship between EXO1 methylation and gene expression. The results showed negative correlation between the methylation of five specific CpG sites (cg03292648, cg07639959, cg17423498, cg17736920, cg21919602) and EXO1 gene expression in BRCA, three CpG sites (cg03292648, cg12401425, cg21919602) and EXO1 gene expression in THCA; one CpG site (cg03292648) negatively and one CpG site (cg06713297) positively correlated with EXO1 gene expression in UCEC; one CpG site (cg21919602) negatively correlated with EXO1 gene expression in OV; one CpG site (cg06713297) positively correlated with EXO1 gene expression in UCS (f6). Additionally, using the SurvivalMeth tool, significant differences in the expression of individual CpG site methylation of EXO1 were observed between tumor tissues and normal tissues in BRCA, UCEC, and THCA (f6). However, no significant prognostic correlation was found between high- and low-risk groups in female-related cancers (f6). These findings suggest that DNA methylation may be associated with EXO1 expression, but may not be related to the prognosis in female-related cancers.
Function and pathway enrichment analysis of EXO1 in female-related cancers
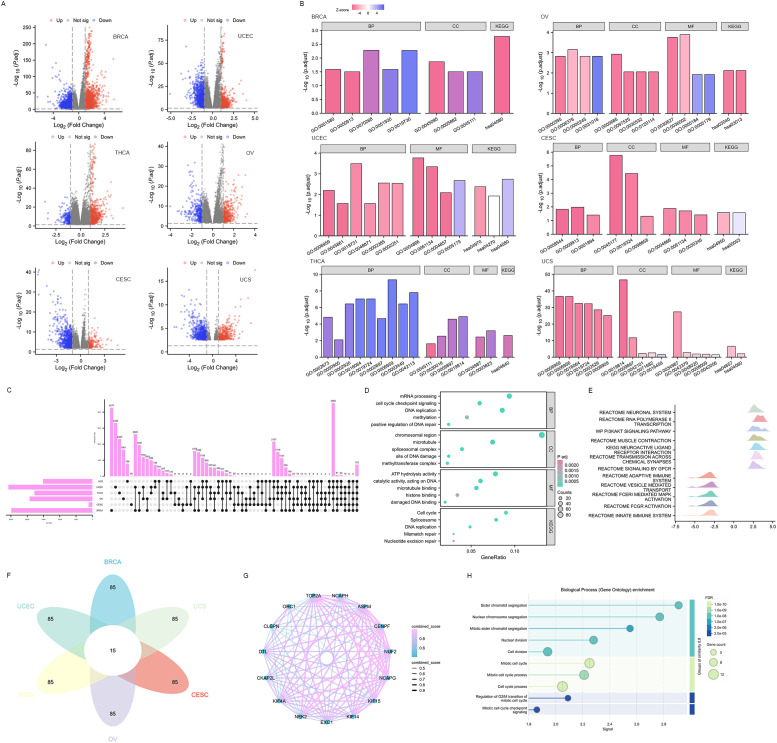
DEGs were identified between high and low EXO1 expression groups in different female-related cancers. The analysis revealed 629 DEGs (274 upregulated and 355 downregulated) in BRCA and 120 DEGs (37 upregulated and 83 downregulated) in UCEC, and fewer DEGs in THCA, OV, CESC, and UCS (f7 and Supplementary Table S3). Functional enrichment analysis showed that the DEGs were involved in processes related to the regulation of cell differentiation, regulation of immune/inflammatory response, as well as chemokine and chemokine receptor activity. KEGG pathway enrichment analysis revealed that the DEGs were mainly associated with cell cycle, DNA replication, DNA repair mechanisms, interleukin 17 (IL17) signaling pathway, and cytokine-cytokine receptor interaction (f7 and Supplementary Table S4). Furthermore, a total of 723 EXO1-correlated genes were identified in all cancer types (f7). These genes were enriched in cell cycle regulation, DNA repair (replication, mismatch/nucleotide excision repair), and epigenetic modulation (methylation, methyl-transferase complexes) via molecular functions such as DNA/microtubule/histone binding and ATP-dependent catalysis (f7). GSEA pathway analysis further indicated that high EXO1 expression was upregulated in pathways related to the phosphatidylinositol 3 kinase-protein kinase B (PI3K-AKT) signaling pathway, muscle contraction, and transmission across chemical synapses. Meanwhile, pathways such as signaling by G protein-coupled receptor (GPCR), adaptive immune system, vesicle-mediated transport, Fc epsilon receptor I-mediated (FCER I-mediated) mitogen-activated protein kinase (MAPK) activation, Fc gamma receptor (FCGR) activation, and innate immune system were downregulated (f7). Based on the correlation strength, we identified the top 100 genes significantly associated with EXO1 in each of the six cancer types and determined their intersection, yielding 15 genes that exhibited consistent high correlation with EXO1 across all six cancers (f7). The STRING-based protein interaction network of EXO1 (high-confidence score ≥0.7) revealed a tightly clustered module with 15 nodes and 98 edges, demonstrating exceptionally significant interaction enrichment (f7). Functional annotation highlighted EXO1’s predominant involvement in mitotic regulation and chromosome dynamics (f7). These pathways are frequently associated with oncogenesis and immune-related processes, including immunotherapy and cell chemotaxis.
Correlations between EXO1 expression and tumor immune infiltration cells
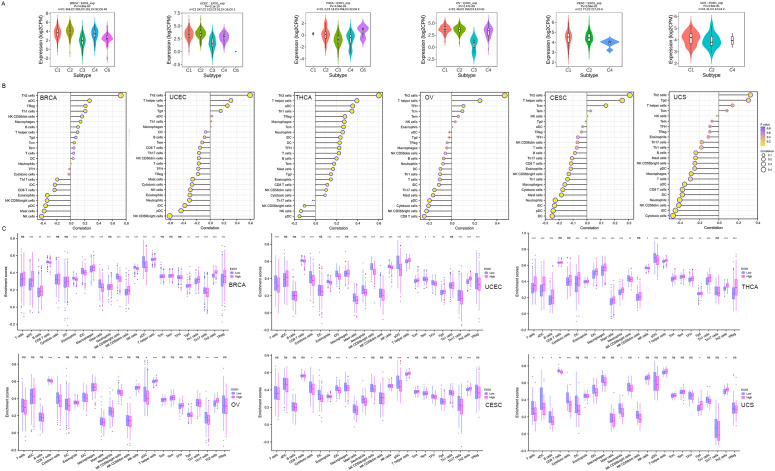
We investigated the relationship between EXO1 expression and immune cell subtypes in female-related cancers using the TISIDB database. Our analysis revealed significantly associations between EXO1 expression and different immune cell subtypes in BRCA, UCEC, THCA, OV, and CESC (f8). Furthermore, we explored the correlations between EXO1 expression and the infiltration of 24 types of TIICs into the tumor microenvironment. The results revealed that EXO1 expression is positively correlated with the infiltration of T helper 2 (Th2) cells and T helper cells, and negatively correlated with natural killer (NK) CD56bright cells and plasmacytoid dendritic cells (pDC) in all six cancer types (f8). Our analysis also revealed cancer subtype-specific patterns, in BRCA and THCA, EXO1 showed positive associations with regulatory T cells (Tregs) and activated dendritic cells (aDC), whereas UCEC and OV exhibited inverse correlations with cytotoxic CD8+ T cells. In CESC and UCS, EXO1 exhibited mixed immunomodulatory profiles involving positive correlations with T helper cells, alongside broad negative associations with cytotoxic populations and dendritic cell subsets (detailed in f8 and Supplementary Table S5). We further compared the enrichment scores of immune cells in the high and low EXO1 expression groups. The results consistently showed that the infiltration levels of Th2 cells were higher in the high EXO1 expression group across all six cancer types (f8). In summary, our findings suggest that high EXO1 expression is associated with increased infiltration of Th2 cells in female-related cancers.
EXO1 modulates immune regulatory networks and therapeutic responses
We further investigated the associations between EXO1 and several well-established immune checkpoint genes. Our analysis revealed that EXO1 expression was broadly correlated with immune regulatory molecules across female-related cancers. It showed positive associations with inhibitory checkpoints such as programmed cell death 1 (PDCD1), cytotoxic T-lymphocyte associated protein 4 (CTLA4), and transforming growth factor beta receptor 1 (TGFBR1), as well as immune stimulators like CD40 and C-X-C motif chemokine receptor 4 (CXCR4). However, in UCS, EXO1 expression was inversely related to T cell immunoreceptor with Ig and ITIM domains (TIGIT) and colony stimulating factor 1 receptor (CSF1R) (f9; Supplementary Table S6). Cell chemotaxis plays a role in functional enrichment, and chemokines and chemokine receptors mediate the movement of tumor cells and immune cells. Thus, we explored the correlation between EXO1 and chemokines/chemokine receptors in female-related cancers. Our analysis showed two prominent patterns. One pattern was a Th2/chemotaxis axis characterized by strong positive correlations with C-C motif chemokine receptor 8 (CCR8), CXCR4, and Th2-associated chemokines such as C-C motif chemokine ligand 7 (CCL7), CCL13 and CCL18. The other pattern was characterized by inflammatory suppression marked by negative links to C-X-3-C motif chemokine receptor 1 (CX3CR1) and pro-inflammatory chemokines (CCL14/16) (f9; Supplementary Table S7).
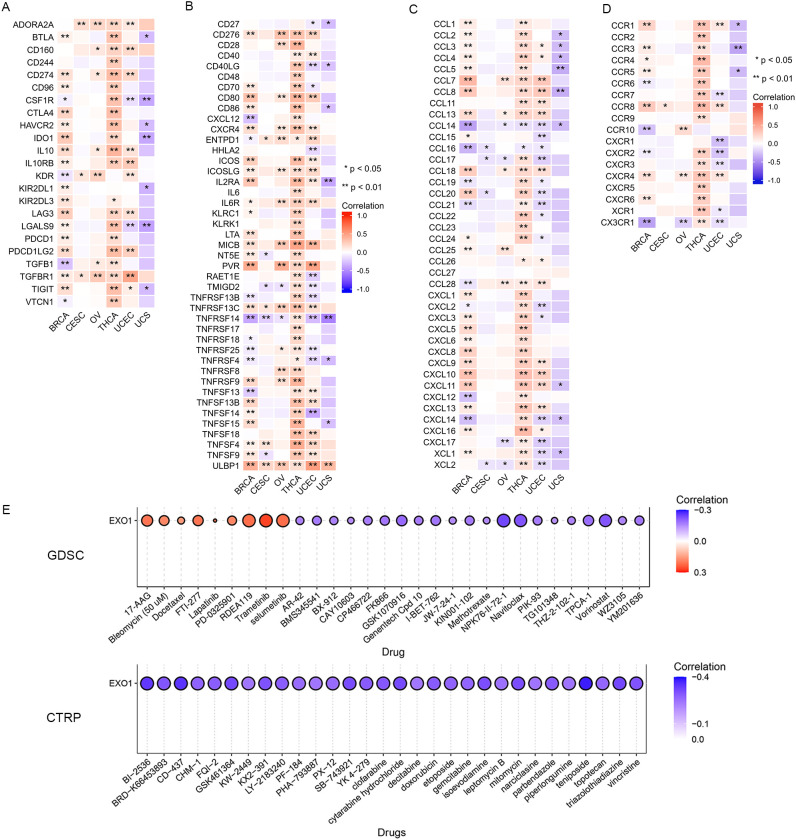
Lastly, we investigated the correlation between EXO1 expression and drug sensitivity in cancers. We found high EXO1 expression predicted sensitivity to MEK inhibitors (trametinib, selumetinib) and resistance to HDAC inhibitors (vorinostat) and apoptosis-targeting agents (navitoclax) (f9). These findings position EXO1 as a potential biomarker for Th2-polarized immune microenvironments and a predictor of therapeutic vulnerability in female-related cancers.
Discussion
DNA damage and repair signaling pathways have been shown to play a critical role in maintaining genomic stability. Defects in these pathways can have dual effects, contributing to tumorigenesis while also rendering cancer cells vulnerable to DNA damage and reliant on DNA repair and signaling activity (ref. 30). EXO1 has been implicated in multiple DNA repair pathways that safeguard DNA replication, including mismatch repair, translation synthesis, homologous recombination, and cell cycle regulation (ref. 14). Given its central role in replication and post-replication processes, including checkpoint activation, it is likely that dysfunction of EXO1 may perturb chromosomal stability and disrupt other DNA repair pathways. This can lead to replication stress, translocations, transformation, and cell death, ultimately resulting in genomic instability and the development of cancer (ref. 31).
Several lines of evidence suggest that EXO1 is overexpressed in certain tumor cells and may serve as a candidate susceptibility gene for breast, ovarian, lung, and gastrointestinal cancers. It also holds potential as a target for cancer therapy due to its increased expression in tumors (ref. 32–ref. 36). However, the precise role of EXO1 in the development of various female-related cancers, particularly through the DNA damage and repair signaling pathway, remains unknown. Therefore, the aim of this study was to provide an overview of the EXO1 gene in multiple female-related cancers. We conducted a comprehensive evaluation of the potential roles of EXO1 in different female-related cancers using RNA-seq data from TCGA database. This analysis included EXO1 gene expression patterns, prognostic values, genetic mutations, DNA methylation, immune infiltration, gene interactions, and drug sensitivities. By exploring these aspects, we sought to shed light on the broader landscape of EXO1 in female-related cancers and unravel its potential implications for disease progression and treatment response.
Our study demonstrated high EXO1 expression in multiple female-related cancers, including BRCA, CESC, OV, THCA, UCEC, and UCS, compared to healthy controls. This finding aligns with previous studies that have also reported overexpression of EXO1 in various cancer types, such as breast, ovarian, lung, liver, prostate, bladder, and melanoma (ref. 35, ref. 37–ref. 45). In addition to its overexpression in tumor tissues, we observed that EXO1 showed a strong discriminatory ability between female-related tumors and normal tissues, except UCS. Given that EXO1 plays a crucial role in regulating the cell cycle and DNA repair processes (ref. 46, ref. 47), it is expected to be upregulated in proliferating cells, particularly in cancer cells characterized by an active cell cycle and high proliferation rate. Therefore, the higher expression of EXO1 in tumor tissues is consistent with this expectation.
In addition, we observed significant and distinct associations between EXO1 expression levels and clinicopathological characteristics in the six aforementioned female-related cancers. For example, EXO1 was found to be expressed at higher levels in Asians compared to White patients with BRCA and CESC. It was also higher in patients with UCEC and UCS who received radiation therapy. Moreover, EXO1 expression was elevated in pathologic stage II of BRCA, FIGO stage I–II of OV, and histologic grade 3 of UCEC and CESC. Additionally, in BRCA and CESC, EXO1 expression was higher in patients aged <60 years, whereas in UCEC, it was higher in patients aged >60 years. These findings indicate that, although EXO1 expression is increased in various female-related cancers, there may be distinct patterns of expression across different cancer types.
Furthermore, we conducted Kaplan-Meier survival analysis to evaluate the prognostic value of EXO1 in female-related cancers. High EXO1 expression was significantly associated with worse OS, PFI, and DSS in BRCA and UCEC, and correlated with worse PFI in THCA. Moreover, considering the different associations between EXO1 expression and clinicopathological characteristics, we analyzed the correlations between EXO1 expression and prognosis in different subgroups based on clinical parameters in patients with female-related cancers. The results suggested that higher EXO1 expression was generally associated with worse OS across most clinical subgroups. However, in specific subgroups, such as the basal type of PAM50 classification in BRCA, T2 stage or squamous cell carcinoma in CESC, and FIGO stage IV in OV, higher EXO1 expression was associated with better OS. We hypothesized that this could be related to increased DNA repair capacity mediated by EXO1, possibly due to lymphocyte infiltration or invasion of adjacent organs in these subgroups. Moreover, through univariate and multivariate Cox regression analyses, we identified clinical stage, primary therapy outcome, histological type, residual tumor, and EXO1 expression levels as independent risk factors for PFI in UCEC, M stage, and EXO1 expression level as independent risk factors for PFI in THCA, and N stage, M stage, and EXO1 expression levels as independent risk factors for DSS in BRCA. Based on these findings, we constructed nomograms that integrated EXO1 expression and these clinical parameters to predict PFI in UCEC and THCA, and DSS in BRCA. These results are consistent with those of previous studies that have also identified EXO1 as a potential prognostic marker in BRCA, OV, lung cancer, and liver cancer (ref. 38). Our data further support the notion that EXO1 has predictive and prognostic value and may serve as a biomarker in certain female-related cancers.
Previous reports have suggested that mutations in the EXO1 gene can lead to protein dysfunction and increased susceptibility to certain cancers (ref. 48). In our genetic mutation analysis, we observed a higher frequency of EXO1 mutations in UCEC and BRCA compared to other female-related cancers. Interestingly, EXO1 mutation was associated with a better prognosis in UCEC, but did not show a significant association with prognosis in the other five female-related cancers. Additionally, DNA methylation can influence gene expression levels and impact patient prognosis. Our study revealed that DNA methylation levels in the EXO1 gene were significantly lower in tumor tissues compared to normal tissues in BRCA, UCEC, and THCA. This result is consistent with our findings of upregulated EXO1 expression in those cancers. However, the DNA methylation levels of EXO1 did not show a significant prognostic correlation in the female-related cancers we analyzed. Based on these observations, we speculate that gene alterations and methylation changes in EXO1 may not be the main driving factors in the development of female-related cancers or affecting patient prognosis. Other mechanisms and factors are likely involved in the pathogenesis and prognosis of these cancer types. Further studies are needed to explore additional molecular and biological processes that contribute to the development and progression of female-related cancers.
To further investigate the biological function of EXO1 in female-related cancers, we conducted differential gene expression analysis between high and low EXO1 expression groups, as well as correlation analysis of EXO1 with other expressed genes using TCGA data. We identified hundreds of DEGs and correlated genes, which we further subjected to functional enrichment analysis. The results of the functional enrichment analysis revealed that the DEGs were associated with various pathways involved in cell cycle, oncogenesis, and immune-related processes in female-related cancers. These pathways included DNA replication, DNA repair, regulation of cell differentiation, inflammatory response, chemokine and chemokine receptor activity, PI3K-AKT signaling pathway, signaling by GPCR, FCER I-mediated MAPK activation, and FCGR activation. To evaluate the relationship between EXO1 expression and immune-related factors, we examined the associations between EXO1 expression and immune inhibitors, immune stimulators, chemokines, and chemokine receptors in female-related cancers. Interestingly, we found that in UCS, EXO1 was negatively associated with certain immune inhibitors, immune stimulators, chemokines, and chemokine receptors. However, in BRCA, OV, THCA, and UCEC, EXO1 was positively associated with most of these factors. From another perspective, we observed significant positive correlations between EXO1 expression and TGFBR1 and ULBP1 in most female-related cancers, while a negative correlation was found with TNFRSF14 (herpesvirus entry mediator). Previous studies have implicated TGFBR1 polymorphic variants in bladder cancer risk and prognosis (ref. 34, ref. 49). Moreover, ULBP1 has been shown to promote immune escape via PDCD1LG1 in hepatocellular carcinoma (HCC) (ref. 50). Furthermore, increased expression of TNFRSF14 has been associated with favorable prognosis in bladder cancer and BRCA (ref. 51, ref. 52). Taken together, these findings suggest that these molecules serve as potential targets for EXO1 in different female-related cancers.
Additionally, our analysis of chemokines revealed a strong positive correlation between EXO1 expression and CCL7, CCL13, and CCL18 in BRCA, OV, THCA, and UCEC, while a negative correlation was observed with CCL14 and CCL16 in most female-related cancers. In terms of chemokine receptors, EXO1 showed a high positive correlation with CCR8 and CXCR4, while a negative correlation was found with CX3CR1 in most female-related cancers. These observations are in line with previous reports highlighting the crucial roles of CC chemokines in immune cell functioning (ref. 53). For example, CCL18 has been shown to promote the proliferation of oral squamous cell carcinoma cells and recruit naive CD4+ T cells into the tumor microenvironment, leading to their differentiation into regulatory T cells that contribute to tumor immune evasion (ref. 54, ref. 55). CCL14 has been associated with suppression of HCC progression, promotion of HCC cell apoptosis, and longer OS in patients with HCC (ref. 56). Increased CCR8 expression has been observed in tumor cells of malignant melanoma and is involved in metastasis to peripheral lymphoid organs (ref. 57). These results suggest a potential role of EXO1 in the development and modulation of the tumor immune microenvironment in female-related cancers through its association with these chemokines and receptors.
To further explore the association between EXO1 and cancer immunity, we investigated the relationship between EXO1 expression and different immune subtypes using the TISIDB database. Our findings indicated that EXO1 expression was significantly associated with immune subtypes in five of the six female-related cancers analyzed, showing higher expression in C1 (wound healing) and C2 (interferon-gamma [IFNG] dominant) subtypes, but lower expression in C3 (inflammatory) subtypes. Notably, our analysis of immune infiltration revealed that EXO1 expression was positively correlated with the infiltration of Th2 cells and Th cells, while it was negatively correlated with NK CD56bright cells and pDC. Moreover, we consistently observed higher infiltration levels of Th2 cells in the high EXO1 expression groups across all six cancer types. Th2 cells are elevated in human cancers and secrete various effector cytokines, such as IL4, IL5, IL6, IL10, and IL13 (ref. 58, ref. 59). Patients with a dominant Th2 response in the tumor microenvironment have been associated with poorer prognosis (ref. 13). In our study, the increased infiltration of Th2 cells in the context of EXO1 overexpression may contribute to an imbalance between Th1 and Th2 responses, enabling tumor cells to evade immunity. Furthermore, it has been reported that EXO1 overexpression leads to indefinite DNA excision, resulting in chromosomal abnormalities and the release of nuclear DNA into the cytoplasm. This activates the cyclic GMP-AMP synthase-stimulator of interferon response cGAMP interactor (cGAS-STING) pathway, which plays a critical regulatory role in tumor immunity (ref. 60).
In this study, through bioinformatics analyses, we demonstrated that EXO1 is closely associated with immune cell infiltration and immune molecule expression, suggesting its potential as a predictor of prognosis and response to immunotherapy in patients with various female-related cancers. Finally, our study revealed that EXO1 may be associated with the sensitivity to multiple anticancer drugs that inhibit proliferation or interfere with the cell cycle of cancer cells. This implies that EXO1 may serve as a biomarker for predicting drug sensitivity.
Conclusions
Collectively, the present data indicate that EXO1 may play a role in the development and therapeutic response of female-related cancers by affecting multiple pathways, such as DNA repair, cell cycle regulation, immune microenvironmental regulation, and chemotherapeutic drug sensitivity.
References
- J Ferlay, M Colombet, I Soerjomataram, DM Parkin, M Piñeros, A Znaor. Cancer statistics for the year 2020: An overview.. Int J Cancer. (, 2021. [DOI]
- RL Siegel, AN Giaquinto, A Jemal. Cancer statistics, 2024.. CA Cancer J Clin. (, 2024. [DOI | PubMed]
- W Chen, R Zheng, PD Baade, S Zhang, H Zeng, F Bray. Cancer statistics in China, 2015.. CA Cancer J Clin. (, 2016. [DOI]
- S Lin, K Gao, S Gu, L You, S Qian, M Tang. Worldwide trends in cervical cancer incidence and mor-tality, with predictions for the next 15 years.. Cancer. (, 2021. [DOI]
- RL Siegel, KD Miller, A Jemal. Cancer statistics, 2020.. CA Cancer J Clin. (, 2020. [DOI | PubMed]
- J Huang, WC Chan, CH Ngai, V Lok, L Zhang, DE Lucero-Prisno. Worldwide burden, risk factors, and temporal trends of ovarian cancer: A global study.. Cancers (Basel). (, 2022. [DOI | PubMed]
- C Xia, X Dong, H Li, M Cao, D Sun, S He. Cancer statistics in China and United States, 2022: profiles, trends, and determinants.. Chin Med J (Engl). (, 2022. [DOI]
- JB Shank, C Are, CD Wenos. Thyroid cancer: global burden and trends.. Indian J Surg Oncol. (, 2022. [DOI]
- L Shobab, KD Burman, L Wartofsky. Sex differences in differentiated thyroid cancer.. Thyroid. (, 2022. [DOI]
- M El-Shemerly, P Janscak, D Hess, J Jiricny, S Ferrari. Degradation of human exonuclease 1b upon DNA synthesis inhibition.. Cancer Res. (, 2005. [DOI]
- E Bolderson, DJ Richard, W Edelmann, KK Khanna. Involvement of Exo1b in DNA damage-induced apoptosis.. Nucleic Ac-ids Res. (, 2009. [DOI]
- G Keijzers, D Bakula, MA Petr, NGK Madsen, A Teklu, G Mkrtchyan. Human exonuclease 1 (EXO1) regulatory functions in DNA replication with putative roles in cancer.. Int J Mol Sci. (, 2018. [DOI | PubMed]
- J Guan, C Lu, Q Jin, H Lu, X Chen, L Tian. MLH1 deficiency-triggered DNA hyperexcision by exonuclease 1 activates the cGAS-STING pathway.. Cancer Cell. (, 2021. [DOI | PubMed]
- S Sertic, R Quadri, F Lazzaro, M Muzi-Falconi. EXO1: A tightly regulated nuclease.. DNA Repair (Amst). (, 2020. [DOI | PubMed]
- K Lawrenson, ES Iversen, J Tyrer, RP Weber, P Concannon, DJ Hazelett. Common variants at the CHEK2 gene locus and risk of epithelial ovarian cancer.. Car-cinogenesis. (, 2015. [DOI]
- J Zhou, Y Wang, Y Wang, X Yin, Y He, L Chen. FOXM1 modulates cisplatin sensitivity by regulating EXO1 in ovarian cancer.. PloS One. (, 2014. [DOI | PubMed]
- K Wei, AB Clark, E Wong, MF Kane, DJ Mazur, T Parris. Inactivation of Exonuclease 1 in mice results in DNA mismatch repair defects, increased cancer susceptibility, and male and female sterility.. Genes Dev. (, 2003. [DOI]
- J Vivian, AA Rao, FA Nothaft, C Ketchum, J Armstrong, A Novak. Toil enables reproducible, open source, big biomedical data analyses.. Nat Biotechnol. (, 2017. [DOI]
- Z Tang, B Kang, C Li, T Chen, Z Zhang. GEPIA2: an enhanced web server for large-scale expression profiling and inter-active analysis.. Nucleic Acids Res. (, 2019. [DOI]
- X Robin, N Turck, A Hainard, N Tiberti, F Lisacek, JC Sanchez. pROC: an open-source package for R and S+ to analyze and compare ROC curves.. BMC Bioinf. (, 2011. [DOI]
- A Iasonos, D Schrag, GV Raj, KS Panageas. How to build and interpret a nomogram for cancer prognosis.. J Clin Oncol. (, 2008. [DOI]
- J Liu, T Lichtenberg, KA Hoadley, LM Poisson, AJ Lazar, AD Cherniack. An integrated TCGA pan-cancer clinical data resource to drive high-quality survival outcome analytics.. Cell. (, 2018. [DOI | PubMed]
- J Gao, BA Aksoy, U Dogrusoz, G Dresdner, B Gross, SO Sumer. Integrative analysis of complex cancer genomics and clinical profiles using the cBioPortal.. Sci Signal. (, 2013. [DOI | PubMed]
- DS Chandrashekar, B Bashel, SAH Balasubramanya, CJ Creighton, I Ponce-Rodriguez, BVSK Chakravarthi. UALCAN: A portal for facilitating tumor subgroup gene expression and survival analyses.. Neoplasia. (, 2017. [DOI]
- C Zhang, N Zhao, X Zhang, J Xiao, J Li, D Lv. SurvivalMeth: a web server to investigate the effect of DNA methylation-related functional elements on prognosis.. Brief Bioinform. (, 2021. [DOI | PubMed]
- MI Love, W Huber, S Anders. Moderated estimation of fold change and dispersion for RNA-seq data with DESeq2.. Genome Biol. (, 2014. [DOI | PubMed]
- G Yu, LG Wang, Y Han, QY He. clusterProfiler: an R package for comparing biological themes among gene clusters.. OMICS. (, 2012. [DOI]
- B Ru, CN Wong, Y Tong, JY Zhong, SSW Zhong, WC Wu. TISIDB: an integrated repository portal for tumor-immune system interactions.. Bioinformatics. (, 2019. [DOI]
- G Bindea, B Mlecnik, M Tosolini, A Kirilovsky, M Waldner, AC Obenauf. Spatiotemporal dynamics of intratumoral immune cells reveal the immune landscape in human cancer.. Immunity. (, 2013. [DOI]
- JL Hopkins, L Lan, L Zou. DNA repair defects in cancer and therapeutic opportunities.. Genes Dev. (, 2022. [DOI]
- G Keijzers, D Liu, LJ Rasmussen. Exonuclease 1 and its versatile roles in DNA repair.. Crit Rev Biochem Mol Biol. (, 2016. [DOI]
- MH Tsai, HC Tseng, CS Liu, CL Chang, CW Tsai, YA Tsou. Interaction of Exo1 genotypes and smoking habit in oral cancer in Taiwan.. Oral Oncol. (, 2009. [DOI]
- HC Wang, CF Chiu, RY Tsai, YS Kuo, HS Chen, RF Wang. Association of genetic polymorphisms of EXO1 gene with risk of breast cancer in Taiwan.. Anticancer Res. (, 2009
- M Zhang, D Zhao, C Yan, L Zhang, C Liang. Associations between nine polymorphisms in EXO1 and cancer susceptibility: A systematic review and meta-analysis of 39 case-control studies.. Sci Rep. (, 2016. [DOI | PubMed]
- Y Dai, Z Tang, Z Yang, L Zhang, Q Deng, X Zhang. EXO1 overexpression is associated with poor prog-nosis of hepatocellular carcinoma patients.. Cell Cycle. (, 2018. [DOI]
- M Muthuswami, V Ramesh, S Banerjee, S Viveka Thangaraj, J Periasamy, D Bhaskar Rao. Breast tumors with elevated expression of 1q candidate genes confer poor clinical outcome and sensitivity to Ras/PI3K inhibition.. PloS One. (, 2013. [DOI | PubMed]
- Y Li, Y Wang, W Zhang, X Wang, L Chen, S Wang. BKM120 sensitizes BRCA-proficient triple negative breast cancer cells to olaparib through regulating FOXM1 and Exo1 expression.. Sci Rep. (, 2021. [DOI | PubMed]
- J Liu, J Zhang. Elevated EXO1 expression is associated with breast carcinogenesis and poor prognosis.. Ann Transl Med. (, 2021. [DOI | PubMed]
- D He, T Li, M Sheng, B Yang. Exonuclease 1 (Exo1) participates in mammalian non-homologous end joining and contrib-utes to drug resistance in ovarian cancer.. Med Sci Monit. (, 2020. [DOI | PubMed]
- CS Zhou, MT Feng, X Chen, Y Gao, L Chen, LD Li. Exonuclease 1 (EXO1) is a potential prognostic bi-omarker and correlates with immune infiltrates in lung adenocarcinoma.. Onco Targets Ther. (, 2021. [DOI]
- G Yang, K Dong, Z Zhang, E Zhang, B Liang, X Chen. EXO1 plays a carcinogenic role in hepatocellular carci-noma and is related to the regulation of FOXP3.. J Cancer. (, 2020. [DOI]
- F Luo, Y Wang, D Lin, J Li, K Yang. Exonuclease 1 expression is associated with clinical progression, metastasis, and sur-vival prognosis of prostate cancer.. J Cell Biochem. (, 2019. [DOI]
- PC Teng, SP Huang, CH Liu, TY Lin, YC Cho, YL Lai. Identification of DNA damage repair-associated prognostic biomarkers for prostate cancer using transcriptomic data analysis.. Int J Mol Sci. (, 2021. [DOI | PubMed]
- J Fan, Y Zhao, H Yuan, J Yang, T Li, Z He. Phospholipase C-ϵ regulates bladder cancer cells via ATM/EXO1.. Am J Cancer Res. (, 2020
- F Song, AA Qureshi, J Zhan, CI Amos, JE Lee, Q Wei. Exonuclease 1 (EXO1) gene variation and melanoma risk.. DNA Repair. (, 2012. [DOI]
- X Chen, IK Kim, Y Honaker, SC Paudyal, WK Koh, M Sparks. 14-3–3 proteins restrain the Exo1 nuclease to prevent overresection.. J Biol Chem. (, 2015. [DOI]
- X Chen, SC Paudyal, RI Chin, Z You. PCNA promotes processive DNA end resection by Exo1.. Nucleic Acids Res. (, 2013. [DOI]
- H Imtiaz, S Afroz, MA Hossain, SF Bellah, MM Rahman, MS Kadir. Genetic polymor-phisms in CDH1 and Exo1 genes elevate the prostate cancer risk in Bangladeshi population.. Tumour Biol. (, 2019. [DOI | PubMed]
- A Castillejo, N Rothman, C Murta-Nascimento, N Malats, M García-Closas, A Gómez-Martínez. TGFB1 and TGFBR1 polymorphic variants in relationship to bladder cancer risk and prognosis.. Int J Cancer. (, 2009. [DOI]
- F Qi, X Du, Z Zhao, D Zhang, M Huang, Y Bai. Tumor mutation burden-associated LINC00638/miR-4732-3p/ULBP1 axis promotes immune escape via PD-L1 in hepatocellular carcinoma.. Front Oncol. (, 2021. [DOI | PubMed]
- YD Zhu, MY Lu. Increased expression of TNFRSF14 indicates good prognosis and inhibits bladder cancer proliferation by promoting apoptosis.. Mol Med Rep. (, 2018. [DOI]
- Q Chen, H Jun, C Yang, F Yang, Y Xu. The pyroptosis-related risk genes APOBEC3D, TNFRSF14, and RAC2 were used to evaluate prognosis and as tumor suppressor genes in breast cancer.. J Oncol. (, 2022. [DOI | PubMed]
- CE Hughes, RJB Nibbs. A guide to chemokines and their receptors.. FEBS J. (, 2018. [DOI]
- X Jiang, J Liu, S Li, B Jia, Z Huang, J Shen. CCL18-induced LINC00319 promotes proliferation and metastasis in oral squamous cell carcinoma via the miR-199a-5p/FZD4 axis.. Cell Death Dis. (, 2020. [DOI | PubMed]
- S Su, J Liao, J Liu, D Huang, C He, F Chen. Blocking the recruitment of naive CD4+ T cells reverses immunosuppression in breast cancer.. Cell Res. (, 2017. [DOI]
- M Zhu, W Xu, C Wei, J Huang, J Xu, Y Zhang. CCL14 serves as a novel prognostic factor and tumor suppressor of HCC by modulating cell cycle and promoting apoptosis.. Cell Death Dis. (, 2019. [DOI | PubMed]
- S Das, E Sarrou, S Podgrabinska, M Cassella, SK Mungamuri, N Feirt. Tumor cell entry into the lymph node is controlled by CCL1 chemokine expressed by lymph node lymphatic sinuses.. J Exp Med. (, 2013. [DOI]
- X Zhao, J Liu, S Ge, C Chen, S Li, X Wu. Saikosaponin A inhibits breast cancer by regulating th1/th2 balance.. Front Pharmacol. (, 2019. [DOI | PubMed]
- L De Monte, M Reni, E Tassi, D Clavenna, I Papa, H Recalde. Intratumor T helper type 2 cell infiltrate correlates with cancer-associated fibroblast thymic stromal lymphopoietin production and reduced survival in pancreatic cancer.. J Exp Med. (, 2011. [DOI]
- Y Gan, X Li, S Han, Q Liang, X Ma, P Rong. The cGAS/STING Pathway: A novel target for cancer therapy.. Front Immunol. (, 2022. [DOI | PubMed]