Targeting miR‐31 represses tumourigenesis and dedifferentiation of BRAFV600E‐associated thyroid carcinoma
Abstract
Background:
BRAFV600E is the most common genetic mutation in differentiated thyroid cancer (DTC) occurring in 60% of patients and drives malignant tumour cell phenotypes including proliferation, metastasis and immune‐escape. BRAFV600E‐mutated papillary thyroid cancer (PTC) also displays greatly reduced expression of thyroid differentiation markers, thus tendency to radioactive iodine (RAI) refractory and poor prognosis. Therefore, understanding the molecular mechanisms and main oncogenic events underlying BRAFV600E will guide future therapy development.
Methods:
Bioinformatics and clinical specimen analyses, genetic manipulation of BRAFV600E‐induced PTC model, functional and mechanism exploration guided with transcriptomic screening, as well as systematic rescue experiments were applied to investigate miR‐31 function within BRAFV600E‐induced thyroid cancer development. Besides, nanoparticles carrying miR‐31 antagomirs were testified to alleviate 131I iodide therapy on PTC models.
Results:
We identify miR‐31 as a significantly increased onco‐miR in BRAFV600E‐associated PTC that promotes tumour progression, metastasis and RAI refractoriness via sustained Wnt/β‐catenin signalling. Mechanistically, highly activated BRAF/MAPK pathway induces miR‐31 expression via c‐Jun‐mediated transcriptional regulation across in vitro and transgenic mouse models. MiR‐31 in turn facilitates β‐catenin stabilisation via directly repressing tumour suppressors CEBPA and DACH1, which direct the expression of multiple essential Wnt/β‐catenin pathway inhibitors. Genetic functional assays showed that thyroid‐specific knockout of miR‐31 inhibited BRAFV600E‐induced PTC progression, and strikingly, enhanced expression of sodium‐iodide symporter and other thyroid differentiation markers, thus promoted 131I uptake. Nanoparticle‐mediated application of anti‐miR‐31 antagomirs markedly elevated radio‐sensitivity of BRAFV600E‐induced PTC tumours to 131I therapy, and efficiently suppressed tumour progression in the pre‐clinical mouse model.
Conclusions:
Our findings elucidate a novel BRAF/MAPK‐miR‐31‐Wnt/β‐catenin regulatory mechanism underlying clinically BRAFV600E‐associated DTC tumourigenesis and dedifferentiation, also highlight a potential adjuvant therapeutic strategy for advanced DTC.
Article type: Research Article
Keywords: BRAF, CEBPA, DACH1, miR‐31, papillary thyroid carcinoma, Wnt/β‐catenin pathway
Affiliations: Department of Nuclear Medicine, Tianjin Medical University General Hospital Tianjin Medical University Tianjin China; Department of Thyroid and Neck Oncology, Key Laboratory of Cancer Prevention and Therapy, Tianjin’s Clinical Research Center for Cancer, National Clinical Research Center for Cancer, The Province and Ministry Co‐sponsored Collaborative Innovation Center for Medical Epigenetics, Key Laboratory of Immune Microenvironment and Disease (Ministry of Education) Tianjin Medical University Tianjin China; Department of Biochemistry and Molecular Biology, School of Basic Medical Sciences, Tianjin Medical University Cancer Institute and Hospital Tianjin Medical University Tianjin China; Laboratory of molecular genetics, School of Medicine Nankai University Tianjin China; Department of Thyroid and Breast Surgery, Tongji Hospital, Tongji Medical College Huazhong University of Science and Technology (HUST) Wuhan China; Department of Pulmonary and Critical Care Medicine, Zhujiang Hospital Southern Medical University Guangzhou China; State Key Laboratories for Agrobiotechnology, College of Biological Sciences China Agricultural University Beijing China; Department of Thyroid and Neck Oncology, National Clinical Research Center for Cancer, Key Laboratory of Cancer Prevention and Therapy, Tianjin’s Clinical Research Center for Cancer Tianjin Medical University Cancer Institute and Hospital Tianjin China
License: © 2024 The Author(s). Clinical and Translational Medicine published by John Wiley & Sons Australia, Ltd on behalf of Shanghai Institute of Clinical Bioinformatics. CC BY 4.0 This is an open access article under the terms of the http://creativecommons.org/licenses/by/4.0/ License, which permits use, distribution and reproduction in any medium, provided the original work is properly cited.
Article links: DOI: 10.1002/ctm2.1694 | PubMed: 38797942 | PMC: PMC11128713
Relevance: Moderate: mentioned 3+ times in text
Full text: PDF (8.2 MB)
INTRODUCTION
As the most common type of differentiated thyroid cancer (DTC), papillary thyroid cancer (PTC) accounts for more than 80% of thyroid cancer incidence. Although PTC has a quite favourable prognosis with less than 3% mortality within 10 years post‐treatment, 20−30% of patients experience recurrence and 5−10% develop advanced DTC.ref. ctm21694-bib-0001 Activation of mitogen‐activated protein kinase (MAPK) caused by BRAFV600E mutation is one of the main drivers for PTC development.ref. ctm21694-bib-0002 This oncogenic driver mutation can result in tumour progression of DTCs causing increased metastasis, cancer stemness, dedifferentiation with decreased expression of thyroid‐specific factors and resistance to radioactive iodine (RAI) therapy.ref. ctm21694-bib-0002 Moreover, recent reports show that dysregulated Wnt/β‐catenin pathway correlates with PTC dedifferentiation and that Ctnnb1 knockout (KO) impedes BRAFV600E‐induced PTC formation and restores differentiation factors expression.ref. ctm21694-bib-0003 Therefore, to understand the molecular mechanisms and identify reliable downstream targets of BRAFV600E for PTC stratification, prognosis prediction and RAI uptake restoration is of great importance for managing advanced DTC.
Investigations on BRAFV600E‐related cancers have identified the vital roles of microRNAs (miRNAs) in cell fate determination and tumour development. When combined with BRAFV600E, miRNAs serve as diagnosis biomarkers for clinical–pathologic evaluation of thyroid cancer, colorectal cancer (CRC) and melanoma.ref. ctm21694-bib-0004, ref. ctm21694-bib-0005, ref. ctm21694-bib-0006 Similarly, studies on dysregulated miRNAs in PTC tumourigenesis have identified the oncogenic function of miR‐21, miR‐222, miR‐147b and miR‐146b that target VHL, PPP2R2A, SOX15 and CCDC6, respectively.ref. ctm21694-bib-0007, ref. ctm21694-bib-0008, ref. ctm21694-bib-0009, ref. ctm21694-bib-0010 These onco‐miRs are highly expressed in BRAF‐like PTC samples and negatively correlate with BRS (BRAFV600E‐RAS score) as well as TDS (thyroid differentiation score), indicating that these onco‐miRs could be involved in dedifferentiation.ref. ctm21694-bib-0011 Additional studies also show the involvement of other miRNAs, such as miR‐31 and miR‐551, in BRAFV600E‐driven PTC.ref. ctm21694-bib-0011, ref. ctm21694-bib-0012 However, the specific tumourigenesis mechanisms of miRNA in BRAFV600E‐driven PTC are still unclear.
Although miRNAs are intensively studied, the function of miRNAs is complex due to their tissue‐type dependency. Specifically, miR‐31 is oncogenic in colorectal, breast and oral squamous cell carcinoma, but tumour suppressive in oesophageal adenocarcinoma, hepatocellular, prostate and nasopharyngeal carcinoma.ref. ctm21694-bib-0013 Many studies have associated miR‐31 with BRAF or KRAS mutations within the progression of CRC and metastasis of pancreatic cancerref. ctm21694-bib-0014, ref. ctm21694-bib-0015 and indicated that aberrant miR‐31 expression could be a downstream event of activated MAPK signalling to mediate tumourigenesis. However, the current evidence regarding the clinical relationship between miR‐31 and the BRAFV600E mutation in PTC is conflicting. Some studies show miR‐31 up‐regulation in aggressive PTC and negative correlation with TDS and BRS; however, other studies report a tumour repressive role of miR‐31 on PTC cell proliferation and epithelial‐to‐mesenchymal transition (EMT).ref. ctm21694-bib-0016, ref. ctm21694-bib-0017, ref. ctm21694-bib-0018 And also, independent findings by Maggisano et al.ref. ctm21694-bib-0019 and Yi et al.ref. ctm21694-bib-0020 both support the oncogenic role of miR‐31 in PTC cell proliferation and migration. The discrepancies between these studies may relate to variance of research systems since most are based on in vitro cell line models. Therefore, systematic investigation of miR‐31 functions during PTC development and the correlation with BRAFV600E molecular signatures will be necessary to further evaluate its potential as a biomarker.
Here, we identify miR‐31 as a BRAFV600E‐ and dedifferentiation‐associated miRNA in PTC development. Exogenous expression of miR‐31 enhances tumour cell proliferation and migration by maintaining Wnt/β‐catenin signalling. Specifically, miR‐31 directly targets the tumour suppressors CCAAT enhancer binding protein α (CEBPA) and dachshund family transcription factor 1 (DACH1), which decreases β‐catenin protein level via increasing Wnt/β‐catenin signalling inhibitors, such as AXIN1, CD9 and CD82. More convincingly, loss of miR‐31 impedes BRAFV600E‐induced PTC progression, promotes tumour differentiation and elevates radio‐sensitivity to 131I therapy. We show that targeting against miR‐31 combined with 131I therapy represses tumour growth in vivo. Therefore, miR‐31 provides a novel target for advanced BRAFV600E‐driven DTC therapy.
METHODS
Mice
Thyroid peroxidase (TPO)‐Cre, LSL‐BrafV600E and miR‐31‐LoxP mice were gifted by Dr Shioko Kimura of NIH, USA, Dr Martin McMahon of NIH, USA and Dr Zhengquan Yu of China Agricultural University, China, respectively.ref. ctm21694-bib-0021, ref. ctm21694-bib-0022, ref. ctm21694-bib-0023 TPO‐creER and Rosa‐mTmG mice were purchased from The Jackson Laboratory, USA. TPO‐Cre/BrafV600E (named as mPTC) and TPO‐creER/BrafV600E mice (named as mPTC‐TAM) mice were generated by crossing Tpo‐Cre or TPO‐creER with LSL‐BrafV600E mice. And for tumour initiation in mPTC‐TAM mice, BrafV600E activation was induced by intraperitoneal injection of tamoxifen according to previous study.ref. ctm21694-bib-0024 Both male and female mPTC mice were used for in vivo experiments.
Clinical samples
PTC samples were obtained from Tianjin Cancer Institute and Hospital (Tianjin, China). Fresh tumour tissues and adjacent normal tissues were frozen in liquid nitrogen immediately after resection or fixed in 4% paraformaldehyde (PFA; #30525‐89‐4; Sigma–Aldrich) at 4°C overnight before embedded in paraffin. The PTC samples were separated into two groups: grade low including (TNM) Tumor, Node and Metastasis I and grade high including TNM II and TNM III according to AJCC Cancer Staging Manual 8th Edition. We did not identify any TNM IV samples.ref. ctm21694-bib-0025 We did not identify any TNM IV samples. Clinicopathological features of PTC samples were provided in Table S1. To analyse BRAFV600E mutation, we performed PCR with PTC tissue cDNA and DNA sequencing according to previous study.ref. ctm21694-bib-0024 The primers used were provided in Table S2.
Cell culture and cell lines
Normal human thyroid cell line (Nthy‐ori 3‐1) and human PTC cell lines (TPC1 with CCDC6‐RET fusion, K1 and BCPAP with BRAFV600E mutation) with STR profiling were gifted by Dr Ming Gao from Tianjin Cancer Institute and Hospital.ref. ctm21694-bib-0026 Human embryonic kidney HEK293T (ACS‐4500) was purchased from the American Type Culture Collection (ATCC). Cells were cultured with Dulbecco’s Modified Eagle Medium (DMEM) (#BISH1642; Biological Industries) or RPMI 1640 Medium (#BISH0400; Biological Industries) containing 10% Fetal Bovine Serum (FBS) (#BISH0085; Biological Industries) at 37°C in a 5% CO2 incubator.
The recombinant lentiviruses expressing miR‐31, CEBPA, DACH1 and others were constructed with PCDH‐CMV‐EF1α‐puro vector, and shRNAs targeting c‐Jun and BRAF were constructed with pLKO.1 vector. For KO system, the CRISPR guide RNAs were designed through the Zhang laboratory website (https://zlab.bio/guide‐design‐resources) and cloned into lentiGuide‐Puro vector (#52961; Addgene). K1 or BCPAP cells were transduced with lentivirus for 24 h and stable cell lines were selected with 2 µg/mL puromycin according to previous procedures.ref. ctm21694-bib-0027 The shRNAs and sgRNAs are provided in Table S3.
In situ hybridisation
The miR‐31 in situ hybridisation assay was performed as described.ref. ctm21694-bib-0023 Tumours embedded in OCT (#4583; SAKURA) were cut into 10 µm slices. Digoxigenin‐labelled LNA probes mmu‐miR‐31 (#39153; Exiqon) were used following the manufacturer’s protocol. Both digoxigenin‐labelled miR‐31 and scrambled probes were hybridised at 55°C overnight in a humidified chamber. The signals were detected by staining with anti‐digoxigenin‐AP antibody (#110932374910; Roche) and finally developed with BM purple substrate (#11442074001; Roche).
RNA‐Seq and quantitative real‐time PCR
Total RNA was isolated from K1‐control and miR‐31 KO cells using TRIzol Reagent (#15596026; Invitrogen) according to the manufacturer’s instructions. The RNA samples were submitted to the Berry Genomics Corporation and sequenced on Illumina NovaSeq 6000 platform. The raw data are available on www.ncbi.nlm.nih.gov/geo/query/acc.cgi?acc=GSE193159. The analysis results with cutoff (p value < .05, fold change > 1.5) were used in the analysis with hiplot (https://hiplot.com.cn/basic/heatmap) for heatmap. MiR‐31 potential targets were confirmed using both TargetScan (http://www.targetscan.org/vert_71/) and RNA‐seq.
Total RNA was subjected to reverse transcription using the RevertAid First Strand cDNA Synthesis Kit (#K1621; Thermo Fisher Scientific) following manufacturer’s instructions. MiR‐31 and U6 reverse primers were designed as following: miR‐31‐RT: 5′‐GTCGTATCCAGTGCAGGGTCCGAGGTGCACTGGATACGACAGCTATG, U6‐RT: 5′‐AAAATATGGAACGCTTCACGAATTTGC. Quantitative real‐time PCR (qRT‐PCR) was performed using the LightCycler 480 real‐time PCR system (Roche). Each sample was examined at least in triplicate. The primers used were described in Table S2.
Colony formation and cell viability assays
K1 or BCPAP cells lines were seeded in 6‐well plates at a density of 800 cells per well and maintained in DMEM medium containing 10% FBS for 2 weeks (2w). Then, the colonies were fixed with 4% PFA, stained with 1% crystal violet (#C6158; Sigma–Aldrich) and counted (diameter ≥ 100 µm). Cell proliferation was also analysed using the cell counting kit‐8 (CCK‐8) (C6005; NCM Biotech).
Cell migration assays
For wound healing assay, cells with 95% confluence in a six‐well plate were scratched for a wound. Pictures were taken after 0, 24 and 48 h. Every experiment was repeated independently three times. For transwell assay, 5.0 × 10⁴ cells in 200 µL DMEM or RPMI media were cultured in the upper chamber of transwell (#3422; Millipore) and cultured in 600 µL DMEM or RPMI 1640 with 10% FBS. Migrated cells were fixed with 4% PFA and then stained with 1% crystal violet 24 or 48 h later.
Immunohistochemistry and immunofluorescence analysis
Tumour tissues were fixed in 4% PFA, embedded in paraffin and sectioned, then 5‐µm sections were stained with haematoxylin and oeosin (H&E) for morphology analysis. Immunohistochemistry (IHC) and immunofluorescence (IF) staining were performed following a standard procedure.ref. ctm21694-bib-0028 The primary antibodies include: Ki‐67 (#ab16667; Abcam), β‐Catenin (#8480s; CST), E‐cadherin (#YM0207; IMMUNOWAY), N‐cadherin (#22018; PROTEIN TECH), DACH1 (#A3823; ABclonal), CEBPA (#8178S; CST), PAX8 (#ab97477; Abcam), cyclin D1 (#PTM‐6029; PTM BIO). To evaluate the staining intensity in IHC, the immunoreactive score (IRS Score) was calculated as previous study.ref. ctm21694-bib-0027 For IF staining, tissues were pretreated by 0.5% Triton X‐100, blocked with 5 mg/mL BSA and then incubated with primary antibody anti‐Thyroglobulin (#ab156008; Abcam) at 4°C overnight, followed with Goat anti‐Rabbit IgG (H+L) Cross‐Adsorbed Secondary Antibody, Alexa Fluor 594 (# A‐11012; Invitrogen) at room temperature for 2 h.
Western blotting
Cell lysates were prepared in RIPA buffer (#R0020; Solarbio) with protease inhibitors (1 mM PMSF, #P0100; Solarbio), separated with SDS‐PAGE and transferred onto PVDF membranes, which were blocked in 5% milk, and then incubated with the primary antibody overnight at 4°C followed with secondary antibody (mouse IgG, #5220‐0341; Seracare; rabbit IgG, #5220‐0336; Seracare) for 2 h. The primary antibodies were used as follows: β‐Catenin (#8480s; CST), E‐cadherin (#YM0207; IMMUNOWAY), N‐cadherin (#22018; PROTEINTECH), DACH1 (#A3823; ABclonal), CEBPA (#8178S; CST), p65 (#8242; CST), p‐p65 (#3033; CST), AKT (#4691; CST), p‐AKT (#4060; CST), LATS2 (#5888; CST), ERK1/2 (#4695; CST), p‐ERK1/2 (#4370; CST), p38 (#8690; CST), p‐p38 (#4511; CST), BRAF (#14814; CST), c‐Jun (#9165; CST), JunB (#3753; CST), c‐FOS (#2250; CST), TPO (#ab203057; Abcam), NIS (#ab242007; Abcam), PAX8 (#ab97477; Abcam), GSK3β (#A2081; ABclonal), p‐GSK3β (#AP0039; ABclonal).
Dual luciferase activity assays
The CEBPA 3′‐untranslated region (UTR) segment and DACH1 3′‐UTR segment were cloned into the psiCHECK™‐2 vector (#C8021; Promega). For dual luciferase activity assay, HEK293T cells were transfected with wild‐type (WT) or mutated (MUT) CEBPA or DACH1 3′‐UTR or control vector together with miR‐31 using Lipofectamine 3000 (#L3000015; Invitrogen). After 24 h, firefly and renilla luciferase activities were measured with the dual luciferase activity assays (#E2920; Promega) according to the manufacturer’s protocol.
Chromatin immunoprecipitation
For endogenous chromatin immunoprecipitation (ChIP), K1 cells were fixed with 1% formaldehyde, sonicated and then incubated with c‐Jun or normal IgG antibody overnight at 4°C in RIPA150 buffer.ref. ctm21694-bib-0024 After washing with cold RIPA150 for three times, the samples were incubated with Agarose beads at 4°C for 20 min. And the immunocomplexes were then washed with RIPA150 buffer and TE buffer sequentially. The purified DNA fragments after decrosslinking were subject to qPCR assays with specific primers, which were provided in Table S2.
GLuc reporter assays
GLuc reporter assays were performed according to previous study.ref. ctm21694-bib-0027 Briefly, the −2000 bp human miR‐31 promoter segment was cloned into the GLuc reporter plasmid, which expressed alkaline phosphatase (SEAP) as an internal control. HEK293T cells were co‐transfected with control or c‐Jun overexpression plasmids and Gluc plasmids. The culture medium was collected and measured according to the manufacturer’s instructions (GeneCopoeia) after 48 h. All samples were analysed at least in triplicate.
TOP/FOP‐flash reporter assay
K1 cells were transfected with target plasmids including vector, miR‐31, CEBPA and DACH1 together with TOP/FOP‐flash reporter plasmid using Lipofectamine 3000. Both firefly and renilla luciferase activities were measured using Dual Luciferase Reporter Assay System Kit (#E1910; Promega).ref. ctm21694-bib-0023
Xenograft mouse model
Female BALB/c nude mice at age of 6w were purchased from Specific Pathogen Free (SPF) Biotechnology Co Ltd (Beijing). 5 × 10⁶ K1 cells were injected subcutaneously into the dorsal flanks of the mice with only one tumour on the right back. The tumour volumes were measured approximately every 5 days and calculated according to the following formula: Volume (mm3) = 1/2 × length × width2. Tumours were collected and subjected to more analyses.
In vivo metastasis mouse model. BCPAP cells stably expressing luciferase were injected into female BALB/C nude mice via tail vein (5 × 10⁵ cells per mouse) at age of 5w, n = 5. 5w later, mice were injected abdominally with d‐luciferin (Promega) at 150 µg/g body weight, then anesthetised and photographed with the Caliper IVIS Spectrum System (IVIS; Xenogen) for bioluminescence imaging.
RAI thyroid uptake and SPECT/CT imaging
SPECT/CT imaging was performed using Inliview‐3000B (Novel Medical, China) with 99mTcO4 at dose of 0.5 mCi/20 g mouse body weight 30 min post intraperitoneal injection. Mice were injected via tail vein with 131I 0.5 mCi/20 g body weight and imaged 30 min later by SPECT Discovery 670 (GENERAL ELECTRIC, USA). Each group included both male and female at age of 5w. The resulting image data were normalised to the administered activity of the percentage of the injected dose per gram of mice (%ID/g) according to previous protocols.ref. ctm21694-bib-0029 And the %ID/g was determined with same 3D volumes of interest in different mice.
Preparation of MSNs‐BSA‐Anta‐131I
To prepare 131I‐labelled nanoparticles (NPs), MSNs‐NH2 and BSA were mixed with appropriate concentration of 1‐ethyl‐3‐(3‐dimethylaminopropyl) carbodiimide hydrochloride and N‐hydroxysuccinimide for 3 h. Then, miR‐31 antagomir was added to the MSNs‐BSA NPs to form the MSNs‐BSA‐Anta NPs. The 131I was then labelled with chloramine T method to form the MSNs‐BSA‐Anta‐131I NPs.ref. ctm21694-bib-0030 NPs morphology was detected by transmission electron microscope (TEM) (HT7700; HITACHI). Particle‐size distribution and zeta (ζ)‐potential were analysed on a Malvern Nano‐ZS90 instrument (Malvern, UK). In the therapeutic model, mPTC mice including both male and female at age of 3w were injected with NPs at a dose of 50 mg/kg body weight and NPs labelled with 131I at a dose of 0.6 mCi/20 g body weight through tail vein twice a week, n = 8 per group. After five times of treatment, only n = 6 tumours each group were harvested due to animal deaths. SPECT/CT imaging was performed at different times with SPECT Discovery 670 (GENERAL ELECTRIC). And the tumours were then collected for further analyses.
Isolation of murine thyroid cancer primary cells
mPTC primary cells were obtained according to previous procedures.ref. ctm21694-bib-0031 Isolated tumour cells from mPTCGFP mouse separated with FACSAria Cell Sorter (Becton Dickinson) according to GFP signal, were cultured in 5H medium and then treated with MAPKi or ERKi at different time points.ref. ctm21694-bib-0032 Primary cells isolated without using FACSAria Cell Sorter were also maintained for ∼10 passages in 5H medium with more than 90% penetrance, which was consistent with previous study.ref. ctm21694-bib-0032
Statistical analysis
Data were presented as mean ± SD from three independent experiments or more and two‐tailed unpaired Student’s t‐test by using SPSS 17.0 was used for statistical significance evaluation. A p value of <.05 was considered significant. To identify gene signatures associated with miR‐31 expression in thyroid cancer, we used gene and miRNA expression data from The Cancer Genome Atlas (TCGA) and the annotations from the Molecular Signatures Database (v7.5.1) to perform gene set enrichment analysis (GSEA) as described previously.ref. ctm21694-bib-0033
RESULTS
MiR‐31 highly correlates with BRAFV600E‐associated PTC
To systematically evaluate the clinical significance of miR‐31 during PTC progression, we examined miR‐31 expression within our PTC sample cohort. Statistically, PTC specimens displayed variable but highly increased levels of miR‐31 compared with normal thyroid tissues adjacent to tumour tissues (Figure 1A). Consistently, miR‐31 was more abundantly expressed in malignant cancer cells than in normal thyroid cells (Figure S1A). We also analysed available thyroid carcinoma (THCA)‐associated miRNA data from TCGA and further confirmed that miR‐31 was significantly increased in THCA samples compared with that in normal thyroids (Figure S1B). Thus, miR‐31 could play an important role in PTC development.
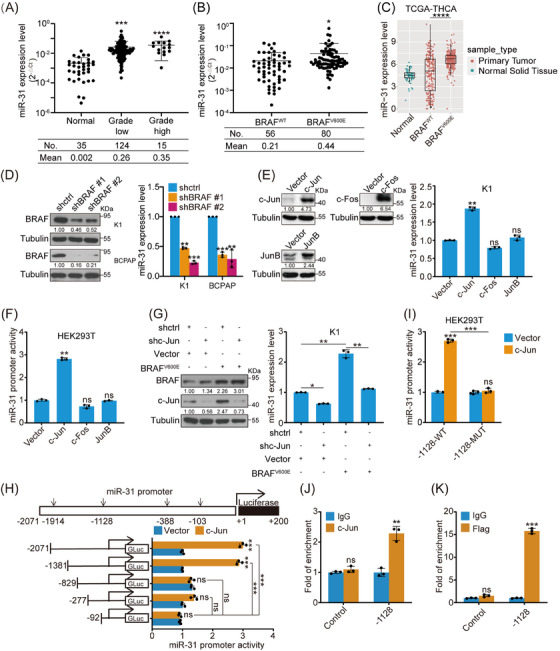
To further compare miR‐31 expression variation during PTC progression, we stratified TNM I specimens into grade low group and TNM II/III specimens into grade high group according to the AJCC Cancer Staging Manual 8th Edition.ref. ctm21694-bib-0025 No significant difference was detected between grade high and grade low groups, possibly due to the small sample size of the grade high group. However, miR‐31 expression was highly expressed in BRAFV600E‐mutated PTC cohort (Figure 1B). This was further supported by the TCGA dataset in which miR‐31 was more significantly elevated in BRAFV600E‐positive than BRAFWT PTC patients (Figure 1C). Consistent with previous analysis on TCGA samples that BRAFV600E‐like samples had more abundant miR‐31 than RAS‐like samples, we also found that miR‐31 level was higher in BRAFV600E than NRAS or HRAS patients (Figures S1C and S1D).ref. ctm21694-bib-0011 Taken together, miR‐31 is highly expressed in PTC, especially in BRAFV600E‐positive PTC.
BRAF/MAPK directs miR‐31 expression through c‐Jun‐mediated transcriptional regulation
We then explored the regulatory mechanisms by which miR‐31 expression is maintained in PTC. Since BRAFV600E results in constitutively active BRAF/MAPK signalling, repression of BRAF or ERK1/2 with inhibitors (BRAFi PLX4032 or ERKi SCH772984) led to miR‐31 downregulation in a dose‐dependent manner (Figure S1E). While pharmacological inhibition of other representative PTC oncogenic pathways, such as p38, CREB, WNT and NF‐κB pathway, showed neglectable effects. BRAF knockdown by lentivirus‐delivered shRNAs also repressed miR‐31 level significantly in K1 and BCPAP cells (Figures S1F and 1D), while BRAFV600E overexpression increased miR‐31 in Nthy and TPC1 cells that otherwise had low or moderate miR‐31 expression (Figures S1G and H). These data suggest that miR‐31 expression could be regulated by the BRAF/MAPK pathway.
Next, we explored whether AP‐1 transcription factors, the main BRAF/MAPK effectors, were involved in miR‐31 maintenance.ref. ctm21694-bib-0034 Indeed, AP‐1 inhibitor T‐5224 repressed miR‐31 expression (Figure S1E), while AP‐1 overexpression, specifically c‐Jun, up‐regulated miR‐31 level (Figures S1I and 1E). Luciferase reporter assays also showed that c‐Jun, instead of JunB or c‐Fos, transactivated miR‐31 promoter effectively (Figure 1F). Reciprocal rescue experiments further found that c‐Jun knockdown blocked BRAFV600E‐induced miR‐31 elevation, whereas, c‐Jun overexpression restored miR‐31 that was otherwise downregulated by BRAF knockdown (Figures 1G and S1J). Collectively, these results show that c‐Jun functions downstream of BRAF/MAPK to transactivate miR‐31 expression.
To identify the c‐Jun binding site on miR‐31 promoter, we used the PROMO and JASPAR databases and predicted four potential c‐Jun binding sites located on −1914, −1128, −388 and −103 bp (Figure 1H). Luciferase reporter assays showed that the promoter was efficiently activated by c‐Jun until the truncation went less than −1128 bp upstream of the transcription start site (Figure 1H). Mutation of the −1128 bp site eliminated the promoter response to c‐Jun (Figure 1I). ChIP experiments with anti‐c‐Jun against endogenous c‐Jun or anti‐FLAG against exogenous FLAG‐tagged c‐Jun in PTC cells both confirmed that c‐Jun binds to the −1128 bp site directly (Figures 1J and K). In addition, BRAF or ERK1/2 inhibition downregulated miR‐31 promoter activity (Figure S1K). Taken together, high levels of miR‐31 in PTC cells, especially in BRAFV600E‐positive cells, could be induced by BRAF/MAPK/c‐Jun axis possibly through c‐Jun binding onto the −1128 bp AP‐1 site within miR‐31 promoter.
Deficiency of miR‐31 inhibits BRAFV600E‐induced PTC development in transgenic mice
To validate our in vitro findings, we evaluated the function of miR‐31 in the transgenic mouse PTC model generated by crossing TPO‐Cre with LSL‐BrafV600E (named as mPTC),ref. ctm21694-bib-0035 which represents the successively progressed BrafV600E‐induced transformation (Figures S2A and B). Indeed, we detected markedly up‐regulated miR‐31 at different tumourigenesis stages (Figure 2A). Through systematic cataloguing and referring to previous studies,ref. ctm21694-bib-0024, ref. ctm21694-bib-0035 we confirmed that about 90% of the thyrocyte epithelial cells accomplished transformation by 5w and thyroid glands represented tumour growths, which achieved significantly high miR‐31 levels (Figures S2A, B and 2B). Furthermore, inducible mPTC system called mPTC‐TAM was also setup by crossing TPO‐CreER with LSL‐BrafV600E , wherein miR‐31 level was continuously elevated upon tamoxifen induction from 3 till 12 months (Figures S2C and D). Tumour tissues are highly heterogenous, thus we wonder whether miR‐31 up‐regulation occurs autonomously within epithelial tumour cells. By crossing mPTC mice with Rosa26‐mTmG reporter line (mPTCGFP), the TPO‐Cre positive and BRAFV600E‐transformed tumour cells were labelled as GFP+ cells (Figure 2C). Consistent with aforementioned molecular regulations, miR‐31 level in the FACS isolated GFP+ primary mPTC tumour cells was repressed by BRAFi or ERKi, indicating miR‐31 in epithelial cells responds to and functions downstream of BRAFV600E‐induced transformation (Figures 2D and E). Considering the potential interference of endogenous GFP fluorescence on subsequent cellular validation that inevitably involves immuno‐fluorescent stainings, we thus evaluated the classical primary cell culture procedures on mPTCGFP tumour tissues.ref. ctm21694-bib-0032 Interestingly, more than 90% of primary cells cultured in the latter way were GFP positive after a few passages, proving the reliability of these procedures in harvesting primary tumour cells (Figure S2E). In this case, we applied the procedures on normal mPTC and WT thyroid tissues and followed with functional validation. Consistent to the dedifferentiation behaviours reported,ref. ctm21694-bib-0012 primary mPTC tumour cells isolated classically showed damaged thyroid follicular function and lost Tg synthesis capability (Figure S2F).
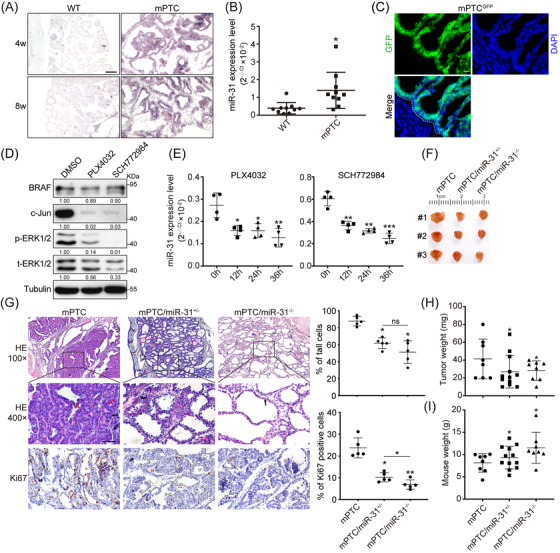
Next, to address the significance of epithelial origin miR‐31 in thyroid tumourigenesis, we generated miR‐31 gene KO mouse by crossing miR‐31flox/flox mice with mPTC line (named homozygotes as mPTC/miR‐31−/−, heterozygotes as mPTC/miR‐31+/−). Consistent with previous findings, tumours were formed locally in mPTC mouse thyroids around 5w with 95% or higher penetrance.ref. ctm21694-bib-0035 However, tumour formation capacities were dramatically reduced in miR‐31 KOs, which was not due to damaged recombinant efficiency on knocking‐out LSL‐Braf allele (Figures 2F and S2G–I). As reported, thyroid follicle architecture was disrupted in mPTC malignant thyroids and transformed into tall cells with increased enlarged nuclei and nuclear pseudoinclusions (Figure 2G).ref. ctm21694-bib-0035 Tumours from mPTC/miR‐31+/− and mPTC/miR‐31−/− litter‐mates, if formed, exhibited slowly progressed transformation and maintained higher ratio of seemingly normal follicles while lower percentage of tall cells, although weak difference of tall cell percentage was observed between heterozygous and homozygous miR‐31 KO litter‐mates at 5w. And cell proliferation was significantly repressed in miR‐31 KO tumours at 5w (Figure 2G). Consequently, the tumour weights were dramatically reduced in the miR‐31 KOs (Figure 2H). More interestingly, miR‐31 deficiency inhibited tumour growth and reduced tall cells as well as nuclear pseudoinclusion contents in a dose‐dependent way once we extended the evaluation to 10w (Figures S2J and K). To distinguish the developmental role of miR‐31 from the oncogenic role, we also characterised the general thyroid function in mice with (TPO)‐Cre‐driven thyroid‐specific miR‐31 KO (named homozygotes as miR‐31thy‐/−, heterozygotes as miR‐31thy+/− no BrafV600E in this model). Loss of miR‐31 had minimal effect on thyroid formation in regard to morphology and thyroid weight, so that the miR‐31thy+/− and miR‐31thy‐/− mice were phenotypically similar at the time examined (Figures S3A–C). Molecular analyses demonstrated that miR‐31 deletion from normal thyroid had no effect on differentiation makers including Pax8, Tpo, Nis, Tg and Ttf1 (Figure S3D). Also, loss of miR‐31 from normal thyroid had no effect on serum TSH, T3 and T4 levels (Figure S3E).
In contrast, miR‐31 deletion partially recovered the delayed body and weight growth within mPTC, seemingly damaged thyroid function during mPTC formation could be related to miR‐31 increase (Figure 2I). Therefore, elevated miR‐31 could be a critical molecular event required for BrafV600E‐induced mPTC progression and deletion of miR‐31 dramatically blocked thyroid transformation.
MiR‐31 controls PTC cell proliferation and migration
Based on the similar expression and in vivo function of miR‐31 between mice and human, we engineered miR‐31 expression in different human PTC cell lines to investigate its cellular function. Within CCK8 and colony formation experiments, miR‐31 KO cells grew much slower than control cells (Figures 3A, B and S4A). In contrast, overexpression of miR‐31 increased tumour cell proliferation (Figures S4B and C). In vivo, K1 cells overexpressing miR‐31 gave rise to dramatically larger tumours in xenograft models with increased cyclin D1 staining, representing accelerated cell cycle (Figures 3C–E). Taken together, miR‐31 could be an important onco‐miR in regulating PTC tumour formation.
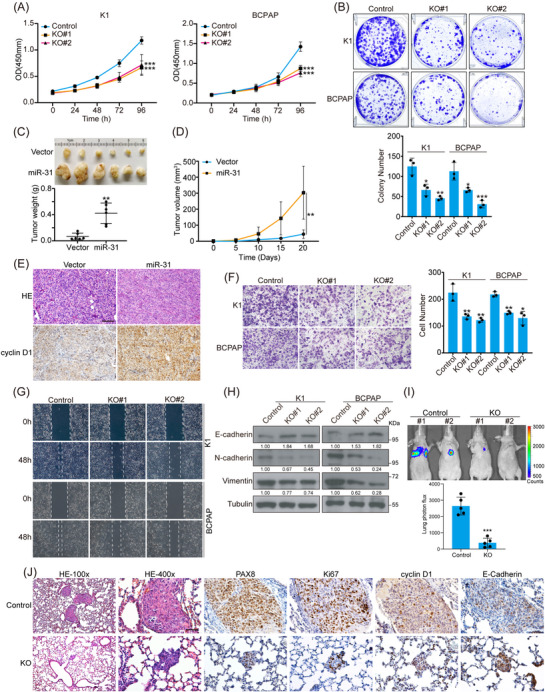
Moreover, miR‐31 loss reduced cell motility significantly as detected by transwell and wound healing assays (Figures 3F and G). In line with the cell behaviours, decreased expression of mesenchymal markers N‐cadherin and Vimentin and increased expression of epithelial marker E‐cadherin were observed in miR‐31 KO cells, while miR‐31‐overexpressing cells behaved the opposite (Figures 3H and S4D–F). Furthermore, we established the tumour metastasis model via tail vein injection and visualised with Caliper IVIS Spectrum System. BCPAP cells showed high metastatic potential visualised mostly in the lungs within 6w post‐injection. However, the metastasis was dramatically impeded upon miR‐31 KO (Figure 3I). PAX8 staining of the lung tissues confirmed the PTC cells origin of metastasized tumours, which was hardly detectable after miR‐31 KO (Figure 3J). Loss of miR‐31 repressed Ki67, cyclin D1 and mesenchymal factors and promoted E‐cadherin expression in vivo (Figure 3J). Therefore, miR‐31 is crucial for both tumour growth and EMT of PTC cells.
BRAF/miR‐31 axis represses tumour suppressor genes expression
miRNAs usually function as negative regulators of gene expression and their function is determined by the genes that they modulate. To uncover the target factors by which miR‐31 regulates PTC cell functions, the transcriptome was compared between miR‐31 KO and control cells (Figure 4A). Differentially expressed genes (DEGs) were combined from three independent RNA‐seqs and integrated with target prediction software Target Scan. A list composed of 13 genes were generated as the potential functional targets altered upon miR‐31 KO (Table S4 and Figure 4B). qRT‐PCR verification further narrowed down the target genes to CEBPA, LATS2, UCN2 and DACH1. LATS2 is a known target of miR‐31, suggesting the reliability of our analysis and the conservation of miR‐31 function in our model (Figures 4C and S5A). Of note, CEBPA and DACH1 have been reported as tumour suppressors in different types of cancers,ref. ctm21694-bib-0036, ref. ctm21694-bib-0037 while their function in thyroid cancer is currently unknown.
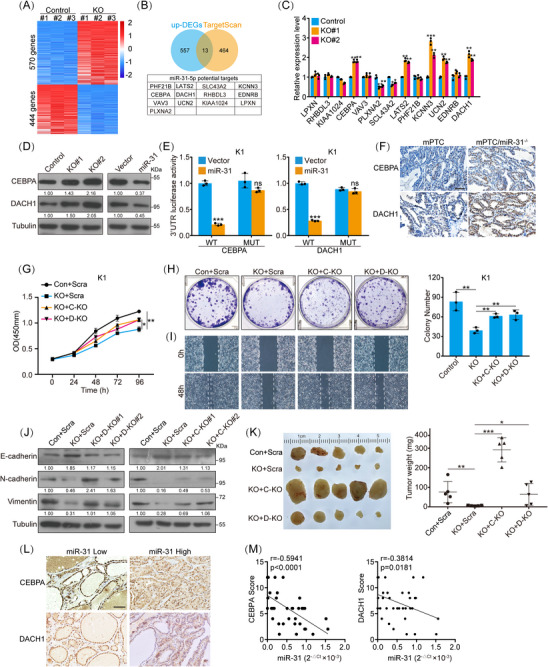
Consistent with the mRNA expression, the protein expression of CEBPA and DACH1 were both increased in miR‐31 KO cells (Figure 4D). Luciferase reporter assays showed that CEBPA and DACH1 3′UTRs were repressed by miR‐31 overexpression, while not when the predicted miR‐31 binding sites were mutated (Figure 4E). Likewise, we detected reduced CEBPA and DACH1 staining in miR‐31‐overexpressing tumours, whereas increased CEBPA and DACH1 in mPTC/miR‐31−/− tumours (Figures 4F and S5B). Thus, CEBPA and DACH1 could be direct target genes of miR‐31 during thyroid cancer development.
As predicted by miR‐31 KO phenotypes, exogenous CEBPA and DACH1 suppressed PTC cell proliferation and migration (Figures S5C–E). To determine whether CEBPA and DACH1 are the main cause for miR‐31 loss phenotype, we conducted rescue experiments. We found that CEBPA KO and DACH1 KO effectively reversed the reduced tumour cell functions caused by miR‐31 KO (Figures 4G–J). In vivo, miR‐31 KO dramatically retarded tumour formation (Figure 4K). Strikingly, further KO of CEBPA rescued tumour growth, even further promoted tumour growth greater than control, and DACH1 KO also performed similarly (Figures 4K and S5F).
Furthermore, we evaluated the clinicopathological relevance of the miR‐31‐CEBPA/DACH1 axis in thyroid cancer. Notably, the protein level of CEBPA and DACH1 showed negative correlation with corresponding miR‐31 expression in our patient cohort (Figures 4L and M). Abundance of CEBPA and DACH1 in our cohort was lower in BRAFV600E PTC tissues compared with BRAFWT PTC tissues, with opposite tendency to miR‐31 levels (Figures S5G and 1B). Similarly, CEBPA and DACH1 transcript levels were also significantly reduced in BRAFV600E PTC patients based on TCGA‐THCA datasets (Figures S5H and 1C). Therefore, miR‐31 possibly promotes PTC development through repressing tumour suppressors, especially CEBPA and DACH1.
MiR‐31 maintains Wnt/β‐catenin signalling through inhibiting CEBPA/DACH1‐mediated repression
We next aimed to identify signalling pathways affected by miR‐31‐CEBPA/DACH1 axis variation. KEGG analyses of DEGs showed that significantly varied signalling pathways may include up‐regulated chemokines, inflammatory pathways regulated by NF‐κB, down‐regulated calcium signalling and cell adhesion pathways upon miR‐31 deficiency (Figure S6A). To narrow down the impact by further CEBPA/DACH1 loss, we analysed major oncogenic pathway signal transducers by blotting. Interestingly, β‐catenin level was dramatically decreased upon miR‐31 loss, but restored upon further CEBPA or DACH1 loss in PTC cells (Figure S6B). Related downstream genes such as cyclin D1 and MMP7 were also affected by miR‐31‐CEBPA/DACH1 axis in accordance with β‐catenin (Figure 5A).ref. ctm21694-bib-0038 Moreover, GSEA of the extracted miR‐31 signatures from TCGA‐THCA datasets were enriched for Wnt/β‐catenin signalling (Figure S6C). β‐Catenin expression was consistently augmented or decreased in miR‐31 overexpression or KO models across in vitro and in vivo models (Figures S6D and 5B). Moreover, TOP‐Flash β‐catenin luciferase reporter was activated by miR‐31 overexpression, repressed by miR‐31 KO and rescued by CEBPA or DACH1 KO (Figures 5C and S6E). Taken together, we have identified the Wnt/β‐catenin pathway in mediating miR‐31‐CEBPA/DACH1 axis regulation through PTC development.
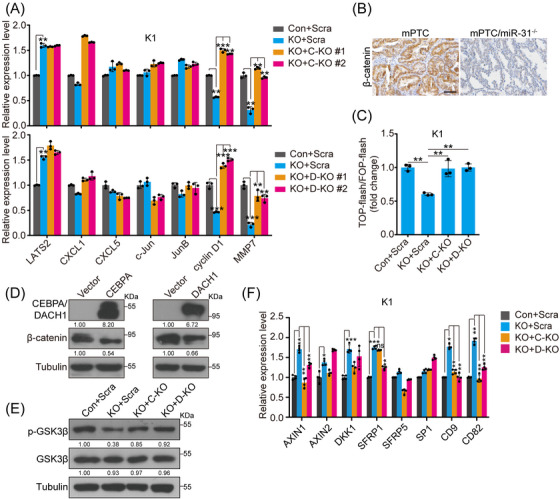
To explore how β‐catenin abundance is regulated by the miR‐31‐CEBPA/DACH1 axis, we first started with transcriptional regulation as CEBPA and DACH1 are transcriptional factors. Direct overexpression of CEBPA/DACH1 or indirect increase of CEBPA/DACH1 in miR‐31 KO cells negligibly affected CTNNB1 transcript levels, but dramatically repressed β‐catenin protein levels (Figures 5D and S6F). It is known that post‐translational stabilisation and nuclear‐translocation of β‐catenin is negatively regulated by GSK3β‐mediated phosphorylation.ref. ctm21694-bib-0039 Thus, we investigated whether the miR‐31‐CEBPA/DACH1 axis affects GSK3β. Interestingly, phosphorylated GSK3β at Ser9 (p‐GSK3β) was repressed by exogenous CEBPA/DACH1 or loss of miR‐31, but recovered by further CEBPA/DACH1 KO, which corresponds to β‐catenin protein level changes (Figures 5E and S6G).
Previous studies demonstrated that miR‐31 promotes Wnt/β‐catenin signalling by directly repressing AXIN1, GSK3β and DKK1.ref. ctm21694-bib-0040, ref. ctm21694-bib-0041 We explored the inhibitors of the Wnt/β‐catenin pathway and found multiple inhibitors were up‐regulated after miR‐31 KO, including AXIN1, AXIN2, DKK1, SFRP1, CD9 and CD82 (Figure S6H).ref. ctm21694-bib-0042, ref. ctm21694-bib-0043 Similarly, exogenous DACH1 alone promoted expression of AXIN1, SFRP1, CD9, CD82 and exogenous CEBPA promoted AXIN1, SFRP1, SP1, CD9 and CD82 (Figure S6H). Further analysis of miR‐31/CEBPA or miR‐31/DACH1 double‐KO cells confirmed that DACH1 and CEBPA could both antagonise Wnt/β‐catenin signalling through regulation of inhibitors such as AXIN1, CD9 and CD82 (Figure 5F). Therefore, miR‐31‐CEBPA and miR‐31‐DACH1 axis regulates Wnt/β‐catenin signalling through suppression of multiple inhibitors and phosphorylation of GSK3β (inactive state at p‐Ser9), which consequently leads to stabilisation of β‐catenin.
Loss of miR‐31 restored RAI‐sensitivity in BRAFV600E‐induced thyroid cancers
Clinical investigation has shown that the cumulative RAI received by patients significantly and positively correlates with β‐catenin expression.ref. ctm21694-bib-0044 In BRAFV600E‐induced PTC mouse model, Ctnnb1 deletion resulted in up‐regulated Nis so as to increased iodine uptake.ref. ctm21694-bib-0003 Since miR‐31 is indispensable for BRAFV600E‐induced PTC due to its regulation on Wnt/β‐catenin pathway, we asked whether miR‐31 is involved in PTC dedifferentiation and RAI refractoriness. Indeed, GSEA analysis showed that low miR‐31 enriched for genes involved in thyroid hormone metabolic processes (Figure S7A). Highly expressed miR‐31 in BRAFV600E PTC also correlated with reduced thyroid differentiation markers including SLC5A5, SLC5A8, TPO and DIO1/2 (Figures S7B–D), which were further verified by qRT‐PCR in primary mPTC cells (Figure 6A).
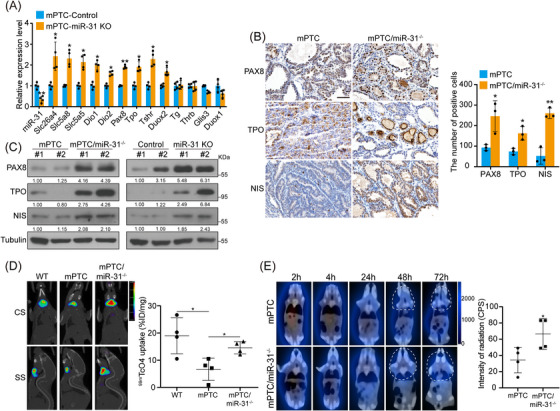
As previously reported, BRAFV600E‐induced mPTC exhibits downregulated thyroid differentiation genes, such as Pax8, Tpo and Nis.ref. ctm21694-bib-0035 Remarkably, miR‐31 KO in mPTC mice (mPTC/miR‐31−/−) restored differentiation markers expression at different tumourigenic stages (Figures 6B, C and S7E), thus resulted in markedly recovered thyroidal incorporation of 99mTcO4 and 131I‐iodide in vivo (Figures 6D and E). Representative SPECT/CT images and dosimetry calculations both demonstrated the dramatically increased 99mTcO4 uptake (Figure 6D). 99mTcO4 uptake in mPTC dropped to 20−30% of the WT level, while miR‐31 KO restored the 99mTcO4 uptake to about 70−80% of WT thyroid. More encouragingly, the results showed that the 131I radioactivity accumulated within the thyroid was rapidly excreted within 24 h in the mPTC mice, while loss of miR‐31 in mPTC/miR‐31−/− mice extended the 131I retention time beyond 72 h (Figure 6E). Thus, targeting miR‐31 may promote redifferentiation of BRAFV600E‐induced PTC and enhance RAI sensitivity.
NPs‐delivered anti‐miR‐31 inhibits PTC growth and alleviates 131I therapeutic efficiency in situ
Targeting therapy with NP‐delivered miRNA inhibitors are becoming promising therapeutic strategies for a variety of cancers. Considering loss of miR‐31 significantly promoted mPTC 131I uptake, we developed an 131I‐labelled mesoporous silica NPs (MSNs) with fluorescent miR‐31 antagomir (Anta) for simultaneous non‐invasive SPECT imaging and adjuvant therapy. As illustrated in Figure 7A, miR‐31 Anta was attached to the MSNs via electrostatic adsorption with the presence of BSA‐linked 131I. The loading of MSNs‐NH2 with miR‐31 Anta was optimised at the MSNs‐NH2:miR‐31 Anta ratio at 200:1 (Figure S8A). Morphology and particle sizes of MSNs–BSA–Anta–131I were examined by TEM and the hydrodynamic diameters of NPs ranged from 100−140 nm (Figure S8B). Compared with MSNs‐NH2, the fabricated MSNs–BSA–Anta–131I was ∼30 nm larger, suggesting successful loading of miR‐31 Anta and 131I. NP formulations exhibited low cytotoxicity and were capable of delivering miR‐31 Anta into cells (Figures 7B and C and S8C). Compared with control NPs, MSN–BSA–Anta inhibited K1 cell proliferation efficiently (Figures 7D and S8C). Moreover, conjugation onto NPs clearly increased cytotoxicity of 131I, thus MSNs–BSA–Anta–131I exhibited more significant repression of cell proliferation than either MSN–BSA–Anta or 131I alone (Figure 7D).
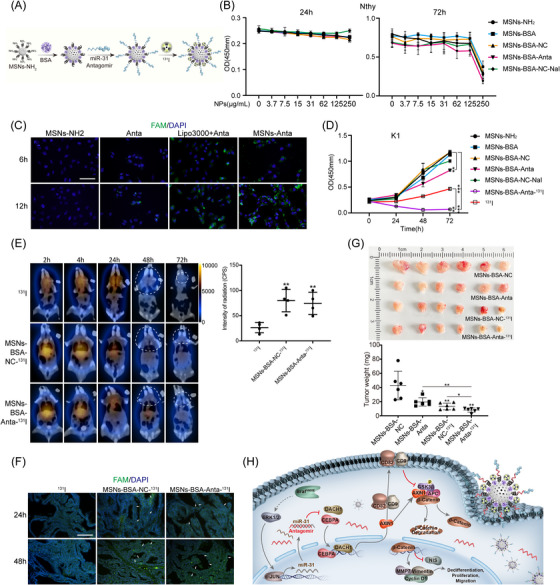
To determine the 131I uptake and miR‐31 Anta NPs distribution and also to evaluate the retention time of 131I in tumour tissues, SPECT/CT analysis was performed at different time points after tail vein injections on mPTC animals (Figure 7E). Notably, 131I‐labelled NPs in mPTC accumulated gradually to the maximum at 24 h and lasted beyond 72 h at intensities much greater than that observed in mice injected with 131I alone (Figure 7E). Fluorescence signal emitted by Anta was easily detected in MSN–BSA–Anta–131I‐treated tumour tissues (Figure 7F). These results indicate that 131I‐labelled NPs have better tumour homing and visual tracking capability.
Then, we tested the therapeutic effect of MSN–BSA–Anta–131I against BRAFV600E‐induced mPTC. 131I‐labelled NPs were safe in vivo for up to 30d since organs including lung, liver and kidney were histologically normal (Figure S8D). Compared with MSN–BSA–NC, MSN–BSA–Anta and MSN–BSA–NC‐131I both inhibited tumour growth with reduced tumour volumes and decreased Ki67 as well as cyclin D1 levels (Figures 7G and S8E and F). Remarkably, the integrated therapy with MSN–BSA–Anta–131I was the most effective and exhibited significantly repressive effect. Consistent with our mechanism findings, differentiation factors such as PAX8, TPO and NIS were repressed after miR‐31 Anta therapy, possibly due to CEBPA/DACH1 directed‐repression of Wnt/β‐catenin signalling (Figure S8G). Together, these findings indicate that targeting miR‐31 may provide an effective adjuvant therapy strategy to improve prognosis of RAI refractory PTC patients.
Collectively, BRAF/MAPK/c‐Jun induces high miR‐31 expression in PTC to promote tumour progression, metastasis and RAI refractoriness via maintaining Wnt/β‐catenin signalling and dedifferentiating. MiR‐31 represses tumour suppressors DACH1 and CEBPA, which otherwise direct the CD9, CD82 and AXIN1 expression (Figure 7H). 131I‐labelled NPs conjugated with miR‐31 Anta could be a novel treatment and a better SPECT/CT tracer for RAI refractory PTC.
DISCUSSION
In the current study, we found that miR‐31 positively correlates with PTC development and plays a critical role in the cancer progression, metastasis and dedifferentiation.ref. ctm21694-bib-0013 Mechanistic investigations showed that miR‐31 responds to constitutively activated BRAF/MAPK pathway and promotes Wnt/β‐catenin signalling activity via suppressing CEBPA and DACH1, which controls expression of specific Wnt/β‐catenin inhibitors, mainly CD9, CD82 and AXIN1. Combined application of antagomir against miR‐31 with 131I resulted in synergistic therapeutic effect on mPTC in situ. We, therefore, present a systematic understanding of the pathological function, molecular mechanism, as well as prospective application of miR‐31 in the development and treatment of advanced THCA.
Although the PTC cure rate reaches about 90% with current treatment modalities, patients experience a series of endocrine‐related problems and the risk to evolve into a poor prognosis disease. Furthermore, the AJCC staging system only provides limited reference for diagnosis stratification and recurrence prediction. For example, BRAFV600E, as the most common genetic mutation associated with PTC, correlates with aggressive PTC and cancer recurrence.ref. ctm21694-bib-0031, ref. ctm21694-bib-0045 Based on molecular diagnosis reports and sequencing of our own samples, around 60−80% patients are BRAFV600E‐positive, suggesting that BRAF status is not the singular indicator of PTC pathological behaviours and aggressive prognosis according to BRAFV600E mutation is still controversial.ref. ctm21694-bib-0046 Thus, to seek reliable risk stratification biomarkers, combined with BRAFV600E mutation would be helpful for PTC progression prediction and therapy personalisation.
Researchers have attempted to establish a miRNA panel for PTC stratification, and independent investigations have pointed to the oncogenic function of miR‐31 despite sporadic tumour‐suppressor reports.ref. ctm21694-bib-0047, ref. ctm21694-bib-0048 Our finding confirms the solid correlation between high miR‐31 abundance with PTC progression. More importantly, the current analysis across 139 patients proves that miR‐31 significantly correlated with BRAFV600E signature. The increased expression of miR‐31 is mainly due to MAPK activation and we define miR‐31 as a critical onco‐miR downstream of BRAFV600E. Based on analysis of clinical and TCGA samples, increased miR‐31 expression ranges differently, from a few times to almost a hundred times. Thus, we perform mechanism investigation within multiple human PTC cell lines and mPTC models which could represent a reasonable miR‐31 expression range for function study.
By directly targeting several Wnt/β‐catenin antagonists including AXIN1, GSK3β and DKK1, miR‐31 promotes the Wnt signalling pathway and tumour development within mammary and small intestine.ref. ctm21694-bib-0041, ref. ctm21694-bib-0049 Rather, in thyroid transformation, miR‐31 targets CEBPA and DACH1, thus elevates Wnt pathway via restricting Wnt pathway inhibitors including CD82, CD9, AXIN1 and others. Actually, Maggisano et al.ref. ctm21694-bib-0019 has reported that miR‐31 may be involved in BRAF‐related tumourigenesis by maintaining YAP/β‐catenin levels, our current study solidifies the function through genetic studies and also deciphers the detailed mechanism via systematic screening and validations. Therefore, critical pathways like Wnt/β‐catenin are under delicate control at multiple levels by oncogenes and onco‐miRs. Correlation between genetic mutations or expression changes of Wnt/β‐catenin pathway molecules and clinical PTC occurrences will be worthy of further investigation. The KEGG analysis suggests miR‐31 could also function via regulating other key pathways, although not necessarily though CEBPA/DACH1, thus further studies are required.
Moreover, the abundance and localisation of NIS play the most important role in thyrocytes iodide uptake and is often damaged in thyroid cancer.ref. ctm21694-bib-0002 PTC samples with BRAFV600E mutation progress to dedifferentiation with reduced NIS expression and membrane localisation,ref. ctm21694-bib-0050 which could be meliorated under combination treatment with PLX4032 and HDAC inhibitor SAHA (vorinostat).ref. ctm21694-bib-0051 Actually, β‐catenin has been shown to be involved in NIS localisation regulation, so that the cytomembrane localisation was transformed into intracellular localisation upon β‐catenin overexpression.ref. ctm21694-bib-0052 Considering the significance of miR‐31 on Wnt/β‐catenin signalling maintenance, it is necessary to check the effect of miR‐31 removal on NIS localisation in addition to the reduced expression, which would provide us more interesting mechanisms underlying of BRAFV600E‐induced PTC development.
In addition to the oncogenic function, miR‐31 is required for normal tissue stem cell maintenance within mammary, intestine, muscle and skin. Thyroid‐specific loss of miR‐31 caused subtle, if any, thyroid developmental defect in our mouse model. One possible understanding could relate to the relatively slow renewing frequency of thyroid follicular cells thus less dependency on stem cell function.ref. ctm21694-bib-0053 Global KO of miR‐31 significantly compromised breast tumourigenesis in MMTV‐PyVT model mostly due to cell‐fate transition.ref. ctm21694-bib-0041 Under BRAFV600E‐induced thyroid tumour mouse model, thyroid epithelial cell‐specific loss of miR‐31 is dramatic enough to block PTC development. As we have known, tumour microenvironment composition and immune‐suppressive cell function plays critical roles in tumour formation. MiR‐31 has been reported to be required for CD8+ T cell activation.ref. ctm21694-bib-0054 Thus, it will be interesting to decipher miR‐31 function from different cell origins, which will also provide necessary guidance for designing targeted therapy.
In conclusion, we found miR‐31 is important in BRAFV600E‐induced dedifferentiation of PTC, possibly due to the regulatory role on Wnt/β‐catenin pathway. Antagonising miR‐31 restores thyroid differentiation factors and increases RAI sensitivity in BRAFV600E‐associated thyroid cancer. Herein we further elucidate the involvement of miRNA in PTC dedifferentiation that otherwise has been limited in expression correlation studies.ref. ctm21694-bib-0012 Based on our findings, a novel therapeutic method was established by conjugating miR‐31 antagomir and 131I onto NPs, which indeed reduced PTC tumours in a synergistic manner. MSN–BSA–Anta–131I could be optimised for RAI refractory PTC therapy and for better tumour imaging. Due to limited clinical resources, we have no chances to testify the tumour repressive effect of these therapies on primary patient tissue‐derived organoids, while our study pushes the mechanism findings forward into a transformable therapeutic strategy and sheds light on the future treatment of advanced thyroid cancer.
AUTHOR CONTRIBUTIONS
Design: Li Zhao and Xingrui Li. Performance of experiments: Peitao Zhang, Lizhao Guan, Wei Sun and Yu Zhang. Clinical analysis: Yaying Du, Zhengquan Yu and Xiangqian Zheng. Statistical analysis: Wei Sun and Xiaolong Cao. Manuscript writing: Li Zhao, Peitao Zhang and Lizhao Guan.
CONFLICT OF INTEREST STATEMENT
The authors declare no conflict of interest.
ETHICS STATEMENT
For clinical samples, all patients signed an informed consent form issued by the Tianjin Cancer Institute and Hospital Ethics Committee. All mouse experiment procedures and protocols were evaluated and authorised by the Regulations of Tianjin Laboratory Animal Management and followed the guidelines under the Institutional Animal Care and Use Committee of Tianjin Medical University (Approval number: SKLAB‐2018‐04‐03).
Supplementary Materials
References
- Radioactive iodine‐refractory differentiated thyroid cancer and redifferentiation therapy.. Endocrinol Metab (Seoul)., 2019
- Molecular mechanisms of radioactive iodine refractoriness in differentiated thyroid cancer: impaired sodium iodide symporter (NIS) expression owing to altered signaling pathway activity and intracellular localization of NIS.. Theranostics., 2021
- beta‐Catenin attenuation inhibits tumor growth and promotes differentiation in a BRAF(V600E)‐driven thyroid cancer animal model.. Mol Cancer Ther., 2021
- Association of MicroRNA expression and BRAF(V600E) mutation with recurrence of thyroid cancer.. Biomolecules., 2020
- miRNA as markers for the diagnostic screening of colon cancer.. Expert Rev Anticanc., 2014
- Genetics, genetic testing, and biomarkers of digestive diseases.. Gastroenterology., 2015
- MicroRNA‐222 promotes invasion and metastasis of papillary thyroid cancer through targeting protein phosphatase 2 regulatory subunit B alpha expression.. Thyroid., 2018
- Downregulation of microR‐147b represses the proliferation and invasion of thyroid carcinoma cells by inhibiting Wnt/beta‐catenin signaling via targeting SOX15.. Mol Cell Endocrinol., 2020
- MicroRNA‐146b‐5p as an oncomiR promotes papillary thyroid carcinoma development by targeting CCDC6.. Cancer Lett., 2019. [PubMed]
- miRNA‐21 promotes cell proliferation and invasion via VHL/PI3K/AKT in papillary thyroid carcinoma.. Hum Cell., 2019
- Integrated genomic characterization of papillary thyroid carcinoma.. Cell., 2014
- The molecular and gene/miRNA expression profiles of radioiodine resistant papillary thyroid cancer.. J Exp Clin Canc Res., 2020
- Functions and mechanisms of microRNA‐31 in human cancers.. Biomed Pharmacother., 2018. [PubMed]
- Association of microRNA‐31 with BRAF mutation, colorectal cancer survival and serrated pathway.. Carcinogenesis., 2014
- Transcriptional regulation of miR‐31 by oncogenic KRAS mediates metastatic phenotypes by repressing RASA1.. Mol Cancer Res., 2016
- MicroRNA‐31 inhibits papillary thyroid carcinoma cell biological progression by directly targeting SOX11 and regulating epithelial‐to‐mesenchymal transition, ERK and Akt signaling pathways.. Eur Rev Med Pharmacol Sci., 2019
- miR‐31 reduces cell growth of papillary thyroid carcinoma by RNA‐binding protein HuR.. Clin Lab., 2015
- Deregulation of microRNA expression in thyroid neoplasias.. Nat Rev Endocrinol., 2014
- Expression of miR‐31‐5p affects growth, migration and invasiveness of papillary thyroid cancer cells.. Endocrine., 2023
- Long non‐coding RNA LIFR‐AS1 suppressed the proliferation, angiogenesis, migration and invasion of papillary thyroid cancer cells via the miR‐31‐5p/SIDT2 axis.. Cell Cycle., 2021
- An in vivo model for thyroid regeneration and folliculogenesis.. Lab Invest., 2018
- A new mouse model to explore the initiation, progression, and therapy of BRAF(V600E)‐induced lung tumors.. Gene Dev., 2007
- MiR‐31 promotes mammary stem cell expansion and breast tumorigenesis by suppressing Wnt signaling antagonists.. Nat Commun., 2017. [PubMed]
- Targeting myeloid derived suppressor cells reverts immune suppression and sensitizes BRAF‐mutant papillary thyroid cancer to MAPK inhibitors.. Nat Commun., 2022
- The Eighth Edition AJCC Cancer Staging Manual: continuing to build a bridge from a population‐based to a more “personalized” approach to cancer staging.. CA Cancer J Clin., 2017
- Comprehensive genetic characterization of human thyroid cancer cell lines: a validated panel for preclinical studies.. Clin Cancer Res., 2019
- TBX3 promotes proliferation of papillary thyroid carcinoma cells through facilitating PRC2‐mediated p57(KIP2) repression.. Oncogene., 2018
- miR‐22 promotes stem cell traits via activating Wnt/beta‐catenin signaling in cutaneous squamous cell carcinoma.. Oncogene., 2021
- Small‐molecule MAPK inhibitors restore radioiodine incorporation in mouse thyroid cancers with conditional BRAF activation.. J Clin Invest., 2011
- Antitumor effect of (131)I‐labeled anti‐VEGFR2 targeted mesoporous silica nanoparticles in anaplastic thyroid cancer.. Nanoscale Res Lett., 2019
- SWI/SNF complex mutations promote thyroid tumor progression and insensitivity to redifferentiation therapies.. Cancer Discov., 2021. [PubMed]
- Mouse thyroid primary culture.. Biochem Biophys Res Commun., 1999
- MicroRNA‐424 impairs ubiquitination to activate STAT3 and promote prostate tumor progression.. J Clin Invest., 2016
- AP‐1 transcription factors and the BAF complex mediate signal‐dependent enhancer selection.. Mol Cell., 2017. [PubMed]
- Thyrotrophin receptor signaling dependence of Braf‐induced thyroid tumor initiation in mice.. Proc Natl Acad Sci USA., 2011
- A tumor suppressor role for C/EBP alpha in solid tumors: more than fat and blood.. Oncogene., 2017
- DACH1 inhibits glioma invasion and tumor growth via the Wnt/catenin pathway.. Onco Targets Ther., 2018. [PubMed]
- Thymoquinone suppresses invasion and metastasis in bladder cancer cells by reversing EMT through the Wnt/beta‐catenin signaling pathway.. Chem Biol Interact., 2020. [PubMed]
- Intracellular signals activated by canonical wnt ligands independent of GSK3 inhibition and beta‐catenin stabilization.. Cells., 2019. [PubMed]
- Stress responsive miR‐31 is a major modulator of mouse intestinal stem cells during regeneration and tumorigenesis.. Elife., 2017. [PubMed]
- MiR‐31 promotes mammary stem cell expansion and breast tumorigenesis by suppressing Wnt signaling antagonists.. Nat Commun., 2017
- Glycoprotein 90K, downregulated in advanced colorectal cancer tissues, interacts with CD9/CD82 and suppresses the Wnt/beta‐catenin signal via ISGylation of beta‐catenin.. Gut., 2010
- The metastasis suppressor CD82/KAI1 represses the TGF‐beta 1 and Wnt signalings inducing epithelial‐to‐mesenchymal transition linked to invasiveness of prostate cancer cells.. Prostate., 2019
- Enhanced beta‐catenin expression is associated with recurrence of papillary thyroid carcinoma.. Endocr Pract., 2018
- Sustained ERK inhibition maximizes responses of Braf(V600E) thyroid cancers to radioiodine.. J Clin Investig., 2016
- MicroRNA signature distinguishes the degree of aggressiveness of papillary thyroid carcinoma.. Ann Surg Oncol., 2011
- Integrated microRNA, gene expression and transcription factors signature in papillary thyroid cancer with lymph node metastasis.. Peerj., 2016. [PubMed]
- Inverse correlation of miRNA and cell cycle‐associated genes suggests influence of miRNA on benign thyroid nodule tumorigenesis.. J Clin Endocrinol Metab., 2013. [PubMed]
- MiR‐31 mediates inflammatory signaling to promote re‐epithelialization during skin wound healing.. J Investig Dermatol., 2018
- The oncogene BRAF V600E is associated with a high risk of recurrence and less differentiated papillary thyroid carcinoma due to the impairment of Na+/I‐ targeting to the membrane.. Endocr Relat Cancer., 2006
- Robust thyroid gene expression and radioiodine uptake induced by simultaneous suppression of BRAF V600E and histone deacetylase in thyroid cancer cells.. J Clin Endocrinol Metab., 2016
- Inhibiting β‐catenin expression promotes efficiency of radioiodine treatment in aggressive follicular thyroid cancer cells probably through mediating NIS localization.. Oncol Rep., 2017
- Thyroid stem cells—danger or resource?. Acta Otorhinolaryngo., 2009
- The microRNA miR‐31 inhibits CD8(+) T cell function in chronic viral infection.. Nat Immunol., 2017