Prognostic significance of the rho GTPase RHOV and its role in tumor immune cell infiltration: a comprehensive pan‐cancer analysis
Abstract
Ras homolog gene family member V (RHOV) is an atypical Rho GTPase that participates in various important cellular processes. Although RHOV has been identified to play an oncogenic role in lung cancer and triple‐negative breast cancer, its role in other types of tumors remains unknown. In this study, we investigated the expression of RHOV in pan‐cancer analysis using The Cancer Genome Atlas (TCGA) and Gene‐Tissue Expression datasets. RHOV mRNA levels were dysregulated in several types of tumors. RHOV expression was identified as an independent prognostic factor in 7 of 33 types of tumors; however, the relationship varied according to tumor type. Higher RHOV expression was associated with a favorable prognosis in kidney renal cell carcinoma and prostate adenocarcinoma, for which RHOV expression was downregulated, whereas RHOV expression was associated with a poor prognosis for patients with adenoid cystic carcinoma, lung adenocarcinoma, pancreatic ductal adenocarcinoma, skin cutaneous melanoma, and uveal melanoma with upregulated RHOV expression. Furthermore, RHOV expression was associated with various clinicopathological parameters in these tumors. RHOV expression showed varied associations with different types of tumor‐infiltrating immune cells and demonstrated a potential impact on the response to immunotherapy depending on the cancer type. Additionally, functional enrichment analysis of RHOV‐related genes demonstrated a role in a wide range of developmental and immune‐related processes. This study provides valuable insights into the role of RHOV in pan‐cancer development, indicating its role as a tumor suppressor or oncogene according to the cancer type and tumor microenvironment.
Article type: Research Article
Keywords: immune infiltration, pan‐cancer, prognosis, RHOV, TCGA
Affiliations: Department of Oncology Jingzhou Hospital Affiliated to Yangtze University China; Department of Oncology The Second People’s Hospital of Jingmen China
License: © 2023 The Authors. FEBS Open Bio published by John Wiley & Sons Ltd on behalf of Federation of European Biochemical Societies. CC BY 4.0 This is an open access article under the terms of the http://creativecommons.org/licenses/by/4.0/ License, which permits use, distribution and reproduction in any medium, provided the original work is properly cited.
Article links: DOI: 10.1002/2211-5463.13698 | PubMed: 37596964 | PMC: PMC10626275
Relevance: Moderate: mentioned 3+ times in text
Full text: PDF (15.3 MB)
The tumor microenvironment (TME) is an intricate, dynamic, and cell‐rich environment that plays a critical role in cancer initiation, progression, and treatment response [ref. 1, ref. 2]. The TME consists of a diverse array of cells, including immune cells and stromal cells, along with extracellular matrix, blood, and lymphatic vessels [ref. 3]. Tumor‐infiltrating immune cells (TIICs), including T cells, B cells, natural killer (NK) cells, tumor‐associated macrophages, dendritic cells (DCs), and myeloid‐derived suppressor cells, play an important role in establishing the TME to facilitate tumor growth and survival [ref. 3].
Immune checkpoint inhibitors (ICIs) have revolutionized cancer treatment over the past decade, resulting in remarkable outcomes in some patients [ref. 4]. The efficacy of ICIs is influenced by various factors, including the tumor mutation burden, expression of programmed cell death‐1 and its ligand, and characteristics of the TME [ref. 1]. The proportion and distribution of TIICs also play roles in ICI efficacy [ref. 5]. Therefore, TIICs have attracted considerable research attention in recent years because they shape the immune response against cancer [ref. 6]. In particular, understanding the characteristics of TIICs and their relationship with tumor‐specific oncogenic alterations has become an important focus in data mining research [ref. 7, ref. 8, ref. 9, ref. 10, ref. 11, ref. 12, ref. 13].
The Rho family of GTPases, which belongs to the superfamily of Ras‐related small GTPases, comprises 20 members that can be categorized as classical or atypical Rho GTPases [ref. 14]. In general, Rho GTPases switch between an inactive and active GTP‐bound forms regulated by the balance between guanine nucleotide exchange factors and GTPase‐activating proteins [ref. 15]. Rho GTPases participate in various important cellular processes, including cell migration, adhesion, division, and cytoskeleton formation [ref. 16]. Ras homolog gene family member V (RHOV) is an atypical Rho GTPase that has been implicated in apoptosis, cell differentiation, migration, and cell–cell adhesion [ref. 17, ref. 18, ref. 19, ref. 20]. Ras homolog gene family member V is also overexpressed in certain cancers such as lung cancer and triple‐negative breast cancer (TNBC), suggesting a potential oncogenic role with prognostic significance [ref. 21, ref. 22, ref. 23, ref. 24]. However, a comprehensive pan‐cancer analysis of RHOV across different cancer types is lacking.
With the convenience of public databases such as The Cancer Genome Atlas (TCGA) and Gene Expression Omnibus (GEO), numerous researchers have investigated the association between specific genes and tumor immune infiltration, aiming to predict the efficacy of ICIs [ref. 8, ref. 9, ref. 10, ref. 12, ref. 25]. As RHOV participates in the differentiation of myeloid cells, especially along the monocyte lineage [ref. 26], we hypothesized that RHOV expression might correlate with TIICs. Therefore, in this study, we performed a comprehensive bioinformatic analysis to investigate the prognostic significance of RHOV expression in pan‐cancer. We also investigated the relationship between RHOV expression, clinicopathological parameters, TIICs, and the response to ICIs. This analysis can provide further insight into the potential biological functions of RHOV as a candidate target for new pan‐cancer immunotherapies and treatment strategies (Fig. 1).
Materials and methods
RHOV expression pattern in human pan‐cancer analysis
Clinical and gene expression data were derived from tumor and paraneoplastic tissues for 33 tumor types from tcga (https://portal.gdc.cancer.gov/) portal. Considering the small number of control samples in TCGA database and the lack of corresponding control samples from adrenocortical carcinoma (ACC), diffuse large B‐cell lymphoma, acute myeloid leukemia, low‐grade glioma, mesothelioma, ovarian serous cystadenocarcinoma, testicular germ cell tumors, uterine carcinosarcoma, and uveal melanoma (UVM), we supplemented normal tissue data from TCGA_Gene‐Tissue Expression (GTEx) datasets obtained from the University of California Santa Cruz xena portal (https://xenabrowser.net/datapages/). However, no normal group was available for mesothelioma and UVM in either database. Data of the normal control group for cholangiocarcinoma, head and neck squamous cell carcinoma, pheochromocytoma and paraganglioma, and sarcoma were obtained from TCGA only. For other cancer types, data of the normal control group were obtained from both TCGA and GTEx databases. Both databases were used to explore the potential dysregulation of RHOV expression between all 33 tumor types and normal tissues; TCGA dataset was used to compare the differential expression of RHOV between 23 types of tumors and matched normal tissues. Gene expression levels were represented as log2 (TPM + 1) values.
The Human Protein Atlas (HPA; https://www.proteinatlas.org/) was used to determine the protein expression of RHOV in 44 different normal tissues and 20 types of tumors based on immunohistochemical images and corresponding analysis.
Prognosis analysis
Univariate and multivariate Cox proportional hazards regression analyses were used to identify whether RHOV expression was an independent prognostic factor for overall survival (OS) in patients with 33 cancer types from TCGA. The associations of RHOV expression with disease‐specific survival and the progression‐free interval were further investigated in cancers showing a significant association of RHOV expression with OS. Patients were dichotomized into low‐ and high‐expression groups based on median RHOV mRNA expression level. Forest plots and Kaplan–Meier survival curves were used to visualize the results. Hazard ratios and 95% confidence intervals were calculated using univariate survival analysis, and the survival curves with P < 0.05.
Independent validation of RHOV expression based on GEO datasets
To further verify the differential expression of RHOV in tumors showing a significant correlation of RHOV with prognosis, we compared gene expression profiles of normal and tumor samples from the GEO datasets (https://www.ncbi.nlm.nih.gov/geo/) GSE10927 (ACC), GSE36895 (kidney renal clear cell carcinoma [KIRC]), GSE53757 (KIRC), GSE31210 (lung adenocarcinoma [LUAD]), GSE71729 (pancreatic adenocarcinoma [PAAD]), GSE32571 (prostate adenocarcinoma [PRAD]), and GSE15605 (skin cutaneous melanoma [SKCM]).
Correlation between RHOV expression and clinicopathological parameters
The correlation between RHOV expression and available clinicopathological parameters, including pathologic/clinical stage, T stage, N stage, M stage, treatment outcomes, and histological grade, was evaluated in tumors for which RHOV expression was significantly associated with prognosis. In addition, prostate‐specific antigen and Gleason scores were included for the PRAD analysis, whereas ulceration and Breslow depth were included for the SKCM analysis.
Immune infiltration analysis and prediction of ICI response
Tumor Immune Estimation Resource 2.0 (timer 2.0; http://timer.cistrome.org/) was used to analyze the correlation between RHOV expression and various types of immune cells, including CD4+ T cells, CD8+ T cells, B cells, macrophages, NK cells, and regulatory T cells, across the seven tumor types showing a significant prognostic association with RHOV in TCGA [ref. 27]. Single‐sample gene set enrichment analysis (GSEA) was further employed using the r package ‘GSVA’ to measure the per‐sample infiltration levels of 24 immune cell types [ref. 28]. Finally, the r package ‘estimate’ was used to calculate the ImmuneScore, StromalScore, and ESTIMATEScore in the TME [ref. 29].
The Tumor Immune Dysfunction and Exclusion (TIDE) algorithm was used to predict the potential benefits of ICIs for patients according to the TIICs analysis [ref. 30]. In addition, the IMvigor210 cohort was examined to investigate the potential role of RHOV in predicting the benefits of ICIs [ref. 31].
Functional enrichment analysis
Gene Ontology (GO), including biological pathway, cellular component, and molecular function terms, and Kyoto Encyclopedia of Genes and Genomes (KEGG) pathway analyses were performed based on RHOV‐related genes, which were selected according to the top 100 genes with similar expression patterns to those of RHOV from the GEPIA2 database (http://gepia2.cancer‐pku.cn/). In addition, enrichment analyses were performed according to differentially expressed genes in the high‐ and low‐RHOV expression groups for the seven tumors in which RHOV expression was associated with prognosis. Differentially expressed genes were identified using the ‘deseq2’ r package according to adjusted P value < 0.05 and log2 fold change ≥ 1.5 or ≤ −1.5. GSEA was also performed on these differentially expressed genes using the ‘clusterprofiler’ r package.
Statistical analysis
The Wilcoxon rank‐sum test was used to compare differences between two groups, and the Spearman rank test was used to calculate correlations. The log‐rank test was used for Kaplan–Meier survival analysis. r version 4.2.2 was used for all bioinformatic and statistical analyses. P < 0.05 was considered statistically significant.
Results
Pan‐cancer expression landscape of RHOV
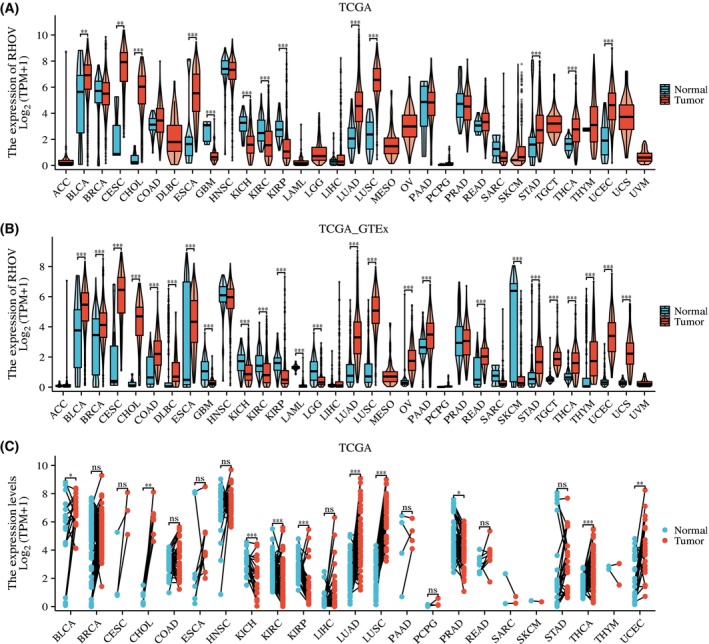
Analyses of TCGA and TCGA_GTEx databases showed that RHOV mRNA levels were dysregulated in several tumors (Fig. 2). According to TCGA_GTEx analysis, RHOV expression was upregulated in 18 tumor types, including bladder urothelial carcinoma, breast invasive carcinoma, cervical squamous cell carcinoma and endocervical adenocarcinoma, cholangiocarcinoma, colon adenocarcinoma, diffuse large B‐cell lymphoma, esophageal carcinoma, LUAD, lung squamous cell carcinoma, ovarian serous cystadenocarcinoma, PAAD, rectum adenocarcinoma, stomach adenocarcinoma, testicular germ cell tumors, thyroid carcinoma, thymoma, uterine corpus endometrial carcinoma, and uterine carcinosarcoma. Conversely, RHOV expression was downregulated in seven tumor types: glioblastoma multiforme, kidney chromophobe, KIRC, kidney renal papillary cell carcinoma, acute myeloid leukemia, low‐grade glioma, and SKCM.
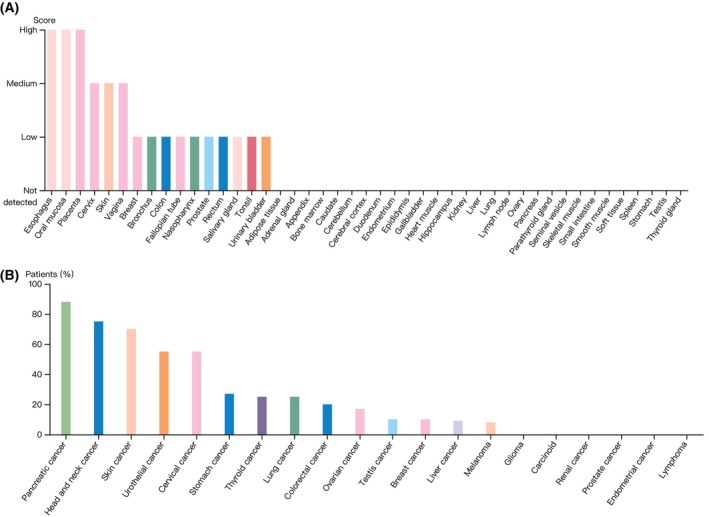
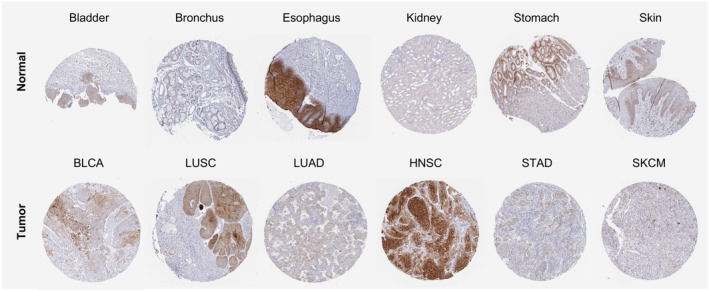
According to the HPA dataset, RHOV protein was expressed in several normal tissues, with the highest expression observed in the squamous epithelia such as the esophagus, oral mucosa, and skin (Fig. 3A). In terms of tumor tissues, pancreatic cancer, head and neck cancer, skin cancer, urothelial cancer, cervical cancer, and stomach cancer showed moderate to strong cytoplasmic and/or membranous staining of RHOV, whereas RHOV staining was negative for glioma, carcinoid, renal cancer, prostate cancer, endometrial cancer, and lymphoma (Fig. 3B). Representative immunohistochemistry images of RHOV protein expression in normal and tumor tissues are shown in Fig. 4.
Association between RHOV expression and prognosis in pan‐cancer
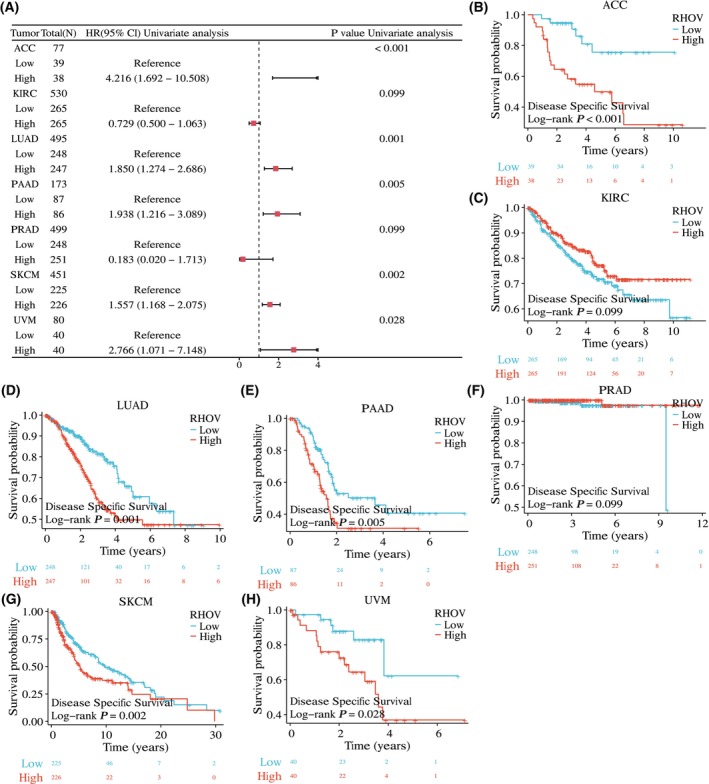
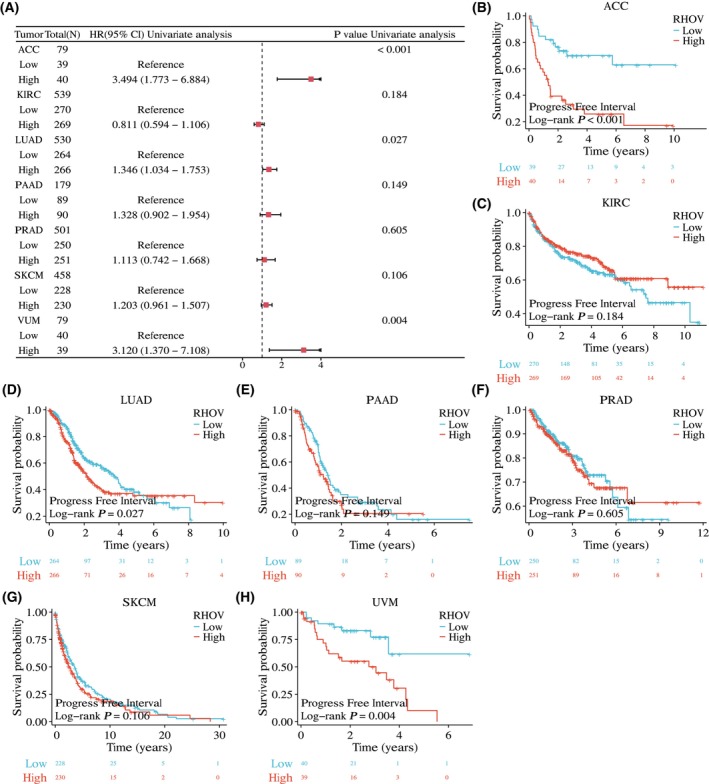
The univariate Cox regression analyses showed that RHOV expression was significantly correlated with OS in seven tumor types: ACC, KIRC, LUAD, PAAD, PRAD, SKCM, and UVM (Fig. 5A; Table 1). Kaplan–Meier survival curves demonstrated that upregulated RHOV expression was associated with poor OS in patients with ACC, LUAD, PAAD, SKCM, and UVM (Fig. 5B,D,E,G,H). Conversely, downregulated RHOV expression was associated with unfavorable OS in patients with KIRC and PRAD (Fig. 5C,F). Multivariate Cox regression analysis confirmed RHOV as an independent prognostic factor in these seven tumors (Tables 2, 3, 4, 5, 6, 7, 8). Furthermore, high expression levels of RHOV correlated with worse disease‐specific survival in patients with ACC, LUAD, PAAD, SKCM, and UVM, and were associated with a shorter progression‐free interval in patients with ACC and LUAD (Figs 6 and 7).
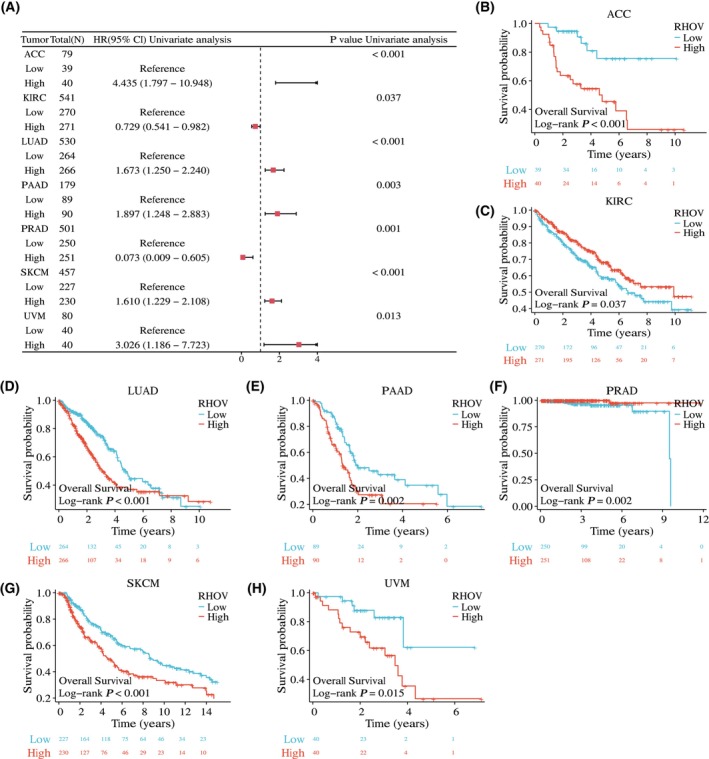
Table 1: Univariate Cox regression of RHOV expression with OS in pan‐cancer.
| Cancer type | Total (N) | HR (95% CI) | P value |
|---|---|---|---|
| ACC | 79 | 4.435 (1.797–10.948) | < 0.001 |
| BLCA | 411 | 1.108 (0.828–1.484) | 0.490 |
| BRCA | 1086 | 1.154 (0.836–1.592) | 0.383 |
| CESC | 306 | 1.328 (0.830–2.123) | 0.234 |
| CHOL | 35 | 0.768 (0.294–2.003) | 0.589 |
| COAD | 477 | 1.442 (0.977–2.130) | 0.064 |
| DLBC | 48 | 3.671 (0.736–18.313) | 0.086 |
| ESCA | 163 | 0.964 (0.590–1.577) | 0.884 |
| GBM | 168 | 1.121 (0.799–1.573) | 0.507 |
| HNSC | 503 | 0.830 (0.636–1.085) | 0.172 |
| KICH | 64 | 1.320 (0.353–4.930) | 0.679 |
| KIRC | 541 | 0.729 (0.541–0.982) | 0.037 |
| KIRP | 290 | 1.158 (0.639–2.100) | 0.628 |
| LAML | 139 | 0.729 (0.477–1.113) | 0.142 |
| LGG | 530 | 0.883 (0.630–1.238) | 0.471 |
| LIHC | 373 | 1.281 (0.907–1.809) | 0.159 |
| LUAD | 530 | 1.673 (1.250–2.240) | < 0.001 |
| LUSC | 496 | 0.810 (0.617–1.064) | 0.128 |
| MESO | 86 | 0.949 (0.597–1.508) | 0.825 |
| OV | 379 | 1.054 (0.814–1.364) | 0.69 |
| PAAD | 179 | 1.897 (1.248–2.883) | 0.003 |
| PCPG | 184 | 0.618 (0.147–2.594) | 0.504 |
| PRAD | 501 | 0.073 (0.009–0.605) | 0.001 |
| READ | 166 | 1.919 (0.875–4.207) | 0.101 |
| SARC | 263 | 0.998 (0.673–1.480) | 0.991 |
| SKCM | 457 | 1.610 (1.229–2.108) | < 0.001 |
| STAD | 370 | 0.998 (0.720–1.385) | 0.993 |
| TGCT | 139 | 0.237 (0.023–2.417) | 0.188 |
| THCA | 512 | 0.486 (0.169–1.400) | 0.166 |
| THYM | 119 | 1.611 (0.402–6.458) | 0.492 |
| UCEC | 553 | 1.272 (0.847–1.909) | 0.246 |
| UCS | 57 | 0.953 (0.490–1.852) | 0.886 |
| UVM | 80 | 3.026 (1.186–7.723) | 0.013 |
Table 2: Univariate and multivariate cox regression analysis for OS in ACC.
| Characteristics | Total (N) | Univariate analysis | Multivariate analysis | ||
|---|---|---|---|---|---|
| Hazard ratio (95% CI) | P value | Hazard ratio (95% CI) | P value | ||
| Age | 79 | 0.125 | |||
| ≤ 50 | 41 | Reference | |||
| > 50 | 38 | 1.799 (0.846–3.824) | 0.127 | ||
| Gender | 79 | 0.999 | |||
| Female | 48 | Reference | |||
| Male | 31 | 1.001 (0.469–2.137) | 0.999 | ||
| Pathologic T stage | 77 | < 0.001 | |||
| T1&T2 | 51 | Reference | Reference | ||
| T3&T4 | 26 | 10.286 (3.976–26.608) | < 0.001 | 11.505 (1.459–90.722) | 0.020 |
| Pathologic N stage | 77 | 0.184 | |||
| N0 | 68 | Reference | |||
| N1 | 9 | 2.038 (0.769–5.400) | 0.152 | ||
| Pathologic stage | 77 | < 0.001 | |||
| Stage I&Stage II | 46 | Reference | Reference | ||
| Stage III&Stage IV | 31 | 6.476 (2.706–15.498) | < 0.001 | 0.692 (0.084–5.678) | 0.732 |
| RHOV | 79 | < 0.001 | |||
| Low | 39 | Reference | Reference | ||
| High | 40 | 4.435 (1.797–10.948) | 0.001 | 3.370 (1.327–8.560) | 0.011 |
Table 3: Univariate and multivariate cox regression analysis for OS in KIRC.
| Characteristics | Total (N) | Univariate analysis | Multivariate analysis | ||
|---|---|---|---|---|---|
| Hazard ratio (95% CI) | P value | Hazard ratio (95% CI) | P value | ||
| Age | 541 | < 0.001 | |||
| ≤ 60 | 269 | Reference | Reference | ||
| > 60 | 272 | 1.791 (1.319–2.432) | < 0.001 | 1.717 (1.113–2.650) | 0.015 |
| Gender | 541 | 0.614 | |||
| Female | 187 | Reference | |||
| Male | 354 | 0.924 (0.679–1.257) | 0.613 | ||
| Pathologic T stage | 541 | < 0.001 | |||
| T1 | 279 | Reference | Reference | ||
| T2 | 71 | 1.490 (0.895–2.481) | 0.125 | 0.118 (0.022–0.640) | 0.013 |
| T3&T4 | 191 | 3.555 (2.536–4.982) | < 0.001 | 0.443 (0.125–1.566) | 0.206 |
| Pathologic N stage | 258 | 0.001 | |||
| N0 | 242 | Reference | Reference | ||
| N1 | 16 | 3.422 (1.817–6.446) | < 0.001 | 1.842 (0.909–3.730) | 0.090 |
| Pathologic stage | 538 | < 0.001 | |||
| Stage I | 273 | Reference | Reference | ||
| Stage II | 59 | 1.183 (0.638–2.193) | 0.594 | 7.304 (1.106–48.255) | 0.039 |
| Stage III | 123 | 2.649 (1.767–3.971) | < 0.001 | 5.317 (1.407–20.090) | 0.014 |
| Stage IV | 83 | 6.622 (4.535–9.670) | < 0.001 | 20.021 (4.716–84.999) | < 0.001 |
| RHOV | 541 | 0.037 | |||
| Low | 270 | Reference | Reference | ||
| High | 271 | 0.729 (0.541–0.982) | 0.037 | 0.479 (0.309–0.743) | 0.001 |
Table 4: Univariate and multivariate cox regression analysis for OS in LUAD.
| Characteristics | Total (N) | Univariate analysis | Multivariate analysis | ||
|---|---|---|---|---|---|
| Hazard ratio (95% CI) | P value | Hazard ratio (95% CI) | P value | ||
| Age | 520 | 0.185 | |||
| ≤ 65 | 257 | Reference | |||
| > 65 | 263 | 1.216 (0.910–1.625) | 0.186 | ||
| Gender | 530 | 0.570 | |||
| Female | 283 | Reference | |||
| Male | 247 | 1.087 (0.816–1.448) | 0.569 | ||
| Pathologic T stage | 527 | < 0.001 | |||
| T1 | 176 | Reference | Reference | ||
| T2 | 285 | 1.507 (1.059–2.146) | 0.023 | 1.269 (0.882–1.827) | 0.199 |
| T3&T4 | 66 | 3.095 (1.967–4.868) | < 0.001 | 1.882 (1.096–3.230) | 0.022 |
| Pathologic N stage | 514 | < 0.001 | |||
| N0 | 345 | Reference | Reference | ||
| N1&N2&N3 | 169 | 2.547 (1.904–3.407) | < 0.001 | 1.530 (0.895–2.615) | 0.120 |
| Pathologic stage | 522 | < 0.001 | |||
| Stage I | 292 | Reference | Reference | ||
| Stage II | 123 | 2.341 (1.638–3.346) | < 0.001 | 1.405 (0.785–2.515) | 0.252 |
| Stage III&Stage IV | 107 | 3.635 (2.574–5.132) | < 0.001 | 1.898 (0.973–3.701) | 0.060 |
| RHOV | 530 | < 0.001 | |||
| Low | 264 | Reference | Reference | ||
| High | 266 | 1.673 (1.250–2.240) | < 0.001 | 1.375 (1.015–1.862) | 0.039 |
Table 5: Univariate and multivariate cox regression analysis for OS in PAAD.
| Characteristics | Total (N) | Univariate analysis | Multivariate analysis | ||
|---|---|---|---|---|---|
| Hazard ratio (95% CI) | P value | Hazard ratio (95% CI) | P value | ||
| Age | 179 | 0.230 | |||
| ≤ 65 | 94 | Reference | |||
| > 65 | 85 | 1.285 (0.853–1.937) | 0.230 | ||
| Gender | 179 | 0.320 | |||
| Female | 80 | Reference | |||
| Male | 99 | 0.813 (0.541–1.222) | 0.319 | ||
| Pathologic T stage | 177 | 0.017 | |||
| T1&T2 | 31 | Reference | Reference | ||
| T3&T4 | 146 | 2.035 (1.079–3.838) | 0.028 | 1.576 (0.586–4.243) | 0.368 |
| Pathologic N stage | 174 | 0.002 | |||
| N0 | 50 | Reference | Reference | ||
| N1 | 124 | 2.161 (1.287–3.627) | 0.004 | 2.126 (1.129–4.005) | 0.020 |
| Pathologic stage | 176 | 0.018 | |||
| Stage I | 21 | Reference | Reference | ||
| Stage II&Stage III&Stage IV | 155 | 2.309 (1.059–5.033) | 0.035 | 0.555 (0.143–2.150) | 0.395 |
| RHOV | 179 | 0.003 | |||
| Low | 89 | Reference | Reference | ||
| High | 90 | 1.897 (1.248–2.883) | 0.003 | 1.766 (1.154–2.701) | 0.009 |
Table 6: Univariate and multivariate cox regression analysis for OS in PRAD.
| Characteristics | Total (N) | Univariate analysis | Multivariate analysis | ||
|---|---|---|---|---|---|
| Hazard ratio (95% CI) | P value | Hazard ratio (95% CI) | P value | ||
| Age | 501 | 0.479 | |||
| ≤ 60 | 225 | Reference | |||
| > 60 | 276 | 1.578 (0.441–5.650) | 0.484 | ||
| Pathologic T stage | 494 | 0.134 | |||
| T2 | 189 | Reference | |||
| T3&T4 | 305 | 3.277 (0.608–17.655) | 0.167 | ||
| Pathologic N stage | 428 | 0.126 | |||
| N0 | 348 | Reference | |||
| N1 | 80 | 3.470 (0.767–15.695) | 0.106 | ||
| Gleason score | 501 | 0.007 | |||
| 6&7 | 294 | Reference | Reference | ||
| 8&9&10 | 207 | 6.654 (1.371–32.298) | 0.019 | 9.407 (1.647–53.718) | 0.012 |
| RHOV | 501 | 0.001 | |||
| Low | 250 | Reference | Reference | ||
| High | 251 | 0.073 (0.009–0.605) | 0.015 | 0.053 (0.006–0.500) | 0.010 |
Table 7: Univariate and multivariate cox regression analysis for OS in SKCM.
| Characteristics | Total (N) | Univariate analysis | Multivariate analysis | ||
|---|---|---|---|---|---|
| Hazard ratio (95% CI) | P value | Hazard ratio (95% CI) | P value | ||
| Age | 457 | < 0.001 | |||
| ≤ 60 | 247 | Reference | Reference | ||
| > 60 | 210 | 1.663 (1.256–2.201) | < 0.001 | 1.242 (0.893–1.727) | 0.197 |
| Gender | 457 | 0.256 | |||
| Female | 173 | Reference | |||
| Male | 284 | 1.180 (0.885–1.574) | 0.261 | ||
| Pathologic T stage | 362 | < 0.001 | |||
| T1 | 42 | Reference | Reference | ||
| T2 | 77 | 1.523 (0.826–2.806) | 0.178 | 1.710 (0.866–3.376) | 0.122 |
| T3 | 90 | 2.135 (1.179–3.867) | 0.012 | 1.915 (0.975–3.761) | 0.059 |
| T4 | 153 | 3.780 (2.109–6.776) | < 0.001 | 3.794 (1.942–7.411) | < 0.001 |
| Pathologic N stage | 403 | < 0.001 | |||
| N0 | 225 | Reference | Reference | ||
| N1&N2&N3 | 178 | 1.760 (1.310–2.365) | < 0.001 | 2.857 (1.015–8.040) | 0.047 |
| Pathologic stage | 411 | 0.001 | |||
| Stage I&Stage II | 218 | Reference | Reference | ||
| Stage III&Stage IV | 193 | 1.625 (1.213–2.175) | 0.001 | 0.683 (0.243–1.923) | 0.470 |
| RHOV | 457 | < 0.001 | |||
| Low | 227 | Reference | Reference | ||
| High | 230 | 1.610 (1.229–2.108) | < 0.001 | 1.488 (1.083–2.045) | 0.014 |
Table 8: Univariate and multivariate cox regression analysis for OS in UVM.
| Characteristics | Total (N) | Univariate analysis | Multivariate analysis | ||
|---|---|---|---|---|---|
| Hazard ratio (95% CI) | P value | Hazard ratio (95% CI) | P value | ||
| Age | 80 | 0.075 | |||
| ≤ 60 | 40 | Reference | Reference | ||
| > 60 | 40 | 2.123 (0.914–4.933) | 0.080 | 3.449 (1.350–8.814) | 0.010 |
| Gender | 80 | 0.316 | |||
| Female | 35 | Reference | |||
| Male | 45 | 1.542 (0.651–3.652) | 0.325 | ||
| Clinical T stage | 78 | 0.051 | |||
| T2&T3 | 40 | Reference | Reference | ||
| T4 | 38 | 2.416 (0.964–6.055) | 0.060 | 5.681 (1.917–16.834) | 0.002 |
| Clinical N stage | 80 | 0.058 | |||
| N0 | 76 | Reference | Reference | ||
| NX | 4 | 6.177 (1.302–29.304) | 0.022 | 15.583 (1.594–152.382) | 0.018 |
| Clinical stage | 80 | 0.220 | |||
| Stage II | 36 | Reference | |||
| Stage III&Stage IV | 44 | 1.718 (0.704–4.193) | 0.234 | ||
| RHOV | 80 | 0.013 | |||
| Low | 40 | Reference | Reference | ||
| High | 40 | 3.026 (1.186–7.723) | 0.021 | 3.629 (1.338–9.844) | 0.011 |
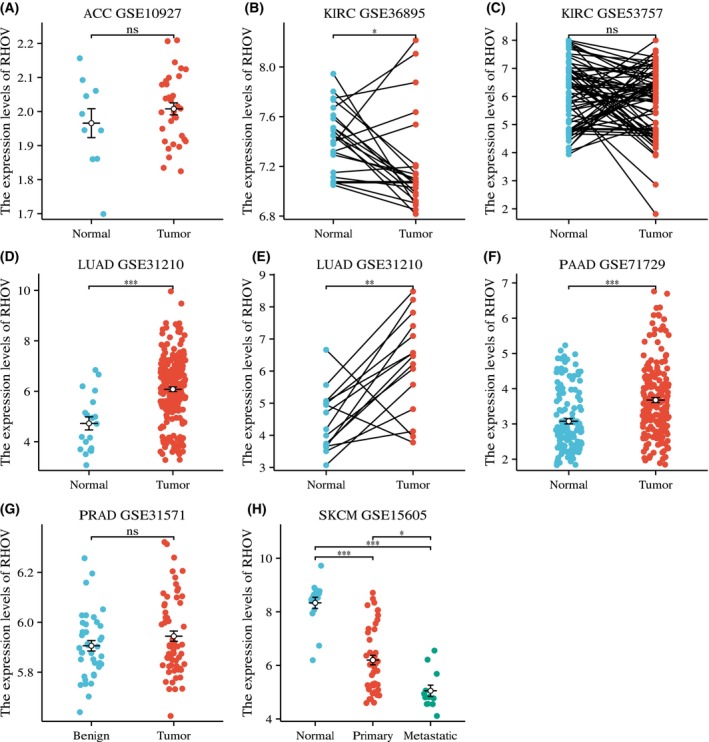
Validation of RHOV expression patterns in ACC, KIRC, LUAD, PAAD, PRAD, and SKCM
Based on the prognostic value of RHOV in the analyses described above, we further attempted to validate the expression pattern of RHOV in these tumors by exploring GEO datasets. RHOV expression was relatively low in ACC samples, with no differential expression between tumor and normal tissues (Fig. 8A). In KIRC, the GSE36895 dataset showed downregulated expression of RHOV in tumors compared with normal tissues (Fig. 8B), which was consistent with the results from TCGA_GTEx, whereas the GSE53757 dataset showed no differential expression between matched tumor and normal tissues (Fig. 8C). RHOV expression was upregulated in both LUAD (Fig. 8D,E) and PAAD (Fig. 8F), confirming the results from TCGA_GTEx. However, no differential expression was observed for PRAD in the GSE32571 dataset (Fig. 8G). In SKCM, RHOV expression was downregulated in primary and metastatic tissues compared with normal tissues, and it was also downregulated in metastatic tissues compared with primary tissues (Fig. 8H). No GEO series of UVM‐containing normal tissues could be identified for this analysis.
Correlation between RHOV expression and clinicopathological parameters
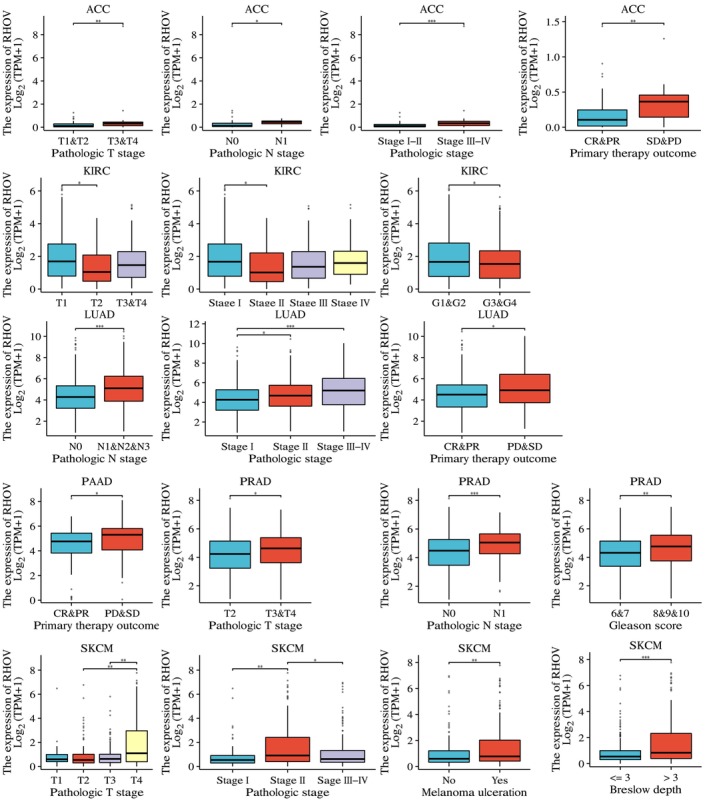
We further investigated the association between RHOV expression and various clinicopathological parameters in the six tumors for which RHOV demonstrated prognostic significance and relevant data were available. High RHOV expression correlated with high pathological T stage in ACC, PRAD, and SKCM; high pathological N stage in ACC, LUAD, and PRAD; advanced pathological stage in ACC, LUAD, and SKCM; and worse treatment outcomes in ACC, LUAD, and PAAD. High RHOV expression was also associated with a high Gleason score in PRAD, as well as with the presence of ulceration and Breslow depth in SKCM (Fig. 9).
Correlation of RHOV expression with TME
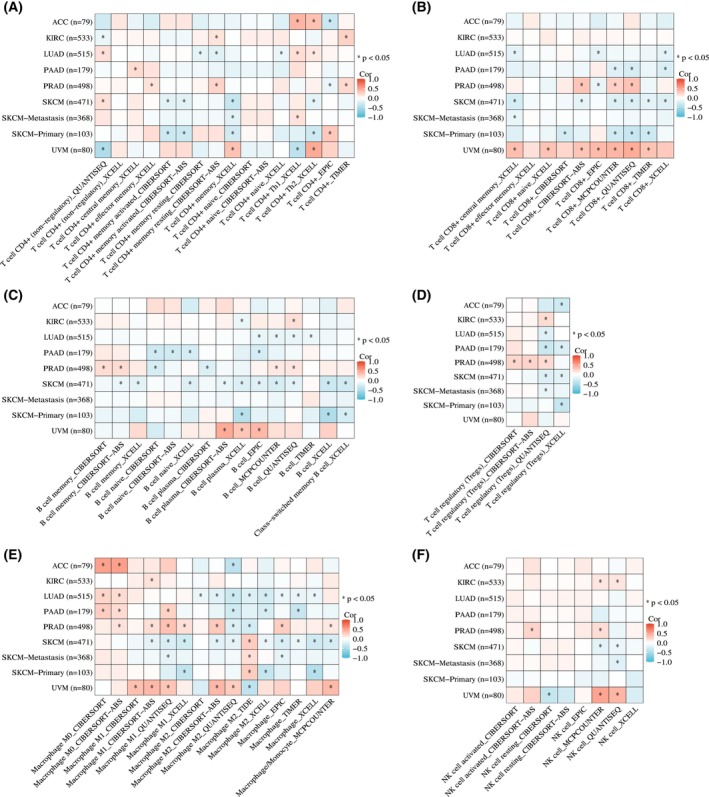
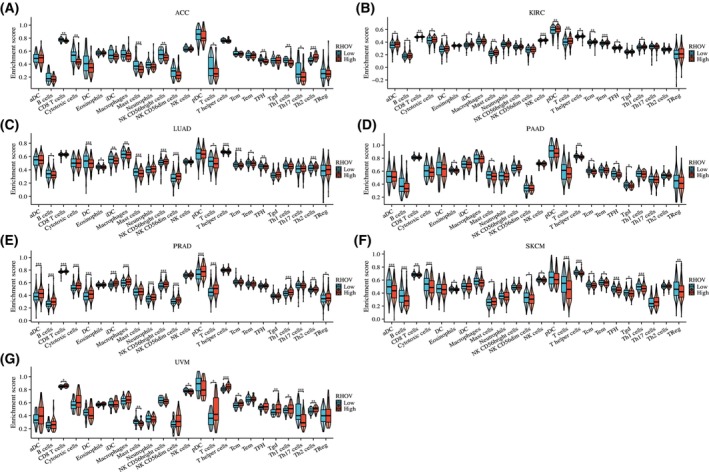
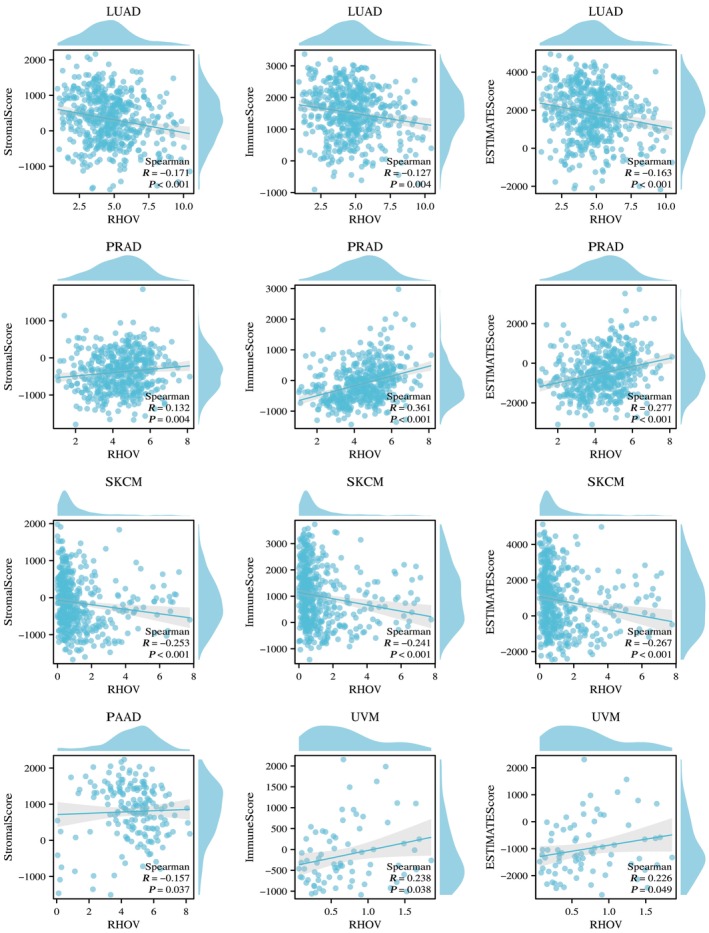
Heatmaps in Fig. 10 demonstrate correlations between RHOV expression and CD4+ T cells, CD8+ T cells, B cells, regulatory T cells, macrophages, and NK cells. RHOV expression was negatively correlated with CD8+ T and B cells in LUAD and SKCM, whereas it was significantly correlated with various immune cells in PRAD and UVM. In ACC and SKCM, RHOV expression was negatively correlated with T cells, CD8+ T cells, and cytotoxic cells, whereas positive correlations for these cells were observed in KIRC and PRAD tumors. RHOV expression also correlated negatively with B cells, DCs, and induced DCs in LUAD, but positively correlated with these cells in KIRC and PRAD (Fig. 11). Furthermore, RHOV expression was negatively correlated with ImmuneScore and ESTIMATEScore in LUAD and SKCM but positively correlated with these scores in PRAD and UVM (Fig. 12).
Correlation of RHOV expression with response to ICIs
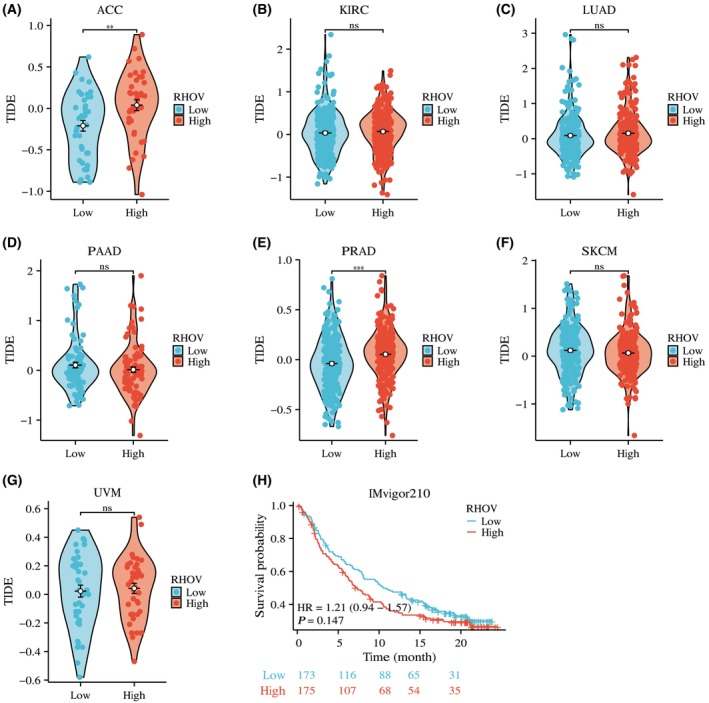
Based on the correlation between RHOV expression and immune infiltration, we further explored whether RHOV expression can predict the potential benefits of ICIs. As shown in Fig. 13, for ACC (Fig. 13A) and PRAD (Fig. 13E), the TIDE score was significantly higher in the high RHOV expression group than in the low RHOV expression group, suggesting that high RHOV expression levels may predict worse responses to ICIs in these tumors. However, in KIRC (Fig. 13B), LUAD (Fig. 13C), PAAD (Fig. 13D), SKCM (Fig. 13F), and UVM (Fig. 13G), the TIDE score was similar between the high and low RHOV expression groups, indicating that the RHOV expression level would not be a useful predictor of the benefits of ICIs in these tumors. Analysis of the IMvigor210 cohort showed no difference in survival between the high and low RHOV expression groups (Fig. 13H).
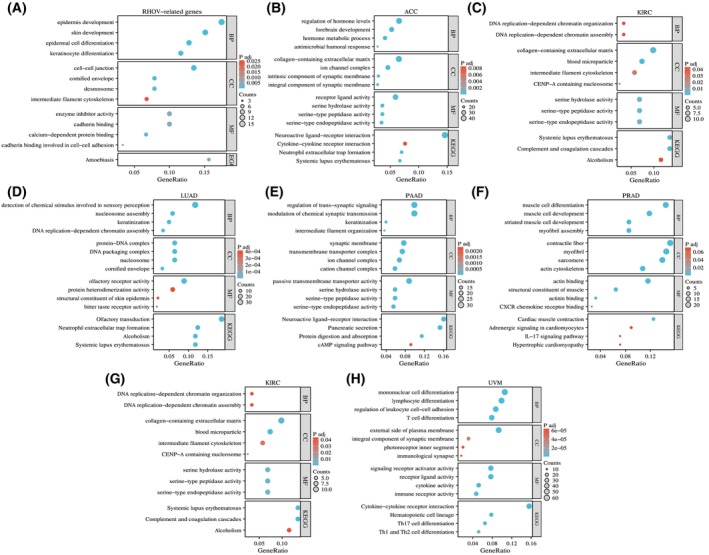
Functional enrichment analysis of RHOV‐related genes
GO analysis suggested that RHOV‐related genes may be involved in various biological processes (Table 9), including ‘epidermis development,’ ‘regulation of hormone levels,’ ‘forebrain development,’ ‘DNA‐replication‐dependent chromatin organization,’ ‘detection of chemical stimulus involved in sensory perception,’ ‘intermediate filament organization,’ ‘muscle cell differentiation,’ and ‘mononuclear cell differentiation.’ KEGG analysis indicated that RHOV‐related genes may participate in pathways such as ‘amoebiasis,’ ‘neuroactive ligand‐receptor interaction,’ ‘cytokine‐cytokine receptor interaction,’ ‘complement and coagulation cascades,’ ‘systemic lupus erythematosus,’ ‘cAMP signaling pathway,’ ‘IL‐17 signaling pathway,’ ‘Th 17 cell differentiation,’ and ‘Th1 and Th2 cell differentiation’ (Fig. 14).
Table 9: Top‐100 genes of most similar expression pattern with RHOV in pan‐cancer.
| Gene symbol | PCC | Gene symbol | PCC | Gene symbol | PCC |
|---|---|---|---|---|---|
| AIM1L | 0.6 | SDC1 | 0.5 | TRIM7 | 0.45 |
| TRIM29 | 0.6 | FABP5 | 0.5 | TMEM79 | 0.45 |
| PPP1R13L | 0.59 | RHBDL2 | 0.5 | FAM83C | 0.45 |
| PVRL4 | 0.58 | HCAR2 | 0.49 | PROM2 | 0.45 |
| GPR87 | 0.58 | GRHL1 | 0.49 | SERPINB5 | 0.45 |
| GJB5 | 0.57 | PKP3 | 0.49 | PLEKHN1 | 0.45 |
| HES2 | 0.57 | PKP1 | 0.49 | PRRG4 | 0.45 |
| S100A16 | 0.57 | CERS3 | 0.49 | CSTA | 0.45 |
| TACSTD2 | 0.56 | ANXA8L1 | 0.48 | ZNF185 | 0.45 |
| ZNF750 | 0.56 | DSC3 | 0.48 | STARD5 | 0.45 |
| S100A11 | 0.55 | DSG3 | 0.48 | TYMP | 0.45 |
| LAD1 | 0.55 | FABP5P7 | 0.48 | PRSS22 | 0.44 |
| IRF6 | 0.55 | FAM83A | 0.48 | KRT17 | 0.44 |
| PERP | 0.55 | IPPK | 0.48 | RAPGEFL1 | 0.44 |
| MIR205HG | 0.54 | EVPL | 0.48 | DSP | 0.44 |
| S100A14 | 0.54 | S100A8 | 0.48 | ALG1L | 0.44 |
| LY6D | 0.53 | GSDMC | 0.48 | SERPINB4 | 0.44 |
| FAT2 | 0.53 | ANXA8 | 0.48 | GRHL3 | 0.43 |
| REEP4 | 0.53 | S100A2 | 0.48 | HCAR3 | 0.43 |
| GJB3 | 0.52 | SERPINB3 | 0.48 | DUSP7 | 0.43 |
| LYPD3 | 0.52 | TMEM40 | 0.47 | GPR157 | 0.43 |
| SFN | 0.52 | CSTB | 0.47 | C1orf74 | 0.43 |
| IL20RB | 0.52 | TMPRSS11D | 0.47 | ITPKC | 0.43 |
| GNA15 | 0.52 | SEMA4B | 0.47 | MICALL1 | 0.43 |
| ADGRF4 | 0.52 | CTA‐384D8.35 | 0.47 | FXYD3 | 0.42 |
| DENND2C | 0.52 | FAM110A | 0.47 | AC005262.3 | 0.42 |
| PITX1 | 0.51 | SERPINB13 | 0.47 | SCO2 | 0.42 |
| HSPB1 | 0.51 | RARG | 0.46 | HNRNPA1P33 | 0.42 |
| S100A9 | 0.51 | PGLYRP3 | 0.46 | CDKN2B | 0.42 |
| EPHX3 | 0.51 | IER5 | 0.46 | ARPC5L | 0.42 |
| PVRL1 | 0.51 | DTX2 | 0.46 | GLTP | 0.42 |
| KRT5 | 0.51 | CAPNS2 | 0.46 | OVOL1 | 0.42 |
| S1PR5 | 0.5 | ATP1B3 | 0.46 | RAB25 | 0.42 |
| RP3‐523K23.2 | 0.5 |
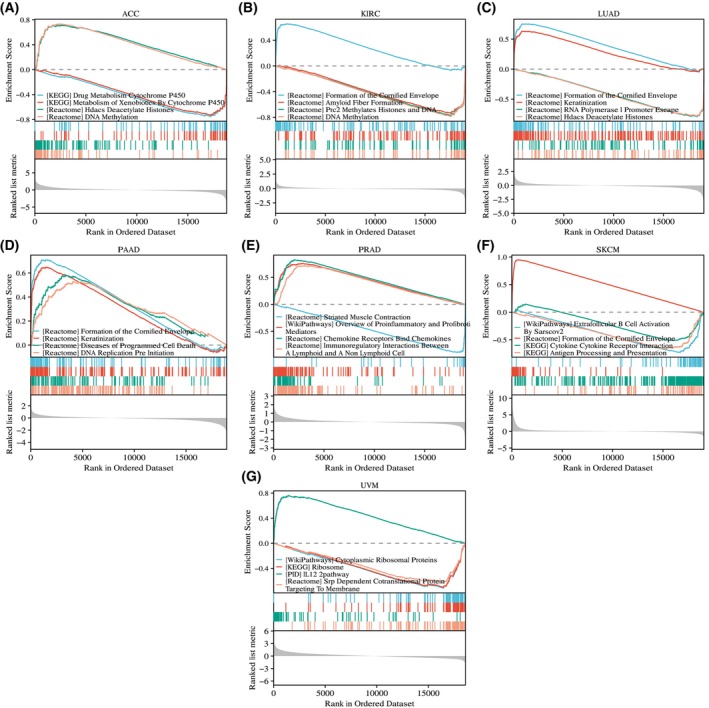
GSEA of the seven tumors for which RHOV had prognostic significance provided further evidence of the potential biological functions of RHOV, including roles in ‘drug metabolism cytochrome p450,’ ‘DNA methylation,’ ‘amyloid fiber formation,’ ‘formation of the cornified envelope,’ ‘diseases of programmed cell death,’ ‘immunoregulatory interactions between a lymphoid and a non‐lymphoid cell,’ and ‘cytokine‐cytokine receptor interaction’ (Fig. 15).
Discussion
In this comprehensive study, the expression and prognostic role of RHOV in pan‐cancer were thoroughly investigated. The results revealed that RHOV expression was upregulated in 18 tumor types and downregulated in seven tumor types. The association between RHOV expression and prognosis varied across different tumor types. Specifically, in KIRC and PRAD, in which RHOV expression was downregulated, higher RHOV expression was associated with a more favorable prognosis. In contrast, RHOV expression was associated with an unfavorable prognosis in ACC, LUAD, PAAD, SKCM, and UVM. RHOV expression was upregulated in LUAD and PAAD and was downregulated in SKCM. ACC exhibited low overall expression of RHOV, and differential expression was not available for UVM. These findings suggest that RHOV may have diverse functions, acting either as an oncogene or as a tumor suppressor, depending on the specific tumor and tumor microenvironment.
Previous studies demonstrated that RHOV functions as an oncogene in LUAD, promoting cancer cell growth, metastasis, and resistance to epidermal growth factor receptor (EGFR)‐tyrosine kinase inhibitor therapies [ref. 21, ref. 22, ref. 23]. RHOV has been demonstrated to be a pro‐metastatic factor in TNBC [ref. 24]. However, evidence supporting the tumor‐suppressive role of RHOV remains unavailable. Notably, RHOV showed potential to induce apoptosis in PC12 cells (a rat pheochromocytoma cell line) and RAW264.7 macrophages [ref. 19, ref. 20], suggesting its potential to induce apoptosis in cancer cells. However, further investigation is warranted in this regard.
Results from the immune infiltration analysis suggested that RHOV expression correlated with various immune cell types across the analyzed tumors. In addition, RHOV expression correlated with ImmuneScore, StromalScore, and ESTIMATEScore in LUAD, SKCM, PRAD, and UVM. However, this correlation was inconsistent among different cancers, suggesting that the influence of RHOV on the immune system may be specific to individual cancer types. Although high RHOV expression levels in ACC and PRAD predicted lower responses to ICIs, considering the complexity of the TME and the limitation of a single gene as a biomarker to predict potential benefits from ICIs, we do not consider RHOV as a useful clinical marker of the response to ICIs at this point.
Functional enrichment analyses of RHOV‐related genes revealed several important biological processes and pathways that could shed light on the potential mechanisms underlying the correlation between RHOV, cancer prognosis, and immune infiltration. One notable finding was the enrichment of terms related to cell migration, such as ‘cell–cell junction,’ ‘intermediate filament cytoskeleton,’ ‘cadherin binding involved in cell–cell adhesion,’ and ‘collagen‐containing extracellular matrix.’ These findings are consistent with previous studies demonstrating the role of RHOV in regulating cell adhesion and promoting cell movement in various contexts, including zebrafish epiboly and cancer metastasis [ref. 18]. Furthermore, RHOV activates the Jun N‐terminal kinase/c‐Jun signaling pathway, which has been implicated in LUAD cell growth and metastasis [ref. 23]. Additionally, RHOV activates EGFR signaling through GRB2, thereby regulating cancer cell migration and promoting metastasis in TNBC [ref. 24]. The RHOV‐related genes were enriched in various immune‐related pathways, including ‘cytokine–cytokine receptor interaction,’ ‘antigen processing and presentation,’ ‘IL‐17 signaling pathway,’ and ‘IL‐12 pathway.’ These findings suggest a potential correlation between RHOV and the immune response. Although one study suggested the involvement of RHOV in the differentiation of myeloid cells [ref. 26], the detailed mechanism remains unknown. Furthermore, there is currently no experimental evidence to directly support the effect of RHOV on TIICs, highlighting the need for further investigation in this area.
Our study used in silica data mining to explore the prognostic and immunological roles of RHOV in various cancer types. The results of our study indicated a dual effect of RHOV on prognosis and immune infiltration. Although we tried our best to strengthen our results, some limitations of this type of analysis are inevitable. First, although we observed different prognostic roles for RHOV in different cancers, we were unable to provide experimental evidence to confirm whether RHOV acts as an oncogene or a tumor suppressor in specific cancer types. Second, although we found associations between RHOV expression and immune infiltration and identified immune‐related pathways through enrichment analysis, there is currently no clear evidence to support the notion that RHOV directly influences the immune cell composition of the TME. Third, the exact mechanism by which RHOV affects the survival of patients with cancer through the regulation of TIICs remains unknown.
In conclusion, our study revealed the dysregulation of RHOV expression in various tumors and identified its prognostic significance in several cancer types. Additionally, RHOV expression correlated with the distribution of different TIICs in these cancers. However, further experimental investigations are required to validate the functional roles of RHOV in specific cancer types and its impact on TIICs and patient survival.
Conflict of interest
The authors declare no conflict of interest.
Peer review
The peer review history for this article is available at https://www.webofscience.com/api/gateway/wos/peer‐review/10.1002/2211‐5463.13698.
Author contributions
QQ and BP designed and performed the study, and collectively wrote and reviewed the manuscript.
References
- Influence of tumour micro‐environment heterogeneity on therapeutic response.. Nature, 2013. [PubMed]
- Microenvironmental regulation of tumor progression and metastasis.. Nat Med, 2013. [PubMed]
- Therapeutic targeting of the tumor microenvironment.. Cancer Discov, 2021. [PubMed]
- The history and advances in cancer immunotherapy: understanding the characteristics of tumor‐infiltrating immune cells and their therapeutic implications.. Cell Mol Immunol, 2020. [PubMed]
- Spatiotemporal dynamics of intratumoral immune cells reveal the immune landscape in human cancer.. Immunity, 2013. [PubMed]
- Top 10 challenges in cancer immunotherapy.. Immunity, 2020. [PubMed]
- A comprehensive prognostic and immune analysis of SLC41A3 in Pan‐cancer.. Front Oncol, 2020. [PubMed]
- An integrative Pan‐cancer analysis revealing LCN2 as an oncogenic immune protein in tumor microenvironment.. Front Oncol, 2020. [PubMed]
- Pan‐cancer analysis of the prognostic and immunological role of HSF1: a potential target for survival and immunotherapy.. Oxid Med Cell Longev, 2021. [PubMed]
- GPC2 is a potential diagnostic, immunological, and prognostic biomarker in Pan‐cancer.. Front Immunol, 2022. [PubMed]
- Pan‐cancer analysis shows that ALKBH5 is a potential prognostic and immunotherapeutic biomarker for multiple cancer types including gliomas.. Front Immunol, 2022. [PubMed]
- A comprehensive prognostic and immune infiltration analysis of EXOC3L1 in pan‐cancer.. Front Genet, 2022. [PubMed]
- Analysis and experimental validation of rheumatoid arthritis innate immunity gene CYFIP2 and Pan‐cancer.. Front Immunol, 2022. [PubMed]
- Rho GTPases: deciphering the evolutionary history of a complex protein family.. Methods Mol Biol, 2012. [PubMed]
- Regulation and functions of RhoU and RhoV.. Small GTPases, 2020. [PubMed]
- Mammalian rho GTPases: new insights into their functions from in vivo studies.. Nat Rev Mol Cell Biol, 2008. [PubMed]
- The small GTPase RhoV is an essential regulator of neural crest induction in Xenopus.. Dev Biol, 2007. [PubMed]
- A vertebrate‐specific Chp‐PAK‐PIX pathway maintains E‐cadherin at adherens junctions during zebrafish epiboly.. PLoS ONE, 2010. [PubMed]
- Rho family GTPase Chp/RhoV induces PC12 apoptotic cell death via JNK activation.. Small GTPases, 2011. [PubMed]
- RhoV mediates apoptosis of RAW264.7 macrophages caused by osteoclast differentiation.. Mol Med Rep, 2015. [PubMed]
- The RHOV gene is overexpressed in human non‐small cell lung cancer.. Cancer Genet, 2013. [PubMed]
- Overexpression of RhoV promotes the progression and EGFR‐TKI resistance of lung adenocarcinoma.. Front Oncol, 2021. [PubMed]
- RHOV promotes lung adenocarcinoma cell growth and metastasis through JNK/c‐Jun pathway.. Int J Biol Sci, 2021. [PubMed]
- In vivo CRISPR screens identify RhoV as a pro‐metastasis factor of triple‐negative breast cancer.. Cancer Sci, 2023. [PubMed]
- Tumor cell‐intrinsic factors underlie heterogeneity of immune cell infiltration and response to immunotherapy.. Immunity, 2018. [PubMed]
- Rho GTPase expression in human myeloid cells.. PLoS ONE, 2012. [PubMed]
- TIMER2.0 for analysis of tumor‐infiltrating immune cells.. Nucleic Acids Res, 2020. [PubMed]
- GSVA: gene set variation analysis for microarray and RNA‐seq data.. BMC Bioinformatics, 2013. [PubMed]
- Inferring tumour purity and stromal and immune cell admixture from expression data.. Nat Commun, 2013. [PubMed]
- Signatures of T cell dysfunction and exclusion predict cancer immunotherapy response.. Nat Med, 2018. [PubMed]
- TGFβ attenuates tumour response to PD‐L1 blockade by contributing to exclusion of T cells.. Nature, 2018. [PubMed]