CPEM: Accurate cancer type classification based on somatic alterations using an ensemble of a random forest and a deep neural network
Abstract
With recent advances in DNA sequencing technologies, fast acquisition of large-scale genomic data has become commonplace. For cancer studies, in particular, there is an increasing need for the classification of cancer type based on somatic alterations detected from sequencing analyses. However, the ever-increasing size and complexity of the data make the classification task extremely challenging. In this study, we evaluate the contributions of various input features, such as mutation profiles, mutation rates, mutation spectra and signatures, and somatic copy number alterations that can be derived from genomic data, and further utilize them for accurate cancer type classification. We introduce a novel ensemble of machine learning classifiers, called CPEM (Cancer Predictor using an Ensemble Model), which is tested on 7,002 samples representing over 31 different cancer types collected from The Cancer Genome Atlas (TCGA) database. We first systematically examined the impact of the input features. Features known to be associated with specific cancers had relatively high importance in our initial prediction model. We further investigated various machine learning classifiers and feature selection methods to derive the ensemble-based cancer type prediction model achieving up to 84% classification accuracy in the nested 10-fold cross-validation. Finally, we narrowed down the target cancers to the six most common types and achieved up to 94% accuracy.
Article type: Research Article
Keywords: Cancer genomics, Machine learning
Affiliations: 0004 0381 814Xgrid.42687.3fSchool of Electrical and Computer Engineering, UNIST, Ulsan, Republic of Korea; 0004 0381 814Xgrid.42687.3fDepartment of Biomedical Engineering, School of Life Sciences, UNIST, Ulsan, Republic of Korea
License: © The Author(s) 2019 CC BY 4.0 Open Access This article is licensed under a Creative Commons Attribution 4.0 International License, which permits use, sharing, adaptation, distribution and reproduction in any medium or format, as long as you give appropriate credit to the original author(s) and the source, provide a link to the Creative Commons license, and indicate if changes were made. The images or other third party material in this article are included in the article’s Creative Commons license, unless indicated otherwise in a credit line to the material. If material is not included in the article’s Creative Commons license and your intended use is not permitted by statutory regulation or exceeds the permitted use, you will need to obtain permission directly from the copyright holder. To view a copy of this license, visit http://creativecommons.org/licenses/by/4.0/.
Article links: DOI: 10.1038/s41598-019-53034-3 | PubMed: 31729414 | PMC: PMC6858312
Relevance: Moderate: mentioned 3+ times in text
Full text: PDF (342 KB)
Introduction
Cancer is a complex disease that refers to the phenomenon of abnormal cellular proliferation, invasion, or metastasis in human tissues and blood. It is caused by the acquisition of a series of genomic alterations. Hence, an understanding of the genetic characteristics of cancer is crucial for accurate diagnosis and treatment. Next-generation sequencing techniques have recently been widely applied to cancer research to characterize various different types of genomic alterations in cancer genomes1–4. Large-scale cancer genome studies have revealed that the patterns of genomic alterations are often cancer type-specific. Lawrence et al. found that cancer mutations vary across cancer types, with genes mutated in a cancer-specific manner5. Hoadley et al. also confirmed that tissue-specific genomic features in cancers are the dominant signals for classifying cancer subtypes6. In addition, somatic copy number alterations and mutation spectra also display tissue-specific patterns7–9.
Using the tissue-specific nature of somatic alterations in cancer, a number of prediction methods for cancer type were recently developed by employing machine learning classifiers and various mutation features to improve classification accuracy. Marquard et al. used a random forest classifier (i.e., one-vs-rest (OvR) binary classifiers for multiclass classification) with a feature set consisting of somatic point mutations of known cancer-associated genes, mutation frequencies, and copy number profiles from the Catalogue of Somatic Mutations in Cancer (COSMIC) database10 to identify tissues of origin11. The authors reported up to 85% maximum accuracy across six cancer types and 69% across 10 cancer types. Chen et al. used a support vector machine (SVM) classifier with official gene symbols, mutations, chromosome, and pathways as feature sets, which led to the maximum average accuracy of 62% across 17 cancer types12. Yuan et al. introduced a novel clustering-based feature selection scheme with a deep neural network classifier (i.e., multilayer perceptron) for cancer classification13. In their work, only somatic point mutations were used for input feature data, which led to the maximum accuracy of 64% across 12 cancer types. However, these previous studies have not fully assessed and exploited biologically meaningful input features and advanced machine learning techniques. Furthermore, most of them were able to handle only a small subset of the cancer types from the database for classification.
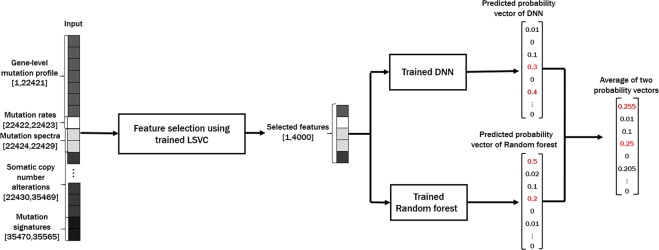
To address these problems, we propose a novel cancer type classification method, the Cancer Predictor using an Ensemble Model (CPEM) (see Fig. 1), which is based on the combination of advanced machine learning algorithms with various types of cancer somatic alterations and their derived features as input. To identify which input features are useful in classification, we conducted a comprehensive study on how various genetic alterations, such as gene-level mutation profiles, mutation rates, mutation spectra and signatures, and gene-level copy number alterations affect the accuracy of the classifier and we discuss the biological reasoning behind this result. We further investigated the performance of various state-of-the-art machine learning classifiers, both for feature selection and for cancer classification, and developed a novel cancer type classifier based on an ensemble of deep neural network (DNN) and random forest classifiers. CPEM can classify a large number of cancer types with high accuracy (i.e., the average accuracy of 84% across 31 cancer types in the nested 10-fold cross-validation). When we focused on the six most common cancer types, we were able to achieve up to 94% average accuracy. To the best of our knowledge, the proposed method is the most accurate multiclass cancer type classification method yet-devised that is able to predict the largest class of cancer types, covering the entire cancer list in the TCGA database3.
Results
Experimental setup
All experiments were conducted using a workstation equipped with an Intel Xeon CPU E5-2640 CPU with four NVIDIA GTX 1080Ti GPUs. We used TensorFlow (version 1.9.0) to implement the proposed deep neural network. Our DNN architecture is a multi-layer perceptron with a multinomial class cross-entropy with a softmax loss function. We used the Rectified Linear Unit as the activation function.
Selecting the proper number of parameters and hidden layers (i.e., tuning hyperparameters) of the DNN is important for better prediction accuracy and faster training time. We empirically chose our DNN with three hidden layers where each layer has 2048 parameters. To train the neural network, we used the Adam optimizer14, a commonly used stochastic optimization algorithm for machine learning, with a learning rate of 10−5 and 40% dropout per iteration to prevent overfitting. Other machine learning classifiers were implemented using the scikit-learn library15 in Python 3.6.1.
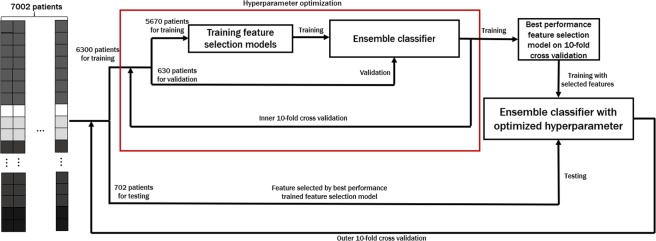
As shown in Fig. 2, the optimal number of input features and the feature selection method are chosen to maximize the accuracy over inner 10-fold cross-validation. Once feature selection is finalized, we tested the performance of CPEM using the independent testing data that was not a part of the training data.
Efficacy of Various Mutation Features
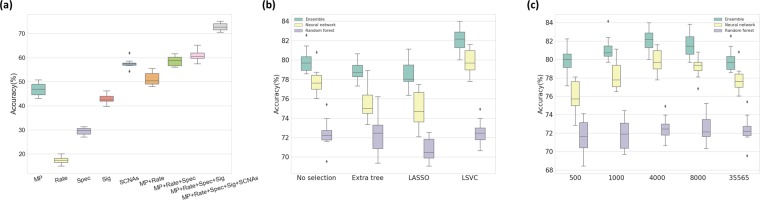
To assess how each class of input feature affected the classification accuracy, we used a random forest classifier as an initial prediction model and measured changes in classification performance as each feature was added using 10-fold cross-validation. Starting from the gene-level mutation profiles only, we consecutively added other feature groups, including mutation rates, mutation spectra, gene-level SCNAs, and mutation signatures, and measured the classification accuracy for each time. The accuracy for each feature group was 46.9%, 51.2%, 58.5%, 61.0%, and 72.7% respectively (Fig. 3a).
To further deduce the features that most contribute to the accuracy of the classification, we selected the top ten features based on the importance score from the classifier. These features included two mutation rates, one mutation signature (CCT.C > T), two mutation spectra (C > T, C > A) and five mutated genes [von Hippel-Lindau tumor suppressor (VHL); isocitrate dehydrogenase (NADP(+)) 1, cytosolic (IDH1); B-Raf proto-oncogene, serine/threonine kinase (BRAF); APC, WNT signaling pathway regulator (APC); KRAS proto-oncogene, GTPase (KRAS)] (Supplementary Fig. S1). This result is consistent with previous studies that identified distinct mutational landscapes from many different types of cancer genomes8,9,16. For example, BRAF is involved in intracellular signaling associated with cell growth induction and is frequently mutated in some human cancers17. Acquiring mutations in KRAS is an essential step in the pathogenesis of many cancers18. This result confirms that genetic features play an important role in cancer initiation and progression, and also contribute to improving the accuracy of cancer classification. The biological meaning of this result will be discussed further in the ‘Discussion’.
Optimal Feature Selection
To choose the best feature selection method for our data, we tested the three most commonly used supervised feature selection algorithms—the extra tree-based, LASSO, and LSVM approaches. In this experiment, each feature selection method was applied to the same input feature set to reduce its size by 90% (i.e., only 10% of the input feature will be retained after selection), and the prediction accuracy of different classifiers using selected features was measured.
The accuracy of the three classifiers (i.e., ensemble, neural network, random forest) on the data processed by the three different supervised feature selection methods was compared (Fig. 3b; the inner 10-fold cross-validation results are shown using a boxplot). In general, the LASSO and LSVC selection methods performed well for the neural network classifier, and the extra tree-based selection method worked well for the random forest classifier. This is because LASSO and LSVC use the linear classifier similar to the perceptron model in the neural network, and extra tree-based selection is similar to the decision trees in a random forest. Of the LASSO and LSVC methods, LSVC displayed higher classification accuracy.
The performance of the classifier is affected by the selection method and by the number of selected features (i.e., the amount of feature dimension reduction). Figure 3c summarizes the classification accuracy for the different number of selected features, measured using the inner 10-fold cross-validation. For 35,565 features, approximately 4,000 to 8,000 selected features showed the best result, which is about 10% to 20% of the original feature set. By doing so, a higher accuracy could be achieved, up to a 2.34% increase in the outer 10-fold cross-validation, with less training time due to the small training set size.
Putting it all Together: CPEM Results
Based on the feature selection scheme and the optimal number of features found in the previous steps, we construct the proposed ensemble-based cancer prediction model, CPEM. We have tested various combinations of classifiers and finally chosen a deep neural network and a random forest for our ensemble model. By combining two classifiers, we have reached up to 84% average accuracy on the testing data for 31 cancer types. This result is about 6 and 11 percentage points higher than the accuracy of conventional machine learning classifiers, such as fully-connected deep neural networks and random forests, respectively. Figure 4 shows the result of the outer 10-fold cross-validation for CPEM and the other classifiers, and Table 1 shows the detailed description of per-cancer type experimental result.
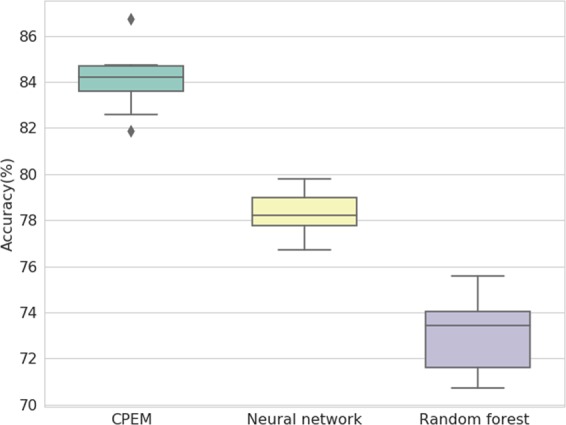
Table 1: Cancer type, sample size, number of mutated genes, number of copy number-altered genes, average precision, average recall, average F1 score and average classification accuracy of 31 cancer types used in our experiment.
| Cancer type | Sample size | # of mutated genes | # of copy number altered genes | Precision (%) | Recall (%) | F1 score (%) | Accuracy (%) |
|---|---|---|---|---|---|---|---|
| Adrenocortical carcinoma (ACC) | 88 | 6,904 | 12,725 | 96.10 | 84.09 | 89.70 | 84.09 |
| Bladder urothelial carcinoma (BLCA) | 127 | 11,674 | 11,223 | 92.04 | 63.78 | 75.35 | 62.20 |
| Breast invasive carcinoma (BRCA) | 967 | 15,716 | 12,178 | 83.19 | 92.14 | 87.44 | 92.86 |
| Cervical and endocervical cancers (CESC) | 191 | 12,165 | 11,505 | 69.63 | 68.06 | 68.84 | 71.89 |
| Cholangiocarcinoma (CHOL) | 35 | 3,511 | 9,707 | 73.68 | 40.00 | 51.85 | 31.43 |
| Colorectal adenocarcinoma (COADREAD) | 220 | 14,941 | 11,509 | 87.73 | 87.73 | 87.73 | 88.18 |
| Lymphoid Neoplasm Diffuse Large B-cell Lymphoma (DLBC) | 48 | 6,457 | 9,475 | 90.91 | 62.50 | 74.07 | 58.33 |
| Esophageal carcinoma (ESCA) | 184 | 13,557 | 1,1534 | 81.18 | 58.70 | 68.35 | 63.04 |
| Glioblastoma multiforme (GBM) | 280 | 8,069 | 11,410 | 81.85 | 88.57 | 85.08 | 89.64 |
| Head and Neck squamous cell carcinoma (HNSC) | 279 | 12,783 | 11,270 | 70.65 | 74.19 | 72.38 | 77.42 |
| Kidney Chromophobe (KICH) | 66 | 3,698 | 10,431 | 96.49 | 83.33 | 89.43 | 83.33 |
| Kidney renal clear cell carcinoma (KIRC) | 410 | 9,900 | 11,562 | 88.36 | 94.39 | 91.27 | 94.39 |
| Kidney renal papillary cell carcinoma (KIRP) | 161 | 7,332 | 10,568 | 83.23 | 80.12 | 81.65 | 78.88 |
| Acute Myeloid Leukemia (LAML) | 182 | 1,369 | 7,719 | 84.50 | 92.86 | 88.48 | 93.41 |
| Brain Lower Grade Glioma (LGG) | 280 | 4,732 | 10,190 | 89.88 | 82.50 | 86.03 | 82.86 |
| Liver hepatocellular carcinoma (LIHC) | 193 | 9,985 | 11,980 | 81.59 | 68.91 | 74.72 | 66.84 |
| Lung adenocarcinoma (LUAD) | 230 | 13,931 | 11,071 | 86.51 | 80.87 | 83.60 | 79.57 |
| Lung squamous cell carcinoma (LUSC) | 177 | 13,487 | 11,212 | 73.33 | 74.58 | 73.95 | 78.53 |
| Ovarian serous cystadenocarcinoma (OV) | 311 | 8,435 | 11,684 | 81.69 | 90.35 | 85.80 | 91.96 |
| Pancreatic adenocarcinoma (PAAD) | 149 | 10,144 | 8,744 | 83.23 | 89.93 | 86.45 | 89.93 |
| Pheochromocytoma and Paraganglioma (PCPG) | 166 | 2,125 | 10,103 | 86.78 | 90.96 | 88.82 | 89.16 |
| Prostate adenocarcinoma (PRAD) | 331 | 6,116 | 9,996 | 80.16 | 90.33 | 84.94 | 87.61 |
| Sarcoma (SARC) | 243 | 7,416 | 12,099 | 86.00 | 70.78 | 77.65 | 69.14 |
| Skin Cutaneous Melanoma (SKCM) | 341 | 17,085 | 11,883 | 90.05 | 92.67 | 91.54 | 92.67 |
| Stomach adenocarcinoma (STAD) | 286 | 16,607 | 11,745 | 76.09 | 79.02 | 77.53 | 80.77 |
| Testicular Germ Cell Tumors (TGCT) | 155 | 5,904 | 9,133 | 91.02 | 98.07 | 94.41 | 98.71 |
| Thyroid carcinoma (THCA) | 403 | 3,910 | 8,721 | 85.14 | 93.80 | 89.26 | 93.80 |
| Thymoma (THYM) | 121 | 1,805 | 9,305 | 86.14 | 71.90 | 78.38 | 76.03 |
| Uterine Corpus Endometrial Carcinoma (UCEC) | 242 | 18,412 | 12,133 | 81.39 | 77.69 | 79.49 | 76.86 |
| Uterine Carcinosarcoma (UCS) | 56 | 5,508 | 11,611 | 67.74 | 37.50 | 48.28 | 35.71 |
| Uveal Melanoma (UVM) | 80 | 1,340 | 9,559 | 80.00 | 85.33 | 82.58 | 83.75 |
| Total | 7,002 | 22,421 | 13,040 | 83.43 | 78.89 | 80.49 | 84.09 |
For better understandings of CPEM, we tested four well-known machine learning classifiers and further analyzed the correlation of the methods with each other. Table 2 shows the classification results of widely used classifiers, including DNN, OvR SVM, random forest, and k-nearest neighbors (KNN) clustering classifiers, in a pairwise fashion. In this table, A ∪ B is the probability that either A or B classifiers correctly predict the cancer type (total correct prediction), A ∩ B is the probability that both A and B classifiers correctly predict the cancer type (common correct prediction), and A−B and B−A are the probability that only either A or B predicts the result correctly. The classifiers were less correlated when A ∩ B was low and A−B and B−A were high. In addition, since we listed A and B in the table in descending order, it indicates that A is the better predictor (i.e., prediction accuracy is higher), so that B−A is the upper bound of the accuracy gain when the ensemble method is used. It is also important that the total correct prediction rate should be high (A ∪ B), and each classifier should predict higher than 50% accuracy (otherwise, it will impair the performance of the ensemble). In our experiment, we observed that the KNN clustering classifier performed worst, with only 48.59% prediction accuracy. It does not improve the accuracy when combined with other methods via ensemble. The random forest and OvR SVM performed similarly, with a respective prediction accuracy of 73.79% and 72.85%. Our DNN classifier outperformed all other classifiers, with a prediction accuracy of 82.25% which was approximately 10% higher than that of a random forest. The random forest classifier was slightly more accurate than the OvR SVM and was less correlated with DNN (i.e., lower A ∩ B). Therefore, the ensemble model combining the DNN and the random forest were the best choice. CPEM increased the accuracy of the DNN by 2%, which led to an average prediction accuracy of 84.09% for the 31 cancer types.
Table 2: Classification accuracy of various machine learning classifiers and their combinations with LSVC feature selection in the outer 10-fold cross validation.
| A | B | A ∩ B | A ∪ B | A−B | B−A | Ensemble (A, B) | |
|---|---|---|---|---|---|---|---|
| DNN (A), Random forest (B) | 82.25 | 73.79 | 67.81 | 88.23 | 14.44 | 5.98 | 84.09 |
| DNN (A), OvR SVM (B) | 82.25 | 72.85 | 70.21 | 84.89 | 12.04 | 2.64 | 80.95 |
| DNN (A), KNN (B) | 82.25 | 48.59 | 46.30 | 84.53 | 35.95 | 2.29 | 78.81 |
| Random forest (A), OvR SVM (B) | 73.79 | 72.85 | 62.58 | 84.06 | 11.21 | 10.27 | 78.79 |
| Random forest (A), KNN (B) | 73.79 | 48.59 | 43.87 | 78.51 | 29.92 | 4.71 | 67.30 |
| OvR SVM (A), KNN (B) | 72.85 | 48.59 | 44.50 | 76.94 | 28.35 | 4.08 | 68.41 |
This result confirms that the ensemble of a deep neural network and a random forest performs best.
We also compared our method to existing machine learning-based cancer type classification methods. Since it is not practically feasible to use exactly the same training data used in other studies, we collected the data of the same cancer types used in other studies from our database and compared the accuracy reported in the literature (Table 3). For the cancer types used in TumorTracer11, we achieved up to 91.42% accuracy for six types (85% in TumorTracer) and 90.28% accuracy for ten types (69% in TumorTracer) (Supplementary Figs S4 and S5). When using the same 12 cancer types used in DeepGene13, we were able to achieve up to 84.66% accuracy, which was 20 percentage points higher than that of DeepGene (64%) (Supplementary Fig. S6).
Table 3: Comparison between CPEM and previously reported cancer type classification methods.
| # of samples | # of features | # of cancer types | Precision | Recall | F1 score | Accuracy | |
|---|---|---|---|---|---|---|---|
| DeepGene13 | 3122 | 1200 | 12 | N/A | N/A | N/A | 66.50 |
| *TumorTracer11 | 2820 | 232 | 6 | 85.83 | 84.95 | 85.39 | 85.00 |
| 4975 | 560 | 10 | 72.23 | 68.98 | 70.57 | 69.00 | |
| Chen et al.12 | 6751 | 101176 | 18 | 65.24 | 62.26 | 63.72 | 62.00 |
| *CPEM | 2763 | 4000 | 6 | 84.77 | 90.61 | 87.59 | 94.14 |
| 4823 | 4000 | 14 | 83.48 | 85.36 | 84.41 | 87.02 | |
| 7002 | 4000 | 31 | 83.43 | 78.89 | 80.49 | 84.06 |
Discussion
We constructed various feature groups from the collected data and confirmed a maximum of 72.2% accuracy through a combination of features using an initial prediction model based on a random forest. Feature importance was calculated to identify elements with a high impact in a combination of features with maximum accuracy. The top ten features with the highest importance were \(\frac{\#\,of\,mutated\,genes}{total\,\#\,of\,genes}\), CCT.C > T mutation signature, VHL mutation, IDH1 mutation, C > T mutation frequency, C > A mutation frequency, BRAF mutation, \(\frac{\#\,of\,SNVs/indels}{1\,Mb}\), APC mutation, and KRAS mutation (Supplementary Fig. S1). The frequency of mutation varies widely among samples according to the cancer type, ranging from 0.1 (pediatric cancer) to 100 (lung cancer) per Mb. High mutation frequencies are due to extensive exposure to well-known carcinogens, such as tobacco smoke (C > A mutation) and ultraviolet radiation (C > T mutation)9. We referred to the COSMIC10 data to identify signatures with a high frequency of CCT.C > T mutations, and confirmed that the frequency of CCT.C > T mutations was the highest in Signature 23 and 19. Signature 23 is present only in liver cancer samples, and Signature 19 is specific to pilocytic astrocytoma. According to the COSMIC data, VHL displayed mutation rates of 39% and 33% in liver cancer and paratesticular tissues, respectively. VHL is a transcription factor that plays a central role in the regulation of gene expression by oxygen and is involved in ubiquitination and degradation of hypoxia-inducible-factor19. IDH1 catalyzes the conversion of isocitrate to alpha-ketoglutarate (aKG) in normal conditions. The cancer-associated IDH1 mutation converts aKG to 2-hydroxyglutarate (2HG)20. In gliomas and malignancies, IDH1 mutations induce postmenopausal changes and promote tumorigenesis21. The frequency of IDH1 mutations in the COSMIC data is highest in the central nervous system (34%). BRAF is a crucial regulator of the extracellular signal-regulated kinase – mitogen activated protein kinase signaling pathway, leading to cell proliferation, differentiation, and survival. BRAF mutations are present at a high frequency (8%) in various cancers, particularly in melanomas (50%)22. APC has a wide range of functions from the regulation of the WNT signaling pathway to cell migration, apoptosis, and chromosome segregation23. APC mutations occur in 42% of colorectal cancer and 14% of small bowel cancer. KRAS is a well-known oncogene that is commonly found in pancreatic, colon, and lung cancers. KRAS induces tumorigenesis, regulates cell degeneration, and induces genomic instability.
Even though we already achieved KG high classification average accuracy of up to 84% for 31 cancer types from the TCGA database using our ensemble method, the classification accuracy could be increased further by focusing on cancer types with a sufficient number of samples. One observation we made is that the size of the training data is not evenly distributed across the cancer types in the database. Some cancer types have a very small number of training sets, which affects the performance of machine learning (Table 1). For example, we only have 35 samples for the CHOL cancer type, which resulted in low average accuracy of 31.43%. To circumvent this issue, we selected subsets of cancer types based on the number of samples. For cancer types with 200 or more samples, we were able to collect 14 cancer types from 4,823 samples and achieved an accuracy of up to 87%, which was about 4 percent points higher than using all 31 cancer types (Supplementary Fig. S2). If we increased the threshold to 300 or more samples, then six most frequent cancer types remained (BRCA, KIRC, OV, PRAD, SKCM, and THCA), and the classification accuracy further improved to 94%, which was about 10 percentage points higher than using all 31 cancer types (Supplementary Fig. S3).
To further demonstrate the wide applicability of the proposed method to other data (i.e., non-TCGA data), we trained and tested CPEM using the ICGC (International Cancer Genome Consortium) dataset, which provides sequencing data for 76 cancer projects. We collected somatic SNV and CNV data of 48 cancer projects performed on at least 10 samples. In this experiment, we used the same nested 10-fold cross-validation used for TCGA data to assess the performance. CPEM achieved up to 82.40% accuracy, while the accuracy of neural network and random forest are 77.93% and 74.83% in outer 10-fold cross-validation, respectively. This demonstrates that CPEM is effective on non-TCGA data as well.
We observed that, even though CPEM demonstrates superior performance on TCGA or ICGC only, its cross-platform application is not working well, which is somehow expected in a data-driven approach. For this experiment, we collected 124 BRCA, 265 ESCA, 428 PAAD and 451 BRCA samples from the non-TCGA ICGC data. Then we directly applied our CPEM trained using only TCGA data to these non-TCGA data, which resulted in the classification accuracy of 78.23%, 6.79%, 64.95% and 49.22% for PRAD, ESCA, PAAD and BRCA, respectively. We believe the reason for the poor performance on ESCA and BRCA is due to the platform inhomogeneity. According to the ICGC portal web page (https://icgc.org/node/70708), this non-TCGA ESCA data generated by Cancer Research UK seem to also include Barrett’s esophagus as well as esophageal cancer. We believe that the histological difference between Barrett’s esophagus and esophageal cancer is significant, and this is the reason why the TCGA-trained model showed poor performance in predicting non-TCGA ESCA. As for BRCA, we compared histopathological subtypes for the tumor samples of TCGA and Non-TCGA (ICGC). Although there are overlapping major histopathological subtypes such as ‘ductal’ and ‘lobular’ carcinoma, there are histopathological subtypes that are not perfectly matched with each other. More details of BRCA’s histopathological differences can be found in Supplementary Fig. S7. Developing a more robust cancer prediction method for inhomogeneous platforms in multi-site or multi-modal data would be an interesting future research direction.
Conclusion
We introduced a novel cancer type classification method, CPEM which is based on mutation features and an ensemble of machine learning classifiers. We conducted an in-depth study to clarify how various mutation feature groups affect the classification accuracy. Extensive investigation of various feature selection and classification methods based on machine learning algorithms led to the development of an ensemble model that classified 31 cancer types from the TCGA database at an average accuracy of 84% and six common cancer types at an average accuracy of 94%. The method outperforms the state-of-the-art mutation-based cancer classification methods.
Future plans are to utilize advanced deep neural networks to improve the cancer classification accuracy. Another idea we are currently exploring is to group cancer types in a hierarchical manner to reduce the search space size. We are also planning to apply our model to liquid biopsy data, such as circulating tumor DNA, and cells for primary tumor site prediction. Current liquid biopsy techniques are offered as laboratory-developed tests. Our method will be useful for early diagnosis of cancer as these liquid biopsy techniques evolve24. More rigorous validations using real clinical datasets will also be done.
Methods
Overview of the Proposed Method
CPEM consists of several data processing stages followed by a machine learning-based cancer classification stage, as shown in Fig. 1. The first step is constructing input feature vectors for various different types of somatic alterations detected from cancer genomic data to train and test machine learning classifiers. Since the input feature vectors are large and sparse (i.e., mostly zero), the next step is to reduce the size of the input feature set. This feature selection step is important to reduce the training time of the classifiers and also to increase the prediction accuracy by removing redundant and irrelevant features acting as noise. We explored several widely used feature selection algorithms25 and empirically chose a method that worked best for our dataset. The last step is the classification of the cancer type using machine learning classifiers. We employed an ensemble approach by combining a random forest and a deep neural network to maximize the classification accuracy. Detailed descriptions of each stage are provided in the following sections.
Feature Construction
The genetic alterations (e.g., mutation spectra, signatures and somatic copy number alterations (SCNAs)) often have a unique pattern depending on the cancer type8,9,26. Hence, these characteristics are sequentially applied to the subsequent analysis. We collected somatic single nucleotide variants (SNVs) and short insertions and deletions (indels) data for 31 TCGA cancer types from the GDAC27 website (Jan 28, 2016). We generated a data matrix of 22,421 genes × 7,115 samples that contains the number of protein sequencing altering SNVs and indels for each gene and sample. We also downloaded SCNA data from the GDAC website and constructed gene-level log2 copy ratio values to use them as additional input features. Mutation rates and mutation spectra/signatures were calculated using SNV data to be used as input features. As a result, we generated a data matrix of 35,565 input features × 7,002 samples to develop cancer type classification machine learning models. A pictorial description of our feature matrix is shown in Fig. 1, and the details of the input feature contents are as follows:
- 22,421 gene-level somatic mutation profile
- 2 mutation rates \((\frac{\#\,of\,SNVs/indels}{1\,Mb}\,{\rm{and}}\,\frac{\#\,of\,mutated\,genes}{total\,\#\,of\,genes})\)
- 6 mutation spectra (C > A, C > G, C > T, T > A, T > C, and T > G)
- 96 mutation signatures ({A, C, G, T} × 6 mutation spectra × {A, C, G, T})
- 13,040 gene-level log2 copy ratio
We created an initial prediction model using six machine learning models to evaluate the performance of the generated features. The initial results showed the highest accuracy in the random forest model. Subsequently, each feature was added to predict the accuracy of the initial model to verify the impact of each feature on the model.
Feature Selection
Feature selection is the process of reducing the dimension of the input feature data by removing redundant and irrelevant features that do not contribute to the final result. By selecting important features only, the classification can be more accurate and training time can be shortened. Various feature selection algorithms for genomic data have been proposed in the past25,28.
In this work, we tested several widely used supervised feature selection algorithms, including tree-based, least absolute shrinkage and selection operator (LASSO), and LSVC. We finally chose LSVC as the feature selection method (the various feature selection methods are compared above in ‘Comparison of Feature selection Methods’).
Tree-based feature selection
The tree-based feature selection method is based on the feature importance calculated during the training of the decision tree classifier, namely how much the feature contributes to the reduction of the overall error (e.g., accuracy or variance) of the classification. Once the importance of each feature is established, the features can be sorted and those with low importance can be discarded. In our experiment, we used the extremely randomized trees (extra trees)29, a decision forest that avoids the expensive bootstrapping process used in the random forest algorithm.
LASSO feature selection
LASSO is a linear regression problem with a L1-norm sparsity term defined as follow:
\[
{\rm{\min }}\,\frac{1}{n}\mathop{\sum }\limits_{i\mathrm{=1}}^{n}\,{\Vert {y}_{i}-{w}^{T}{x}_{i}\Vert }_{2}^{2}+\alpha {\Vert w\Vert }_{1}
\]
where xi is the training vector, yi is the predicted vector, and w is the regression coefficient vector.
After solving the minimization problem of Eq. 1, w serves as the importance value to filter the input feature xi. The number of selected features can be determined by the level of sparsity of w by changing the α parameter. If w is sparse then the small number of features will be selected, and vice versa.
LSVC feature selection
LSVC30 is based on a squared hinge loss function with an L1-norm sparsity term as follows:
\[
\mathop{{\rm{\min }}}\limits_{{w}_{c},{b}_{c};c\mathrm{=1,…,}k}\frac{1}{n}\mathop{\sum }\limits_{i\mathrm{=1}}^{k}\,L(f,{x}_{i},{y}_{i}),
\]
\[
\,{\rm{subject}}\,{\rm{to}}\mathop{\sum }\limits_{c\mathrm{=1}}^{k}\,{\Vert {w}_{c}\Vert }_{1}\le \varepsilon
\]
where f is a linear decision function defined as fc(x) = wcTx + bc for each class c = 1,…, k in k-class. In our experiment, we choose the f as one-vs-rest decision function for multi-class classification. The loss function L is defined as follows:
\[
L(f,{x}_{i},{y}_{i})=\sum _{c\ne {y}_{i}}\,{\rm{\max }}\,{\mathrm{(0,1}+{f}_{c}({x}_{i})-{f}_{{y}_{i}}({x}_{i}))}^{2}
\]
Since w for each class will be sparse after minimization, important features can be selected by collecting elements with non-zero w. Similar to LASSO, the total number of selected features is determined by the sparsity of w, which can be controlled by changing ε.
Cancer Type Classification
Once feature data are collected and processed, the next step is training machine learning classifiers to predict cancer types. Most previous studies used a collection of binary classifiers (i.e., one-vs-rest)11,12,31 to predict the cancer types. Popular classifiers are random forests and support vector machine, with deep neural networks used most recently13. Rather than relying on one specific classifier, as in the previous studies, we proposed to build an ensemble of different machine learning methods, which is a widely used strategy to enhance the classification performance32,33. To achieve this, we tested four widely used machine learning classifiers, including random forests, OvR SVM, KNN, and fully connected DNN, and found the best classifiers for our ensemble model. To build an ensemble, we used multinomial classifiers rather than binary classifiers, and computed the average of the probability of each output to determine the per-label (i.e., cancer type) probability. We performed an in-depth analysis of the correlation of output from the classifiers (see ‘Putting it all together: CPEM results’ in the Results).
Supplementary Materials
References
- 1.Hudson, T. J., Anderson, W., Aretz, A. & Barker, A. D. International network of cancer genome projects. Nat. 464, 993–8, http://www.pubmedcentral.nih.gov/articlerender.fcgi?artid=2902243{&}tool=pmcentrez{&}rendertype=abstract{%}5Cnhttp://www.nature.com/nature/journal/v464/n7291/abs/nature08987.html., 10.1038/nature08987, NIHMS150003 (2010).
- R McLendon. Comprehensive genomic characterization defines human glioblastoma genes and core pathways. Nat., 2008. [DOI]
- John N Weinstein, Eric A Collisson, Gordon B Mills, Kenna R Mills Shaw, Brad A Ozenberger, Kyle Ellrott, Ilya Shmulevich, Chris Sander, Joshua M Stuart. The Cancer Genome Atlas Pan-Cancer analysis project. Nature Genetics, 2013. [DOI | PubMed]
- 4.International Cancer Genome Consortium et al. International network of cancer genome projects. Nat. 464, 993–8, https://www.ncbi.nlm.nih.gov/pubmed/20393554., 10.1038/nature08987 (2010).
- Michael S. Lawrence, Petar Stojanov, Craig H. Mermel, James T. Robinson, Levi A. Garraway, Todd R. Golub, Matthew Meyerson, Stacey B. Gabriel, Eric S. Lander, Gad Getz. Discovery and saturation analysis of cancer genes across 21 tumour types. Nature, 2014. [DOI | PubMed]
- Katherine A. Hoadley, Christina Yau, Denise M. Wolf, Andrew D. Cherniack, David Tamborero, Sam Ng, Max D.M. Leiserson, Beifang Niu, Michael D. McLellan, Vladislav Uzunangelov, Jiashan Zhang, Cyriac Kandoth, Rehan Akbani, Hui Shen, Larsson Omberg, Andy Chu, Adam A. Margolin, Laura J. van’t Veer, Nuria Lopez-Bigas, Peter W. Laird, Benjamin J. Raphael, Li Ding, A. Gordon Robertson, Lauren A. Byers, Gordon B. Mills, John N. Weinstein, Carter Van Waes, Zhong Chen, Eric A. Collisson, Christopher C. Benz, Charles M. Perou, Joshua M. Stuart. Multiplatform Analysis of 12 Cancer Types Reveals Molecular Classification within and across Tissues of Origin. Cell, 2014. [DOI | PubMed]
- Christopher Greenman, Philip Stephens, Raffaella Smith, Gillian L. Dalgliesh, Christopher Hunter, Graham Bignell, Helen Davies, Jon Teague, Adam Butler, Claire Stevens, Sarah Edkins, Sarah O’Meara, Imre Vastrik, Esther E. Schmidt, Tim Avis, Syd Barthorpe, Gurpreet Bhamra, Gemma Buck, Bhudipa Choudhury, Jody Clements, Jennifer Cole, Ed Dicks, Simon Forbes, Kris Gray, Kelly Halliday, Rachel Harrison, Katy Hills, Jon Hinton, Andy Jenkinson, David Jones, Andy Menzies, Tatiana Mironenko, Janet Perry, Keiran Raine, Dave Richardson, Rebecca Shepherd, Alexandra Small, Calli Tofts, Jennifer Varian, Tony Webb, Sofie West, Sara Widaa, Andy Yates, Daniel P. Cahill, David N. Louis, Peter Goldstraw, Andrew G. Nicholson, Francis Brasseur, Leendert Looijenga, Barbara L. Weber, Yoke-Eng Chiew, Anna deFazio, Mel F. Greaves, Anthony R. Green, Peter Campbell, Ewan Birney, Douglas F. Easton, Georgia Chenevix-Trench, Min-Han Tan, Sok Kean Khoo, Bin Tean Teh, Siu Tsan Yuen, Suet Yi Leung, Richard Wooster, P. Andrew Futreal, Michael R. Stratton. Patterns of somatic mutation in human cancer genomes. Nature, 2007. [DOI | PubMed]
- Ludmil B. Alexandrov, Serena Nik-Zainal, David C. Wedge, Samuel A. J. R. Aparicio, Sam Behjati, Andrew V. Biankin, Graham R. Bignell, Niccolò Bolli, Ake Borg, Anne-Lise Børresen-Dale, Sandrine Boyault, Birgit Burkhardt, Adam P. Butler, Carlos Caldas, Helen R. Davies, Christine Desmedt, Roland Eils, Jórunn Erla Eyfjörd, John A. Foekens, Mel Greaves, Fumie Hosoda, Barbara Hutter, Tomislav Ilicic, Sandrine Imbeaud, Marcin Imielinski, Natalie Jäger, David T. W. Jones, David Jones, Stian Knappskog, Marcel Kool, Sunil R. Lakhani, Carlos López-Otín, Sancha Martin, Nikhil C. Munshi, Hiromi Nakamura, Paul A. Northcott, Marina Pajic, Elli Papaemmanuil, Angelo Paradiso, John V. Pearson, Xose S. Puente, Keiran Raine, Manasa Ramakrishna, Andrea L. Richardson, Julia Richter, Philip Rosenstiel, Matthias Schlesner, Ton N. Schumacher, Paul N. Span, Jon W. Teague, Yasushi Totoki, Andrew N. J. Tutt, Rafael Valdés-Mas, Marit M. van Buuren, Laura van ’t Veer, Anne Vincent-Salomon, Nicola Waddell, Lucy R. Yates, Jessica Zucman-Rossi, P. Andrew Futreal, Ultan McDermott, Peter Lichter, Matthew Meyerson, Sean M. Grimmond, Reiner Siebert, Elías Campo, Tatsuhiro Shibata, Stefan M. Pfister, Peter J. Campbell, Michael R. Stratton. Signatures of mutational processes in human cancer. Nature, 2013. [DOI | PubMed]
- Michael S. Lawrence, Petar Stojanov, Paz Polak, Gregory V. Kryukov, Kristian Cibulskis, Andrey Sivachenko, Scott L. Carter, Chip Stewart, Craig H. Mermel, Steven A. Roberts, Adam Kiezun, Peter S. Hammerman, Aaron McKenna, Yotam Drier, Lihua Zou, Alex H. Ramos, Trevor J. Pugh, Nicolas Stransky, Elena Helman, Jaegil Kim, Carrie Sougnez, Lauren Ambrogio, Elizabeth Nickerson, Erica Shefler, Maria L. Cortés, Daniel Auclair, Gordon Saksena, Douglas Voet, Michael Noble, Daniel DiCara, Pei Lin, Lee Lichtenstein, David I. Heiman, Timothy Fennell, Marcin Imielinski, Bryan Hernandez, Eran Hodis, Sylvan Baca, Austin M. Dulak, Jens Lohr, Dan-Avi Landau, Catherine J. Wu, Jorge Melendez-Zajgla, Alfredo Hidalgo-Miranda, Amnon Koren, Steven A. McCarroll, Jaume Mora, Ryan S. Lee, Brian Crompton, Robert Onofrio, Melissa Parkin, Wendy Winckler, Kristin Ardlie, Stacey B. Gabriel, Charles W. M. Roberts, Jaclyn A. Biegel, Kimberly Stegmaier, Adam J. Bass, Levi A. Garraway, Matthew Meyerson, Todd R. Golub, Dmitry A. Gordenin, Shamil Sunyaev, Eric S. Lander, Gad Getz. Mutational heterogeneity in cancer and the search for new cancer-associated genes. Nature, 2013. [DOI | PubMed]
- SA Forbes. COSMIC: Exploring the world’s knowledge of somatic mutations in human cancer. Nucleic Acids Res., 2015. [DOI | PubMed]
- AM Marquard. TumorTracer: a method to identify the tissue of origin from the somatic mutations of a tumor specimen. BMC Med. Genomics, 2015. [DOI | PubMed]
- Yukun Chen, Jingchun Sun, Liang-Chin Huang, Hua Xu, Zhongming Zhao. Classification of Cancer Primary Sites Using Machine Learning and Somatic Mutations. BioMed Research International, 2015
- Y Yuan. DeepGene: an advanced cancer type classifier based on deep learning and somatic point mutations. BMC Bioinforma., 2016. [DOI]
- 14.Kingma, D. P. & Ba, J. Adam: A method for stochastic optimization. arXiv preprint arXiv:1412.6980 (2014).
- F Pedregosa. Scikit-learn: Machine learning in Python. J. Mach. Learn. Res., 2011
- Cyriac Kandoth, Michael D. McLellan, Fabio Vandin, Kai Ye, Beifang Niu, Charles Lu, Mingchao Xie, Qunyuan Zhang, Joshua F. McMichael, Matthew A. Wyczalkowski, Mark D. M. Leiserson, Christopher A. Miller, John S. Welch, Matthew J. Walter, Michael C. Wendl, Timothy J. Ley, Richard K. Wilson, Benjamin J. Raphael, Li Ding. Mutational landscape and significance across 12 major cancer types. Nature, 2013. [DOI | PubMed]
- Helen Davies, Graham R. Bignell, Charles Cox, Philip Stephens, Sarah Edkins, Sheila Clegg, Jon Teague, Hayley Woffendin, Mathew J. Garnett, William Bottomley, Neil Davis, Ed Dicks, Rebecca Ewing, Yvonne Floyd, Kristian Gray, Sarah Hall, Rachel Hawes, Jaime Hughes, Vivian Kosmidou, Andrew Menzies, Catherine Mould, Adrian Parker, Claire Stevens, Stephen Watt, Steven Hooper, Rebecca Wilson, Hiran Jayatilake, Barry A. Gusterson, Colin Cooper, Janet Shipley, Darren Hargrave, Katherine Pritchard-Jones, Norman Maitland, Georgia Chenevix-Trench, Gregory J. Riggins, Darell D. Bigner, Giuseppe Palmieri, Antonio Cossu, Adrienne Flanagan, Andrew Nicholson, Judy W. C. Ho, Suet Y. Leung, Siu T. Yuen, Barbara L. Weber, Hilliard F. Seigler, Timothy L. Darrow, Hugh Paterson, Richard Marais, Christopher J. Marshall, Richard Wooster, Michael R. Stratton, P. Andrew Futreal. Mutations of the BRAF gene in human cancer. Nature, 2002. [DOI | PubMed]
- Onno Kranenburg. The KRAS oncogene: Past, present, and future. Biochimica et Biophysica Acta (BBA) – Reviews on Cancer, 2005. [DOI | PubMed]
- E Hasanov, G Chen, P Chowdhury, J Weldon, Z Ding, E Jonasch, S Sen, C L Walker, R Dere. Ubiquitination and regulation of AURKA identifies a hypoxia-independent E3 ligase activity of VHL. Oncogene, 2017. [DOI | PubMed]
- Isabel Lokody. Reprogramming metabolic flux in glioma. Nature Reviews Cancer, 2014. [DOI]
- Sevin Turcan, Vladimir Makarov, Julian Taranda, Yuxiang Wang, Armida W. M. Fabius, Wei Wu, Yupeng Zheng, Nour El-Amine, Sara Haddock, Gouri Nanjangud, H. Carl LeKaye, Cameron Brennan, Justin Cross, Jason T. Huse, Neil L. Kelleher, Pavel Osten, Craig B. Thompson, Timothy A. Chan. Mutant-IDH1-dependent chromatin state reprogramming, reversibility, and persistence. Nature Genetics, 2017. [DOI | PubMed]
- Matthew Holderfield, Marian M. Deuker, Frank McCormick, Martin McMahon. Targeting RAF kinases for cancer therapy: BRAF-mutated melanoma and beyond. Nature Reviews Cancer, 2014. [DOI | PubMed]
- Riccardo Fodde, Ron Smits, Hans Clevers. APC, Signal transduction and genetic instability in colorectal cancer. Nature Reviews Cancer, 2001. [DOI | PubMed]
- Joshua D. Cohen, Lu Li, Yuxuan Wang, Christopher Thoburn, Bahman Afsari, Ludmila Danilova, Christopher Douville, Ammar A. Javed, Fay Wong, Austin Mattox, Ralph H. Hruban, Christopher L. Wolfgang, Michael G. Goggins, Marco Dal Molin, Tian-Li Wang, Richard Roden, Alison P. Klein, Janine Ptak, Lisa Dobbyn, Joy Schaefer, Natalie Silliman, Maria Popoli, Joshua T. Vogelstein, James D. Browne, Robert E. Schoen, Randall E. Brand, Jeanne Tie, Peter Gibbs, Hui-Li Wong, Aaron S. Mansfield, Jin Jen, Samir M. Hanash, Massimo Falconi, Peter J. Allen, Shibin Zhou, Chetan Bettegowda, Luis A. Diaz, Cristian Tomasetti, Kenneth W. Kinzler, Bert Vogelstein, Anne Marie Lennon, Nickolas Papadopoulos. Detection and localization of surgically resectable cancers with a multi-analyte blood test. Science, 2018. [DOI | PubMed]
- Zena M. Hira, Duncan F. Gillies. A Review of Feature Selection and Feature Extraction Methods Applied on Microarray Data. Advances in Bioinformatics, 2015. [DOI]
- Travis I Zack, Steven E Schumacher, Scott L Carter, Andrew D Cherniack, Gordon Saksena, Barbara Tabak, Michael S Lawrence, Cheng-Zhong Zhang, Jeremiah Wala, Craig H Mermel, Carrie Sougnez, Stacey B Gabriel, Bryan Hernandez, Hui Shen, Peter W Laird, Gad Getz, Matthew Meyerson, Rameen Beroukhim. Pan-cancer patterns of somatic copy number alteration. Nature Genetics, 2013. [DOI | PubMed]
- 27.The Broad Institute Genomic Data Analysis Centre., https://gdac.broadinstitute.org, https://gdac.broadinstitute.org (2016).
- L Huang, HH Zhang, ZB Zeng, PR Bushel. Improved sparse multi-class SVM and its application for gene selection in cancer classification. Cancer Informatics, 2013. [DOI | PubMed]
- L Wang, X Shen. On l 1-norm multiclass support vector machines: methodology and theory. J. Am. Stat. Assoc., 2007. [DOI]
- P Geurts, D Ernst, L Wehenkel. Extremely randomized trees. Mach. Learn., 2006. [DOI]
- Konstantina Kourou, Themis P. Exarchos, Konstantinos P. Exarchos, Michalis V. Karamouzis, Dimitrios I. Fotiadis. Machine learning applications in cancer prognosis and prediction. Computational and Structural Biotechnology Journal, 2015. [DOI | PubMed]
- 32.Competitions, K. https://www.kaggle.com/competitions (2017).
- TG Dietterich. Ensemble methods in machine learning. Multiple classifier systems, 2000. [DOI]