
Validity of the Single-Item Screen–Cannabis (SIS-C) for Cannabis Use Disorder Screening in Routine Care
Abstract
Question:
Is a single question about cannabis use, used in routine primary care with results documented in electronic health records, an accurate screening test for past-year cannabis use disorder?
Findings:
In this diagnostic study of 1688 adult patients, the Single-Item Screen–Cannabis (SIS-C) had excellent performance characteristics as a screening test for cannabis use disorder. Report of any past-year cannabis use balanced sensitivity and specificity.
Meaning:
These findings suggest that the brief SIS-C is a valid screen for cannabis use disorder and could be easily integrated with screening for other behavioral health conditions in primary care.
Affiliations: Kaiser Permanente Washington Health Research Institute, Seattle; Department of Health Systems and Population Health, University of Washington School of Public Health, Seattle; Health Services Research & Development Center for Innovation for Veteran-Centered and Value-Driven Care, Veterans Affairs Puget Sound Health Care System, Seattle, Washington; Department of Biostatistics, University of Washington School of Public Health, Seattle; Department of Psychiatry and Behavioral Sciences, University of Washington School of Medicine, Seattle; Department of Medicine, University of Washington School of Medicine, Seattle
License: Copyright 2022 Matson TE et al. JAMA Network Open. CC BY 4.0 This is an open access article distributed under the terms of the CC-BY License.
Article links: DOI: 10.1001/jamanetworkopen.2022.39772 | PubMed: 36318205 | PMC: PMC9627408
Relevance: Moderate: mentioned 3+ times in text
Full text: PDF (1.2 MB)
Introduction
Nearly 50 million people in the United States use cannabis,1 reflecting a trend toward increasing use and decreasing perception of risk.2 Among primary care patients in Washington state, where adult cannabis use is legal, more than 20% report past-year cannabis use.3,4
Frequent cannabis use increases the risk of a cannabis use disorder (CUD),5 a pattern of continued cannabis use despite clinically significant impairment and distress.6,7 The prevalence of CUD ranges from 2% to 5% in the general population,8,9,10,11 5% to 14% in young adults,9,11 and 8% to 23% among those with mental health or other substance use disorders.10,12 CUD is the largest contributor to cannabis-attributable disease burden,13 including injuries related to cannabis intoxication (eg, motor vehicle accidents),14 worsened mental health symptoms (eg, psychosis),15 other substance use disorders,10 other medical conditions (eg, bronchial system problems),16 and adverse pregnancy outcomes.7,13,17 Despite evidence-based treatment (ie, behaviorally based therapies),18,19,20,21 CUD remains underrecognized and largely untreated.1,10,22
A brief, valid cannabis screen could increase identification of CUD, but it must be feasible for general medical settings with limited visit time. To our knowledge, no study has tested the validity of cannabis screens administered in routine care and documented in the electronic health record (EHR). Optimal screening tools for general medical settings typically include fewer than 4 items,23,24 with single items recommended.25,26 Single-item screens can be integrated with other behavioral health screens to increase the feasibility of routine CUD screening.27 Although validated single-item screens can identify substance use disorders generally, none are specific to CUD.28,29,30,31 Increasing cannabis use and legalization underscore the need to screen for cannabis separately from other substances.32 One health system integrated a question about the frequency of past-year cannabis use into routine care at the request of frontline clinicians.32 This study evaluated the performance of that Single-Item Screen–Cannabis (SIS-C) when documented in the EHR as part of routine care.
Methods
Setting
This prospective diagnostic study follows Standards for Reporting of Diagnostic Accuracy (STARD) reporting guideline and took place at Kaiser Permanente Washington (KPWA), an integrated health care system providing health insurance and medical care in Washington state, where adult cannabis use is legal. KPWA conducts annual population-based screening for behavioral health conditions (depression,33 alcohol,34 cannabis, and other drug use) in primary care using a 7-item questionnaire, with results documented in the EHR.27 A single item, the SIS-C (described in the Measures subsection), asks patients about the frequency of past-year cannabis use. Responses to the SIS-C trigger additional assessment for CUD, guiding clinical decision-making.
Sample
Adult patients (aged ≥18 years) at KPWA who completed the SIS-C in primary care between January 28 and September 12, 2019 (N = 108 950) were eligible to be sampled for a confidential cannabis survey (eFigure 1 in the Supplement). Patients were ineligible if they were current or recent KPWA employees (approximately 4%), needed an interpreter (2.6%), lived outside Washington state (<1%), were deceased (<1%), or opted out of research (<1%). Using EHR data, 5000 patients were randomly sampled for the survey. As detailed elsewhere,35 we oversampled for higher frequency of past-year cannabis use (58% daily, 24% weekly, 7% monthly, 6% less than monthly, 6% no use) and ensured 35% of the sample were individuals who belonged to minoritized racial and ethnic groups to obtain representation from important subgroups.
Procedures
Patients were recruited within 60 days of the SIS-C to ensure proximity of screen and survey responses. Patients were mailed invitations with information about the study, confidentiality, and unique identifiers linking responses to participants’ EHRs. Reminders were offered by telephone and email. The survey took approximately 20 minutes to complete online (63%) or by telephone (34%). Participants acknowledged informed consent online or by telephone prior to the survey and received $20 compensation.
The study sample included 1688 primary care patients who completed the survey, representing a 34% response rate, consistent with current health survey research.36,37 The KPWA Health Research Institute Institutional Review Board approved this study with waivers of consent (to identify eligible sample), consent documentation (for survey respondents), and HIPAA authorization.
Measures
Reference Standard for Past-Year CUD
The Composite International Diagnostic Interview Substance Abuse Module (CIDI-SAM) was selected as the reference standard for Diagnostic and Statistical Manual of Mental Disorders, Fifth Edition (DSM-5) CUD based on demonstrated feasibility of administration.38,39 The 15-item CIDI-SAM provides a diagnosis and scaled score of CUD severity (0-11), reflecting the number of DSM-5 CUD criteria met. Any past-year CUD (mild to severe) was defined as 2 or more CUD criteria endorsed on the CIDI-SAM; moderate to severe past-year CUD was defined as 4 or more CUD criteria, consistent with the DSM-5.6 The first 2 survey questions asked about frequency and recency of cannabis use. Patients who reported no past-year use on both did not complete the CIDI-SAM to minimize assessment burden (n = 94). These patients were assigned a CIDI-SAM score of zero.
EHR-Documented SIS-C
The SIS-C, offered as part of routine primary care, asked about frequency of past-year cannabis use (“How often in the past year did you use marijuana?”) with response options (“never,” “less than monthly,” “monthly,” “weekly,” and “daily or almost daily”), adapted from the third question of the World Health Organization’s Alcohol Use Disorders Identification Test,40 and scored from 0 to 4 points. The term marijuana was not defined and could include medical and nonmedical use—relevant in cannabis-legal settings where medical authorization by a clinician is not required. The SIS-C was embedded in the 7-item behavioral health questionnaire,27,41 self-administered on paper during the study period. An electronic flag prompted administration of the screen after check-in if patients had not been screened in the past year, and a medical assistant entered responses into the EHR before the physician visit.
Sociodemographic Characteristics and Comorbidities
Demographic information collected from patients and documented in the EHR by the health system at the time of sampling was used to approximate the social conditions that shape the health of patients at different developmental stages42 and with different lived experiences (sexism,43,44,45 racism,46,47,48 other social determinants of health49). This included age (18-29, 30-49, 50-64, or ≥65 years), sex or gender (female or woman or male or man; this administrative field may reflect biological sex or gender identity), race (American Indian or Alaska Native, Asian, Black or African American, Native Hawaiian or Pacific Islander, White, other, or unknown), and ethnicity (Hispanic or non-Hispanic). Due to small sample sizes and/or low prevalence of CUD in certain subgroups, we combined age groups (18-29, 30-49, ≥50 years)50 and race and ethnicity (non-Hispanic Black, non-Hispanic White, Hispanic)51 for subgroup analyses. Socioeconomic status was approximated using insurance status from enrollment records, marital status, education, employment, and type of residence reported on survey. Mental health and substance use disorder diagnoses were based on International Classification of Disease, Tenth Revision codes documented in the EHR or insurance claims in the year prior to survey completion.
Statistical Analysis
Survey Weighting
All analyses were weighted to account for stratified random sampling and nonresponse. Specifically, we calculated sampling weights by taking the inverse probability of being sampled within 10 sampling strata resulting from the 5 cannabis screen responses and indicator for patients who belong to minoritized racial and ethnic groups.52,53 We calculated nonresponse weights using logistic regression to estimate inverse probabilities of survey nonresponse based on sociodemographic characteristics.54 We multiplied sampling weights and nonresponse weights to obtain estimates representative of the KPWA primary care population.55 Comparisons of the eligible primary care population, eligible survey sample, nonrespondents, respondents, and the weighted primary care sample have been previously reported.35
Descriptive and Screening Test Performance Characteristics
We described characteristics of the sample, including the frequency of each response option on the SIS-C. We compared the SIS-C with the reference standard of any CUD and moderate to severe CUD. To assess screening test performance characteristics, we estimated sensitivity (true-positive rate) and specificity (true-negative rate) for each cut point on the SIS-C.56,57 We depicted receiver operating characteristic (ROC) curves graphically and estimated area under the curves (AUCs). ROC curves provide a useful summary of the overall discriminatory power of a screening test.56 AUCs can range from 0 to 1.0, with 0.8 to 0.9 considered excellent performance and greater than 0.9 considered outstanding.58,59 We estimated 95% CIs for weighted AUC estimates using nonparametric bootstrapping with 10 000 replications.60
Differences Across Sociodemographic Subgroups
To determine whether the SIS-C performs differently across sociodemographic subgroups, we plotted ROC curves stratified by age, sex or gender, and race and ethnicity. We evaluated differences between AUCs across subgroups and bootstrapped 95% CIs for differences; 95% CIs that did not contain zero indicated statistically significant between-group differences.60
Predictive Value of SIS-C for CUD
Although positive and negative predictive values (indicating the probability of a condition given a positive screening result and absence of a condition with a negative screening result) are often reported in validation studies, these postscreening probabilities are highly dependent on the prevalence of the condition in the screened population.61 Using Bayes theorem,61 we modeled the probability a patient has CUD if the SIS-C is positive and the probability a patient does not have CUD if the SIS-C is negative across a range of prevalence estimates for CUD (<0.5%-30%)8,9,10,11,12 to understand performance when applied to different populations. Analyses used Stata version 15.1 (StataCorp),62 R version 4.0.2 (R Project for Statistical Computing), and Excel version 2202 (Microsoft Corp) and were conducted from May 2021 to March 2022.
Results
Table 1 describes the sample, which was weighted to reflect the eligible primary care population screened for cannabis use. The weighted sample was predominantly middle-aged (weighted mean [SD] age, 50.7 [18.1]), female or women (weighted proportion [SE], 55.9% [4.1]), non-Hispanic (weighted proportion [SE], 96.7% [1.0]), White (weighted proportion [SE], 74.2% [3.7]), married or living with a partner (weighted proportion [SE], 62.8% [4.0]), with indicators of higher socioeconomic status. More than 25% had mental health diagnoses, and 5% had substance use disorder diagnoses. Based on the survey-administered CIDI-SAM reference standard, 6.6% of primary care patients met criteria for any past-year DSM-5 CUD and 1.9% for moderate to severe CUD. Characteristics stratified by CUD are available in eTable 1 in the Supplement.
Table 1. : Characteristics of the Eligible Primary Care Population
| Patient characteristics | Unweighted, No. (N = 1688) | Weighted % (SE) |
|---|---|---|
| Agezoi221123t1n1 | ||
| 18-29 | 459 | 14.9 (2.8) |
| 30-49 | 582 | 31.0 (3.9) |
| 50-64 | 329 | 26.3 (3.8) |
| ≥65 | 318 | 27.7 (3.4) |
| Sex or genderzoi221123t1n1 | ||
| Female or women | 861 | 55.9 (4.1) |
| Male or men | 827 | 44.1 (4.1) |
| Racezoi221123t1n1 | ||
| American Indian or Alaska Native | 40 | 0.4 (0.0) |
| Asian | 99 | 9.7 (2.4) |
| Black or African American | 163 | 4.8 (1.7) |
| Native Hawaiian or Pacific Islander | 36 | 2.4 (0.1) |
| White | 1192 | 74.2 (3.7) |
| Other or unknown racezoi221123t1n2 | 158 | 8.4 (2.5) |
| Hispanic ethnicityzoi221123t1n1 | 174 | 3.3 (1.0) |
| Insurancezoi221123t1n1 | ||
| Medicaid or subsidized | 210 | 6.0 (1.8) |
| Medicare | 323 | 27.1 (3.4) |
| Commercial | 1072 | 64.9 (3.7) |
| Unknown | 83 | 2.0 (0.8) |
| Marital statuszoi221123t1n3 | ||
| Married or living with partner | 966 | 62.8 (4.0) |
| Widowed | 43 | 3.0 (1.3) |
| Divorced or separated | 166 | 9.2 (2.4) |
| Single or never married | 505 | 24.1 (3.5) |
| Missing | 8 | 0.9 (0.8) |
| Educationzoi221123t1n3 | ||
| ≤High school | 319 | 12.7 (2.7) |
| Some college | 665 | 38.6 (4.0) |
| ≥4 Years of college | 694 | 47.8 (4.1) |
| Missing | 10 | 0.9 (0.8) |
| Employmentzoi221123t1n3 | ||
| Employed full time | 988 | 55.4 (4.1) |
| Employed part time | 152 | 12.6 (2.9) |
| Retired | 298 | 22.0 (3.1) |
| Other | 186 | 8.3 (2.3) |
| Unemployed | 58 | 0.8 (0.2) |
| Missing | 6 | 0.9 (0.8) |
| EHR-documented past-year diagnoseszoi221123t1n1 | ||
| Mental health diagnosis | 612 | 26.5 (3.6) |
| SUD diagnosis | 106 | 5.2 (2.0) |
| Mental health or SUD diagnosis | 662 | 28.7 (3.7) |
| CIDI-SAM criteria for cannabis use disorderzoi221123t1n3,zoi221123t1n4 | ||
| <2, No CUD | 1070 | 93.3 (1.0) |
| 2-3, Mild CUD | 364 | 4.7 (0.9) |
| ≥4, Moderate to severe CUD | 254 | 1.9 (0.2) |
Data collected from EHRs.
Patients are provided the option to indicate other when choosing among 1 or more race categories at appointing or check-in.
Data collected from confidential survey.
Participants who reported no past-year cannabis use on the survey were assigned a score of 0 on the CIDI-SAM.
Abbreviations: CIDI-SAM, Composite International Diagnostic Interview Substance Abuse Module; CUD, cannabis use disorder; EHR, electronic health record; SUD, substance use disorder.
Identification of Any Past-Year CUD
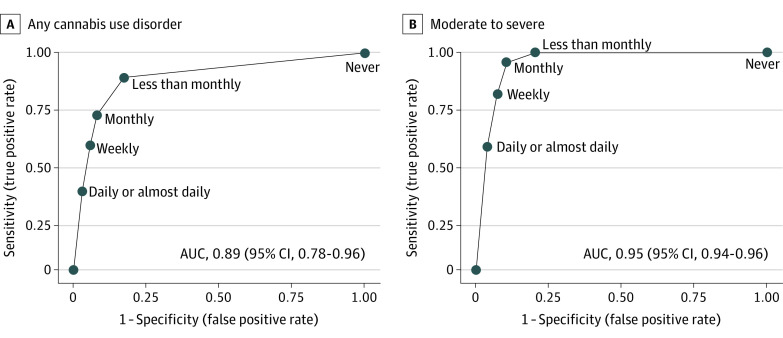
The SIS-C had excellent performance characteristics as a screen for any past-year CUD (Table 2), with an AUC of 0.89 (95% CI, 0.78-0.96) (Figure). Report of any cannabis use (ie, less than monthly or more frequent use) on the SIS-C balanced sensitivity (88%) and specificity (83%).
Table 2. : Prevalence and Performance Characteristics of the Single-Item Screen–Cannabis for Identification of Past-Year Cannabis Use Disorder
| Potential cut points for the Single-Item Screen-Cannabiszoi221123t2n3 | Prevalence of response | Screening performance for past-year CUD | ||||||
|---|---|---|---|---|---|---|---|---|
| Unweighted, No. | Weighted, % (SE) | Any CUDzoi221123t2n1 | Moderate-Severe CUDzoi221123t2n2 | |||||
| Sensitivity, % | Specificity, % | AUC (95% CI)zoi221123t2n4 | Sensitivity, % | Specificity, % | AUC (95% CI)zoi221123t2n4 | |||
| Never | 99 | 78.1 (2.0) | NA | NA | 0.89 (0.78-0.96) | NA | NA | 0.95 (0.94-0.96) |
| ≥Less than monthly | 99 | 9.6 (1.2) | 88 | 83 | 100 | 80 | ||
| ≥Monthly | 118 | 3.3 (0.4) | 71 | 92 | 96 | 89 | ||
| ≥Weekly | 376 | 4.0 (0.4) | 57 | 94 | 81 | 92 | ||
| Daily or almost daily | 996 | 5.1 (0.4) | 36 | 97 | 57 | 96 | ||
Endorsed 2 or more criteria on the Composite International Diagnostic Interview–Substance Abuse Module.
Endorsed 4 or more criteria on the Composite International Diagnostic Interview–Substance Abuse Module.
The Single-Item Screen–Cannabis asked, “How often in the past year did you use marijuana?” with responses documented in the electronic health record as part of routine care.
The 95% CIs were obtained using nonparametric bootstrapping of weighted AUC estimates.
Abbreviations: AUC, area under the receiver operating characteristic curve; CUD, cannabis use disorder; NA, not applicable.
The probability of any past-year CUD based on a positive SIS-C (positive predictive value) varied across the range of population-based prevalences and screening thresholds (Table 3). If the underlying prevalence of CUD were 4% in the screened population, the probability of CUD in patients with positive SIS-C screens ranged from 12% to 26% across screening thresholds (less than monthly to daily or almost daily). The probability of no CUD in patients with negative SIS-C screens (negative predictive value) ranged from 98% to 100%. If the population prevalence of CUD were 8% (eg, prevalence among young men), the probability of CUD in patients with positive SIS-C screens ranged from 22% to 42%, and the probability of no CUD for patients with negative SIS-C screens ranged 95% to 100%. If the prevalence of CUD were 20% to 30% (eg, prevalence among patients with mental health or substance use disorders), the probability of CUD in patients with positive SIS-C screens ranged from 45% to 78%, and the probability of no CUD in patients with negative SIS-C screens ranged from 81% to 100%.
Table 3. : Probability of Past-Year CUD if SIS-C Is Positive (or Negative) Across a Range of Population-Based Prevalence Estimates for CUD
| Threshold for positive SIS-C | Population prevalencezoi221123t3n1 | |||||||
|---|---|---|---|---|---|---|---|---|
| 0.5% | 2.0% | 4.0% | 6.0% | 8.0% | 10.0% | 20.0% | 30.0% | |
| Any CUD | ||||||||
| Probability patient has CUD if SIS-C is positive, % | ||||||||
| ≥Less than monthly | 1.6 | 6.3 | 12.1 | 17.4 | 22.4 | 26.9 | 45.3 | 58.7 |
| ≥Monthly | 2.6 | 9.9 | 18.4 | 25.7 | 32.0 | 37.5 | 57.5 | 69.9 |
| ≥Weekly | 2.8 | 10.3 | 19.0 | 26.5 | 32.9 | 38.5 | 58.5 | 70.7 |
| Daily or almost daily | 4.0 | 14.4 | 25.5 | 34.4 | 41.7 | 47.7 | 67.3 | 77.9 |
| Probability patient does not have CUD if SIS-C is negative, % | ||||||||
| ≥Less than monthly | 100.0 | 100.0 | 100.0 | 100.0 | 100.0 | 100.0 | 99.9 | 99.9 |
| ≥Monthly | 99.9 | 99.7 | 99.4 | 99.1 | 98.8 | 98.4 | 96.6 | 94.2 |
| ≥Weekly | 99.8 | 99.2 | 98.4 | 97.6 | 96.8 | 95.9 | 91.3 | 85.9 |
| Daily or almost daily | 99.7 | 98.9 | 97.8 | 96.7 | 95.5 | 94.4 | 88.1 | 81.2 |
| Moderate to severe CUD | ||||||||
| Probability patient has CUD if SIS-C is positive, % | ||||||||
| ≥Less than monthly | 1.5 | 5.7 | 11.1 | 16.0 | 20.6 | 24.9 | 42.7 | 56.1 |
| ≥Monthly | 2.4 | 9.1 | 16.9 | 23.7 | 29.8 | 35.2 | 55.0 | 67.7 |
| ≥Weekly | 3.0 | 11.1 | 20.4 | 28.2 | 34.8 | 40.6 | 60.6 | 72.5 |
| Daily or almost daily | 4.5 | 16.1 | 28.2 | 37.5 | 45.0 | 51.1 | 70.2 | 80.1 |
| Probability patient does not have CUD if SIS-C is negative, % | ||||||||
| ≥Less than monthly | 100.0 | 100.0 | 100.0 | 100.0 | 100.0 | 100.0 | 100.0 | 100.0 |
| ≥Monthly | 100.0 | 99.9 | 99.8 | 99.7 | 99.5 | 99.4 | 98.7 | 96.5 |
| ≥Weekly | 99.9 | 99.7 | 99.3 | 99.0 | 98.6 | 98.2 | 96.1 | 90.2 |
| Daily or almost daily | 99.8 | 99.4 | 98.8 | 98.1 | 97.4 | 96.7 | 93.0 | 83.2 |
Range of prevalence estimates for past-year Diagnostic and Statistical Manual for Mental Disorders, Fifth Edition, CUD was based on prior literature finding the overall prevalence of any CUD to be 2% to 4% and the overall prevalence of moderate to severe CUD to be 1% to 2%, with higher prevalence estimates for some subgroups (eg, men, young adults, patients with mental health and substance use disorder) and lower prevalence estimates for some subgroups (eg, women, older adults).
Abbreviations: CUD, cannabis use disorder; SIS-C, Single-Item Screen–Cannabis.
Identification of Moderate to Severe CUD
The SIS-C had outstanding performance characteristics for past-year moderate to severe CUD, with an AUC of 0.95 (95% CI, 0.94-0.96) (Figure). Report of monthly or more frequent cannabis use balanced sensitivity (96%) and specificity (89%). Report of daily or almost daily cannabis use had high specificity (96%) but lower sensitivity (57%) (Table 2).
The probability of past-year moderate to severe CUD based on a positive or negative SIS-C screen varied across the range of population-based prevalences and screening thresholds (Table 3). Probabilities were slightly higher than those reported for any CUD.
Performance Across Sociodemographic Subgroups
There were statistically significant but small differences in the performance of the SIS-C across age and race and ethnicity. Full results appear in the eAppendix, eFigure 2, and eTable 2 in the Supplement.
Discussion
This study evaluated the screening performance of the SIS-C, a single-item cannabis screen administered and documented in the EHR as part of routine primary care in a US state where adult cannabis use is legal. Among primary care patients, 6.6% met criteria for past-year DSM-5 CUD based on the confidential CIDI-SAM reference standard, slightly higher than national survey estimates.8,9,10,11 The SIS-C had excellent performance characteristics as a screening test for any past-year CUD and outstanding performance characteristics for moderate to severe CUD. Report of any past-year cannabis use balanced sensitivity and specificity for any CUD, whereas report of monthly or more frequent cannabis use balanced sensitivity and specificity for moderate to severe CUD.
While there are several substance use screens validated in general adult patient populations,23,28,29,30,31,39,63,64,65,66,67 few are single-item,28,29,30,31 no single-item screens are specific to cannabis use, and none have been validated when administered during routine care and documented in the medical record (Table 4). Existing single-item screens28,29,30,31 combine cannabis screening with other illegal drugs. In the context of legalization and increasing prevalence, clinicians may want to screen for cannabis separately from other drugs, as is recommended for alcohol.27 One previously validated brief screen includes cannabis-specific items, but only in the second stage of a 2-stage screening process.39 Other previously validated cannabis-specific screens (Cannabis Abuse Problems Identification Test [CUPIT], Cannabis Use Disorder Identification Test [CUDIT], CUDIT-Revised) provide more detail but may not be practical for use in routine care due to their length (>4 items)68,69,70 or appropriate due to validation only in people who use cannabis (CUDIT–Short Form, Severity of Dependence Scale).71,72
Table 4. : Review of Brief Validated Substance Use Screens (≤4 Items) for Current Cannabis or Other Drug Use Disorder in Adults in a General Medical Setting
| Screenzoi221123t4n1 | Items, No. | 2-Step screen | Cannabis-specific items, No. | Validated for CUD | Validated for SUD | Administration | Research or routine care | Optimal cut-point (range) | Sensitivity, % | Specificity, % | AUC |
|---|---|---|---|---|---|---|---|---|---|---|---|
| SIS-C | 1 | No | 1 | Yes (CIDI-SAM) | No | Self | Routine care | Any CUD: ≥less than monthly; moderate to severe CUD: ≥monthly (never to daily) | Any CUD: 88; moderate to severe CUD: 96 | Any CUD: 83; moderate to severe CUD: 89 | Any CUD: 0.89; moderate to severe CUD: 0.95 |
| SoDU23,63 | 1-2 (+1 to ascertain cannabis use) | Yes | 0 | Yes (MINI) | Yes (MINI) | Interview | Research | SUD and CUD: item 1, ≥7 or item 2, ≥2 (0-365 d) | SUD: 92; CUD: 100 | SUD: 93; CUD: 88 | SUD: 0.93; CUD: 0.94 |
| TAPS39 | 4-30 | Yes | 3 | No | Yes (CIDI-SAM) | Interview | Research | SUD in cannabis use sample: positive TAPS-1 and TAPS-2 ≥2 (0-3) | 71 | 95 | NA |
| TAPS-128 | 4 (1 item for illegal drugs) | No | 0 | No | Yes (WMH-CIDI) | Self and interview | Research | Any SUD and moderate to severe SUD: ≥less than monthly (never to daily) | Any SUD: 93; moderate to severe SUD: 95 | Any SUD: 85; moderate to severe SUD: 83 | Any SUD: 0.89; moderate to severe SUD: 0.89 |
| ASSIST-Drug65 | 1-2 | Yes | 0 | No | Yes (MINI) | Interview | Research | DUD: item 1, ≥2 (0-365 d) or item 2, ≥5 (0-365 d) | 95 | 88 | 0.92 |
| DAST-264 | 2 | No | 0 | No | Yes (MINI) | Interview | Research | DUD: ≥1 (0-365 d) | 94 | 89 | 0.92 |
| RDPS67 | 4 (+1 to ascertain cannabis use) | Yes | 0 | No | Yes (CIDI-SAM and ICD-10) | Interview | Research | Drug abuse or dependence: ≥1 (0-4); drug dependence: same as previous | Drug abuse or dependence: 81; drug dependence: 83 | Drug abuse or dependence: 98; drug dependence: 97 | Drug abuse or dependence: 0.90; drug dependence: 0.91 |
| SSIQ29 | 1 | No | 0 | No | Yes (MINI-Plus) | Self | Research | SUD: ≥1 (0 to ∞ times) | 85 | 89 | 0.87 |
| SQST31 | 1 | No | 0 | No | Yes (CIDI-SAM) | Interview | Research | DUD: ≥1 (0 to ∞ times) | 100 | 74 | NA |
| SUBS30 | 4 (1 item for illegal drugs) | No | 0 | No | Yes (MINI-Plus) | Self | Research | SUD: ≥1 or 2 d (never to 3 or more days) | 82 | 89 | 0.85 |
| TICS66 | 2 | No | 0 | No | Yes (CIDI-SAM) | Interview | Research | SUD: any reported use (never to often) | 79 | 78 | NA |
Screens were excluded if they were not validated (eg, National Institutes of Drug Abuse Quick Screen, Drug History Questionnaire or Psychoactive Drug History Questionnaire), had more than 4 items (eg, Cannabis Use Disorder Identification Test–Revised, Cannabis Abuse Problems Identification Test, Cannabis Abuse Screening Test), did not assess current use (eg, Cut Down, Annoyed, Guilty, Eye-Opener–Adapted to Include Drugs), validated only among people who use cannabis (eg, Cannabis Use Disorder Identification Test–Short Form, Severity of Dependence Scale), adolescents (eg, Screen to Brief Intervention, Brief Screener for Tobacco, Alcohol and Other Drugs), or in a specialty population such as pregnant women (eg, Substance Use Risk Profile-Pregnancy).
Abbreviations: ASSIST-Drug, Alcohol, Smoking and Substance Involvement screening Test–Drug; AUC, area under receiver operating characteristic curves; CIDI-SAM, Composite International Diagnostic Interview–Substance Abuse Module; CUD, cannabis use disorder; DAST-2, Drug Abuse Screening Test; DUD, drug use disorder; ICD-10, International Statistical Classification of Diseases and Related Health Problems, Tenth Revision; MINI, Mini-International Neuropsychiatric Interview; NA, not applicable; RDPS, Rapid Drug Problem Screen; SIS-C, Single-Item Screen–Cannabis; SoDU, Screen of Drug Use; SQST, Single-Question Screening Test; SSIQ, Single-Item Screening Questions; SUBS, Substance Use Brief Screen; SUD, substance use disorder; TAPS, Tobacco, Alcohol, Prescription Medication, and Other Substance Use; TICS, Two-Item Conjoint Screen; WMH-CIDI, World Mental Health–Composite International Diagnostic Interview.
This is the first study, to our knowledge, to evaluate the performance characteristics of any substance use screen when used in routine clinical care. Patients may respond differently to substance use screens when administered in clinical settings—where clinicians will see results in the medical record—compared with when administered in confidential research settings. It is promising, therefore, that the performance of the EHR-documented SIS-C for any CUD was comparable with the performance of single-item drug screens validated in research settings,28,29,30,31 and its performance for identifying moderate to severe CUD was stronger.28 Approximately 90% of KPWA primary care patients are screened annually with the SIS-C, demonstrating routine use is feasible and clinically useful.
The SIS-C performed well across all groups based on age, sex or gender, and race and ethnicity, but performance characteristics were less strong for younger and middle-aged adults relative to older adults. Because young adults have a higher prevalence of CUD and may be more susceptible to risks of CUD,73 the lowest threshold on the SIS-C (any use) may be preferred. Performance characteristics were also less strong for Hispanic patients relative to non-Hispanic White patients. Hispanic patients may underreport cannabis use to avoid repercussions74 stemming from intersecting cannabis and anti-immigration stigma.48
Selection of a SIS-C screening threshold for detecting CUD will depend on the prevalence of CUD in the setting where screening is taking place and resources for follow-up assessment and care. Although any use and monthly use were the optimal screening thresholds for identifying any CUD and moderate to severe CUD, respectively, applying Bayes theorem, we found that the probability a patient with a positive screen has CUD was low when the underlying prevalence of CUD in the screened population was less than 8%. A lower threshold, such as any use, may be appropriate for some settings (eg, mental health) and populations (eg, young men) expected to have a higher prevalence of CUD9,10,11,12; whereas a higher threshold, such as daily use, may be appropriate for general medical settings.8,9,10 Threshold selection also depends on how a positive screen will be used, the costs of false-positive results, and the benefits of true-positive results.75,76 Costs of screening include time and resources to administer further assessment and inappropriate diagnostic labeling of patients.34 Benefits of screening include identifying at-risk patients for prevention and harm reduction, clinician recognition of underlying reasons for cannabis use (eg, chronic pain, insomnia, depression, anxiety)35,77 and treatment options.19 Prioritizing a sensitive threshold may be appropriate as part of behavioral health screening in primary care settings when the screen is followed by low-cost, low-burden, nonstigmatizing symptom assessment and discussion of symptoms.27,41 Prioritizing a specific threshold that minimizes false positive screens might be more appropriate in resource-constrained settings or those in which a positive screen results in referral.57
The SIS-C is not a replacement for assessment of CUD symptoms or for making a diagnosis. Many—or most—patients who screen positive on the SIS-C will not meet criteria for CUD, as reflected by low positive predictive values. This is common when the underlying prevalence of the screened condition is low. Follow-up administration of longer assessments using DSM-5 criteria will be important for diagnosis of CUD.78 Furthermore, the SIS-C provides a starting point for asking patients about cannabis use to support clinicians in exploring reasons for use—including medical reasons79—and discussing benefits and risks of use.80 Finally, high negative predictive values suggest that the SIS-C accurately identifies patients without CUD so that patients who screen negative need no further evaluation.
Limitations
This study has limitations. While the CIDI-SAM is considered a criterion-standard measure of CUD,38,39 in-person administration and urine drug screening were not feasible. We used the entire survey sample, assuming no CUD criteria for respondents who indicated no past-year use on 2 different questions, to increase representation across the spectrum of cannabis use and minimize spectrum bias.81 This approach could introduce measurement error, but we expected minimal bias, as participants indicated no past-year cannabis use twice. The CIDI-SAM asked about “cannabis” use, whereas the SIS-C asked about “marijuana”; it is unclear whether patients interpreted these terms synonymously or whether they considered medical use and/or other cannabis products in their response on the SIS-C. Only 34% of invited patients completed the survey. Although lower than desired, this response rate is consistent with industry averages35 and reflects a national trend of declining response rates.82 Consequently, responses from a small number of patients may have contributed disproportionately to analyses due to weighting for oversampling design and nonresponse.83 These weights were estimated using measured factors and cannot account for unmeasured factors; however, we found patient characteristics of the weighted sample were similar to the eligible primary care population35 and other KPWA patients overall.3 We were unable to conduct subgroup analyses for all age and race subgroups due to small sample sizes. Additionally, this study was conducted in a state with legal cannabis use and among patients who were largely White, commercially insured, and with high socioeconomic status, potentially limiting generalizability. Future studies are needed to evaluate the SIS-C in settings where adults may experience legal consequences for cannabis use.
Conclusions
This study found that the SIS-C—a self-administered, single-item screen for CUD—had excellent performance characteristics when used in routine primary care in a setting with legal cannabis use. The screening thresholds can be tailored to patient populations and the needs and preferences of health settings. The SIS-C can be easily integrated with other behavioral health screening,27,41 making screening for CUD feasible in primary care.
References
- 1Substance Abuse and Mental Health Services Administration. Key substance use and mental health indicators in the United States: results from the 2020 National Survey on Drug Use and Health. October 2021. Accessed September 23, 2022. https://www.samhsa.gov/data/sites/default/files/reports/rpt35325/NSDUHFFRPDFWHTMLFiles2020/2020NSDUHFFR1PDFW102121.pdf
- Marijuana use and use disorders in adults in the USA, 2002-14: analysis of annual cross-sectional surveys.. Lancet Psychiatry., 2016. [DOI | PubMed]
- Prevalence of medical cannabis use and associated health conditions documented in electronic health records among primary care patients in Washington state.. JAMA Netw Open., 2021. [DOI | PubMed]
- Prevalence of medical and nonmedical cannabis use among veterans in primary care.. Psychol Addict Behav., 2022. [DOI | PubMed]
- Adverse health effects of non-medical cannabis use.. Lancet., 2009. [DOI | PubMed]
- 6American Psychiatric Association. Diagnostic and Statistical Manual of Mental Disorders. 5th ed. American Psychiatric Association; 2013.
- Cannabis use and cannabis use disorder.. Nat Rev Dis Primers., 2021. [DOI | PubMed]
- Cannabis use disorders among adults in the United States during a time of increasing use of cannabis.. Drug Alcohol Depend., 2019. [DOI | PubMed]
- DSM-5 cannabis use disorder in the National Epidemiologic Survey on Alcohol and Related Conditions-III: gender-specific profiles.. Addict Behav., 2018. [DOI | PubMed]
- Prevalence and Correlates of DSM-5 Cannabis Use Disorder, 2012-2013: Findings from the National Epidemiologic Survey on Alcohol and Related Conditions-III.. Am J Psychiatry., 2016. [DOI | PubMed]
- 11Substance Abuse and Mental Health Services Administration. Results from the 2020 National Survey on Drug Use and Health: Detailed tables. 2021. Accessed October 13, 2022. https://www.samhsa.gov/data/report/2020-nsduh-detailed-tables
- Prevalence and correlates of cannabis use and cannabis use disorder among U.S. veterans: results from the National Epidemiologic Survey on Alcohol and Related Conditions (NESARC-III).. Am J Psychiatry., 2022. [DOI | PubMed]
- Extent of illicit drug use and dependence, and their contribution to the global burden of disease.. Lancet., 2012. [DOI | PubMed]
- The effects of cannabis intoxication on motor vehicle collision revisited and revised.. Addiction., 2016. [DOI | PubMed]
- Meta-analysis of the association between the level of cannabis use and risk of psychosis.. Schizophr Bull., 2016. [DOI | PubMed]
- Effects of marijuana smoking on pulmonary function and respiratory complications: a systematic review.. Arch Intern Med., 2007. [DOI | PubMed]
- Prenatal exposure to cannabis and maternal and child health outcomes: a systematic review and meta-analysis.. BMJ Open., 2016. [DOI | PubMed]
- 18Chou R, Dana T, Blazina I, Grusing S, Fu R, Bougatsos C. Interventions for Unhealthy Drug Use—Supplemental Report: A Systematic Review for the U.S. Preventive Services Task Force. Evidence Synthesis, No. 187. Agency for Healthcare Research and Quality; 2020. Accessed September 23, 2022. https://www.ncbi.nlm.nih.gov/books/NBK558205/
- Treatment of cannabis use disorder: current science and future outlook.. Pharmacotherapy., 2016. [DOI | PubMed]
- Priming primary care providers to engage in evidence-based discussions about cannabis with patients.. Addict Sci Clin Pract., 2019. [DOI | PubMed]
- 21Patnode CD, Perdue LA, Rushkin M, O’Connor EA. Screening for Unhealthy Drug Use in Primary Care in Adolescents and Adults, Including Pregnant Persons: Updated Systematic Review for the U.S. Preventive Services Task Force. Evidence Synthesis, No. 186. Agency for Healthcare Research and Quality; 2020. Accessed September 23, 2022. https://www.ncbi.nlm.nih.gov/books/NBK558174/
- The prevalence of Healthcare Effectiveness Data and Information Set (HEDIS) initiation and engagement in treatment among patients with cannabis use disorders in 7 US health systems.. Subst Abus., 2019. [DOI | PubMed]
- Screen of drug use: diagnostic accuracy for cannabis use disorder.. Addict Behav., 2019. [DOI | PubMed]
- Screening instruments for substance use and brief interventions targeting adolescents in primary care: a literature review.. Addict Behav., 2013. [DOI | PubMed]
- 25Lanier D, Ko S. Screening in Primary Care Settings for Illicit Drug Use: Assessment of Screening Instruments: A Supplemental Evidence Update for the U.S. Preventive Services Task Force. Agency for Healthcare Research and Quality; 2008. Accessed September 23, 2022. https://www.ncbi.nlm.nih.gov/pubmed/20722154
- 26National Institute on Alcohol Abuse and Alcoholism. Helping patients who drink too much: a clinician’s guide, 2005 edition. Accessed September 23, 2022. https://pubs.niaaa.nih.gov/publications/practitioner/cliniciansguide2005/guide.pdf
- Routine assessment of symptoms of substance use disorders in primary care: prevalence and severity of reported symptoms.. J Gen Intern Med., 2020. [DOI | PubMed]
- Validation of the TAPS-1: a four-item screening tool to identify unhealthy substance use in primary care.. J Gen Intern Med., 2017. [DOI | PubMed]
- Validation of self-administered Single-Item Screening Questions (SISQs) for unhealthy alcohol and drug use in primary care patients.. J Gen Intern Med., 2015. [DOI | PubMed]
- A brief patient self-administered substance use screening tool for primary care: two-site validation study of the Substance Use Brief Screen (SUBS).. Am J Med., 2015. [DOI | PubMed]
- A single-question screening test for drug use in primary care.. Arch Intern Med., 2010. [DOI | PubMed]
- Screening for drug use in primary care: practical implications of the new USPSTF recommendation.. JAMA Intern Med., 2020. [DOI | PubMed]
- The Patient Health Questionnaire-2: validity of a two-item depression screener.. Med Care., 2003. [DOI | PubMed]
- AUDIT-C as a brief screen for alcohol misuse in primary care.. Alcohol Clin Exp Res., 2007. [DOI | PubMed]
- Comparison of medical cannabis use reported on a confidential survey vs documented in the electronic health record among primary care patients.. JAMA Netw Open., 2022. [DOI | PubMed]
- Population survey features and response rates: a randomized experiment.. Am J Public Health., 2016. [DOI | PubMed]
- Factors associated with health survey response among young employees: a register-based study using online, mailed and telephone interview data collection methods.. BMC Public Health., 2020. [DOI | PubMed]
- Comparing assessments of DSM-IV substance dependence disorders using CIDI-SAM and SCAN.. Drug Alcohol Depend., 1996. [DOI | PubMed]
- Performance of the Tobacco, Alcohol, Prescription Medication, and Other Substance Use (TAPS) tool for substance use screening in primary care patients.. Ann Intern Med., 2016. [DOI | PubMed]
- 40Babor TF, Higgins-Biddle JC, Saunders JB, Monteiro MG. AUDIT: The Alcohol Use Disorders Identification Test: Guidelines for use in primary care. 2nd ed. World Health Organization; 2001.
- Costs of using evidence-based implementation strategies for behavioral health integration in a large primary care system.. Health Serv Res., 2020. [DOI | PubMed]
- A life course approach to chronic disease epidemiology: conceptual models, empirical challenges and interdisciplinary perspectives.. Int J Epidemiol., 2002. [DOI | PubMed]
- Sex and gender interactions on the use and impact of recreational cannabis.. Int J Environ Res Public Health., 2020. [DOI | PubMed]
- Gender norms, roles and relations and cannabis-use patterns: a scoping review.. Int J Environ Res Public Health., 2020. [DOI | PubMed]
- Genders, sexes, and health: what are the connections–and why does it matter?. Int J Epidemiol., 2003. [DOI | PubMed]
- 46Boyd RW, Lindo EG, Weeks LD, McLemore MR. On racism: a new standard for publishing on racial health inequities. Health Affairs Blog. July 2, 2020. Accessed September 23, 2022. https://www.healthaffairs.org/do/10.1377/forefront.20200630.939347/
- Critical race theory, race equity, and public health: toward antiracism praxis.. Am J Public Health., 2010. [DOI | PubMed]
- The colors of cannabis: race and marijuana.. UC Davis Law Rev., 2016
- 49Keyes KM, Galea S. Population Health Science. Oxford University Press; 2016. doi:10.1093/med/9780190459376.001.0001
- Marijuana use among adults 50 years or older in the 21st century.. Gerontol Geriatr Med., 2018. [DOI | PubMed]
- Classification of race and ethnicity: implications for public health.. Annu Rev Public Health., 2003. [DOI | PubMed]
- 52Kish L. Survey Sampling. John Wiley & Sons; 1965.
- A generalization of sampling without replacement from a finite universe.. J Am Stat Assoc., 1952. [DOI]
- The use of weights to account for non-response and drop-out.. Soc Psychiatry Psychiatr Epidemiol., 2005. [DOI | PubMed]
- Handling missing data in survey research.. Stat Methods Med Res., 1996. [DOI | PubMed]
- 56Hulley SB. Designing Clinical Research. Lippincott Williams & Wilkins; 2007.
- Sensitivity, specificity, and predictive values: foundations, pliabilities, and pitfalls in research and practice.. Front Public Health., 2017. [DOI | PubMed]
- Receiver operating characteristic curve in diagnostic test assessment.. J Thorac Oncol., 2010. [DOI | PubMed]
- 59Hosmer DW, Lemeshow S. Applied Logistic Regression. 2nd Ed. John Wiley and Sons; 2000.
- Comparison of non-parametric confidence intervals for the area under the ROC curve of a continuous-scale diagnostic test.. Stat Methods Med Res., 2008. [DOI | PubMed]
- Probability theory in the use of diagnostic tests: an introduction to critical study of the literature.. Ann Intern Med., 1986. [DOI | PubMed]
- 62Newson R. SENSPEC: Stata module to compute sensitivity and specificity results saved in generated variables. June 6, 2017. Accessed September 26, 2022. https://EconPapers.repec.org/RePEc:boc:bocode:s439801
- Screen of drug use: diagnostic accuracy of a new brief tool for primary care.. JAMA Intern Med., 2015. [DOI | PubMed]
- Diagnostic accuracy of a two-item Drug Abuse Screening Test (DAST-2).. Addict Behav., 2017. [DOI | PubMed]
- Diagnostic accuracy of a two-item screen for drug use developed from the alcohol, smoking and substance involvement screening test (ASSIST).. Drug Alcohol Depend., 2016. [DOI | PubMed]
- A two-item conjoint screen for alcohol and other drug problems.. J Am Board Fam Pract., 2001. [PubMed]
- Screening for drug use disorders in the emergency department: performance of the rapid drug problems screen (RDPS).. Drug Alcohol Depend., 2004. [DOI | PubMed]
- An improved brief measure of cannabis misuse: the Cannabis Use Disorders Identification Test-Revised (CUDIT-R).. Drug Alcohol Depend., 2010. [DOI | PubMed]
- The Cannabis Use Problems Identification Test (CUPIT): development, reliability, concurrent and predictive validity among adolescents and adults.. Addiction., 2010. [DOI | PubMed]
- A prototype screening instrument for cannabis use disorder: the Cannabis Use Disorders Identification Test (CUDIT) in an alcohol-dependent clinical sample.. Drug Alcohol Rev., 2003. [DOI | PubMed]
- Preliminary development of a brief cannabis use disorder screening tool: the Cannabis Use Disorder Identification Test Short-Form.. Cannabis Cannabinoid Res., 2016. [DOI | PubMed]
- Severity of Dependence Scale: establishing a cut-off point for cannabis dependence in the German adult population.. Sucht., 2008. [DOI]
- Adverse health effects of marijuana use.. N Engl J Med., 2014. [DOI | PubMed]
- The race/ethnicity disparity in misdemeanor marijuana arrests in New York City.. Criminol Public Policy., 2007. [DOI | PubMed]
- Implementation of evidence-based alcohol screening in the Veterans Health Administration.. Am J Manag Care., 2006. [PubMed]
- Basic principles of ROC analysis.. Semin Nucl Med., 1978. [DOI | PubMed]
- Medical reasons for marijuana use, forms of use, and patient perception of physician attitudes among the US population.. J Gen Int Med., 2020. [DOI]
- 78Saxon AJ. Screening for unhealthy use of alcohol and other drugs in primary care. UpToDate. Updated February 16, 2022. Accessed September 23, 2022. https://www.uptodate.com/contents/screening-for-unhealthy-use-of-alcohol-and-other-drugs-in-primary-care
- Prevalence and correlates of cannabis use disorder among Australians using cannabis products to treat a medical condition.. Drug Alcohol Rev., 2022. [DOI | PubMed]
- Self-reported practices of frontline cannabis dispensary workers and the implications for clinicians.. JAMA Netw Open., 2021. [DOI | PubMed]
- Spectrum bias—why clinicians need to be cautious when applying diagnostic test studies.. Fam Pract., 2008. [DOI | PubMed]
- 82Czajka J, Beyler A. Declining response rates in federal surveys: trends and implications. June 15, 2016. Accessed August 22, 2022. https://www.mathematica.org/our-publications-and-findings/publications/declining-response-rates-in-federal-surveys-trends-and-implications-background-paper
- Review of inverse probability weighting for dealing with missing data.. Stat Methods Med Res., 2013. [DOI | PubMed]