Landscape of BRAF transcript variants in human cancer
Abstract
The BRAFV600E mutant kinase is widely studied as a cancer driver and therapeutic target. Here, we investigated how the annotation of the BRAF‐reference (ref) and BRAF‐X1 variants has evolved in public databases and addressed challenges posed by their discrimination and quantification from short‐read sequencing. We built IsoWorm, a bioinformatic pipeline tailored to discriminate and quantify BRAF variants, and employed it to analyze > 600 cancer cell lines and > 1000 cancer tissue samples. Using FLIBase, we reanalyzed TCGA data from > 9000 cancer tissue samples. We consistently found that BRAF‐X1 (now BRAF‐204) is very abundant in human cancer and its expression is 1.5–75 times greater than that of BRAF‐ref (now BRAF‐220). Crucially, we identified KIRP‐kidney renal papillary cell carcinoma as a cancer subtype in which a high BRAF‐204/BRAF‐220 ratio is an independent prognostic factor of poor outcome. Our in silico analyses establish BRAF as a mix of two protein‐coding transcript variants, with BRAF‐204 being more highly expressed than BRAF‐220. These findings prompt us to undertake the systematic benchmarking of BRAF‐204 against BRAF‐220 in terms of molecular mechanisms, biological activities, druggability, and clinical relevance.
Article type: Brief Report
Keywords: cancer, KIRP, long reads, RNA sequencing, short reads, transcript variants
Affiliations: Institute of Clinical Physiology (IFC), CNR Pisa Italy; Oncogenomics Unit Core Research Laboratory (CRL), ISPRO Pisa Italy; University of Siena Italy; CTGLab, Institute of Informatics and Telematics (IIT), CNR Pisa Italy; Department of Information Engineering University of Florence Italy
License: © 2025 The Author(s). Molecular Oncology published by John Wiley & Sons Ltd on behalf of Federation of European Biochemical Societies. CC BY 4.0 This is an open access article under the terms of the http://creativecommons.org/licenses/by/4.0/ License, which permits use, distribution and reproduction in any medium, provided the original work is properly cited.
Article links: DOI: 10.1002/1878-0261.70043 | PubMed: 40415485 | PMC: PMC12420348
Relevance: Moderate: mentioned 3+ times in text
Full text: PDF (52 KB)
Background
The RAF kinase family belongs to the ERK signaling pathway, which is involved in cell growth, differentiation, and survival. Approximately 60% of thyroid cancers, 50% of melanomas, 10% of colorectal cancers, and 3% of non‐small cell lung cancers exhibit a BRAF mutation at the V600 residue, which renders the kinase constitutively active. The BRAFV600E mutant kinase has been widely studied as a cancer driver and therapeutic target [ref. 1]. However, the regulation of BRAF gene expression and the full spectrum of its biological activities remain largely unexplored, although such knowledge is both valuable per se and instrumental for achieving more precise and effective targeting [ref. 2].
The expression of multiple isoforms from the same gene is extremely common in the human genome. It contributes to defining the complexity of higher vertebrates and maintaining their physiological state. However, it is also heavily altered in diseases, including cancer [ref. 3]. In our study published in 2017, we comprehensively investigated the landscape of BRAF mRNA and protein isoforms. We analyzed the 15 annotated and predicted RNA variants that were present in the Ensembl (release 80) and NCBI (GRCh38.p1) databases via RNA‐seq data from ~ 4800 cancer patients (9 cancer types) belonging to the TCGA. By mapping reads on variant‐specific exons or exon–exon junctions, we concluded that, in both healthy and cancerous tissues, BRAF mRNA invariably exists as a mix of three full‐length variants, namely, BRAF‐reference (ref) and BRAF‐X1, which we previously detected experimentally [ref. 4], as well as BRAF‐X2. These variants differ in the C‐term of their coding sequences, as well as in the sequence and length of their 3’UTRs. They also show expression level specificities, with BRAF‐X1 being more highly expressed than BRAF‐ref and BRAF‐X2 in most cancer cell lines, as well as in some of the cancer types analyzed. In terms of proteins, only BRAF‐ref and BRAF‐X1 are detectable, whereas BRAF‐X2 is unstable (its C‐term domain is recognized by the ubiquitin–proteasome pathway, and the protein is degraded) [ref. 5].
The ref and X1 isoforms have been further studied by our group, both as mRNAs and as proteins. We established that the BRAF‐X1 variant is more phylogenetically conserved than the BRAF‐ref variant [ref. 5, ref. 6]. Furthermore, we identified a group of microRNAs [ref. 7] and one mRNA binding protein (PARP1, [ref. 8]) that selectively bind the X1 3’UTR, positively or negatively affect BRAF stability/translation, and consequently contribute to fine‐tuning the output of the ERK signaling pathway. In terms of proteins, both the ref and X1 isoforms are endowed with kinase activity and together account for the known oncogenic features displayed by BRAFV600E in melanoma cells [ref. 5, ref. 9]. Interestingly, melanoma‐free survival curves generated in vivo in adult zebrafish indicate that the BRAFV600E‐X1 protein is a much weaker melanoma driver than the BRAFV600E‐ref protein. Crucially, the presence of the 3’UTR quenches the oncogenicity of the ref protein, underscoring the importance of post‐transcriptional regulation and/or coding‐independent functions for BRAFV600E biology [ref. 6].
Since 2017, new versions of the NCBI and Ensembl databases have been released, up to the latest NCBI (GRCh38.p14) and Ensembl (113) databases; several RNA‐seq datasets of cancer cell lines (Cancer Cell Line Encyclopedia (CCLE, https://sites.broadinstitute.org/ccle/)) and tissue samples ((Gene Expression Omnibus (GEO, https://www.ncbi.nlm.nih.gov/gds), International Cancer Genome Consortium (ICGC, https://dcc.icgc.org/)) have become publicly available; the TCGA repository has been expanded to include data on approximately 11000 cancer patients (https://www.cancer.gov/ccg/research/genome‐sequencing/tcga/studied‐cancers); several computational methods for the identification and quantification of transcript variants from short‐read sequencing have been developed and benchmarked [ref. 10]; long‐read sequencing technology has proven its potential for variant identification, overcoming limitations intrinsically associated with short‐read technology [ref. 11, ref. 12].
To provide an update on the identity and relative abundance of BRAF transcript variants in human cancer, here we describe the evolution of their annotation in publicly available repositories of RNA and protein sequences. We also quantify their expression levels across several datasets. We report that BRAF‐X1 (currently BRAF‐204) is the predominant transcript variant in human cancer and it is expressed at a higher level than the reference (currently BRAF‐220) variant. We also highlight that the BRAF‐204/BRAF‐220 ratio can be associated with a prognostic value.
Materials and methods
RNA‐seq data of cell lines and tissue samples
We analyzed:
- Raw paired‐end RNA‐seq FASTQ data of 690 cancer cell lines and 12 different tumor types (central nervous system (n = 64), colorectal (n = 56), hematopoietic and lymphoid (n = 176), kidney (n = 31), liver (n = 23), lung (n = 151), ovary (n = 42), pancreas (n = 41), prostate (n = 7), skin (n = 55), stomach (n = 34), and thyroid (n = 10)) from the CCLE collection;
- Raw paired‐end RNA‐seq FASTQ data of 762 cancer tissue samples and nine different tumor types (acute lymphoblastic leukemia (ALL, n = 173), acute myeloid leukemia (AML, n = 81), chronic lymphocytic leukemia (CLL, n = 29), chronic myelogenous leukemia (CML, n = 26), colorectal (n = 32), gliomas (n = 274), lung (n = 42), melanoma (n = 46), and prostate (n = 59)) belonging to nine GEO datasets;
- BAM files of aligned RNA‐seq reads of 258 cancer tissue samples and five different tumor types (esophagus (n = 7), kidney (n = 49), liver (n = 64), ovary (n = 60), and pancreas (n = 78)) belonging to five ICGC datasets. They were obtained as sliced BAM relative to the genomic region encompassing the BRAF gene (i.e., chr7:140718327–140926929, GRCh38.p14).
Data processing and BRAF quantification via IsoWorm
We built a bioinformatic pipeline called IsoWorm to process FASTQ or BAM files from short‐read sequencing experiments. IsoWorm is a Snakemake workflow that includes all necessary tools, supportive scripts, and config files for the automatic quantification of BRAF transcript variants. In more detail, raw paired‐end reads and metadata were downloaded from the SRA (CCLE and GEO samples) via the ‘ffq’ tool (v.0.2.1), which provided a list of SRA IDs. The FASTQ files were processed with salmon (v.1.10.2) and star aligner (v.2.7.1) using GRCh38.p14 as the FASTA reference genome/transcriptome and a GTF file with annotations of all annotated transcripts (Ensembl 113). Salmon generates TSV files with transcript quantification data according to the provided annotation, whereas the aligned BAM files produced by star were further processed with stringtie (v.2.2.1) via a custom GTF file that included only the genomic coordinates for the unique regions distinguishing BRAF‐204 (i.e., chr7:140725145–140719327) and BRAF‐220 (chr7:140732564–140730665) (Fig. S1). The sliced BAM files (ICGC samples) were downloaded with the ICGC score‐client API (v.5.8.1) and processed only with StringTie and the custom GTF file. IsoWorm is available at https://github.com/ctglab/isoworm.
Quantification of BRAF transcript variants
Through the IsoWorm workflow, we obtained two different variant estimations: one for all the 21 annotated variants via Salmon and the second specifically restricted to BRAF‐204 and BRAF‐220 via the GTF custom approach. In the latter approach, we calculated the FPKM for the two regions of interest, exploiting only the information (i.e., length and coverage) that is available from a sliced BAM, as we did for ICGC samples. We used the following formula:
where qi is the raw fragments count specifically mapping unique genomic regions for BRAF‐220 or BRAF‐204, li is the respective genomic length, and ∑jqj is the total number of mapped fragments (library size) retrieved from STAR log files. All the statistical tests were conducted via r (v.4.2.1).
Analysis of poly(a) sites
Raw single‐end QuantSeq 3′ mRNA‐Seq REV FASTQ data and the metadata of 97 lung cancer samples were aligned via IsoWorm as described above [ref. 13]. The obtained BAM files were processed through a custom R script via GenomicAlignments (v.1.34.1) and bedtoolsr (v.2.30) libraries to detect polyA sites at the 3’UTR. For the detection of the 3’UTR peak region in each sample, the following criteria were considered: (a) a coverage greater than 5% of the most highly expressed peak [ref. 14] and (b) a region length of at least 80 bp. All the peaks were compared to each other to select only those that were present and conserved in more than 50% of the samples.
Visualization of the expression and the ratio of transcript variants
All the plots of the expression profiles of the variants and their ratios were calculated and plotted via the r packages: data.table (v.1.14.2), dplyr (v.2.2.1), ggplot2 (v.3.3.6), tidyr (v.1.2.0), ggsignif (v.0.6.4), and patchwork (v.1.1.2). The TPM and FPKM values are represented in the plots as log2(TPM + 0.01) and log2(FPKM + 0.01), respectively.
Analysis of TCGA patient data
In addition to transcript expression levels, the clinical data of TCGA patients were obtained from the FLIBase web server (v.1) [ref. 15]. We selected the 11 cancer types that are characterized by the highest frequency of BRAF alterations [ref. 16]: ACC‐adrenocortical carcinoma, COAD‐colon adenocarcinoma, ESCA‐esophageal carcinoma, GBM‐glioblastoma multiforme, LUAD‐lung adenocarcinoma, KIRP‐kidney renal papillary cell carcinoma, OV‐ovarian serous cystadenocarcinoma, SKCM‐skin cutaneous melanoma, TGCT‐testicular germ cell tumors, THCA‐thyroid carcinoma, and UCEC‐uterine corpus endometrial carcinoma. For all tumors, patients were grouped according to their BRAF‐204/BRAF‐220 ratio, creating three groups: Group 1, with the lowest ratios (≤ 33rd percentile (1Q)); Group 2, with mid‐range ratios (> 33rd percentile and ≤ 66th percentile (2Q)); and Group 3, with the highest ratios (> 66th percentile (3Q)).
We subsequently analyzed if Group 1/2/3 has an impact on survival time. We performed univariate Cox proportional hazards regression (Table S1), adding the Benjamini–Hochberg (BH) correction for multiple comparisons.
For KIRP, we also performed multivariate Cox proportional hazards regression analysis, considering as independent risk variables not only Group 1/2/3, but also tumor stage (TNM I, II, III–IV), and the individual parameters that compose it: size and extent of the primary tumor (T3–T4/T1–T2), involvement of regional lymph nodes (N1–N2/N0), and presence of distant metastases (M1/M0).
Univariate and multivariate Cox proportional hazards regression analyses were conducted in r (v.4.2.1) using the survminer 0.4.9 and survival (v.3.5) Bioconductor packages.
To evaluate whether having a higher ratio increases the probability of being at a higher tumoral stage, we performed a proportional odds logistic regression for ordered category outcome analysis, considering stage I KIRP patients as a reference and using tumor stage (I < II < III–IV) as a response variable. The latter analyses were conducted via the mass (v.7.3.60) package in r.
The Brant Wald test was used to evaluate the model, and the results are reported in Table S2.
Analysis of BRAF‐204 ceRNA network in the KIRP dataset at TCGA
The correlation between the expression levels of BRAF‐204, the transcripts of other genes, and microRNAs was investigated using Spearman’s rank coefficient on the entire KIRP cohort (n = 290). The quantification of the BRAF‐204 transcript was retrieved from the FLIBase database. The quantification of the transcripts of other genes (including ENSG00000140992.18/PDPK1) was obtained directly from the TCGA dataset using the recount3 library in r. The quantification of miRNAs was obtained from the GDC TCGA project. Transcript expression levels were expressed as log2(TPM + 1), while miRNA expression levels were expressed as log2(RPM + 1).
The Spearman’s correlation coefficient (rho, R) ranges from −1 to 1 and indicates the strength and direction of the correlation: positive values for direct correlation and negative values for anticorrelation. All P‐values were corrected using the Benjamini–Hochberg (BH) correction for multiple comparisons. Statistical significance was defined as adjusted P‐values (Padj) < 0.05.
Results and Discussion
BRAF‐ref/220 and BRAF‐X1/204 isoforms in publicly available repositories of RNA and protein sequences
We have monitored the evolution of the annotation of ref and X1 isoforms of BRAF since 2017.
In 2017, we referred to the annotations reported in NCBI (GRCh38.p1) and Ensembl (80) databases, and we defined BRAF‐ref as the transcript corresponding to ID NM_004333.4 in NCBI and ID ENST00000288602/BRAF‐001 in Ensembl. The two annotations are concordant in terms of CDS length (766 aa) but discordant in terms of 3’UTR length (590 nt in NCBI vs 121 nt in Ensembl). Our analysis of TCGA RNA‐seq data suggested that in human cancer the BRAF‐ref 3’UTR is even shorter than that reported in Ensembl and rarely exceeds ~ 76 nt [ref. 5].
The BRAF‐X1 transcript variant was named after the description associated with ID XM_005250045.1 present in NCBI (‘PREDICTED transcript variant X1’). It is characterized by a 767‐aa‐long CDS and a lengthy 3’UTR (7160 nt), which, according to the analysis of TCGA RNA‐seq data, is fully transcribed [ref. 5].
As mentioned in the Introduction, the 3’UTRs of BRAF‐ref and BRAF‐X1 mRNAs differ not only in length but also in sequence, whereas the proteins they encode for differ in the C‐term (ref: ‐GYGAFPVH vs. X1: ‐GYGEFAAFK). This is because the ref variant is composed of 18 exons, whereas the X1 is a splicing variant encompassing a shorter version of exon 18 that is joined with a very long downstream 19th exon [ref. 4, ref. 5, ref. 17]. Interestingly, in melanoma samples, the 19th exon is included in BRAF gene amplification [ref. 18], as well as in the duplicated kinase domain that confers acquired resistance to BRAF/MEK inhibitors [ref. 19].
We tracked IDs and associated sequence details for the BRAF‐ref and X1 transcript variants from 2017 to the latest release of the NCBI (GRCh38.p14) and Ensembl (113) databases. Currently, NCBI lists 25 BRAF transcript variants, whereas Ensembl lists 21 BRAF transcript variants.
BRAF‐ref corresponds to ID NM_004333.6 present in NCBI and ID ENST00000646891.2/BRAF‐220 present in Ensembl. The two sequences are identical and converge into a high‐quality annotation variant. In the MANE (Matched Annotation from the NCBI and EMBL‐EBI) database (v.1.3), the BRAF‐220 ID is recognized as the ‘MANE Select’ transcript for the BRAF gene [ref. 20]. Compared with 2017, NM_004333.6 and ENST00000646891.2/BRAF‐220 present longer 5′ and 3′ untranslated regions, such that the nominal length of the transcript exceeds 6 kb (Fig. 1A,B).
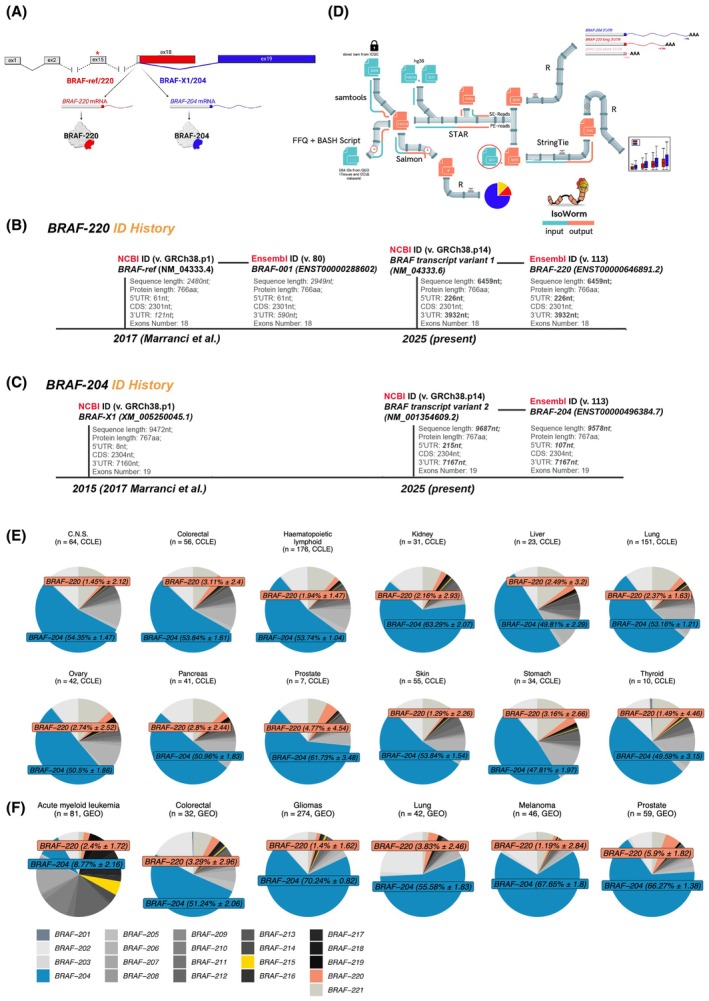
BRAF‐X1 corresponds to ‘BRAF transcript variant 2’ present in NCBI with ID NM_001354609.2, while the matching Ensembl ID is ENST00000496384.7/BRAF‐204. Compared with 2017, these two annotations reveal slightly longer 5′ and 3′UTRs (Fig. 1A,C).
Notably, BRAF‐X2 (XM_005250046.1 in NCBI (GRCh38.p1)) is no longer present (record removed).
In compliance with the most updated official nomenclature, from this point onward, we refer to BRAF‐ref as BRAF‐220 and to BRAF‐X1 as BRAF‐204.
A consistent annotation is not the only issue related to mRNA variants because for many transcripts the evidence of translation is very limited. The APPRIS database [ref. 21], which was developed within the GENCODE consortium and is used by GENCODE curators to update gene models, establishes principal variants via protein structural information, functional features, and cross‐species conservation. The current release of the db (2024_03v.49 Gencode47/Ensembl113) contains 11 variants for BRAF. None of them are selected by the APPRIS core modules as clear principal variants, and none are associated with strong proteomics. Nine variants are classified as MINORs, with a very low chance of being translated into (functional) proteins. The remaining two are BRAF‐220, which is classified as PRINCIPAL:4 and has the highest TRIFID functional score (= 1), and BRAF‐204, which is classified as ALTERNATIVE:1. This is because it is flagged as TSL = 5 (i.e., without a single transcript that supports the model structure). However, BRAF‐204 has a remarkably high TRIFID score (0.993), which in turn indicates that its likelihood of being functionally relevant and under selective pressure is very high.
The recently published FLIBase (Full‐Length Isoforms in cancers and normal tissues database, http://www.flibase.org), which annotates full‐length splice variants by combining long reads for discovery and short reads on exon–exon splice junctions for validation [ref. 15], identifies both BRAF‐220 and BRAF‐204 as full‐length and full‐splice variants (TCONS_00952581 and TCONS_00952571, respectively). It is conceivable that TCONS_00952571 will provide the experimental support necessary to increase the TSL of BRAF‐204 in future releases of the NCBI, Ensembl, MANE, and APPRIS databases.
Finally, proteomic evidence, curated by CNIO and collected in the APPRIS database [ref. 21], confirms what we reported in 2017 [ref. 5]: isoform‐specific C‐terminal peptides were retrieved for both CCDS87555.1/BRAF‐220 (753–766aa‐TPIQAGGYGAFPVH (3 times)) and CCDS5863.1/BRAF‐204 (753–767aa‐TPIQAGGYGEFAAFK (15 times)).
In conclusion, BRAF should be fully acknowledged as a mix of BRAF‐220 and BRAF‐204 transcript variants, which differ in length and sequence of their 3’UTRs and are translated into protein isoforms that differ at the C‐term.
Tools for the quantification of BRAF transcript variants
Even though the official annotation for BRAF transcript variants has been updated (see above), the precomputed quantification reported in various databases (XENA, https://xenabrowser.net/; GEPIA2, http://gepia2.cancer‐pku.cn/#index; SRTdb, http://www.shenglilabs.com/SRTdb/) is still based on an older Ensembl release (version 40). Specifically, BRAF‐220 is present as the old ENST00000288602/BRAF‐001 transcript, whereas BRAF‐204 is missing.
To quantify the BRAF‐220 and BRAF‐204 transcript variants in the TCGA datasets, we used the above‐mentioned FLIBase [ref. 15]. By combining datasets produced by both short‐ and long‐read technologies, the effort of Shi et al. allows the retrieval of a comprehensive collection of full‐length transcripts and their expression levels in both healthy and cancerous tissues. Specifically, a total of 43 BRAF transcript variants were reconstructed, most of which are de novo and noncoding. As mentioned above, BRAF‐220 (TCONS_00952581) and BRAF‐204 (TCONS_00952571) are both retrieved as full‐length and full‐splice variants.
To quantify BRAF transcript variants in additional cancer‐related RNA‐seq datasets, we focused on the 21 transcripts reported in Ensembl (release 113) because they are routinely updated within the GENCODE project, and we built an ad hoc bioinformatic pipeline called IsoWorm. IsoWorm (Fig. 1D) integrates two distinct methods: Salmon, a state‐of‐the‐art tool for transcript variant quantification, and a custom approach designed to specifically distinguish between the BRAF‐220 and BRAF‐204 variants. Salmon quantifies transcripts via a quasimapping approach and probabilistic modeling, which results in higher sensitivity compared to other methods [ref. 22]. Concerning the custom approach, we take advantage of two manually selected regions that are variant‐specific. In particular, the region distinctive for BRAF‐220 corresponds to the most downstream ~ 1 kb out of the ~ 3.9 kb long 3’UTR, while the region distinctive for BRAF‐204 corresponds to the most downstream ~ 4 kb out of the ~ 7 kb long 3’UTR (green boxes in Fig. S1). We then used custom GTF files encompassing the genomic coordinates of those regions. Following the read mapping step, the expression level of full‐length transcripts is estimated considering the library size of the dataset under study and the size of the selected regions. The advantages of IsoWorm include easy customization to quantify the transcript variants of interest, versatility in dealing with diverse input file formats from RNA‐seq experiments, acceptance of raw FASTQ files or alignment BAM files, and acquisition from the full experiment or a partial subset. Owing to the implementation of Salmon, the expression level of all the known transcripts of the gene of interest can be calculated, so that they can be ranked from the highest to the lowest expression. Owing to the implemented custom approach, IsoWorm estimates transcript expression from sliced BAM files or partial FASTQ files, favoring faster and lighter quantification of the transcripts of interest. However, transcripts are quantified in FPKM, which allows only intrasample comparisons [ref. 23]. IsoWorm is publicly available at https://github.com/ctglab/isoworm.
In conclusion, FLIBase and IsoWorm allow the correct identification and quantification of BRAF transcript variants in RNA‐seq datasets of human cancer.
BRAF‐204 transcript variant is highly expressed across cancer cell lines and tissues
IsoWorm was used to quantify BRAF transcript variants in 690 CCLE cell lines belonging to 12 cancer types: central nervous system (C.N.S.), colorectal, hematopoietic and lymphoid, kidney, liver, lung, ovary, pancreas, prostate, skin, stomach, and thyroid.
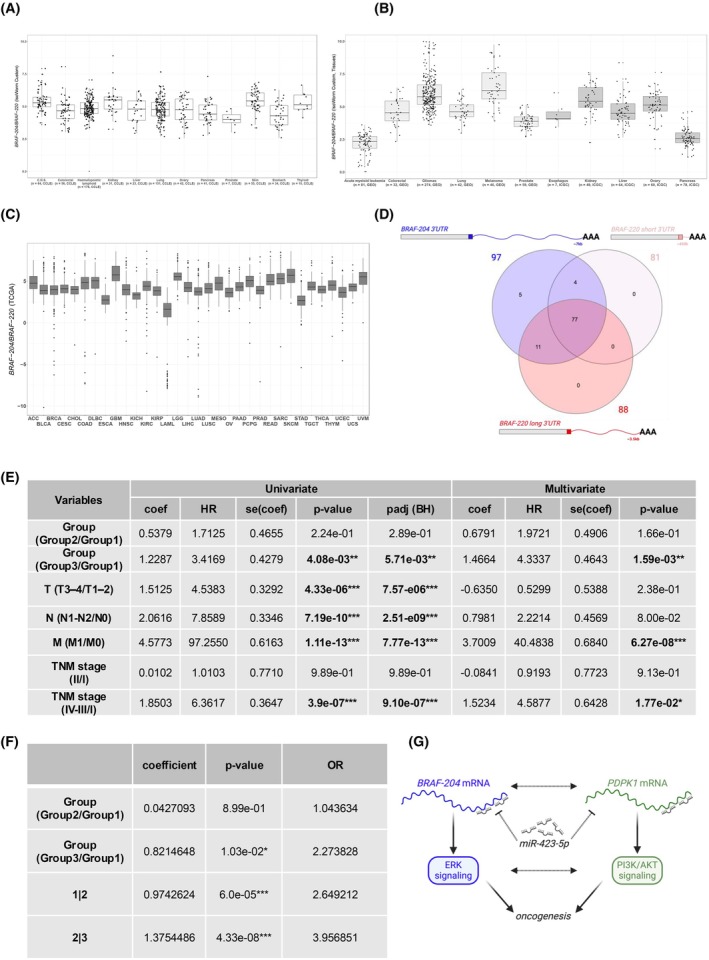
We used the Salmon module to calculate the expression levels of all 21 BRAF transcript variants reported in Ensembl (release 113). The pie charts of variant expression illustrate that BRAF‐204 is the most highly expressed variant in cancer cell lines, accounting for 53.6 ± 4.5% of all BRAF transcripts, whereas the BRAF‐220 variant accounts for a much smaller fraction (2.5 ± 0.9%, Fig. 1E). As a direct consequence, BRAF‐204 is 16 to 41 times more highly expressed than BRAF‐220 (Fig. S2A). The expression levels of BRAF‐220 and BRAF‐204 were also calculated via the custom module of IsoWorm. We confirmed that the expression of BRAF‐204 is 16–42 times greater than that of BRAF‐220 (Fig. 2A). Overall, the BRAF‐204/BRAF‐220 median ratios estimated by the two modules of IsoWorm were highly correlated (Spearman’s correlation coefficient greater than 0.79 for all datasets, except for thyroid cell lines (n = 10), Fig. S2B). This attests to the robustness of the custom module of IsoWorm.
IsoWorm was also used to quantify BRAF transcript variants in 792 tissue samples belonging to 11 cancer types. They were obtained from GEO (acute myeloid leukemia, colorectal cancer, gliomas, lung cancer, melanoma, and prostate cancer) and ICGC (esophageal cancer, kidney cancer, liver cancer, ovarian cancer, and pancreatic cancer) databases.
The GEO datasets were analyzed via both quantification modules of IsoWorm. According to the Salmon module, BRAF‐204 accounts for 53.3 ± 23% of all BRAF transcripts, whereas BRAF‐220 accounts for a smaller fraction (3 ± 1.6%, Fig. 1F). In terms of the BRAF‐204/BRAF‐220 ratio, the expression of BRAF‐204 is 4 to 60 times greater than that of BRAF‐220 (Fig. S3A). Similarly, the custom module of IsoWorm estimates that the expression of BRAF‐204 is 5–75 times greater than that of BRAF‐220 (Fig. 2B, left). The correlation between the calculations is very high (the Spearman’s correlation coefficient of the median ratios is greater than 0.8 for all the datasets, Fig. S3B).
The ICGC datasets were analyzed only with the custom module of IsoWorm. This is because Salmon requires the size of the entire library and the expression level of each transcript, whereas for the ICGC datasets, we could access only the sliced BAM files containing reads from BRAF transcripts. Also, in this case, BRAF‐204 is expressed at a level 6 to 30 times greater than that of BRAF‐220 (Fig. 2B, right).
With FLIBase, we quantified BRAF‐220 (TCONS_00952581) and BRAF‐204 (TCONS_00952571) in tissue samples belonging to the 33 cancer types that compose the TCGA. Following the guidelines described in [ref. 24], we focused on primary tumor samples, for which the annotation of clinical variables is extensive and highly curated (total n = 9219, Table S3). The results reported in Fig. 2C highlight the widespread predominance of BRAF‐204 over BRAF‐220, with a median ratio ranging between 1.5 and 45.
FLIBase allowed us to quantify BRAF‐220, BRAF‐204, and their ratio in normal tissues as well. We analyzed 2599 samples belonging to 22 different tissues at GTEx (Table S4), and we observed that the higher expression levels of BRAF‐204 over BRAF‐220 characterize normal tissues too (the median ratio ranges between 9 and 37, Fig. S4A). Interestingly, the box plots of BRAF‐220 and BRAF‐204 expression levels in both TCGA (cancer, Fig. S5A) and GTEx (normal, Fig. S4B) tissue samples are in agreement with the pie charts in Fig. 1E,F, and they cumulatively indicate that BRAF‐220/BRAF‐204 ratios are dictated by the expression level of the BRAF‐204 variant (in blue), while BRAF‐220 levels, besides being much lower, show less variability across tissues (in red).
We also quantified total BRAF levels. The results are reported in Fig. S2C for the CCLE cell lines, Fig. S3C for the GEO tissue samples, Fig. S5B for the TCGA tissue samples, and Fig. S4C for the GTEx tissue samples. The BRAF‐204/BRAF‐220 ratio does not correlate with the total BRAF level in any of the datasets.
We highlight the extreme case of AML, which is characterized by the lowest BRAF‐204/BRAF‐220 ratio (Fig. 2B,C). This is due to multiple factors, including low expression of BRAF‐204, high expression of BRAF‐220, and high expression of additional transcript variants (Fig. 1F and Fig. S5A). AML even shows samples that are devoid of BRAF‐204 expression (3/81 (4%) in the GEO dataset and 24/150 (16%) in the TCGA dataset). Furthermore, AML is characterized by the highest level of total BRAF (Figs S3C and S5B). Interestingly, these features are shared across other leukemia types such as ALL, CLL, and CML (Fig. S6). Since BRAF mutations have been reported in AML and CLL and are associated with poor prognosis [ref. 25, ref. 26, ref. 27], our findings contribute to light up the interest of the scientific community on BRAF gene in the context of these leukemia subtypes. As soon as RNA‐seq datasets become available, it will be interesting to study BRAF‐204, BRAF‐220, and their ratio also in the context of HCL, a leukemia subtype where the BRAFV600E mutation is present in virtually all cases, it is well established as a driver, and it is extensively used as a target [ref. 28].
The new analysis of the BRAF‐204/BRAF‐220 ratio in TCGA samples slightly differs from our previous analysis [ref. 5], a discrepancy that is ascribable to both biological and technical factors.
At the biological level, we note that the TCGA dataset is constantly curated, which means that the number, identity, stage, and/or subtype of current tissue samples is not the same as those in 2017.
At the technical level, several factors must be considered. First, the strategy for transcript variant quantification from short‐read data inevitably relies on the bulk of variants that are present in repositories at the time of analysis. In reference [ref. 5], we considered the 15 variants that were present in Ensembl (release 80) plus NCBI (GRCh38.p1). Then, we dismissed most of them based on the absence of transcription (no reads on variant‐specific exons or exon–exon junctions). Finally, we established that transcription across the splicing site located in exon 18 was distinctive between the ref variant and the X1/X2 variants. Therefore, we quantified BRAF‐ref by counting the reads that spanned this splicing site. However, among the BRAF variants that compose current databases, many share the same splicing site and show some degree of transcription. For example, among the 21 BRAF variants that are currently present in Ensembl (release 113, Fig. S1A), 10 share that splicing site with BRAF‐220 and are transcribed (see Fig. 1E,F and Fig. S6A). Therefore, we conclude that in [ref. 5] BRAF‐ref levels might have been overestimated. Conversely, we note that the quantification through IsoWorm that we describe in this article might suffer from the opposite bias, that is, underestimation of BRAF‐220 levels. As mentioned above, the current annotation of ENST00000646891.2/BRAF‐220 presents a much longer 3’UTR than the one we considered in 2017 (~ 100 nt vs. ~ 3.9 kb). The longer 3’UTR allowed us to select a variant‐specific region for BRAF‐220 identification and quantification (most downstream ~ 1 kb). However, this comes at the price of underestimation of expression levels if there are no reads that map to the UTR until the very 3′ end. To address this issue, we resorted to a publicly available dataset in which a QuantSeq 3′ mRNA library was built to produce fragments close to the 3′ end of polyA sites on RNA extracted from 97 lung cancer patients [ref. 13]. Specifically, we inferred the sizes of the BRAF‐220 and BRAF‐204 3’UTRs by retrieving the positions of the polyA sites. According to our analysis, the BRAF‐204 3’UTR contains 1 polyA site, which is present in all 97 samples and is located at the end of ~ 7 kb (chr7: 140726516–140719327) (Fig. 2D, in blue). This experimental evidence matches our previous findings [ref. 5] and confirms that BRAF‐204 mRNA is consistently expressed with a very long, homogeneously transcribed 3’UTR. Conversely, the BRAF‐220 3’UTR contains two polyA sites. The first one is located ~ 400 nt downstream of the stop codon (chr7:140734531–140734607), and it is present in 81 out of 97 samples. The second one is located ~ 3.6 kb downstream of the stop codon (chr7:140731035–140731126), and it is present in 88 out of 97 samples. Interestingly, the short and long 3’UTRs are coexpressed in most samples (77 out of 97) (Fig. 2D, in red). These results indicate that the long version of the BRAF‐220 3’UTR is indeed expressed and should be selected for normalization of variant levels. However, these and previous analyses [ref. 5] also indicate that the size of the BRAF‐204 3’UTR is highly variable, both within and across samples. Therefore, the choice of the long 3’UTR is inherently linked with a certain degree of underestimation.
In addition, the precomputed quantification of BRAF‐204 and BRAF‐220 produced through FLIBase on TCGA tissue samples combines the results of short‐ and long‐read sequencing, whereas the quantification we performed in [ref. 5] was uniquely based on short reads.
In conclusion, precise quantification of transcript variants via RNA‐seq remains problematic despite the efforts of the bioinformatics community in developing increasingly sophisticated methods. The use of short‐read and bulk sequencing presents inherent technical limitations and results in very divergent estimations [ref. 10]. Nonetheless, the technical and biological aspects described above prompt us to consider the quantification of BRAF variants presented here (BRAF‐204 is the predominant transcript variant in human cancer) as more accurate than the quantification presented in [ref. 5].
The BRAF‐204/BRAF‐220 ratio has prognostic value in KIRP
We assessed whether the BRAF‐204/BRAF‐220 ratio has an impact on patient prognosis via the quantification of TCONS_00952571/BRAF‐204 and TCONS_00952581/BRAF‐220 in TCGA samples, as reported in FLIBase. We selected 11 cancer types that are characterized by the highest frequency of BRAF alterations [ref. 16]. Five of them present BRAF mutations in more than 4% of the samples (COAD, LUAD, SKCM, THCA, and UCEC), whereas six present BRAF copy number variations in more than 60% of the samples (ACC, ESCA, GBM, KIRP, OV, and TGCT). For each of these 11 cancer types, we evaluated the association between the BRAF‐204/BRAF‐220 ratio and patient prognosis (Table S1).
According to univariate Cox proportional hazards regression analysis, the BRAF‐204/BRAF‐220 ratio impacts overall survival in KIRP‐kidney renal papillary cell carcinoma patients. Specifically, 250 patients were analyzed (Table S5), and patients in Group 3 (highest ratios, > 66th percentile (3Q)) have an increased risk of worse outcomes compared to patients in Group 1 (lowest ratios, ≤ 33rd percentile (1Q)). As reported in Table S1 and Fig. 2E, left, the hazard ratio (HR) is > 3.
We then calculated the HR for prognostic factors that are already known to increase the risk of worse outcomes in KIRP patients, namely, the size and extent of the primary tumor (T3‐T4/T1‐T2), the involvement of regional lymph nodes (N1–N2/N0), the presence of distant metastases (M1/M0), and the overall tumor stage (TNM I, II, III–IV) [ref. 29]. As expected, we obtained HR values higher than 1 for all of them (Fig. 2E, left).
Next, we performed a multivariate Cox proportional hazards regression analysis, considering all the above‐mentioned prognostic variables at the same time. As shown in Fig. 2E, right, a high BRAF‐204/BRAF‐220 ratio is still associated with poor survival (HR > 4). Therefore, we can conclude that in KIRP the ratio of BRAF variants is an independent prognostic factor of worse outcome.
In addition, we assessed whether having a higher BRAF‐204/BRAF‐220 ratio increases the probability of being in a higher KIRP stage. To this end, we performed a proportional odds logistic regression (POLR) for ordered category outcome analysis. We used stage I as a reference and considered tumor stage as the response variable (I < II < III–IV). Consistent with the hazard regression analyses, we obtained an odds ratio of 2.27 for Group 3, which means that KIRP patients with the highest ratios have higher odds of having a more advanced tumor stage than patients with the lowest ratios (Fig. 2F).
Finally, since KIRP is one of the six cancer types with BRAF copy number variations in more than 60% of samples, we tested whether there is a correlation between copy number status (i.e., 0, 1, 2, 3) and the BRAF‐204/BRAF‐220 ratio, but we did not find it (Spearman’s rho −0.09, P < 0.14).
To date, several molecular biomarkers have been proposed to improve the prediction of drug responsiveness and disease outcome in KIRP (see, for example, [ref. 30, ref. 31, ref. 32, ref. 33, ref. 34]), but the role of BRAF has just begun to be explored [ref. 16]. Crucially, our findings reveal that high BRAF‐204/BRAF‐220 ratios distinguish patients with worse outcomes. They also spur to fill a gap in public repositories, since we lack an independent KIRP cohort suitable for validating the prognostic value of proposed biomarkers.
As mentioned in the Introduction, we have previously identified 20 microRNAs that bind to BRAF‐204 3’UTR, modulating its expression and, consequently, the output of the ERK signaling pathway [ref. 7]. These miRNAs are variant‐specific, that is, they are different from those that target BRAF‐220 3’UTR (see, e.g., the list of experimentally validated miRNA reported in https://awi.cuhk.edu.cn/~miRTarBase/miRTarBase_2025/php/index.php). This indicates that the two transcripts are involved in distinct miRNA‐centered regulatory networks. To formulate a hypothesis that might explain the association between high BRAF‐204 levels and bad prognosis in KIRP, we investigated whether BRAF‐204 works as ceRNA, that is, whether it sustains the expression of another oncogene by sponging an oncosuppressive miRNA [ref. 35]. Thanks to the availability of the miRNome at TCGA, we performed a rank correlation analysis between the BRAF‐204 transcript and KIRP miRNAs. Then, we focused on the previously identified BRAF‐204‐targeting miRNAs. Among those expressed in KIRP, we found two that present a significant negative correlation with BRAF‐204: miR‐3651 and miR‐423‐5p (Table S6 and Fig. S7A,B). We also performed a rank correlation analysis between the BRAF‐204 transcript and the other KIRP transcripts. Then, we focused on the experimentally validated targets of miR‐423 that are listed in MiRTarBase [ref. 36] (aside from BRAF‐204, no other experimentally validated targets are currently reported for miR‐3651). Among miR‐423 targets expressed in KIRP, we found that ENSG00000140992/PDPK1 [ref. 37] presents a significant positive correlation with BRAF‐204 and a significant negative correlation with miR‐423 (Table S7 and Fig. S7C,D). miR‐423 is a well‐studied tumor suppressive miRNA involved in several ceRNA networks [ref. 37, ref. 38, ref. 39, ref. 40, ref. 41, ref. 42, ref. 43]. On the other hand, PDPK1 is one of the most crucial kinases of the highly oncogenic PI3K/AKT pathway, as it is responsible for AKT activation by phosphorylation at Thr308 [ref. 44]. Therefore, this ceRNA network suggests that BRAF‐204 and PDPK1 promote oncogenesis by sponging miR‐423. It is worth mentioning that, besides providing a working hypothesis for further investigations on the role played by BRAF‐204, PDPK1, and miR‐423 in KIRP, this regulatory network entails that the intricate cross‐talk between the ERK and the PI3K/AKT oncogenic pathways [ref. 45] does not involve only proteins and might extend to transcripts (Fig. 2G).
Contrary to KIRP, we found no impact of the BRAF‐204/BRAF‐220 ratio on THCA or SKCM, that is, the cancer types characterized by the highest percentage of patients carrying BRAF mutations. However, given the availability of larger datasets, it might be interesting to assess whether the ratio has prognostic value in the BRAFV600E‐negative subgroup, whereas the presence of the mutant protein takes over in the BRAFV600E‐positive subgroup.
In more general terms, the results we obtained in KIRP underscore the importance of going beyond the study of the aberrant activity of the mutant kinase and of including the study of the expression of the BRAF gene.
Conclusions
Quantifying full‐length transcript variants from sequencing data poses significant challenges from both technical and biological points of view [ref. 10]. The case of BRAF is particularly complex because the variants reported in databases are many, very similar, and rapidly changing, and because their length varies within and across samples due to the use of alternative polyA sites. To tackle this issue, we built the bioinformatic pipeline IsoWorm, which implements two methods for variant identification and quantification. IsoWorm was used to quantify BRAF transcripts in 690 cell lines belonging to 12 cancer types and 1020 tissue samples belonging to 14 cancer types. Thanks to FLIBase, we also reanalyzed TCGA data, which included 9219 tissue samples belonging to 33 cancer types. Through the combined use of multiple computational approaches, we establish that in human cancer BRAF is a mix of two full‐length, protein‐coding, and biologically relevant isoforms, namely, BRAF‐220 and BRAF‐204. Crucially, BRAF‐204 mRNA is predominant over BRAF‐220 mRNA, and in solid cancers, it also stands as the most expressed among all BRAF transcript variants. Conversely, leukemia samples are characterized by a variegated expression of multiple BRAF transcript variants. The imbalance against BRAF‐220 is much less pronounced, and a fraction of samples are devoid of BRAF‐204.
We also show that the BRAF‐204/BRAF‐220 ratio impacts patient survival. Specifically, in KIRP, the prognosis of patients with extreme BRAF‐204/BRAF‐220 ratios is worse. Although the study of BRAF and its transcript variants in this cancer type is still in its infancy, we propose that the BRAF‐204 transcript might sustain not only the ERK pathway but also the PI3K/AKT pathway by sponging the oncosuppressive miR‐423 and relieving its targeting of PDPK1.
Historically, BRAF‐220 has been considered the only BRAF isoform and has represented the undivided focus of in vitro and in vivo model systems [ref. 46, ref. 47]. Conversely, the in silico analyses presented here, together with the experimental characterization described by us and others in [ref. 4, ref. 5, ref. 6, ref. 7, ref. 8, ref. 9, ref. 17, ref. 18, ref. 19, ref. 48], introduce a paradigm shift in BRAF‐centered studies [ref. 49], prompting us to consider BRAF‐204 as ‘the real’ BRAF. They also provide the rationale for benchmarking BRAF‐204 against BRAF‐220. Similarities and differences should be systematically investigated at multiple levels. From a basic research point of view, we must deepen our knowledge of the mechanisms that regulate isoform expression and functioning. In addition, translational research can benefit from the analysis of the two isoforms in terms of sensitivity and intrinsic/acquired resistance to drugs. Besides the targeting of the mutant BRAFV600E kinase and the aberrantly active ERK pathway, we should evaluate whether it is beneficial to concomitantly target kinase‐independent and/or coding‐independent activities that BRAF‐204 and BRAF‐220 isoforms might have. Finally, the BRAF‐204/BRAF‐220 ratio can support clinicians in the choice of therapeutic regimens and the management of relapse [ref. 50].
Conflict of interest
The authors declare no conflict of interest.
Author contributions
RDA and LP conceived the project. MSP, RDA, and LP designed the analyses. MSP, DT, and GM analyzed the data. AM, RDA, and LP supervised the research. All the authors wrote, discussed, and approved the manuscript.
Peer review
The peer review history for this article is available at https://www.webofscience.com/api/gateway/wos/peer‐review/10.1002/1878‐0261.70043.
Supplementary Materials
- Fig. S1. Related to Fig. 1. The 21 BRAF transcripts deposited in Ensembl (release 113) and variant‐specific regions used by the custom module of IsoWorm for BRAF‐204 and BRAF‐220 quantification. Fig. S2. Related to Fig. 2. BRAF‐204/BRAF‐220 ratio and total BRAF levels in CCLE cell lines (n = 690, 12 cancer types). Fig. S3. Related to Fig. 2. BRAF‐204/BRAF‐220 ratio and total BRAF levels in GEO tissue samples (n = 534, 6 cancer types). Fig. S4. Related to Fig. 2. Box plots of BRAF‐204/BRAF‐220 ratio, BRAF‐220, BRAF‐204, and total BRAF levels in the normal tissue samples that compose the GTEx (n = 2599 samples, 22 normal tissues). Fig. S5. Related to Fig. 2. Box plots of BRAF‐220, BRAF‐204, and total BRAF levels in the cancer tissue samples that compose the TCGA (n = 9219 samples, 33 cancer types). Fig. S6. Related to Fig. 2. BRAF‐204 transcript variant is highly expressed across 4 leukemia types. Fig. S7. Related to Fig. 2. Spearman correlation of BRAF‐204 with miR‐3651, miR‐423, and PDPK1 in the KIRP dataset at TCGA (n = 290). (PDF)
- Table S1. Univariate Cox proportional hazards regression on 11 TCGA cancer types. (PDF)
- Table S2. Brant Wald test on the proportional odds logistic regression for ordered category outcomes analysis performed on 250 KIRP patients. (PDF)
- Table S3. TCGA cancer tissue samples (primary tumors). (PDF)
- Table S4. GTEx normal tissue samples. (PDF)
- Table S5. Baseline characteristics of the 250 KIRP patients used for hazards regression analyses. (PDF)
- Table S6. Correlation of BRAF‐204 with targeting miRNAs that are expressed in the KIRP dataset at TCGA. (PDF)
- Table S7. Correlation of BRAF‐204 and miR‐423 with the experimentally validated targets of the miRNA that are expressed in the KIRP dataset at TCGA. (PDF)
References
- Clinical development of BRAF plus MEK inhibitor combinations.. Trends Cancer., 2020. [PubMed]
- RNA‐biology ruling cancer progression? Focus on 3′UTRs and splicing.. Cancer Metastasis Rev., 2020. [PubMed]
- The landscape of isoform switches in human cancers.. Mol Cancer Res., 2017. [PubMed]
- Identification of BRAF 3’UTR isoforms in melanoma.. J Invest Dermatol., 2015. [PubMed]
- The landscape of BRAF transcript and protein variants in human cancer.. Mol Cancer., 2017. [DOI | PubMed]
- Differential impact of BRAFV600E isoforms on tumorigenesis in a zebrafish model of melanoma.. Cell Biosci., 2023. [PubMed]
- Systematic evaluation of the microRNAome through miR‐CATCHv2.0 identifies positive and negative regulators of BRAF‐X1 mRNA.. RNA Biol., 2019. [DOI | PubMed]
- PARP1 negatively regulates MAPK signaling by impairing BRAF‐X1 translation.. J Hematol Oncol., 2023. [PubMed]
- Development of a yeast‐based system to identify new hBRAFV600E functional interactors.. Oncogene., 2019. [DOI | PubMed]
- Comparative evaluation of full‐length isoform quantification from RNA‐seq.. BMC Bioinformatics., 2021. [PubMed]
- Nanopore sequencing data analysis: state of the art, applications and challenges.. Brief Bioinform., 2017. [DOI]
- Method of the year: long‐read sequencing.. Nat Methods., 2023. [PubMed]
- A comprehensive map of alternative polyadenylation in African American and European American lung cancer patients.. Nat Commun., 2021. [PubMed]
- QuantSeq. 3′ sequencing combined with Salmon provides a fast, reliable approach for high throughput RNA expression analysis.. Sci Rep., 2019. [PubMed]
- FLIBase: a comprehensive repository of full‐length isoforms across human cancers and tissues.. Nucleic Acids Res., 2024. [PubMed]
- Spectrum of BRAF aberrations and its potential clinical implications: insights from integrative Pan‐cancer analysis.. Front Bioeng Biotechnol., 2022. [PubMed]
- Genomic deletions explain the generation of alternative BRAF isoforms conferring resistance to MAPK inhibitors in melanoma.. Cell Rep., 2024. [PubMed]
- Whole‐genome landscapes of major melanoma subtypes.. Nature., 2017. [PubMed]
- BRAF(V600E) kinase domain duplication identified in therapy‐refractory melanoma patient‐derived xenografts.. Cell Rep., 2016. [PubMed]
- A joint NCBI and EMBL‐EBI transcript set for clinical genomics and research.. Nature., 2022. [PubMed]
- APPRIS: selecting functionally important isoforms.. Nucleic Acids Res., 2022. [PubMed]
- Salmon provides fast and bias‐aware quantification of transcript expression.. Nat Methods., 2017. [PubMed]
- TPM, FPKM, or normalized counts? A comparative study of quantification measures for the analysis of RNA‐seq data from the NCI patient‐derived models repository.. J Transl Med., 2021. [PubMed]
- An integrated TCGA Pan‐cancer clinical data resource to drive high‐quality survival outcome analytics.. Cell., 2018. [PubMed]
- BRAF mutations in patients with myeloid neoplasms: a cancer center multigene next‐generation sequencing analysis experience.. Int J Mol Sci., 2024. [PubMed]
- Mutations in the RAS‐BRAF‐MAPK‐ERK pathway define a specific subgroup of patients with adverse clinical features and provide new therapeutic options in chronic lymphocytic leukemia.. Haematologica., 2019. [PubMed]
- KRAS, NRAS, and BRAF mutations are highly enriched in trisomy 12 chronic lymphocytic leukemia and are associated with shorter treatment‐free survival.. Leukemia., 2019. [PubMed]
- Hairy‐cell leukemia.. N Engl J Med., 2024. [PubMed]
- Survival prediction of kidney renal papillary cell carcinoma by comprehensive LncRNA characterization.. Oncotarget., 2017. [PubMed]
- Identification of prognostic stemness‐related genes in kidney renal papillary cell carcinoma.. BMC Med Genomics., 2024. [PubMed]
- Designing a predictive framework: immune‐related gene‐based nomogram and prognostic model for kidney renal papillary cell carcinoma.. Int Immunopharmacol., 2024. [PubMed]
- Construction and validation of a mutation‐related model in papillary renal cell carcinoma and associated immune infiltration.. Kidney Blood Press Res., 2024. [DOI | PubMed]
- Comprehensive molecular analyses and experimental validation of CDCAs with potential implications in kidney renal papillary cell carcinoma prognosis.. Heliyon., 2024. [PubMed]
- Bioinformatics analysis highlights CCNB1 as a potential prognostic biomarker and an anti‐kidney renal papillary cell carcinoma drug target.. Medicine., 2024. [PubMed]
- A ceRNA hypothesis: the Rosetta stone of a hidden RNA language?. Cell., 2011. [PubMed]
- miRTarBase 2025: updates to the collection of experimentally validated microRNA–target interactions.. Nucleic Acids Res., 2025. [PubMed]
- Hsa_circ_0000081 promotes the function of gastric cancer through sponging hsa‐miR‐423‐5p to influence 3‐phosphoinositide‐dependent kinase 1 expression.. Bioengineered., 2022. [PubMed]
- Circular RNA FOXP1 induced by ZNF263 upregulates U2AF2 expression to accelerate renal cell carcinoma tumorigenesis and Warburg effect through sponging miR‐423‐5p.. J Immunol Res., 2021
- Activating transcription factor 3‐activated long noncoding RNA forkhead box P4‐antisense RNA 1 aggravates colorectal cancer progression by regulating microRNA‐423‐5p/nucleus accumbens associated 1 axis.. Bioengineered., 2022. [PubMed]
- Circ_0001821 affects proliferation and the cell cycle in esophageal squamous cell carcinoma by elevating BTRC‐mediated IKBA ubiquitination.. Mol Cancer Res., 2022. [PubMed]
- The lncRNA TERC promotes gastric cancer cell proliferation, migration, and invasion by sponging miR‐423‐5p to regulate SOX12 expression.. Ann Transl Med., 2022. [PubMed]
- Long non‐coding RNA LINC00680 functions as a ceRNA to promote esophageal squamous cell carcinoma progression through the miR‐423‐5p/PAK6 axis.. Mol Cancer., 2022. [PubMed]
- ALKB homolog 5 (ALKBH5)‐induced circPUM1 upregulation facilitated the progression of neuroblastoma via miR‐423–5p/PA2G4 axis.. Pathol Res Pract., 2023. [PubMed]
- Master kinase PDK1 in tumorigenesis.. Biochim Biophys Acta Rev Cancer., 2023. [PubMed]
- AKT and ERK dual inhibitors: the way forward?. Cancer Lett., 2019. [PubMed]
- New perspectives for targeting RAF kinase in human cancer.. Nat Rev Cancer., 2017. [PubMed]
- Melanoma models for the next generation of therapies.. Cancer Cell., 2021. [PubMed]
- Modified Cas9‐guided Oxford nanopore technology sequencing uncovers single and multiple transgene insertion sites in a zebrafish melanoma model.. CRISPR J., 2023. [PubMed]
- Harnessing the predictive power of preclinical models for oncology drug development.. Nat Rev Drug Discov., 2022. [PubMed]
- The evolution of BRAF‐targeted therapies in melanoma: overcoming hurdles and unleashing novel strategies.. Front Oncol., 2024. [PubMed]