
Influence of Compression Molding Process Parameters in Mechanical and Tribological Behavior of Hybrid Polymer Matrix Composites
Abstract
In recent days, natural fibers are extremely influential in numerous applications such as automobile body building, boat construction, civil structure, and packing goods. Intensification of the properties of natural fibers is achieved by blending different natural fibers with resin in a proper mixing ratio. This investigation aims to synthesize a hybrid polymer matrix composite with the use of natural fibers of flax and loops of hemp in the epoxy matrix. The synthesized composites were characterized in terms of tribological and mechanical properties. The Taguchi L16 orthogonal array is employed in the preparation of composite samples as well as analysis and optimization of the synthesis parameters. The optimization of compression molding process parameters has enhanced the results of this investigation. The parameters chosen are percentage of reinforcement (20%, 30%, 40%, and 50%), molding temperature (150 °C, 160 °C, 170 °C, and 180 °C), molding pressure (1 MPa, 2 MPa, 3 MPa, and 4 MPa), and curing time (20 min, 25 min, 30 min, and 35 min). From the analysis, it was observed that the percentage of reinforcement is contributing more to altering the fatigue strength, and the curing time is influenced in the impact and wear analysis.
Article type: Research Article
Keywords: natural fiber, curing time, wear, fatigue, Taguchi, epoxy
Affiliations: Department of Mechanical Engineering, Saveetha School of Engineering, Saveetha Institute of Medical and Technical Sciences, Chennai 602105, India; Centre for Materials Engineering and Regenerative Medicine, Bharath Institute of Higher Education and Research, Chennai 600073, India; mohanavel2k16@gmail.com (V.M.); palanivelvelmurugan@bharathuniv.ac.in (P.V.); Department of Mechanical Engineering, Vel Tech Rangarajan Dr. Sakunthala R&D Institute of Science and Technology, Chennai 600062, India; rajasd28@gmail.com; Faculty of Science, Universiti Tunku Abdul Rahman, Kampar 31900, Malaysia; Department of Physiology, College of Medicine and King Khalid University Hospital, King Saud University, Medical City, P.O. Box 2925, Riyadh 11461, Saudi Arabia; onasif@ksu.edu.sa; Zoology Department, College of Science, King Saud University, Riyadh 11451, Saudi Arabia; salfarraj@hotmail.com; Faculty of Health and Life Sciences, INTI International University, Nilai 71800, Malaysia; lingshing.wong@newinti.edu.my; Division of Biotechnology, College of Environmental & Bioresource Sciences, Jeonbuk National University, Iksan 570752, Korea; mani.env2014@gmail.com; Department of Mechanical Engineering, K. Ramakrishnan College of Engineering, Trichy 621112, India; smravichandran@hotmail.com
License: © 2021 by the authors. CC BY 4.0 Licensee MDPI, Basel, Switzerland. This article is an open access article distributed under the terms and conditions of the Creative Commons Attribution (CC BY) license (https://creativecommons.org/licenses/by/4.0/).
Article links: DOI: 10.3390/polym13234195 | PubMed: 34883698 | PMC: PMC8659549
Relevance: Relevant: mentioned in keywords or abstract
Full text: PDF (11.1 MB)
1. Introduction
Embryonic natural fiber is increasing in demand in the all-industrial sectors due to its cost and usage; natural fibers possess rich mechanical properties and thermal properties. Most of the natural fibers are frequently used in automobile sectors instead of steel, giving more strength to the vehicle structure. Improving mileage attentiveness in luxury vehicles is considered of prime importance in vehicle body construction; it offers lightweight construction [ref. 1,ref. 2,ref. 3]. The fibers are improving the strength as well as stiffness of the composites. Using the polymer matrix, comprising a selection of appropriate fiber, binding materials, etc., can build up the sufficient strength for the specific applications, amplify their toughness, improve their corrosion resistance in addition to heat. The fabrication of hybrid composites creates problems in the blending of fibers with resin at the time of fabrication [ref. 4,ref. 5,ref. 6]. Based on the polymer matrix, the fiber-reinforced composites are classified as thermoset or thermoplastic. Most of the polymers matrixes’ composites are produced by using thermoset plastics, but some limitations are found such as it is brittle, takes a long time cycle for curing, and it is difficult to reshape the damaged parts [ref. 7,ref. 8,ref. 9,ref. 10]. Thermoplastic materials are widely preferred as they are reliable, highly chemical resistant, and exhibit a good strain rate [ref. 11]. Among all thermoplastics, polypropylene (PP) is highly preferred as it is available, accessible, cheap, and exhibits appreciable tribological and mechanical properties [ref. 12]. Mostly, the composites are prepared to utilize the hand layup technique to obtain a uniform surface level of the composites. Hybrid composites are prepared with constant content of (15 wt %) banana fiber and by varying groundnut shell ash to modify the strengths [ref. 13]. From the prepared composites, the author conducted the mechanical tests namely tensile, hardness, impact, and compression test [ref. 14,ref. 15,ref. 16]. It was found from that investigation that the mechanical properties are improved by reinforced groundnut shell ash into the banana fiber with epoxy resin [ref. 17]. Normally, the coir fibers are widely available worldwide and compatible with other fibers. Many of the researchers enhanced the mechanical properties of composite materials with blended coir fiber and banana fiber [ref. 18,ref. 19,ref. 20]. Some investigations introduced pineapple leaf fibers into the coir fiber. Applying to the compression molding process the fibers of sisal, banana with epoxy are formed as a polymer matrix composite [ref. 21]. Improved mechanical properties are obtained by using gray relational analysis; researchers reported two different composites that registered excellent mechanical strength [ref. 22]. Optimized parameters combinations from seventh runs are 10 wt % of sisal, 15 wt % of banana, 8 wt % of NaOH, molding pressure of 10 MPa, and maintained temperature of 100 °C. Similar parameters were found in the fourteenth runs, such as 20 wt % sisal, 10 wt % banana, 5 wt % NaOH, molding pressure of 10 MPa, and 120 °C temperature [ref. 23,ref. 24,ref. 25].
This research aims to synthesize a flax and hemp fibers-based hybrid polymer matrix composite samples with the use of epoxy resin based on a Taguchi L16 type design of experiments for automobile bodybuilding application. Furthermore, the mechanical (fatigue and impact strengths) and tribological (wear) properties are analyzed on synthesized hybrid polymer matrix composites samples [ref. 26,ref. 27].
2. Materials and Methods
In this experimental investigation, natural fiber such as flax and hemp fiber are used; the flax fiber is also named linen, and it is naturally very strong. The hemp fiber is commonly used for the production of clothing, shoes, paper, rope fabrication, and making insulation material. Different types of resins are available in the market; compared to all resins epoxy resin, they provided high strength to the polymer composites [ref. 28]. One kg of fibers, such as flax and hemp fibers, were purchased from GO GREEN PRODUCTS, Chennai, India. Similarly, one liter of epoxy resin was procured from Petrocoat Speciality Chemicals Private Limited, Chennai, India.
For this experimental work, polymer matrix hybrid composites are prepared through a compression molding process with predefined combinations (Table 2) of synthesizing parameters as per [ref. 29]. Compression molding process parameters are selected as a percentage of reinforcement, molding temperature, molding pressure, and curing time. The Taguchi statistical approach is implemented in this work to maximize and minimize the strength and tribological properties of the hybrid composites, respectively [ref. 30,ref. 31,ref. 32].
3. Experimental Procedure
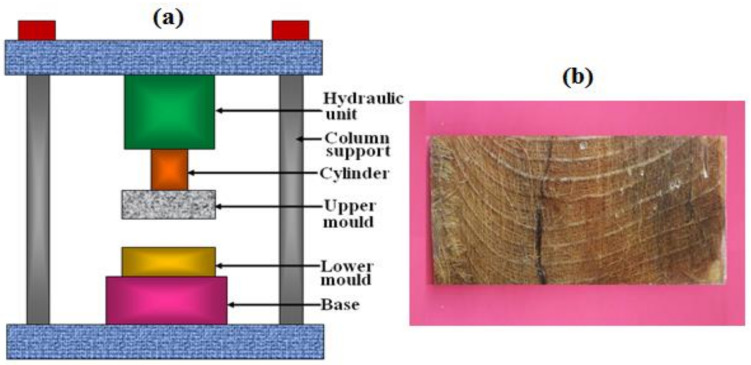
In this investigation, we preferred the compression molding technique to prepare the hybrid polymer matrix composites (flax/hemp/epoxy) utilizing a compression molding machine (Figure 1). Figure 1a illustrates the schematic view of the compression molding machine, and Figure 1b represents the hybrid polymer matrix composites after compression molding.
Initially, all the fibers are cleaned well by distilled water washing for removing impurities. The water wash was repeated 3 to 5 times. Furthermore, the fibers are dipped into the potassium hydroxide (KOH) solution; the solution is prepared by different percentage levels of KOH diluted in distilled water [ref. 33]. The alkali solution is stirred at 20 min once for 5 h; finally, the completion of alkali treatment of the fibers is dried well in a hot oven for 240 min at 80 °C. After drying both fibers, the flax and hemp fiber is cut into 10 mm length uniformly. The fabrication of both fibers such as flax and hemp fiber with epoxy resin in the compression molding is achieved by the dimensions of 350 × 350 × 5 mm [ref. 34,ref. 35,ref. 36]. The predefined weight percentages (20%, 30%, 40% and 60%) were shared equally for both fibers. For example, for the 20 wt % fiber case, there was 10% hemp fiber and 10% flax fiber. Hence, the predefined quantity of fibers placed on the steel mold fitted in the compression molding machine. Epoxy resin is poured into the fibers with the required level; further, the hydraulic machine has functioned with the selected parameters. The parameters and the levels are presented in Table 1.
Table 1: Process parameters and their levels of compression molding.
| S. No | Parameters | Level 1 | Level 2 | Level 3 | Levels 4 |
|---|---|---|---|---|---|
| 1. | % of reinforcement | 20 | 30 | 40 | 50 |
| 2. | Molding temperature (°C) | 150 | 160 | 170 | 180 |
| 3. | Molding pressure (MPa) | 1 | 2 | 3 | 4 |
| 4. | Curing time (min) | 20 | 25 | 30 | 35 |
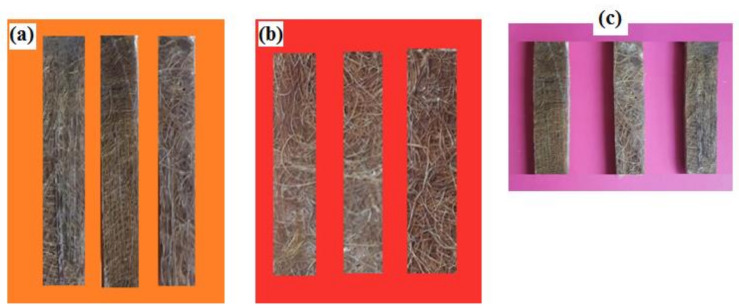
After conducting the compression molding process, the raw polymer hybrid plate is removed from the machine and samples were prepared to test fatigue strength, impact strength, and wear resistance [ref. 37,ref. 38]. The ASTM standard of ASTM D3479 for fatigue test, ASTM D 256 for impact test, and ASTM G-99 for wear test were maintained at the time of sample preparation. Figure 2 illustrates the fatigue, impact, and wear test specimens. The dimensional scale of the fatigue test specimen is 150 × 20 × 5 mm; similarly, the scale of the impact and wear test specimens are 55 × 20 × 5 mm and 35 × 15 × 5 mm, respectively. The fatigue test is carried out with the stress ratio of −2, amplitude of 7 kN, and frequency of 8 Hz. In the dry sliding wear test, the sliding speed of 2 m/s, sliding distance of 1500 m, and applied load of 30 N is maintained. Taguchi analysis is included to maximize the strength of the composites.
4. Results and Discussion
The hybrid polymer composites samples were prepared to utilize compression molding techniques and test the mechanical and tribological properties. The observations are consolidated and presented in Table 2. Mechanical strength such as fatigue life and impact strength was evaluated by applying the Taguchi approach. The maximum fatigue life cycle was obtained as 7648 Nf with the influence of 50% of reinforcement, 150 °C of molding temperature, 4 MPa of molding pressure, and 25 min of curing time. Similarly, the maximum impact strength was recorded as 33.13 kJ/m2 by the influence of 50% of reinforcement, 170 °C of molding temperature, 2 MPa of molding pressure, and 35 min of curing time.
Table 2: Summary of compression molding and mechanical strength analysis.
| Exp.Runs | % of Reinforcement | Molding Temperature (°C) | Molding Pressure (MPa) | Curing Time (min) | Fatigue Life (Nf) | Impact (kJ/m2) | Wear (µm) |
|---|---|---|---|---|---|---|---|
| 1 | 20 | 150 | 1 | 20 | 3057 | 17.39 | 31 |
| 2 | 20 | 160 | 2 | 25 | 4319 | 21.71 | 40 |
| 3 | 20 | 170 | 3 | 30 | 6321 | 23.83 | 42 |
| 4 | 20 | 180 | 4 | 35 | 5347 | 31.73 | 48 |
| 5 | 30 | 150 | 2 | 30 | 4328 | 22.62 | 41 |
| 6 | 30 | 160 | 1 | 35 | 5945 | 28.93 | 47 |
| 7 | 30 | 170 | 4 | 20 | 4128 | 19.21 | 37 |
| 8 | 30 | 180 | 3 | 25 | 6875 | 27.43 | 45 |
| 9 | 40 | 150 | 3 | 35 | 7123 | 30.03 | 43 |
| 10 | 40 | 160 | 4 | 30 | 6851 | 29.15 | 47 |
| 11 | 40 | 170 | 1 | 25 | 5398 | 24.27 | 42 |
| 12 | 40 | 180 | 2 | 20 | 7125 | 21.36 | 39 |
| 13 | 50 | 150 | 4 | 25 | 7648 | 27.52 | 46 |
| 14 | 50 | 160 | 3 | 20 | 5984 | 20.30 | 38 |
| 15 | 50 | 170 | 2 | 35 | 7328 | 33.13 | 51 |
| 16 | 50 | 180 | 1 | 30 | 6258 | 28.73 | 47 |
Contrary, the minimum wear was registered as 31 µm with an influence of 20% of reinforcement, 150 °C of molding temperature, 1 MPa of molding pressure, and 20 min of curing time.
4.1. Fatigue Life Analysis
Table 3 and Table 4 show the results of Taguchi analysis for the response of fatigue life test in terms of means and S/N ratios, respectively. Table 3 and Table 4 are ranking the fabrication parameters as per their influence on fatigue life. The rank order indicates the influencing parameters from high to low on fatigue life. From this analysis, it is concluded that the percentage of reinforcement is a highly influential parameter followed by molding pressure, curing time, and molding temperature. Optimal parameters of the fatigue test have occurred at 50% of reinforcement, 180 °C of molding temperature, 3 MPa of molding pressure, and 30 min of curing time. An increasing percentage of fibers mixed homogeneously increases the fatigue life of the composites due to their denser blending.
Table 3: Response table for means (fatigue life).
| Level | % of Reinforcement | Molding Temperature (°C) | Molding Pressure (MPa) | Curing Time (min) |
|---|---|---|---|---|
| 1 | 4761 | 5539 | 5165 | 5074 |
| 2 | 5319 | 5775 | 5775 | 6060 |
| 3 | 6624 | 5794 | 6576 | 5940 |
| 4 | 6805 | 6401 | 5994 | 6436 |
| Delta | 2044 | 862 | 1411 | 1362 |
| Rank | 1 | 4 | 2 | 3 |
Table 4: Response table for signal to noise ratios (fatigue life).
| Level | % of Reinforcement | Molding Temperature (°C) | Molding Pressure (MPa) | Curing Time (min) |
|---|---|---|---|---|
| 1 | 73.25 | 74.29 | 73.94 | 73.65 |
| 2 | 74.32 | 75.11 | 74.95 | 75.44 |
| 3 | 76.37 | 75.07 | 76.34 | 75.35 |
| 4 | 76.61 | 76.07 | 75.32 | 76.10 |
| Delta | 3.36 | 1.78 | 2.40 | 2.45 |
| Rank | 1 | 4 | 3 | 2 |
The influencing of synthesizing parameters on fatigue life is depicted in the main effects plots (Means and S/N ratio), as shown in Figure 3 and Figure 4. It is understood from Figure 3 and Figure 4 that the increase in reinforcement percentage increases the fatigue life, 50% of reinforcement was recorded as the maximum fatigue strength. Similarly, the steadily increasing molding temperature increased the fatigue life; 180 °C of molding temperature produced higher fatigue life. Molding pressure increases from 1 to 3 MPa increased the fatigue life, 3 MPa of molding pressure offered the extreme fatigue life of the composites, and it was noticed that the increase in molding pressure decreases the fatigue life. In curing time consideration, the increase in curing time also increases the fatigue life, the maximum fatigue life was registered by 35 min of curing time.
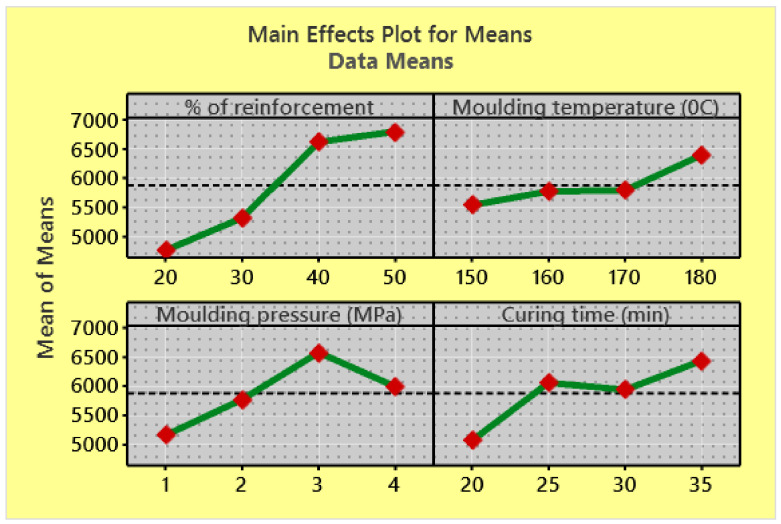
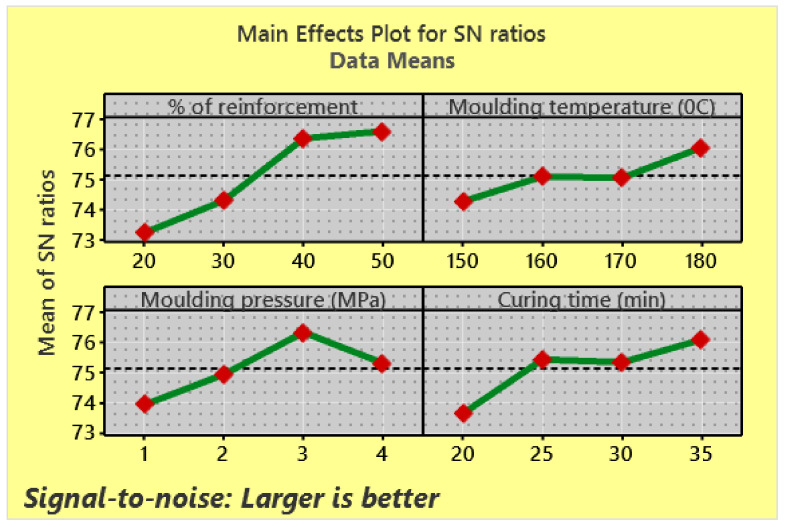
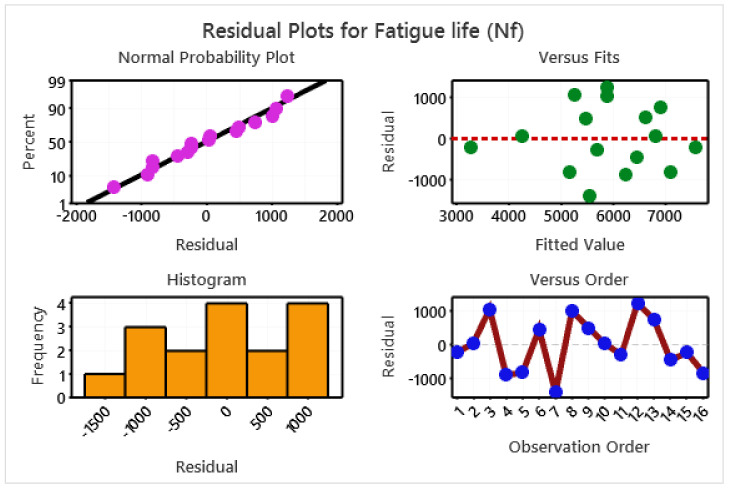
Figure 5 illustrates the residual plots for fatigue life observations. Figure 5 shows that all the data points are lying on the mean line, which can be viewed in the normal probability plot. The versus fits plot ensured that although the observations are scattered, they are within the acceptable limit. The normal probability confirms that there is no observational error; that is, the observations did not violate the statistical assumptions.
Usually, the ANOVA test is preferred in statistical analysis to ensure the accuracy of the observed results. Table 5 exhibits the results of the ANOVA test on fatigue life observations. Table 5 depicts the contribution of various factors to the fatigue life property of hybrid polymer composite such as the percentage of reinforcement contributes 40.95%, cutting time 11.65%, molding pressure 8.01%, and molding temperature contribute 5.03%. The fatigue life can be highly changed by a higher contribution percentage of reinforcement.
Table 5: Analysis of variance for fatigue life.
| Source | DF | Seq SS | Contribution | Adj SS | Adj MS | F-Value | p-Value |
|---|---|---|---|---|---|---|---|
| Regression | 4 | 17,724,150 | 65.64% | 17,724,150 | 4,431,038 | 5.25 | 0.013 |
| % of reinforcement | 1 | 11,058,076 | 40.95% | 11,058,076 | 11,058,076 | 13.11 | 0.004 |
| Molding temperature (°C) | 1 | 1,357,987 | 5.03% | 1,357,987 | 1,357,987 | 1.61 | 0.231 |
| Molding pressure (MPa) | 1 | 2,161,860 | 8.01% | 2,161,860 | 2,161,860 | 2.56 | 0.138 |
| Curing time (min) | 1 | 3,146,228 | 11.65% | 3,146,228 | 3,146,228 | 3.73 | 0.080 |
| Error | 11 | 9,279,268 | 34.36% | 9,279,268 | 843,570 | ||
| Total | 15 | 27,003,418 | 100.00% |
Regression Equation
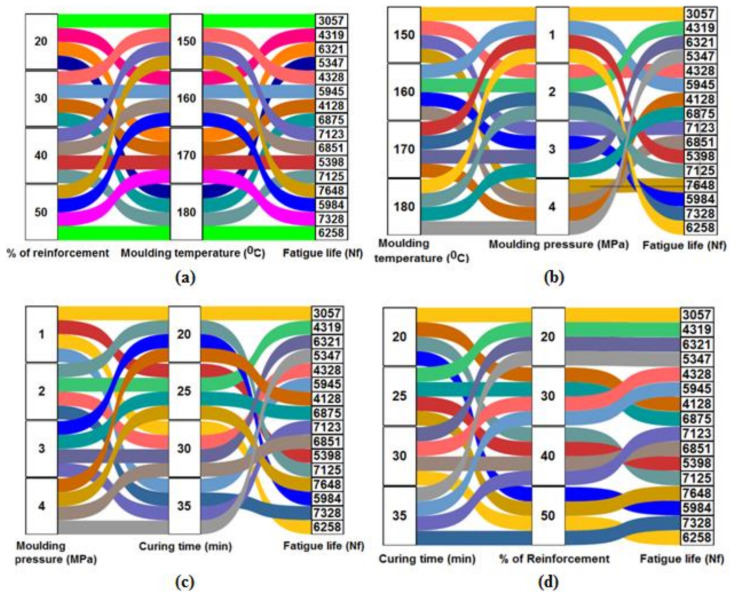
Figure 6 presents the parallel plot of fatigue life; this plot demonstrates the correlation between two parameters. Figure 6a exhibits the correlation between the parameters such as the percentage of reinforcement and molding temperature; from that, the higher fatigue life was attained by 50% of reinforcement and 150 °C of molding temperature. Figure 6b illustrates the connection between molding temperature and molding pressure; 150 °C of molding temperature and 4 MPa of molding pressure offered maximum fatigue life. Figure 6c associated between molding pressure and curing time; from that, 4 MPa of molding pressure and 25 min of curing time produced maximum fatigue life. Figure 6d presents the correlations between curing time and percentage of reinforcement; the maximum fatigue life was attained by 25 min of curing time and 50% of reinforcement.
4.2. Impact Strength Analysis
From impact strength analysis, the four parameters’ contributions are presented in Table 6 and Table 7 by means and S/N ratio structure. Based on the rank order, the curing time has a strong influence on the impact strength analysis, which is followed by percentage of reinforcement molding temperature and molding pressure. Curing time increases the impact strength of polymer composites. Increasing the curing time offered good blending action between resin and fibers, and it causes the composites to have high impact strength. Maximum impact strength was observed on the composite sample, which was prepared with 50 wt % fibers reinforcement at the molding temperature of 170 °C, with 2 MPa of molding pressure for 25 min curing time.
Table 6: Response table for means (impact strength).
| Level | % of Reinforcement | Molding Temperature (°C) | Molding Pressure (MPa) | Curing Time (min) |
|---|---|---|---|---|
| 1 | 23.66 | 24.39 | 24.83 | 19.56 |
| 2 | 24.55 | 25.02 | 24.70 | 25.23 |
| 3 | 26.20 | 25.11 | 25.40 | 26.08 |
| 4 | 27.42 | 27.31 | 26.90 | 30.95 |
| Delta | 3.76 | 2.92 | 2.20 | 11.39 |
| Rank | 2 | 3 | 4 | 1 |
Table 7: Response table for signal to noise ratios (impact strength).
| Level | % of Reinforcement | Molding Temperature (°C) | Molding Pressure (MPa) | Curing Time (min) |
|---|---|---|---|---|
| 1 | 27.28 | 27.56 | 27.73 | 25.80 |
| 2 | 27.69 | 27.85 | 27.70 | 28.00 |
| 3 | 28.28 | 27.83 | 28.00 | 28.27 |
| 4 | 28.63 | 28.64 | 28.45 | 29.80 |
| Delta | 1.35 | 1.08 | 0.74 | 4.00 |
| Rank | 2 | 3 | 4 | 1 |
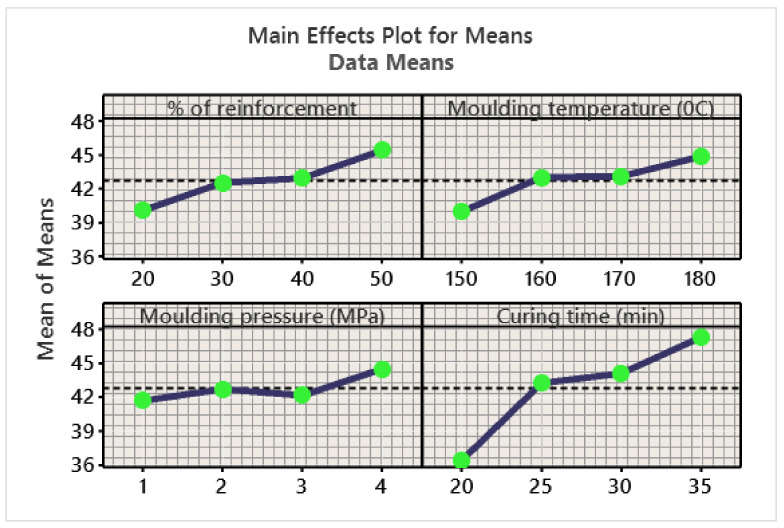
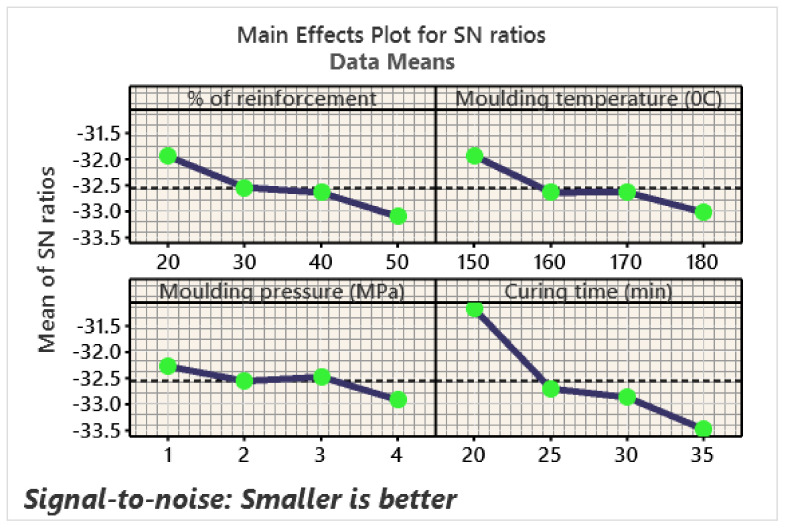
Figure 7 and Figure 8 illustrate the main effects plot (mean and S/N ratio) for impact strength. From this plot, it can be observed that the increase in all synthesizing parameters increases the impact strength in a steady state. The composite samples that have a weight percent of fibers reinforcement from 30% to 50% recorded higher impact strength. The impact strength was maximum in the composite prepared at 180 °C of molding temperature, 4 MPa of molding pressure and 35 min of curing time. The sample prepared at the 4th level of all synthesizing parameters exhibited high impact strength.
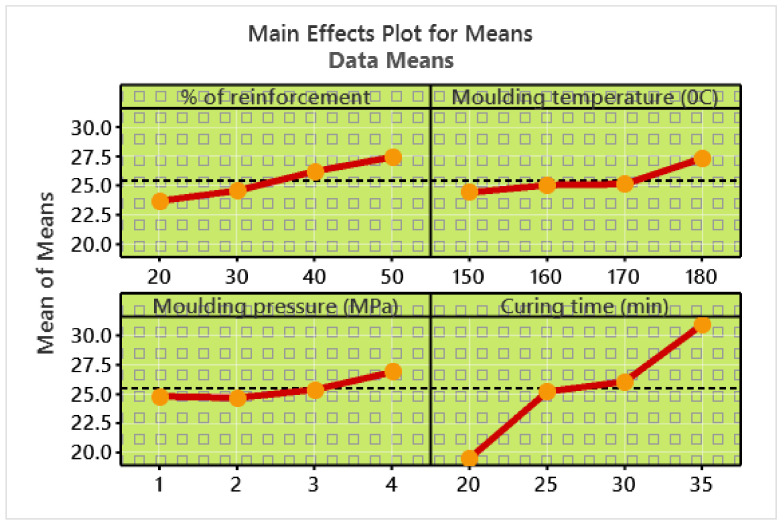
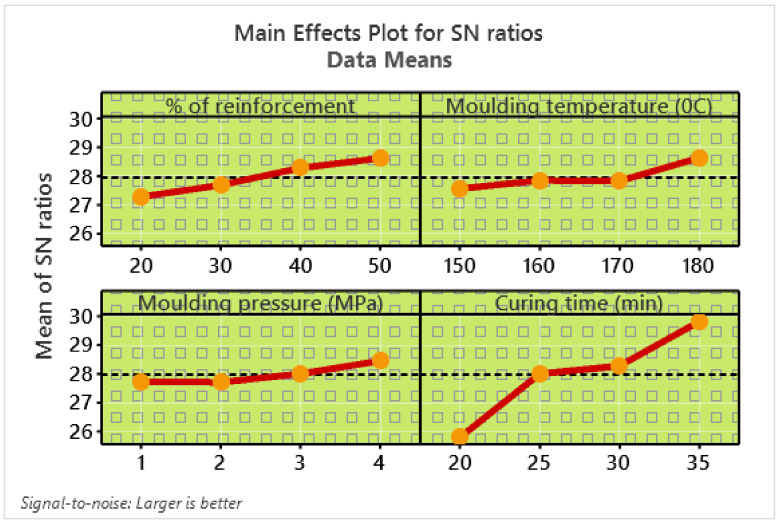
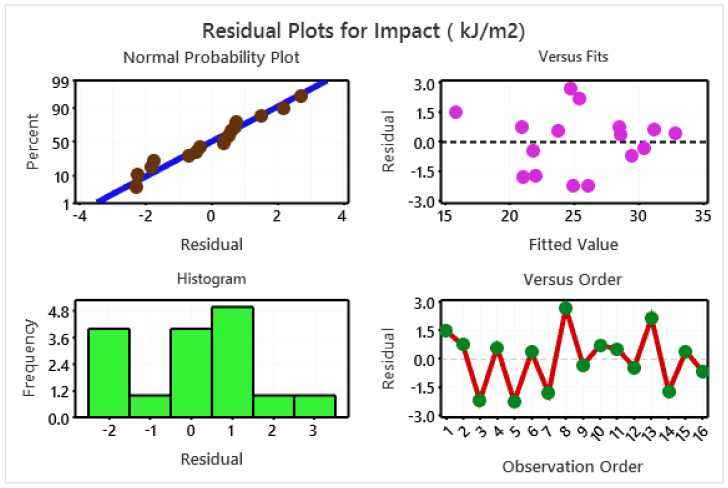
Figure 9 illustrates the ANOVA residual plots for the observations of impact strength. The normal probability plot ensures that there is no error in the observations, as all the observations are lying on or very close to the mean line. The same things that were revealed in the verses fit the plot; that is, all data points were distributed homogeneously along in positive and negative limits. All the rectangles were skewed properly in the histogram plot. At last, the versus order plot represents that the data points were equally laid in positive and negative side also within the limits. Hence, it is understood that the observation did not violate statistical assumptions, and they can be accepted.
Regression Equation
Table 8 depicts the contribution percentage of various synthesizing parameters to the impact strength of composites. There is a relation between the F-value and percent of the contribution that the higher F means the value of the factor contributing is also high. It can be noticed from the results of ANOVA analysis that the curing time was highly contributed such as 72.71% followed by 9.90% of reinforcement, 4.65% of molding temperature, and 2.83% of molding pressure.
Table 8: Analysis of variance (impact strength).
| Source | DF | Seq SS | Contribution | Adj SS | Adj MS | F-Value | p-Value |
|---|---|---|---|---|---|---|---|
| Regression | 4 | 303.897 | 90.09% | 303.897 | 75.974 | 25.00 | 0.000 |
| % of reinforcement | 1 | 33.385 | 9.90% | 33.385 | 33.385 | 10.99 | 0.007 |
| Molding temperature (°C) | 1 | 15.682 | 4.65% | 15.682 | 15.682 | 5.16 | 0.044 |
| Molding pressure (MPa) | 1 | 9.550 | 2.83% | 9.550 | 9.550 | 3.14 | 0.104 |
| Curing time (min) | 1 | 245.280 | 72.71% | 245.280 | 245.280 | 80.71 | 0.000 |
| Error | 11 | 33.428 | 9.91% | 33.428 | 3.039 | – | – |
| Total | 15 | 337.325 | 100.00% | – | – | – | – |
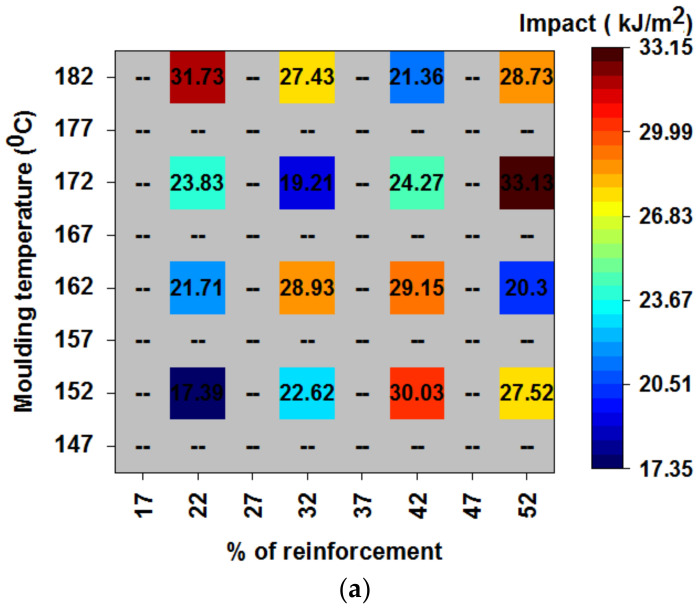
Figure 10 exhibits the relationship among parameters. Figure 10a represents that the two parameters association: namely, percentage of reinforcement and molding temperature. The maximum impact strength was found in the composite sample prepared with 50 wt % fibers reinforcement at 170 °C of molding temperature. Figure 6b demonstrates the relation between molding temperature and molding pressure: 170 °C of molding temperature and 2 MPa of molding pressure provided maximum impact strength. Figure 6c correlates the relation between molding pressure and curing time. It is found from Figure 6c that the composite sample prepared at 2 MPa of molding pressure and allowed 35 min of curing time exhibited maximum impact strength. Figure 6d represents the link between curing time and percentage of reinforcement; the maximum impact strength was observed by 35 min of curing time and 50% of reinforcement.
4.3. Wear Analysis
In case of wear test observations and ensuring wear-resistant characteristics of composite samples, the statistical optimization objective preferred as small is a better option (less wear is preferred) that was considered. The Taguchi analysis results are furnished in Table 9 and Table 10 in terms of means and S/N ratio for the observations of wear. Based on the delta value, ranking can be decided. That is, the higher the delta value indicates a higher influence. Hence, the order of ranking of synthesizing parameters or wear of composite samples can be decided as the curing time, percentage of fiber reinforcement, molding temperature, and molding pressure, respectively of rank 1 to rank 4. Minimum wear occurred by influencing optimal parameters such as 20% of reinforcement, 150 °C of molding temperature, 1 MPa of molding pressure, and 20 min of curing time.
Table 9: Response table for means (wear).
| Level | % of Reinforcement | Molding Temperature (°C) | Molding Pressure (MPa) | Curing Time (min) |
|---|---|---|---|---|
| 1 | 40.08 | 39.98 | 41.68 | 36.42 |
| 2 | 42.56 | 43.03 | 42.71 | 43.24 |
| 3 | 42.95 | 43.12 | 42.15 | 44.09 |
| 4 | 45.43 | 44.89 | 44.48 | 47.27 |
| Delta | 5.34 | 4.90 | 2.79 | 10.85 |
| Rank | 2 | 3 | 4 | 1 |
Table 10: Response table for signal to noise ratios (wear).
| Level | % of Reinforcement | Molding Temperature (°C) | Molding Pressure (MPa) | Curing Time (min) |
|---|---|---|---|---|
| 1 | −31.95 | −31.94 | −32.28 | −31.19 |
| 2 | −32.54 | −32.64 | −32.56 | −32.70 |
| 3 | −32.64 | −32.64 | −32.48 | −32.87 |
| 4 | −33.10 | −33.02 | −32.92 | −33.47 |
| Delta | 1.15 | 1.07 | 0.64 | 2.29 |
| Rank | 2 | 3 | 4 | 1 |
Figure 11 and Figure 12 show the main effects plot (mean and S/N ratio) for the observations of wear. The following can be noticed from the plots of Figure 11 and Figure 12: that the composites prepared with low level (1st level) values of synthesizing parameters offered minimum wear; that is, the composite sample prepared with 20 wt % of fiber reinforcement, 150 °C of molding temperature, 1 MPa of molding pressure and allowed 20 min of curing time recorded the minimum wear. A higher curing time increases the bonding strength of the composites and leads to reduced wear.
The residual plot shows four plots in the single graph as shown in Figure 13. In normal probability, the plot presents that all the data points touched the mean line; in the versus fits plot, the data points were dispersed evenly positively and negatively. In the histogram plot, the rectangles were distributed normally; in the versus order plot, the data points were lying in between the mean line and within the limit. From these, the selected parameters and the model was precise.
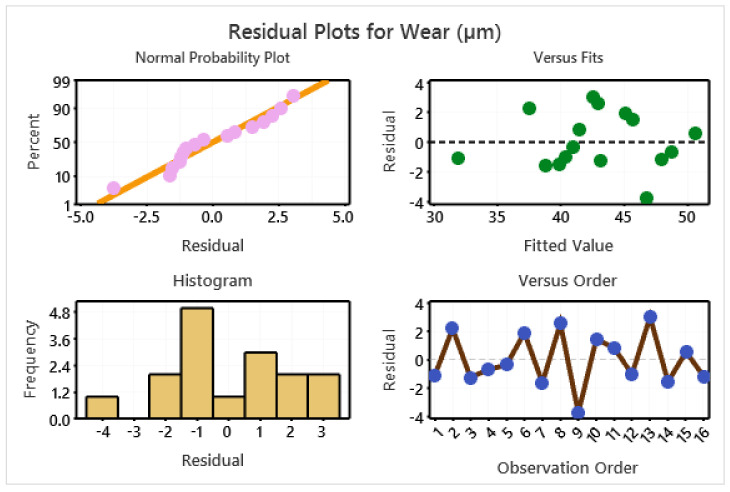
Table 11 presents the ANOVA analysis of the wear test, and the parameters’ contribution was clearly illustrated. Among all parameters, the curing time contributed highly such as 57.86%, which was followed by 14% of reinforcement, 11.35% of molding temperature, and 3.17% of molding pressure. p-Value of this analysis was less than 0.05; hence, the selected parameters were accurate and produced good results.
Table 11: Analysis of variance for wear analysis.
| Source | DF | Seq SS | Contribution | Adj SS | Adj MS | F-Value | p-Value |
|---|---|---|---|---|---|---|---|
| Regression | 4 | 333.13 | 86.38% | 333.13 | 83.281 | 17.44 | 0.000 |
| % of reinforcement | 1 | 53.98 | 14.00% | 53.98 | 53.981 | 11.30 | 0.006 |
| Molding temperature (°C) | 1 | 43.78 | 11.35% | 43.78 | 43.778 | 9.17 | 0.011 |
| Molding pressure (MPa) | 1 | 12.21 | 3.17% | 12.21 | 12.207 | 2.56 | 0.138 |
| Curing time (min) | 1 | 223.16 | 57.86% | 223.16 | 223.159 | 46.73 | 0.000 |
| Error | 11 | 52.53 | 13.62% | 52.53 | 4.775 | ||
| Total | 15 | 385.66 | 100.00% |
Regression Equation
Figure 14 illustrates the 3D trajectory plot for wear analysis. Figure 14a represents a combination of synthesizing parameters of wt % of reinforcement and molding temperature in composite wear; minimum wear was recorded by 20% of reinforcement and 150 °C of molding temperature. Figure 14b exemplifies the correlation between molding temperature and molding pressure, 150 °C of molding temperature and 1 MPa of molding pressure offered minimum wear of the composites. Figure 14c interrelated between molding pressure and curing time; from that, 1 MPa of molding pressure and 20 min of curing time registered minimum wear. Figure 14d shows the association between curing time and percentage of reinforcement; the minimum wear was observed by 20 min of curing time and 20% of reinforcement.
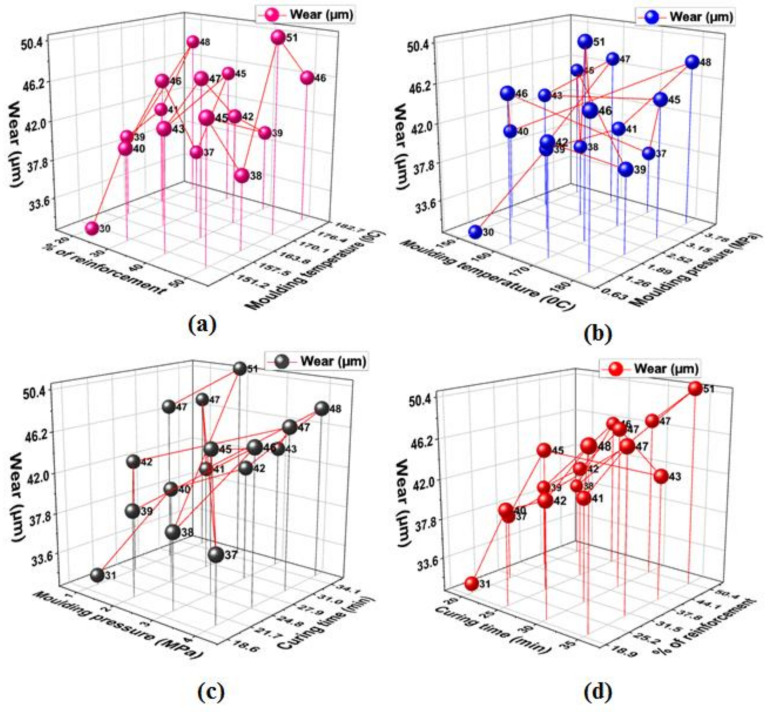
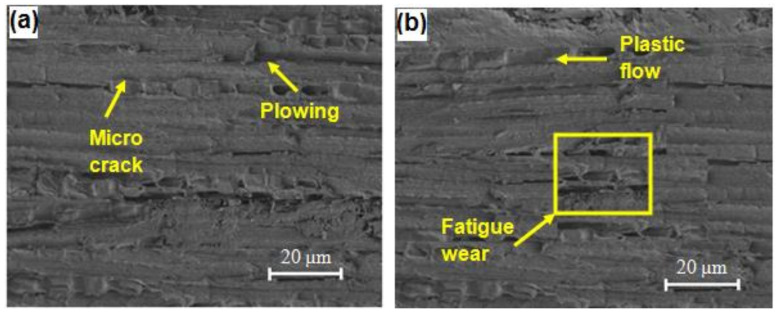
Figure 15 presented the SEM images of minimum and maximum wear specimens, from in minimum wear specimens, the microcrack and plowing were identified. In maximum wear specimen, the fatigue wear and plastic flow can be observed due to high speed and applied load.
5. Conclusions
Hemp/flax/epoxy hybrid polymer matrix composites were fabricated by compression molding and we evaluated the mechanical strength and tribological property of wear. Our samples were prepared as per Taguchi experimental design with aim of creating novel hybrid polymer matrix composites with high strength and low wear for automobile bodybuilding applications. The finding of the investigation is discussed below.
The composite prepared with the synthesizing parameters of 50% of reinforcement, 150 °C of molding temperature, 4 MPa of molding pressure, and 25 min of curing time offered a high fatigue life cycle as 7648 Nf. Similarly, the maximum impact strength was registered as 33.13 kJ/m2 by the influence of 50% of reinforcement, 170 °C of molding temperature, 2 MPa of molding pressure, and 35 min of curing time. In the wear test, the minimum wear was recorded as 31 µm with the influence of 20% of reinforcement, 50 °C of molding temperature, 1 MPa of molding pressure, and 20 min of curing time.
From the fatigue analysis, optimal parameters of the fatigue test were attained as 50% of reinforcement, 180 °C of molding temperature, 3 MPa of molding pressure, and 30 min of curing time. In the impact test, the optimal parameters were attained as 50% of reinforcement, 170 °C of molding temperature, 2 MPa of molding pressure, and 25 min of curing time. In the wear test, optimal parameters were recorded as 20% of reinforcement, 150 °C of molding temperature, 1 MPa of molding pressure, and 20 min of curing time.
The contribution of synthesizing parameters to the percent of reinforcement of fiber reinforcement was found to be 40.95% to fatigue strength, 72.71% to impact strength, and 57.86% to wear.
References
- J.F. Pereira, D.P. Ferreira, J. Bessa, J. Matos, F. Cunha, I. Araújo, L.F. Silva, E. Pinho, R. Fangueiro. Mechanical performance of thermoplastic olefin composites reinforced with coir and sisal natural fibers: Influence of surface pretreatment. Polym. Compos., 2019. [DOI]
- C. Daniel-Mkpume, C. Ugochukwu, E. Okonkwo, O. Fayomi, S. Obiorah. Effect of Luffa cylindrica fiber and particulate on the mechanical properties of epoxy. Int. J. Adv. Manuf. Technol., 2019. [DOI]
- A. Lakshumu Naidu, S. Kona. Experimental study of the mechanical properties of banana fiber and groundnut shell ash reinforced epoxy hybrid composite. Int. J. Eng., 2018. [DOI]
- R. Hsissou, M. Berradi, M. El Bouchti, A. El Bachiri, A. Elharfi. Synthesis characterization rheological and morphological study of a new epoxy resin pentaglycidyl ether pentaphenoxy of phosphorus and their composite (PGEPPP/MDA/PN). Polym. Bull., 2018. [DOI]
- H.B. Bisen, C.K. Hirwani, R.K. Satankar, S.K. Panda, K. Mehar, B. Patel. Numerical study of frequency and deflection responses of natural fiber (Luffa) reinforced polymer composite and experimental validation. J. Nat. Fibers, 2020. [DOI]
- D.V. Onifade, J.O. Ighalo, A.G. Adeniyi, K. Hameed. Morphological and thermal properties of polystyrene composite reinforced with biochar from plantain stalk fibre. Mater. Int., 2020
- R. Siakeng, M. Jawaid, H. Ariffin, M.S. Salit. Effects of surface treatments on tensile, thermal and fibre-matrix bond strength of coir and pineapple leaf fibres with poly lactic acid. J. Bionic Eng., 2018. [DOI]
- A. Bekhta, R. Hsissou, A. Elharfi. Evaluation of mechanical compressive strength of cementitious matrix with 12% of IER formulated by modified polymer (NEPS) at different percentages. Sci. Rep., 2020. [DOI | PubMed]
- B. Ahmad, M. Ashfaq, A. Joy, Z.A. Carlos, M. Sudheer. Fabrication and characterization of an eco-friendly biodegradable epoxy/chitosan composites. Am. J. Mater. Sci., 2017. [DOI]
- M.H. Zin, K. Abdan, M.N. Norizan. The effect of different fiber loading on flexural and thermal properties of banana/pineapple leaf (PALF)/glass hybrid composite. Structural Health Monitoring of Biocomposites, Fibre-Reinforced Composites and Hybrid Composites, 2019
- M. Böhm, K. Głowacka. Fatigue Life Estimation with Mean Stress Effect Compensation for Lightweight Structures—The Case of GLARE 2 Composite. Polymers, 2020. [DOI]
- T. Osiecki, C. Gerstenberger, A. Hackert, T. Timmel, L. Kroll. High-Performance Fiber Reinforced Polymer/Metal-Hybrids for Structural Lightweight Design. Key Eng. Mater., 2017. [DOI]
- Z. Oksiuta, M. Jalbrzykowski, J. Mystkowska, E. Romanczuk, T. Osiecki. Mechanical and Thermal Properties of Polylactide (PLA) Composites Modified with Mg, Fe, and Polyethylene (PE) Additives. Polymers, 2020. [DOI]
- N. Sukudom, P. Jariyasakoolroj, L. Jarupan, K. Tansin. Mechanical, thermal, and biodegradation behaviors of poly(vinyl alcohol) biocomposite with reinforcement of oil palm frond fiber. J. Mater. Cycles Waste Manag., 2019. [DOI]
- F.F.G. De Paiva, V.P.K. de Maria, G.B. Torres, G. Dognani, R.J. Dos Santos, F.C. Cabrera, A.E. Job. Sugarcane bagasse fiber as semi-reinforcement filler in natural rubber composite sandals. J. Mater. Cycles Waste Manag., 2018. [DOI]
- M. Aslan, M. Tufan, T. Kucukomeroglu. Tribological and mechanical performance of sisal-filled waste carbon and glass fibre hybrid composites. Compos. Part B Eng., 2018. [DOI]
- D. Lascano, L. Quiles-Carrillo, S. Torres-Giner, T. Boronat, N. Montanes. Optimization of the curing and post-curing conditions for the manufacturing of partially bio-based epoxy resins with improved toughness. Polymers, 2019. [DOI]
- S. Somashekhar, G.C. Shanthakumar, M. Nagamadhu. Influence of fiber content and screw speed on the mechanical characterization of jute fiber reinforced polypropylene composite using Taguchi method. Mater. Today Proc., 2020. [DOI]
- A. Saccani, S. Manzi, I. Lancellotti, L. Lipparini. Composites obtained by recycling carbon fibre/epoxy composite wastes in building materials. Constr. Build. Mater., 2019. [DOI]
- K.R. Sumesh, V. Kavimani, G. Rajeshkumar, P. Ravikumar, S. Indran. An Investigation into the mechanical and wear characteristics of hybrid composites: Influence of different types and content of biodegradable reinforcements. J. Nat. Fibers, 2020. [DOI]
- S.S. Todkar, S.A. Patil. Review on mechanical properties evaluation of pineapple leaf fibre (PALF) reinforced polymer composites. Compos. Part B Eng., 2019. [DOI]
- K.R. Sumesh, K. Kanthavel. Grey relational optimization for factors influencing tensile, flexural, and impact properties of hybrid sisal banana fiber epoxy composites. J. Ind. Text., 2020. [DOI]
- A. Dhanola, A.S. Bisht, A. Kumar, A. Kumar. Influence of natural fillers on physico-mechanical properties of Luffa cylindrica/polyester composites. Mater. Today Proc., 2018. [DOI]
- T. Dinesh, A. Kadirvel, P. Hariharan. Thermo-mechanical and wear behaviour of surface-treated pineapple woven fibre and nano-silica dispersed mahua oil toughened epoxy composite. Silicon, 2020. [DOI]
- T. Sathish. Nano-Alumina Reinforcement on AA 8079 acquired from Waste Aluminium Food Containers for altering Microhardness and Wear resistance. J. Mater. Res. Technol., 2021. [DOI]
- G.S. Krishnan, P. Velmurugan. Investigation on the characteristics of bamboo/jute reinforced hybrid epoxy polymer composites. Mater. Res. Express, 2019. [DOI]
- A.G. Adeniyi, S.A. Abdulkareem, J.O. Ighalo, D.V. Onifade, S.A. Adeoye, A.E. Sampson. Morphological and thermal properties of polystyrene composite reinforced with biochar from elephant grass (Pennisetum purpureum). J. Thermoplast. Compos. Mater., 2020. [DOI]
- S. Dharmalingam, O. Meenakshisundaram, V. Elumalai, R.S. Boopathy. An investigation on the interfacial adhesion between amine functionalized luffa fiber and epoxy resin and its effect on thermal and mechanical properties of their composites. J. Nat. Fibers, 2020. [DOI]
- T. Merizgui, A. Hadjadj, M. Kious, V.R.A. Prakash. Effect of temperature and frequency on microwave shielding behaviour of functionalized kenaf fibre-reinforced MWCNTs/Iron(III) oxide modified epoxy hybrid composite. Trans. Electr. Electron. Mater., 2020. [DOI]
- V. Mortazavian, A. Fatemi. Effects of mean stress and stress concentration on fatigue behavior of short fiber reinforced polymer composites. Fatigue Fract. Eng. Mater. Struct., 2016. [DOI]
- M. Habibi, S. Selmi, L. Laperrière, H. Mahi, S. Kelouwani. Experimental investigation on the response of unidirectional flax fiber composites to low-velocity impact with after-impact tensile and compressive strength measurement. Compos. B Eng., 2019. [DOI]
- A.K. Sinha, S. Bhattacharya, H.K. Narang. Experimental determination and modelling of the mechanical properties of hybrid abaca-reinforced polymer composite using RSM. Polym. Polym. Compos., 2019. [DOI]
- W. Liu, C. Hui, F. Wang, M. Wang, G. Liu. Review of the resources and utilization of bamboo in China. Bamboo—Current and Future Prospects, 2018. [DOI]
- M.I. Najeeb, M.T.H. Sultan, Y. Andou, A.U.M. Shah, K. Eksiler, M. Jawaid, A.H. Ariffin. Characterization of lignocellulosic biomass from Malaysian’s Yankee pineapple AC6 toward composite application. J. Nat. Fibers, 2020. [DOI]
- B.L. Sy, Z. Fawaz, H. Bougherara. Damage evolution in unidirectional and cross-ply flax/epoxy laminates subjected to low velocity impact loading. Compos. Part A Appl. Sci. Manuf., 2018. [DOI]
- A. Soundhar, M. Rajesh, K. Jayakrishna, M.T.H. Sultan, A.U.M. Shah. Investigation on mechanical properties of polyurethane hybrid nanocomposite foams reinforced with roselle fibers and silica nanoparticles. Nanocomposites, 2019. [DOI]
- N. Saba, O.Y. Alothman, Z. Almutairi, M. Jawaid. Magnesium hydroxide reinforced kenaf fibers/epoxy hybrid composites: Mechanical and thermomechanical properties. Constr. Build. Mater., 2019. [DOI]
- R. Rahman, S. Hamdan, E. Jayamani, A. Kakar, M.K.B. Bakri, F.A.B.M. Yusof. Tert-butyl catechol/alkaline-treated kenaf/jute polyethylene hybrid composites: Impact on physico-mechanical, thermal and morphological properties. Polym. Bull., 2019. [DOI]