
The 2008 Financial Crisis and Changes in Lifestyle-Related Behaviors in Italy, Greece, Spain, and Portugal: A Systematic Review
Abstract
Italy, Greece, Spain, and Portugal have all been strongly affected by the 2008 financial crisis, which has had a negative impact on health. We systematically evaluated the effects of the crisis on lifestyle and socioeconomic inequalities. We conducted a literature search using MEDLINE, Embase, the Cochrane Library, and health economics databases for studies reporting quantitative comparisons before and after (or during) the crisis on the following risk behaviors: alcohol consumption, smoking habit, healthy diet, physical activity, and psychotropic drugs and substance abuse, without setting any age restrictions. We selected 34 original articles published between 2011 and 2020. During/after the crisis, alcohol consumption and substance abuse decreased, while psychotropic drug use increased. We also observed a deterioration in healthy eating behavior, with a reduction in fruit and vegetable consumption. Smoking habit and physical activity showed a more complex, controversial trend. Socioeconomic inequalities were affected by the recession, and the negative effects on unhealthy lifestyle tended to be more pronounced among the disadvantaged. These results suggest the need to implement health policies and interventions aimed at monitoring risk behaviors, with special regard to disadvantaged people, and considering the potential additional impact of the COVID-19 pandemic.
Article type: Review Article
Keywords: economic crisis, COVID-19, risk behaviors, lifestyles, inequalities, socioeconomic
Affiliations: National Institute for Health, Migration and Poverty (INMP), 00153 Rome, Italy; msaneschepisi@gmail.com (M.S.S.); anteo.dinapoli@inmp.it (A.D.N.); rosarioasciutto@gmail.com (R.A.); concetta.mirisola@inmp.it (C.M.); Ministry of Health—General Directorate for Health Prevention, 00144 Rome, Italy; Department of Epidemiology—Lazio Region, ASL Rome 1, 00147 Rome, Italy; s.vecchi@deplazio.it
License: © 2021 by the authors. CC BY 4.0 Licensee MDPI, Basel, Switzerland. This article is an open access article distributed under the terms and conditions of the Creative Commons Attribution (CC BY) license (https://creativecommons.org/licenses/by/4.0/).
Article links: DOI: 10.3390/ijerph18168734 | PubMed: 34444482 | PMC: PMC8392284
Relevance: Moderate: mentioned 3+ times in text
Full text: PDF (1.1 MB)
1. Introduction
Before the COVID-19 pandemic, the 2008 Great Recession was the most severe crisis experienced by Europe since the Second World War, particularly in the southern European countries of Italy, Greece, Spain, and Portugal [ref. 1]. The considerable amount of literature on the topic shows that the financial crisis has had a strong impact on the health of most European populations [ref. 2]. Despite the trend towards reduced mortality, a deterioration in mental health, an increase in the number of suicides and, to a varying extent, in some non-communicable and communicable diseases, and a worsening in perceived health has been observed in most European populations [ref. 3,ref. 4]. However, an increase in mortality due to alcohol-related causes and to the consumption of drugs [ref. 5] has been observed in some countries.
Italy, Greece, Spain, and Portugal have been affected both by the direct effects of the financial crisis on the health of their populations and by the barriers to healthcare access imposed by the austerity policies introduced by governments to pay off the public debt [ref. 2]. In Greece, the austerity measures implemented to contain public spending contributed to an increase in forgoing health care due to economic reasons, especially among the poor, people with lower incomes, and the unemployed [ref. 6]; similar results were observed in Italy [ref. 7]. A deeper analysis by Karanikolos [ref. 2] suggests that, although recession poses risks to health, the interaction between fiscal austerity with economic shocks and weak social protection is what ultimately seems to escalate health and social crises in Europe.
The impact of the financial crisis on the health of the populations has been disproportionate. In fact, the more limited decrease in the number of deaths among the more disadvantaged social groups compared to the general population has determined a widening of mortality inequalities [ref. 8]. A recent systematic review has found an increase in socioeconomic inequalities [ref. 9]. Historical evidence supports the hypothesis that recession periods are associated with worse lifestyle, including increased alcohol consumption [ref. 10] or drug use [ref. 11], but the association between the Great Recession and worse lifestyle has not yet been systematically evaluated.
In this context, the COVID-19 pandemic began while the effects of the 2008 financial crisis were still manifesting; in addition to the dramatic impact on mortality and the direct long-term effects on the health of those who have recovered, there have also been indirect effects due to the cancellation or postponement of non-urgent assistance or interventions to decongest overwhelmed care facilities, technologies, and personnel.
The purpose of our review was to systematically evaluate the effects of the 2008 financial crisis on lifestyle and socioeconomic inequalities in Italy, Greece, Spain, and Portugal.
2. Materials and Methods
The review protocol was registered (CRD42019129105) in the PROSPERO open access database of systematic reviews (Available online: http://www.crd.york.ac.uk/PROSPERO) (accessed on 12 August 2021). Conducting and reporting are in accordance with PRISMA guidelines. The Covidence systematic review software (Veritas Health Innovation, Melbourne, VIC, Australia. Available online: http://www.covidence.org) (accessed on 12 August 2021) was used as the reference manager tool for the phases of importation, deduplication, and selection.
2.1. Information Sources and Search Strategy
The literature search was performed using MEDLINE (via Ovid), Embase, The Cochrane Library and health economics databases (EconLit). Search terms for financial crisis were combined with the terms “eating behavior”, “smoking habit”, “alcohol consumption”, “psychotropic drug use”, “drug abuse”, or “gambling”. Supplementary Table S1 shows the full search strategy for MEDLINE. To identify additional relevant documents, the grey literature was searched for using OpenGrey and through the screening of the websites of the following referral organizations on population health and healthcare: The World Health Organization, the Organization for Economic Co-operation and Development, the European Observatory on Health Systems and Policies, the European Commission, and the European Centre for Disease Prevention and Control.
The references of included articles were also screened to identify potentially eligible articles for inclusion.
We included observational studies reporting quantitative comparisons before and after, before and during, or during and after the crisis of the following key health behaviors: diet, smoking, physical activity, alcohol consumption, and psychotropic drug use or substance abuse affecting individuals of any age. We considered studies published between January 2008 and November 2020 in English, Italian, Spanish, Portuguese, and Catalan. Multi-country studies were included when individual country data were available.
The exclusion criteria were:
- Type of study: publications lacking primary data and/or explicit descriptions of the methods. Abstracts, editorials, correspondence, and commentaries were deemed acceptable for inclusion if they reported sufficient data;
- Methodology: pre–post comparison missing;
- Data not suitable for extraction (e.g., reporting data on a group of countries);
- Study population overlap.
Studies were selected through a three-step selection procedure based on: (1) screening of title and abstract, (2) screening of full-text article, and (3) final screening during the data extraction phase. Two independent researchers with experience in reviews and in the topic filtered and selected the references. In cases of discordance, a third researcher was consulted to determine inclusion or exclusion of the reference.
2.2. Data Extraction, Quality Evaluation, and Synthesis of Results
The following data were extracted from each included article: study population (number, age range, sex), population characteristics (e.g., students, household members), data source (e.g., national registry, questionnaires), study design, outcome definition, results (if available, by sex and socioeconomic status), main conclusions.
Two independent researchers judged the quality of each eligible study using a modified Newcastle-Ottawa Scale (NOS) for cross-sectional studies [ref. 12]: a study is assigned a maximum total score (stars) of nine for the following domains: selection, comparability, and outcome. We considered scores of 0–3, 4–6, and 7–9 as indications of low, medium, and high quality, respectively. Any doubt was resolved by consulting with a third reviewer. The score of the included articles are shown in the Supplementary Table S2.
The results, organized by country, report study population (number and age range) and data sources, outcome definition, results, and effects on inequalities, if reported. Given the highly heterogeneous nature of the studies, we did not attempt to conduct a meta-analysis, and we report the results narratively.
3. Results
Our search identified 2325 unduplicated records; after the selection process, 31 cross-sectional studies [ref. 13,ref. 14,ref. 15,ref. 16,ref. 17,ref. 18,ref. 19,ref. 20,ref. 21,ref. 22,ref. 23,ref. 24,ref. 25,ref. 26,ref. 27,ref. 28,ref. 29,ref. 30,ref. 31,ref. 32,ref. 33,ref. 34,ref. 35,ref. 36,ref. 37,ref. 38,ref. 39,ref. 40,ref. 41,ref. 42,ref. 43] were identified, as detailed in the PRISMA flow diagram (Figure 1). The main characteristics of the eligible studies are reported in Table 1. The articles, published between 2011 and 2020, were conducted primarily in Spain (n = 19); the remainder were conducted in Italy (n = 6), Greece (n = 6), and Portugal (n = 4). Two studies were multi-country [ref. 19,ref. 34]. Of the studies included, six also considered a juvenile population (age ≤ 15 years) [ref. 21,ref. 29,ref. 33,ref. 34,ref. 41,ref. 43], while the remaining were on adolescents aged > 15 years and on adults. The studies used validated questionnaires or administrative registries as data sources.
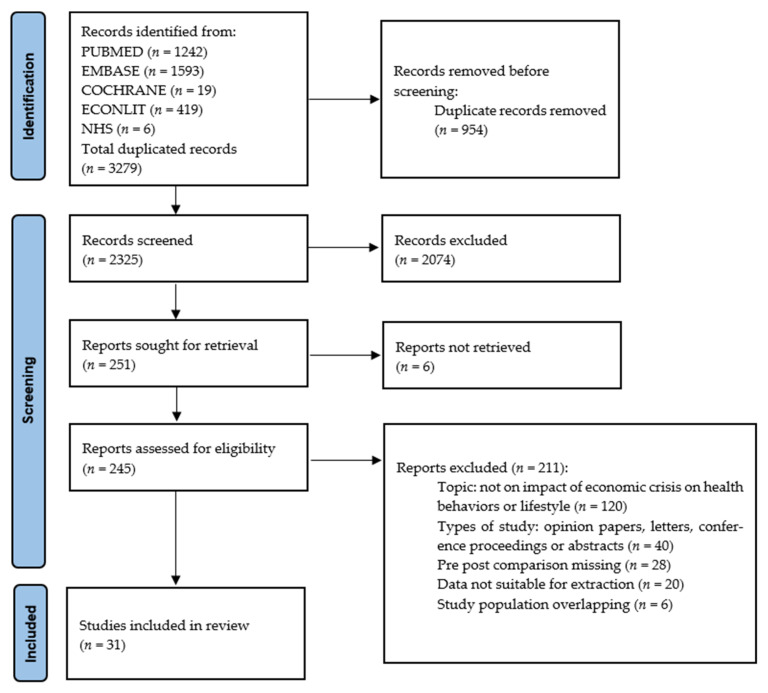
Table 1: Characteristics of the included studies by country.
| COUNTRY: SPAIN | ||||
|---|---|---|---|---|
| Author | Study Design, Sample Characteristics | Outcome Definition | Findings * | |
| Aguilar-Palacio 2015 [ref. 13] | Cross-sectionalSpanish National Health Survey (ENSE)Young people: 16–24 yearsN = 3701 (ENSE 2006: 2168; ENSE 2011/12: 1533) | Alcohol consumption in the last 2 weeksDaily/occasional smoker | Alcohol consumptionPrevalence (%), 2006 vs. 2012MEN: 61.9 vs. 56.3 (p = 0.015)WOMEN: 46.4 vs. 43.8 (ns)SmokingDaily/occasional smokers Prevalence (%), 2006 vs. 2012MEN: 25.0 vs. 23.7 (ns)WOMEN: 28.9 vs. 21.9 (p < 0.001)Adjusted odds ratios (OR), 2012 vs. 2006: MEN: OR 0.97 (95% CI: 0.77–1.21)WOMEN: OR 0.79 (95% CI: 0.64–0.99)By socioeconomic statusAdjusted odds ratios (OR), unemployed vs. workingMEN2006: OR 1.04 (95% CI: 0.64–1.69)2012: OR 1.62 (95% CI: 1.00–2.62)WOMEN2006: OR 0.97 (95% CI: 0.64–1.48)2012: OR 1.24 (95% CI: 0.72–2.13) | |
| Arroyo 2019 [ref. 15] | Cross-sectionalAdults: >15 yearsN = 49,463 (2006–2007: 28,954; 2011–2012: 20,509) | Consumption of antidepressants or sedatives | DrugsAntidepressantsOverall consumption (%), 2006–2007 vs. 2011–2012:5.8 vs. 4.3 (p < 0.01)SedativesOverall consumption (%), 2006–2007 vs. 2011–2012:10.7 vs. 11.1 (ns) | |
| Bartoll 2015 [ref. 16] | Cross-sectionalSpanish National Health Survey (2001, 2003/04, 2006/07 and 2011/12)Economically active adults: 25–64 yearsN = 47,156 | Alcohol consumption in the last 2 weeksHeavy alcohol consumption more than 17 Standard Basic Units of alcohol per weekSmoking habitsFrequency of consumption of foodPhysical activitymoderate or intense physical activityTranquilizer or sleeping tablet intakeat least 1 tablet in the last 2 weeks. | AlcoholTrend percentages (%) of consumption, 2001–2012 Last two weeks: MEN: −5.4 (p < 0.01); WOMEN: −6.9 (p < 0.01)Heavy alcohol consumption: MEN: +2.0 (p < 0.01); WOMEN: −0.4 (ns)By socioeconomic statusAdjusted regression coefficients (%) and p-value of the interaction between economic recession dummy (2001–2006/2007 vs. 2011/2012) and employment status (employed; unemployed)WOMENLast two weeks −5.0; −12.4 (p = 0.054)Adjusted regression coefficients (%) and p-value of the interaction between economic recession dummy (2001–2006/2007 vs. 2011/2012) and education level (university, high secondary, lower secondary or primary, without any qualification)MEN:Heavy alcohol consumption+0.2; +0.8; +3.1; +5.4 (p = 0.012)WOMEN:Heavy alcohol consumption−1.5; +0.1; +1.4; −0.2 (p = 0.012)SmokingDaily or occasional smokersTrend percentages (%), 2001–2012MEN: −0.8 (ns); WOMEN: +4.4 (p < 0.01)DietTrend percentages (%) of consumption, 2001–2012Fruits: MEN: −9.1 (p < 0.01); WOMEN: −7.9 (p < 0.01)Vegetables: MEN: −0.2 (ns); WOMEN: −2.4 (ns) Legumes: MEN: +3.4 (p < 0.05); WOMEN: +4.3 (p < 0.01)Meat: MEN: −9.7 (p < 0.01); WOMEN: −10 (p < 0.01)Cold meat: MEN: −4.7 (p < 0.01); WOMEN: −3.7 (p < 0.05)By socioeconomic statusAdjusted regression coefficients (%) and p-value of the interaction between economic recession dummy (2001–2006/2007 vs. 2011/2012) and employment status (employed; unemployed)MEN:Vegetables daily: +9.0; 6.3 (p = 0.004)Fruits daily: −7.4; −12.1 (p = 0.041)Legumes (3 times or more per week): +3.8; −7.4 (p = 0.041)Fish (3 times or more per week): +1.2; −6.4 (p = 0.055)WOMENVegetables daily: −1.7; −4.3 (p = 0.065)Adjusted regression coefficients (%) and p-value of the interaction between economic recession dummy (2001–2006/2007 vs. 2011/2012) and education level (university, high secondary, lower secondary or primary, without any qualification)MEN:Fruits daily: −4.5; −6.1; −11.4; −21.8 (p = 0.06)Sweet food (3 times or more per week): −1.7; +2.5; +3.1; −16.9 (p = 0.067)WOMEN:Vegetables daily: −1.3; +3.4; −3.0; −27.1 (p = 0.004)Physical activityModerate or intenseTrend percentages (%), 2001–2012 MEN: +3.2 (p < 0.05); WOMEN: +1.4 (ns)By socioeconomic statusAdjusted regression coefficients (%) and p-value of the interaction between economic recession dummy (2001–2006/2007 vs. 2011/2012) and education level (university, high secondary, lower secondary or primary, without any qualification)WOMEN:+6.5; +4.6; −1.6; −0.7 (p = 0.014)DrugsTranquilizers or sleeping pillsTrend percentages (%) of consumption, 2001–2012MEN: −0.5 (ns); WOMEN: −2.4 (p < 0.01)By socioeconomic statusAdjusted regression coefficients (%) and p-value of the interaction between economic recession dummy (2001–2006/2007 vs. 2011/2012) and employment status (employed; unemployed)WOMEN−3.7; +0.1 (p < 0.001)Adjusted regression coefficients (%) and p-value of the interaction between economic recession dummy (2001–2006/2007 vs. 2011/2012) and education level (university, high secondary, lower secondary or primary, without any qualification)WOMEN:−2.6; −1.2; −2.1; −18.3 (p = 0.051) | |
| Blázquez-Fernández 2019 [ref. 17] | Cross-sectionalNational Health Interview SurveyEconomically active adults: 18–65 yearsN = 29,677 (2006:14,696;2011–2012: 14,981) | Drinkerpeople consumingfive or more drinks a week | AlcoholPrevalence (%), 2006 vs. 2011–201225.9 vs. 25.6By socioeconomic statusAdjusted OR:2006Unemployed less than 6 months: 0.87 (95% CI: 0.72–1.05)Education:Noncompulsory and pre-university secondary education: 0.90 (95% CI: 0.81–1.00)Specific labor training: 0.98 (95% CI: 0.85–1.14)University graduate: 0.85 (95% CI: 0.76–0.95)2011–2012Unemployed less than 6 months: 1.26 (95% CI: 1.06–1.50)Noncompulsory and pre-university secondary education: 1.36 (95% CI: 1.19–1.56)Specific labor training: 1.35 (95% CI: 1.13–1.61)University graduate: 1.37 (95% CI: 1.19–1.58) | |
| Colell 2015 [ref. 20] | Cross-sectionalEconomically active adults: 50–64 yearsN = 62,440 | Daily average of alcohol intake in the last 30 days (grams of pure ethanol)Heavy drinkersabove ≥ 40 g for men and ≥ 24 g for womenBinge drinking5 or more drinks on a single drinking occasion (within 2 h) at least once in the previous month in editions 2005 and 2007.Editions 2009 and 2011: 5 or more drinks for men and four or more for womenHypnotics/sedativesSporadic users: use from 1 to 9 days in the last 30 daysHeavy users: use from 10 to 30 days in the last 30 days | AlcoholDaily average of alcohol intake (g/day), 2005–2007 vs. 2009–2011MEN: 16.9 vs. 15.1 (p < 0.001)WOMEN: 7.7 vs. 7.1 (p = 0.002)Heavy drinkingPrevalence (%), 2005–2007 vs. 2009–2011MEN: 6.9 vs. 5.2 (p < 0.001)WOMEN: 3.3 vs. 2.8 (p = 0.013)Adjusted prevalence ratio (PR) (ref pre-crisis):MEN: 0.73 (95% CI: 0.67–0.79)WOMEN: 0.86 (95% CI: 0.75–0.99)Binge drinkingPrevalence (%), 2005–2007 vs. 2009–2011MEN: 19.3 vs. 22.0 (p < 0.001)WOMEN: 7.1 vs. 10.1 (p < 0.001)Adjusted prevalence ratio (PR) (ref pre-crisis):MEN: 1.17 (95% CI: 1.12–1.22)WOMEN: 1.62 (95% CI: 1.49–1.76)DrugsHypnotics/sedatives sporadic usersPrevalence (%), 2005–2007 vs. 2009–2011MEN: 1.2 vs. 1.6 (p = 0.005)WOMEN: 2.1 vs. 2.4 (ns)Hypnotics/sedatives heavy usersPrevalence (%), 2005–2007 vs. 2009–2011MEN: 1.8 vs. 2.1 (p = 0.005)WOMEN: 3.7 vs. 5.4 (p < 0.001)Prevalence ratio (PR) (ref pre-crisis):MEN: 1.19 (95% CI: 0.99–1.42)WOMEN: 1.32 (95% CI: 1.17–1.49)By socioeconomic statusInteraction (RRR) between activity (unemployed vs. employed) and period (2009–2011 vs. 2005–2007)MEN: 0.69 (95% CI: 0.49–0.97)Substance abuseCannabis sporadic usersPrevalence (%), 2005–2007 vs. 2009–2011MEN: 5.6 vs. 5.2 (p ns)WOMEN: 3.1 vs. 2.4 (p < 0.001)Adjusted prevalence ratio (PR) (ref pre-crisis)MEN: 0.90 (95% CI: 0.81–1.01)WOMEN: 0.77 (95% CI: 0.64–0.91)By socioeconomic statusInteraction (RRR) between activity (unemployed vs. employed) and period (2009–2011 vs. 2005–2007)MEN: 1.40 (95% CI: 1.10–1.77)WOMEN: 1.68 (95% CI: 1.17–2.41)Cannabis heavy usersPrevalence (%), 2005–2007 vs. 2009–2011MEN: 6.0 vs. 5.7 (ns)WOMEN: 2.0 vs. 1.9 (ns) | |
| Diaz-Mendez 2019 [ref. 22] | Cross-sectionalAdults >16 yearsN = 50,485 (2006: 29,478; 2011–2012: 21,007) | Frequency of consumption of food | DietTrend 2006–2011Fruits (daily): fallingMeat (3 or more times a week): risingEggs (3 or more times a week): fallingFish (3 or more times a week): fallingPasta-rice-potatoes (daily): fallingBread (daily): remaining within guidelines.Vegetables (daily): fallingPulses (once or twice a week): risingProcessed meats (occasionally/seldom or never): continuingDairy (daily): fallingSweets (occasionally/seldom or never): fallingSoft drinks (occasionally/seldom or never): continuing | |
| Garcia-Mayor 2019 [ref. 25] | Cross-sectionalSpanish National Health Survey (SNHS)Adults 18–64 yearsN = 51,370 (2006: 28,478; 2012: 21,007; 2017: 23,089) | Alcohol use during the last 2 weeksTobacco useFruit vegetable, pastries and/or sweets, sweetened beveragesdaily intake (yes or no) | AlcoholDifferences in prevalence, 2012 vs. 2006, 2017 vs. 2006MEN: −4.7% (p < 0.001), −8.7% (p < 0.001)WOMEN: −3.3% (p < 0.001), −5.8% (p < 0.001)By socioeconomic statusHigh (−2.8%, −4.4%) Middle (−1.2%, −4.0%) Low (−0.8%, −7.2%)SmokingDifferences in prevalence, 2012 vs. 2006, 2017 vs. 2006 MEN: −3.5% (p < 0.001), −7.7% (p < 0.001)WOMEN: +0.3% (ns), −1.6% (ns)By socioeconomic statusHigh (−3.4%, −7.0%) Middle (−0.4%, −5.2%) Low (−0.6%, −2.3%)DietFruit consumption Differences in prevalence, 2012 vs. 2006, 2017 vs. 2006 MEN: −3.9% (p < 0.001), −4.6% (p < 0.001)WOMEN: −7.2% (p < 0.001), −4.9% (p < 0.001) By socioeconomic statusHigh (−5.2%, −1.2%) Middle (−5.4%, −5.3%) Low (−6.2%, −8.1%)Vegetable consumption Differences in prevalence, 2012 vs. 2006, 2017 vs. 2006 MEN: +4.8% (p < 0.001), −2.1% (p = 0.005)WOMEN: +3.5% (p < 0.001), −0.7% (ns)By socioeconomic statusHigh (+4.6%, +2.3%) Middle (+5.2%, −1.0%) Low (+2.1%, −3.8%)Sweets consumption Differences in prevalence, 2012 vs. 2006, 2017 vs. 2006 MEN: −4.4% (p < 0.001), −8.8% (p < 0.001)WOMEN: −6.7% (p < 0.001), −9.3% (p < 0.001)By socioeconomic statusHigh (−3.5%, −8.9%) Middle (−7.7%, −9.9%) Low (−5.4%, −9.2%)Sweetened beveragesDifferences in prevalence, 2012 vs. 2006, 2017 vs. 2006 MEN: −4.7% (p < 0.001), −3.5% (p < 0.001)WOMEN: −8.9% (p < 0.001), −5.0% (p < 0.001)By socioeconomic statusHigh (−2.2%, −7.1%) Middle (−4.1%, −5.4%) Low (−5.2%, −8.1%)Physical activity Differences in prevalence, 2012 vs. 2006, 2017 vs. 2006 MEN: +0.7% (p: ns), +4.9% (p < 0.001)WOMEN: -4.7% (p < 0.001), +3.3% (p < 0.001)By socioeconomic statusHigh (−0.1%, +7.6%) Middle (−0.3%, +6.3%) Low (−2.1%, +3.6%) | |
| Marquez-Calderon 2014 [ref. 27] | Cross-sectionalEnquesta Domiciliaria sobre Alcohol y Droga en Espana (EDADES) Adults 15-64 yearsEnquesta Nacional de Salud de Espana (ENS) | Alcohol consumptionIn the last month (EDADES)Habitual (ENS)Smoking habitsIn the last month (EDADES)Daily (ENS)Drugs useIn the last month: sedatives, tranquilizer, hypnotics (EDADES)Last 2 weeks: antidepressants (ENS) | AlcoholPrevalence (%), 2005 vs. 2011 (EDADES) and 2006 vs. 2012 (ENS) EDADES: 64.6 vs. 62.3; ENS: 48.4 vs. 38.3SmokingPrevalence (%), 2005 vs. 2011 (EDADES) and 2006 vs. 2012 (ENS) EDADES: 38.4 vs. 37.6; ENS: 26.4 vs. 24.0DrugsPrevalence (%), 2005 vs. 2011 Sedatives (EDADES): 3.7 vs. 8.3; Tranquilizers (EDADES): 2.7 vs. 6.9;Hypnotics (EDADES): 2.0 vs. 3.4; Antidepressants (ENS): 8.5 vs. 7.0Physical activitySedentary lifestylePrevalence (%), 2006 vs. 2012: 39.4% vs. 41.3%Substance abusePrevalence (%), 2005 vs. 2011Cannabis: 8.7 vs. 7.0Ecstasy: 0.6 vs. 0.3Hallucinogens: 0.2 vs. 0.2Amphetamines: 0.4 vs. 0.3Cocaine powder: 1.6 vs. 1.1Cocaine base: 0.1 vs. 0.1Heroin: 0.1 vs. 0.1 | |
| Martin Bassols 2016 [ref. 28] | Cross-sectionalPeople aged 15-64 years N = 92,102 (2005: 27,400; 2007: 23,276; 2009: 19,713; 2011: 21,713) | Alcohol consumptionSmoking habitsSubstance abusemarijuana and hard drugs such as crack, cocaine, heroin, ecstasy, hallucinogens, inhalants, and amphetamines in the last 12 months, last 30 days, every day in last 30 days | AlcoholMean (%) 2005, 2007, 2009, 2011Alcohol in last 12 months: 76.63, 72.92, 79,17, 77.08Drunk in last 12 months: 22.01, 19.60, 27.16, 22.44Alcohol in last 30 days: 63.24, 58.98, 62.48, 60.58Alcohol every day in last 30 days: 12.05, 9.27, 9.31, 8.68By socioeconomic statusProbability (%) of consuming alcohol given a 10% increase in the provincial unemployment rateAlcohol in the past 12 months: −3.4 (p < 0.1)Not consuming any alcohol: +3 (p < 0.05)Consuming alcohol fewer than 20 days in the last year: 1.1 (p < 0.05)Consuming alcohol between 20 and 29 days during the last year: −0.1 (p < 0.05)Consuming alcohol between 30 and 150 during the last year: −1.7 (p < 0.05)Consuming alcohol more than 150 days during the last year: −2.3 (p < 0.05)SmokingMean (%) 2005, 2007, 2009, 2011Smoked in last 12 months: 31.81, 29.21, 31.78, 31.19By socioeconomic statusProbability (%) of smoking tobacco given a 10% increase in the provincial unemployment rateSmoked daily during the last 12 months: +3 (p < 0.01)Substance abuseDrug consumption in last 12 monthsMean (%) 2005, 2007, 2009, 2011Marijuana: 12.79, 10.56, 13.21, 11.38Hard drugs: 4.03, 3.73, 3.99, 3.47Cocaine: 3.31, 2.96, 3.09, 2.81Ecstasy: 1.46, 1.17, 1.19, 0.91Drug consumption in last 30 daysMean (%) 2005, 2007, 2009, 2011Marijuana: 9.79, 7.42, 9.40, 8.26Hard drugs: 2.21, 2.00, 1.93, 1.46Cocaine: 1.76, 1.64, 1.43, 1.33Ecstasy: 0.62, 0.41, 0.50, 0.33By socioeconomic statusProbability of using drugs in last 12 months given a 10% increase in the provincial unemployment rateMarijuana: +3.1 (p < 0.01)Hard drugs: +0.9 (ns)Cocaine: +1.2 (p < 0.01)Ecstasy: −0.4 (ns)Probability of using drugs in last 30 days given a 10% increase in the provincial unemployment rateMarijuana: +2.4 (p < 0.01)Hard drugs: +0.7 (ns)Cocaine: +0.9 (p < 0.1)Ecstasy: −0.2 (ns) | |
| Moreno Lostao 2019 [ref. 30] | Cross-sectionalSpanish National Health Survey.People aged 15–74 years | Tobacco consumptiondaily and occasional smokersPhysical inactivityno physical exercise and leisure time spent in sedentary habits | By socioeconomic statusSmokingAge-adjusted percentage ratio by sex and area of residence (rural vs. large urban areas), 2006, 2011 and 2016MEN: 0.99 (95% CI: 0.92–1.07), 0.90 (95% CI: 0.83–0.97), 0.89 (95% CI: 0.83–0.97)WOMEN: 1.09 (1.00–1.19), 0.96 (0.87–1.05), 1.03 (0.94–1.13)Physical activityAge-Adjusted percentage ratio of physical inactivity by sex and area of residence (rural vs. large urban areas), 2006, 2011 and 2016MEN: 0.89 (95% CI: 0.86–0.92), 0.89 (95% CI: 0.83–0.95), 0.86 (95% CI: 0.79–0.92)WOMEN: 1.02 (95% CI: 0.98–1.06), 0.98 (95% CI: 0.91–1.03), 0.99 (95% CI: 0.92–1.05) | |
| Perez-Romero 2016 [ref. 31] | Cross sectionalSpanish National Health SurveyAdults aged 18-64 yearsN = 30,817 (2006–2007: 18,202; 2011–2012: 12,615) | Drugs consumption hypnotics and anxiolytics in the last 2 weeks | DrugsAdjusted odds ratios (OR), 2011-2012 vs. 2006–2007MEN: OR 2.3 (95% CI: 1.8–2.8)WOMEN: OR 1.7 (95% CI: 1.4–1.9) | |
| Rajmil 2013 [ref. 33] | Cross-sectionalChildren <15 years old enrolled in Catalan Health Survey (ESCA)N = 4167 (2006: 2200; first wave 2010–2012: 1967) | Junk food consumptionHaving breakfast at home never vs. at least once per weekPhysical ActivityTime spent on screen | DietJunk food consumptionPrevalence (%), 2006 vs. 2010–201250.24 (95% CI: 49.74–50.74) vs. 52.34 (95% CI: 51.92–52.76)By socioeconomic statusMaternal education level: primary 47.46 vs. 50.14, secondary 50.21 vs. 52.13, university degree 52.79 vs. 53.78Family employment status: employed 50.35 vs. 52.70, unemployed 50.25 vs. 51.04Never having breakfastPrevalence (%), 2006 vs. 2010–2012:4.9 (95% CI: 3.8–6.0) vs. 5.4 (4.8–6.7).By socioeconomic statusMaternal education level: primary 5.9 vs. 7.7, secondary 5.1 vs. 6.4, university degree 3.5 vs. 2.7)Family employment status: employed 4.3 vs. 5.6, unemployed 8.8 vs. 4.4Physical activityPrevalence (%), 2006 vs. 2010–201250.14 (95% CI: 49.52–50.76) vs. 48.23 (95% CI: 47.59–48.87)By socioeconomic statusMaternal education level: primary 47.46 vs. 50.14, secondary 50.21 vs. 52.13, university degree 52.79 vs. 53.86Family employment status: employed 50.35 vs. 52.70, unemployed 50.25 vs. 51.04Time (hours/day) spent on screenMean, 2006 vs. 2010–20122.03 (95% CI: 1.98–2.07) vs. 1.41 (95% CI: 1.35–1.47)By socioeconomic statusMaternal education level: primary 2.16 vs. 1.73, secondary 2.08 vs. 1.53, university degree 1.77 vs. 1.07Family employment status: employed 4.3 vs. 5.6, unemployed 8.8 vs. 4.4 | |
| Regidor 2019 [ref. 35] | Cross-sectionalData taken from different sources | Alcohol consumptionTobacco consumptionnumber of cigarettessold per inhabitant aged ≥15 years;Fruit and vegetable intake measured by purchasePhysical activitygone to a gym in the last 30 days, in population aged ≥15 years | AlcoholAnnual percentage change (APC) in different time intervals: −0.1 (2004–2006) (ns) –2.3 (2008–2010) (p = 0.024)−0.2 (2011–2013) (ns) +2.1 (2014–2016) (p = 0.059)SmokingTobacco smokingAnnual percentage change (APC) in different time intervals: −1.9 (2004–2006) (ns) −8.3 (2008–2010) (p < 0.001) −13.5 (2011–2013) (p < 0.001)−1.1 (2014–2016) (ns)DietFruit and vegetable consumption: Annual percentage change (APC) in different time intervals: −0.1 (2004–2006) (ns)2.1 (2008–2010) (p < 0.001)1.2 (2011–2013) (p = 0.026)−1.9 (2014–2016) (p = 0.003)Away-from-home dinnersAnnual percentage change (APC) in different time intervals:−0.2 (2004–2006) (ns)–3.3 (2008–2010) (p < 0.001)−1.6 (2011–2013) (p = 0.009)3.2 (2014–2016) (p < 0.001)Physical activityGoing to a gymAnnual percentage change (APC) in different time intervals: 0.2 (2004–2006) (ns)4.4 (2008–2010) (p = 0.001) 1.6 (2011–2013) (ns)7.1 (2014–2016) (p < 0.001) | |
| Spijker 2018 [ref. 39] | Cross-sectionalCatalan Health Survey (ESCA)Adults aged >50 yearsN = 16,593 (2006: 6667; 2010–2012: 4458; 2013–2015: 5469) | Sedentary life | Physical activitySedentary lifePrevalence (%), 2006, 2010–2012, 2013–2015MEN:50–64 years old: 20.8, 18.3, 24.465+: 37.4, 28.0, 34.6WOMEN:50-64 years old: 18.9, 16.0, 22.565+: 41.7, 33.4, 41.9By socioeconomic statusOccupational status (employed, unemployed)Prevalence (%)2006: 0.26, 0.312010–2012: 0.23, 0.262013–2015: 0.28, 0.34 | |
| Trujillo-Aleman 2019 [ref. 40] | Cross-sectionalN = 5919 mothers (2003–2004: 2951; 2011–2012: 2698) | Smoking habitsdaily and not daily smokers | SmokingPrevalence (%), 2003–2004 vs. 2011–2012Couple mothers: 35.4 vs. 29.5 Lone mothers household heads: 42.7 vs. 39.1Lone mothers-non household heads: 78.1 vs. 42.3By socioeconomic statusSocial class (non-manual, manual)Lone mothers household heads vs. couple mothersAdjusted prevalence ratios, 2003-2004 2011-2012Non-manual: 1.26 (95% CI: 1.00–1.59) 1.23 (95% CI: 0.95–1.58)p interaction nsManual: 1.30 (95% CI: 1.08–1.57) 1.34 (95% CI: 1.08–1.66)p interaction ns | |
| Zapata Moya 2020 [ref. 42] | Cross-sectionalPeople aged > = 18N = 5679 | Anxiolytics and/or antidepressant consumption before 2008 and in the last two weeks before the interview (2015) | DrugsAdjusted OR: 2015 vs. 20081.51 (95% CI: 1.05–2.42)By socioeconomic statusInteraction between crisis impact on family SES and period (2015 vs. 2008)Adjusted OR: 2.18 (95% CI: 1.48–3.16) | |
| Zozaya 2020 [ref. 43] | Cross sectionalHealth Behavior in School-Aged Children (2002, 2006, 2010, 2014)Children and adolescents aged 9-21 years N = 77,651 | Alcohol consumption drinking any alcoholic beverage at leastevery weekSmoking habitfrequent or occasional smoking during the last year | AlcoholPrevalence (%), 2002, 2006, 2010, 201417.57, 18.29, 16.09, 7.11SmokingPrevalence (%) 2002, 2006, 2010, 201424.92, 16.10, 17.00, 10.00 | |
| COUNTRY: ITALY | ||||
| Bonaccio 2014 [ref. 18] | Cross-sectionalMoli-sani studyAdults aged > 35 yearsN = 21,001 | Alcohol intakeAdherence to Mediterranean diet (MD) measured through the Italian Mediterranean Index score | AlcoholMean grams/day of alcohol intake, 2005–2006 vs. 2007–201016.0 (SD: 21.8) vs. 16.9 (SD: 23.2) (p < 0.01)Diet% of high adherence to MD, 2005–2006 vs. 2007–201031.3 vs. 18.3 (p < 0.01)By socioeconomic statusPrevalence ratios (PR), 2005–2006 and 2007–2010High Wealth Index score vs. Low Wealth Index score: 1.05 (95% CI: 0.94–1.16) 1.31 (95% CI: 1.18–1.46)>13 years of education vs. < = 8 years of education: 1.16 (95% CI: 1.04–1.31) 1.32 (95% CI: 1.17–1.50)Manual non-manual job vs: 0.97 (95% CI: 0.82–1.15) 0.67 (95% CI: 0.57–0.79) | |
| Mattei 2017 [ref. 29] | Time trend analysisPeople aged > = 15 years | Alcohol consumptionSmoking habit | AlcoholOverall rate of people aged 15 or more who consume alcohol more than once per weekRegression coefficient (beta), 2008–2015 vs. 2000–2007−0.60 (95% CI: −0.96–−0.24)SmokingNumber of smokersRegression coefficient (beta), 2008–2015 vs. 2000–20071.68 (95% CI: 0.17–3.20) People who smoke more than 20 cigarettes per dayRegression coefficient (beta), 2008–2015 vs. 2000–20071.04 (95% CI: 0.45–1.62) | |
| Petrelli 2017 [ref. 32] | Cross-sectionalIstat National Health Interview Survey 2005 and 2013Adults aged 18–64 yearsN = 153,137 (2005: 80,661; 2013: 72,476) | Smoking habits | SmokingCurrent smokersPrevalence (%), 2005–2013Men: Italians 32.1–31.6, immigrants 33.7–32.5Women: Italians 20.4–20.0, immigrants 17.5–16.2 | |
| Sarti 2018 [ref. 37] | Time-trend analysisMultipurpose surveys on aspects on daily life (2005–2013)Adults aged 30–64 yearsN = 187,731 | Alcohol consumptionat least 1/2 L per day of alcoholic drinksUnbalanced dietmeat every day or fruit/vegetable consumption less than once a week or no vegetable oil useSmoking habit—current smokers—heavy smokers: > 20 cigarettes per dayPhysical activityPhysical inactivity: no activity in the workplace, at home, or voluntary | AlcoholAlcohol consumptionPrevalence (%), –20136.6, 6.4, 6.4, 5.7, 5.2, 4.9, 4.5, 3.9, 3.5SmokingCurrent smokersPrevalence (%), –201325.9, 27.2, 26.6, 26.7, 27.5, 27.2, 26.6, 26.2, 25.2Heavy smokersPrevalence (%), 2005–20138.6, 9.2, 8.8, 9.0, 8.8, 8.5, 8.1, 7.9, 7.0DietUnbalanced dietPrevalence (%), –201327.0, 26.6, 27.4, 27.5, 27.3, 26.8, 27.0, 26.0, 26.7Physical activityPhysical inactivityPrevalence (%), 2005–201313.3, 14.2, 13.7, 14.0, 14.1, 15.8, 14.5, 14.7, 14.5 | |
| COUNTRY: PORTUGAL | ||||
| Alves 2019 [ref. 14] | Cross-sectionalNational Health Interview SurveysAdults aged 25–79 yearsN = 43,273 (2005–2006: 41,193; 2014: 18,204) | Dietconsumption of food groups in the day before the interview Fruits or vegetables: the number of daysin the last week (2014) | DietPrevalence (%) of consumption, 2005/2006 vs. 2014fish 52 vs. 49 (p < 0.01)soup 68 vs. 64 (p < 0.01)fruit 82 vs. 73 (p < 0.01) vegetables 78 vs. 52 (p < 0.01)legumes 27 vs. 32 (p < 0.01)sweets/desserts 26 vs. 37 (p < 0.01) | |
| de Matos 2015 [ref. 21] | Time-trend analysisYoung people attending 6°, 8° and 10° year of schoolN = 15,953 (2014: 6026; 2010: 5050; 2006: 4877) | Smoking habitTobacco consumption:—never—every dayFruit or vegetable consumptionrarely or never; more than once per weekPhysical activitymore than 3 times per weekSubstance abusenever, more than once in a month, hashish more than once. | SmokingPrevalence (%), 2006, 2010, 2014never: 87.8, 88.1, 92.5every day: 5.0, 4.5, 2.6DietRarely or never eats fruitPrevalence (%), 2006, 2010, 20148.7, 7.7, 9.0Fruits more than once per weekPrevalence (%), 2006, 2010, 201422.2, 22.1, 21.2Rarely or never eats vegetablesPrevalence (%), 2006, 2010, 201412.2, 11.8, 14.6Vegetables more than once per weekPrevalence (%), 2006, 2010, 201411.7, 12.2, 13,3Physical activity (%)Prevalence (%), 2006, 2010, 201446.7, 48.2, 51.0Substance abusePrevalence (%) of consumption, 2006, 2010, 2014never: 95.5, 93.9, 96.7more than once in one month: 2.6, 3.4, 2.1hashish more than once: 8.2, 8.8, 8.8 | |
| Silva 2020 [ref. 38] | Cross-sectionalWorld Mental Health Survey Initiative Portugal (2008/09) and the National Mental Health Survey Follow-Up (2015/16)Adults aged 18+N = 911 | Drugsuse of psychotropic drugs in the previous 12 months | DrugsAny psychotropic drugAdjusted OR, 2015-16 vs. 2008-091.50 (95% CI:1.13–2.01)Interaction age*year: 18–49*2015–2016 1.95 (95% CI: 1.32–2.90)Interaction gender*year: men*2015–2016 1.85 (95% CI: 1.08–3.17)AntidepressantInteraction age*year: 18–49*2015–2016 1.68 (95% CI: 1.05–2.68)Hypnotics/sedatives1.60 (95% CI: 1.14–2.25)Interaction age*year: 18–49*2015–2016 2.16 (95% CI: 1.34–3.47)Interaction gender*year: men*2015–2016 2.60 (95% CI: 1.36–4.98) | |
| COUNTRY: GREECE | ||||
| Filippidis 2014 [ref. 23] | Cross-sectionalHellas Health I, II and IVAdults aged 18+ N = 3503 (2006: 1005; 2008: 1490; 2011: 1008) | Current smokersthose who smoke every day or occasionallyFruit and vegetable consumptiondaily number of portionsPhysical activityhigh, moderate, or low | SmokingDaily or occasional smokersDifference 2011–2008–2006 (%): −11.56, p for linear trend: 0.014By socioeconomic statusHigher: −18.62, nsMiddle: −1.06, nsLower: −24.35, p = 0.023DietAt least 5 daily portions of fruit and vegetablesDifference 2011–2008–2006 (%): −66.27, p for linear trend: 0.001By socioeconomic statusHigher: −68.79, p < 0.001Middle: −50.89, p < 0.001Lower: −81.76, p < 0.001Physical activityHigh or moderate level of physical activityDifference 2011–2008–2006 (%): +20.49 p for linear trend: 0.001By socioeconomic statusHigher: +10.66, nsMiddle: +22.44, p = 0.001Lower: +23.02, p < 0.001 | |
| Filippidis 2017 [ref. 24] | Cross-sectionalHellas Health I, II, III, IV, and VAdults aged 18+ N = 5504 (2006: 1005; 2008: 1490; 2010: 1000; 2011: 1008; 2015: 1001) | Smoking habitevery day or occasionallyFruit and vegetable consumptiondaily number of portionsPhysical activityhigh, moderate, or low | SmokingCurrent smokersPrevalence (%), 2008 and 201542.6 (95% CI: 40.0−45.1) 36.5 (95% CI: 33.3−39.7)Adjusted risk ratio (RR) 2015 vs. 2008: 0.86 (95% CI: 0.77−0.95)DietLow fruit/vegetable consumptionPrevalence (%), 2008 and 201552.1 (95% CI: 49.6−54.7) 51.2 (95% CI: 47.9−54.6)Adjusted risk ratio (RR) 2015 vs. 2008: 1.00 (95% CI: 0.92−1.09)Physical activitySedentary lifestylePrevalence (%), 2006 and 201543.4 (95% CI: 40.2−46.6) 29.0 (95% CI: 26.0−32.0)Adjusted risk ratio (RR), 2015 vs. 2006: 0.69 (95% CI: 0.61−0.79) | |
| Madianos 2014 [ref. 26] | Time-trend analysisGreek Population at censusN = 10,387,000 (1991), 10,964,000 (2001), 10,939,000 (2011) | Alcohol per capita consumption (liters)Antidepressant consumption (daily unit) | AlcoholPer capita consumption (liters), 2005 and 2011: 9.24 and 8.80DrugsDaily unit consumption of antidepressants, 2005 and 2011: 215.40, 284.85 | |
| Sanidas 2018 [ref. 36] | Retrospective studyHospitalized patients subjected tocardiac catheterizationN = 3895 (2006-07: 1228; 2011-15: 2667) | Current smokersat least 1 cigarette per day | SmokingPrevalence (%) of smokers, 2006–2007 vs. 2011–2015: 45.4 vs. 36.9, p = < 0.001 | |
| Venetsanou 2020 [ref. 41] | Cross-sectionalChildren attending childcare centers (mean age: 52.72 ± 3.55 months)N = 652 (2009: 182; 2012: 161; 2015: 165; 2018: 144) | Physical activitymeasured with Omron Walking style pro HJ-720IT-E2 pedometer | Physical activityStep counts, 2009, 2012, 2015, 2018 Weekly: 8032 ± 2026, 7816 ± 2087, 6708 ± 2739, 6943 ± 2729School-time: 3646 ± 1372, 3459 ± 1175, 3233 ± 1590, 2991 ± 1433Leisure-time 4906 ± 1300, 4899 ± 1321, 4026 ± 1531, 4312 ± 1466Weekend 6700 ± 2914, 7112 ± 2802, 5676 ± 3321, 6031 ± 3412Statistically significant differences between cohortSchool-time: 2009 vs. 2018Leisure-time: 2009 vs. 2015, 2009 vs. 2018, 2012 vs. 2015Weekend: 2009 vs. 2015, 2012 vs. 2015 | |
| Country: Multicenter | ||||
| Bosque-Prous 2017 [ref. 19] | Cross-sectionalEconomically active adults: 50–64 yearsN = 25,479 (2006: 8016; 2013: 17463) | Hazardous drinkingaverage daily consumption of >2 and >3 alcoholic drinks in the previous 3 monthsAbstentionnot drinking any alcoholic beverage during the 3 months prior to the interview | AlcoholHazardous drinkingChanges in the prevalence (%), 2006–2007 vs. 2013SPAINMEN: −5.4 (95% CI: −8.8–−2.0)WOMEN: −1.9 (95% CI: −5.7–−1.8)ITALYMEN: −5.6 (95% CI: −9.1–−2.2)WOMEN: −1.4 (95% CI: −4.7–−1.9)Adjusted prevalence ratio (PR), 2013 vs. 2006–2007SPAINMEN: PR = 0.42 (95% CI: 0.23–0.81)WOMEN: PR = 0.67 (95% CI: 0.24–1.97)ITALYMEN: PR = 0.44 (95% CI: 0.27–0.79)WOMEN: PR = 0.63 (95% CI: 0.21–1.70)AbstentionChanges in the prevalence (%), 2006–2007 vs. 2013SPAINMEN: 3.3 (95% CI: −1.9–8.4)WOMEN: 3.5 (95% CI: −4.7–11.7)ITALYMEN: 6.8 (95% CI: 1.1–12.4)WOMEN: 5.2 (95% CI: −3.0–13.4)Number of drinks per drinker per weekCrude relative risks (RR), 2013 vs. 2006–2007SPAINMEN: RR 0.59 (95% CI: 0.43–0.82)WOMEN: RR 0.63 (95% CI: 0.35–1.14)ITALYMEN: RR 0.65 (95% CI: 0.52–0.81)WOMEN: RR 0.60 (95% CI: 0.38–0.93) | |
| Rathmann 2017 [ref. 34] | Cross-sectionalAdolescents aged 15 Health Behaviour in School-aged Children (HBSC) study 2009–2010 N = 6554 (Greece n = 1606, Italy n = 1495, Portugal n = 1511, Spain n = 1942) | Smoking habitregular smokers: adolescents who smoke at least weekly | SmokingRegular smokersPrevalence (%) 2005–2006 vs. 2009–2010Greece (16.2 vs. 15.2; −6.1%), Italy (19.8 vs. 22.3; +12.6%), Portugal (10.5 vs. 10.8; +3.1%), Spain (17.7 vs. 18.5; +4.6%) | |
*: for stratified analysis, we report results of association when at least one strata is statistically significant.
Regarding the outcomes considered, most of the studies concerned diet (n = 18) and smoking habit (n = 17), followed by alcohol consumption (n = 15) and physical activity (n = 13). Antidepressant/anxiolytic/antipsychotic drug use was examined by nine studies and substance abuse by six. In order to report briefly the main findings of the studies from a public health perspective, we created Table 2, which shows the variation in health behavior during or after the 2008 crisis by means a symbol for each risk behavior.
Table 2: Variation of behavior influencing health status during or after the 2008 financial crisis.
| First Author | Country | Alcohol | Smoking | Healthy Diet | Physical Activity | Drugs | Substance Abuse |
|---|---|---|---|---|---|---|---|
| Aguilar-Palacio 2015 [ref. 13] | Spain | − | − | ||||
| Arroyo 2018 [ref. 15] | Spain | − | |||||
| Bartoll 2015 [ref. 16] | Spain | − | + | − | + | − | |
| Blázquez-Fernández 2019 [ref. 17] | Spain | = | |||||
| Bosque-Prous 2017 [ref. 19] | Spain | − | |||||
| Colell 2015 [ref. 20] | Spain | − | + | − | |||
| Diaz-Mendez 2019 [ref. 22] | Spain | − | |||||
| Garcia Mayor 2020 [ref. 25] | Spain | − | − | − | + | ||
| Marquez-Calderon 2014 [ref. 27] | Spain | − | − | − | + | − | |
| Martin Bassols 2016 [ref. 28] | Spain | − | = | − | |||
| Moreno Lostao 2019 [ref. 30] | Spain | N/A | N/A | ||||
| Perez-Romero 2016 [ref. 31] | Spain | + | |||||
| Rajmil 2013 [ref. 33] | Spain | − | − | ||||
| Rathmann 2017 [ref. 34] | Spain | + | |||||
| Regidor 2019 [ref. 35] | Spain | − | − | + | + | ||
| Spijker 2018 [ref. 39] | Spain | − | |||||
| Trujillo-Aleman 2019 [ref. 40] | Spain | − | |||||
| Zapata Moya 2020 [ref. 42] | Spain | + | |||||
| Zozaya 2020 [ref. 43] | Spain | − | − | ||||
| Bonaccio 2014 [ref. 18] | Italy | + | − | ||||
| Bosque-Prous 2017 [ref. 19] | Italy | − | |||||
| Mattei 2017 [ref. 29] | Italy | − | + | ||||
| Petrelli 2017 [ref. 32] | Italy | − | |||||
| Rathmann 2017 [ref. 34] | Italy | + | |||||
| Sarti 2018 [ref. 37] | Italy | − | − | = | − | ||
| Alves 2019 [ref. 14] | Portugal | − | |||||
| de Matos 2015 [ref. 21] | Portugal | − | − | + | − | ||
| Rathmann 2017 [ref. 34] | Portugal | + | |||||
| Silva 2020 [ref. 38] | Portugal | + | |||||
| Filippidis 2014 [ref. 23] | Greece | − | − | + | |||
| Filippidis 2017 [ref. 24] | Greece | − | = | + | |||
| Madianos 2014 [ref. 26] | Greece | − | + | ||||
| Sanidas 2018 [ref. 36] | Greece | − | |||||
| Venetsanou 2020 [ref. 41] | Greece | − | |||||
| Rathmann 2017 [ref. 34] | Greece | − |
Note: statistically significant decrease (−); increase (+) or no variation (=) in the prevalence of healthy behavior; N/A: not applicable.
Regarding study quality, the available evidence was affected by a high risk of bias for exposure and for outcome assessment due to the study design, use of self-reported measures, and lack of adjusting for potential confounding factors. Supplementary Table S2 summarizes the NOS assessment of the included studies, which obtained scores between 2 and 7, with an average score of 4.7; four studies appeared to be of very low quality (total score 2 or 3). Confidence in ascertainment of exposure and of outcome assessment was very low in most studies. Even though most studies used a large sample of individual-level data, most data were collected by surveys that collected information using questionnaires on self-reported changes in several indicators on health-related behaviors as well as on consumption of medications. Some studies used aggregate data, which could mask individual-level effects, or self-reported questionnaires that had not been previously validated. Only six studies received a total score of >7, which was considered high quality.
3.1. The Financial Crisis and Lifestyle-Related Behaviors
3.1.1. The Financial Crisis and Alcohol Consumption
Compared to the pre-crisis period, alcohol consumption decreased during or after among adults in Spain, Greece, and Italy [ref. 16,ref. 19,ref. 20,ref. 25,ref. 26,ref. 27,ref. 28,ref. 29,ref. 35], and among young Spanish people [ref. 13,ref. 43]. Two studies showed a significant upward overall trend in binge drinking [ref. 20]. Conversely, two studies provided evidence of increased prevalence of moderate [ref. 18] and heavy alcohol intake after the recession [ref. 16], while a Spanish study showed no differences [ref. 17].
When stratifying by socioeconomic level, controversial results were observed. Two studies suggested a widening of socioeconomic inequalities, although this effect is due to contrasting results: one study showed that heavy alcohol consumption increased during the crisis among the least educated men [ref. 16], while another showed an increase among the most educated people [ref. 17]. Finally, a more relevant reduction in alcohol intake among the lower class was also observed elsewhere, showing a narrowing of inequalities [ref. 25].
3.1.2. The Financial Crisis and Smoking
Similarly to alcohol consumption, smoking habit also appeared to decrease markedly in most studies conducted in different settings or subgroups: young Spanish men aged 16-24 [ref. 13], adolescents in Portugal [ref. 21] and Spain [ref. 43], and adults in Greece [ref. 23,ref. 24] and Spain (only men) [ref. 25]. A reduction in smoking prevalence was observed in Spain also when stratifying by the size of the municipality [ref. 30], in a sample of patients hospitalized for cardiac catheterization [ref. 36], and in a sample of Spanish mothers [ref. 40]. A few studies reported a slight decrease [ref. 27,ref. 32], no difference [ref. 37], or a slight increase in the percentage of smokers after or during the crisis, for only women [ref. 16] in Spain and for both sexes in Italy [ref. 29,ref. 34], Portugal, and Spain [ref. 34].
Regarding socioeconomic status, controversial associations were reported during or after the crisis: a reduction in inequalities was identified by some studies, where percentages of daily or occasional smokers decreased more for those with a lower educational level [ref. 16], lower socioeconomic status [ref. 23], or having a manual occupation [ref. 40]. Conversely, other studies found an increase in socioeconomic inequalities due to an increase in smoking consumption among the unemployed [ref. 13,ref. 28,ref. 37,ref. 43] and among people belonging to a lower social class [ref. 25].
3.1.3. The Financial Crisis and Healthy Diet
Generally speaking, a deterioration in the quality of diet was observed during and after the crisis. Several studies showed a reduction in the consumption of meat [ref. 16], fish [ref. 14,ref. 22], fruits [ref. 14,ref. 16,ref. 21,ref. 22,ref. 23,ref. 24,ref. 25], and vegetables [ref. 14,ref. 22,ref. 23,ref. 24] in Spain and Portugal, although in Portugal the consumption of vegetables increased among young people [ref. 21], and legumes were more frequently consumed [ref. 14,ref. 16]. Sweets and desserts were more often consumed by adults in Portugal [ref. 14] and Spain [ref. 16].
Several studies reported an increase in socioeconomic inequalities in healthy diet, especially regarding fruits and vegetables. In Spain, the probability of declaring eating fruit daily decreased more among unemployed men and least educated men, and the probability of declaring eating vegetables daily among unemployed men and women and the least educated women [ref. 16]. Two other Spanish studies reported an increase in inequalities in the consumption of fruits and vegetables [ref. 22,ref. 25].
Similar results were observed regarding fish consumption [ref. 22]. During the crisis in Italy, the socioeconomic differences in adherence to the Mediterranean diet widened, becoming less probable among people with a low wealth index score, those with a lower education level, and those performing manual labor [ref. 18]. One study conducted in Spain on young people below the age of 15 reported that the prevalence of junk food consumption increased in families with low maternal education level [ref. 33].
3.1.4. The Financial Crisis and Physical Activity
Most of the studies highlighted an increase in physical activity in the adult population when comparing the periods after vs before the financial crisis, which was more robust and statistically significant in Spain [ref. 25,ref. 35] and Greece [ref. 23,ref. 24], and slighter in Portugal [ref. 21], while a limited reduction was observed in the few studies in adults [ref. 37] and in children [ref. 33,ref. 41].
Two Spanish studies reported an increase in socioeconomic inequalities in physical activity during and after the crisis. In one, an increase in the prevalence of physical activity was observed in all social classes, but this was slighter in the lower class, resulting in an increase in socioeconomic differences [ref. 25]. The other study observed that physical activity increased during or after the crisis among more educated women and decreased among the less educated, causing a widening of socioeconomic inequalities [ref. 16].
Instead, a Greek study showed a reduction in inequalities due to a significant increase in percentages of adults only, with those with a middle or lower socioeconomic status reporting high or moderate level of physical activity [ref. 24].
3.1.5. The Financial Crisis and Use of Antidepressant, Anxiolytic, and/or Antipsychotic Drugs
Most studies reported an increase in any type of psychotropic drug use among all individuals considered [ref. 31,ref. 42] or only among women [ref. 16]. In a Spanish study performed on the economically active population, heavy use of hypnotics/sedatives among men and women increased in the period examined [ref. 20]. In a population study conducted in Portugal, the odds of consuming any psychotropic drug was estimated to be 1.5 times higher than before the crisis, and when evaluating the interaction effect of the year with sex and age, men and younger individuals reported higher odds of consuming any psychotropic drug [ref. 38]. Bartoll et al. [ref. 16] observed a stable trend in tranquilizer tablet use among men and a decrease among women.
This general increasing trend was not homogeneously reported for all psychotropic drugs: specifically, Marquez Calderon et al. [ref. 27] found an increase in sedative, tranquilizer, and hypnotic drugs, while antidepressant use decreased. According to Arroyo [ref. 15], only sedative use increased, and Madianos et al. evaluated only antidepressant use, finding an increase in its use in Greece [ref. 26].
When considering socioeconomic status, according to Arroyo et al. [ref. 15], the probability of consuming antidepressants or sedatives depended on employment status: in the case of individuals in short-term unemployment, both men and women showed that between 2006–2007 and 2011–2012, there was an increase in the risk of using sedatives. However, this increase was greater for women than for men. For the long-term unemployed, however, the differences between both sexes widened between 2006–2007 and 2011–2012: the risk of using sedatives in women increased, whereas it decreased in men, while antidepressant consumption decreased overall, and more markedly among short- and long-term unemployed subjects. Regarding education level, there was an increase in the intake of tranquilizers among those without any qualification and a slight decrease for men with high secondary education; among women, there was a drop-in intake, which was greater among those employed and those without any qualification [ref. 16].
Finally, an increase in psychotropic drug consumption was observed among households whose socioeconomic status was most affected by the crisis [ref. 42].
3.1.6. The Financial Crisis and Substance Abuse
One of the included studies described a stable or a slight downward trend in drug use [ref. 28]. A study performed in Portugal on adolescents reported a slight decrease in monthly drug use [ref. 21]. A decrease in cocaine, marijuana, ecstasy, and hard drug use caused by the economic downturn, which could have affected the prices of these drugs, was observed by a Spanish study [ref. 28]. According to another Spanish study, overall cannabis use remained stable during the crisis, but unemployed men and women were more likely to have increased sporadic use compared to their employed counterparts [ref. 20]. Given a 10% increase in the provincial unemployment rate in Spain, an increase in the probability of using marijuana and cocaine in the last 30 days and also over the previous 12 months was observed [ref. 28].
4. Discussion
Since the financial crisis of 2008, southern European countries, in particular Italy, Greece, Spain, and Portugal, have been affected by the economic recession [ref. 44,ref. 45,ref. 46].
The research articles included in our review, published between 2011 and 2020, concerned the impact of the crisis on unhealthy behaviors, such as smoking habit [ref. 13,ref. 16,ref. 21,ref. 23,ref. 24,ref. 25,ref. 27,ref. 28,ref. 29,ref. 30,ref. 32], alcohol consumption [ref. 13,ref. 16,ref. 17,ref. 18,ref. 19,ref. 20,ref. 25,ref. 26,ref. 27,ref. 28,ref. 29,ref. 35,ref. 37,ref. 43], antidepressant/anxiolytic/antipsychotic use [ref. 15,ref. 16,ref. 20,ref. 26,ref. 27,ref. 31,ref. 38,ref. 42], and substance abuse [ref. 20,ref. 21,ref. 27,ref. 28] and on healthy behaviors, such as physical activity [ref. 16,ref. 21,ref. 23,ref. 24,ref. 25,ref. 27,ref. 30,ref. 33,ref. 35]. The studies on diet examined the impact of the crisis both on favorable and unfavorable eating behavior, a classification depending on the type of food considered for analyses [ref. 14,ref. 16,ref. 18,ref. 21,ref. 22,ref. 23,ref. 24,ref. 25,ref. 33,ref. 35,ref. 37].
According to the findings of our extensive review, we observed controversial effects on healthy behaviors in the period characterized by the 2008 financial crisis.
In general, the studies found that alcohol consumption [ref. 13,ref. 16,ref. 19,ref. 20,ref. 25,ref. 26,ref. 27,ref. 28,ref. 29,ref. 35,ref. 43] and substance abuse [ref. 21,ref. 28] decreased during or after the Great Recession, while psychotropic drug use increased [ref. 16,ref. 20,ref. 31,ref. 38,ref. 42].
A deterioration in proper eating habits was also observed [ref. 14,ref. 16,ref. 21,ref. 22,ref. 23,ref. 24,ref. 25], but some comments regarding diet are necessary. In fact, although most of the studies report an overall worsening of eating behavior during the crisis, the evaluation of its impact is more complex than it is for the other lifestyle-related behaviors. A reduction in the consumption of fish and meat, probably due to the reduction in available income, was observed, as was a reduction in fruit and vegetable consumption; both of these phenomena could cause a shift toward a worse diet. The crisis effect could have also contributed to determine the decrease in consumption of fruits and vegetables and the increase in junk food, sweets, and dessert consumption. Social inequality in proper eating habits generally increased because of the economic crisis [ref. 16,ref. 18,ref. 22,ref. 25,ref. 33]: several studies observed a decrease in the consumption of fruits and vegetables and an increase in junk food consumption among people with a low socioeconomic status.
However, even before the crisis, a decline in adherence to the Mediterranean diet had been observed in the younger population, so that a reduction in the mean consumption of fruit and vegetables was expected. Therefore, this decline may not be solely attributed to the economic crisis [ref. 23].
Most studies also showed an overall decrease in alcohol [ref. 13,ref. 16,ref. 19,ref. 20,ref. 25,ref. 26,ref. 27,ref. 28,ref. 35,ref. 37] and tobacco [ref. 13,ref. 21,ref. 23,ref. 24,ref. 25,ref. 27,ref. 32,ref. 34,ref. 35,ref. 36,ref. 37,ref. 40,ref. 43] consumption, while some highlighted an increase in tobacco consumption [ref. 16,ref. 29,ref. 34]. However, the pre- to post crisis variation in drinking and smoking habit were heterogeneous across socioeconomic levels, depending on the contexts and the dimension used to define socioeconomic status. For example, a study showed an increase in heavy alcohol consumption during the crisis among individuals with the lowest education level [ref. 16].
Less income available to purchase alcohol might have been behind the decrease in heavy drinking, while binge drinking could have increased as a means to deal with anxiety and emotional distress related to job loss, whether real or threatened, and to financial hardship [ref. 20]. However, it has been argued that a process of change in the pattern of alcohol use is taking place in Mediterranean countries such as Spain, where alcohol has traditionally been embedded in daily life, with wine drunk regularly with meals [ref. 20].
The decrease in tobacco use during times of economic downturn is related to price increases; it is likely that tobacco control measures may have interacted synergistically with the decline in disposable income. Therefore, austerity may have been a driving force in the decline among low-income individuals, along with the other public health measures [ref. 23].
Most of the studies found a slight increase in physical activity during the crisis [ref. 16,ref. 21,ref. 23,ref. 24,ref. 25,ref. 35], while other studies found a slight increase in sedentary habits [ref. 27,ref. 33,ref. 37,ref. 39,ref. 41]. There was an increase in socioeconomic differences in the prevalence of physical activity [ref. 16,ref. 25], with a heterogeneous gradient according to socioeconomic status.
The reduction in substance abuse observed during the crisis was slight, and generally referred to soft drugs [ref. 20,ref. 21,ref. 27,ref. 28], without any significant differences in terms of socioeconomic status.
Most studies reported an increase in the use of any psychotropic drug [ref. 20,ref. 26,ref. 27,ref. 31,ref. 38,ref. 42].
The decreased availability of income during the recession may have determined a reduction in the purchase of tobacco, alcohol, and drugs, but also of more expensive and healthier food. On the contrary, the increase in the use of psychotropic drugs can be considered a kind of coping mechanism against the insecurity and stress related to the economic crisis.
Our review appears to confirm previous evidence [ref. 47,ref. 48] that the financial crisis had an impact on socioeconomic inequalities and that negative effects on health tended to be more pronounced among the culturally, economically, and socially disadvantaged.
The low socioeconomic strata experienced inequalities in access to cultural and material resources (e.g., education, working conditions, income), which determined worse health and limited access to appropriate health care. These inequalities grew over the course of the global crisis, and the recession period could have accelerated the accumulation of such disadvantages [ref. 10,ref. 49,ref. 50].
The crisis itself may have played an independent, additional role, acting as a chronic stressor. Furthermore, it is possible that unemployed people and those at risk of unemployment or who experienced work instability may have had less time to dedicate to themselves and to their lifestyle, including food choice and physical activity [ref. 29].
In this scenario, the COVID-19 pandemic has exacerbated inequalities with a cumulative effect of the risks [ref. 51]. In England, as already shown in the Marmot Review, COVID-19 infection and mortality risks have been much higher for those living in more deprived areas, in overcrowded housing, in key workers in close proximity to others, in those from minority groups, in those with underlying health conditions, and in those who are older and/or male [ref. 52]. Furthermore, due to the effects of the mobility restrictions and the periods of lockdown as well as to the impoverishment of many sections of the population, it is reasonable to expect a further deterioration in lifestyles, especially among the people most affected by the economic crisis generated by the pandemic [ref. 53].
In fact, most countries were forced to introduce confinement measures to minimize the propagation of the SARS-CoV-2 virus, and for many people, it was difficult to maintain a healthy lifestyle, in particular a proper diet, regular physical exercise, quality of sleep, and limited smoking and alcohol consumption [ref. 53,ref. 54,ref. 55,ref. 56,ref. 57,ref. 58,ref. 59,ref. 60,ref. 61,ref. 62,ref. 63,ref. 64,ref. 65,ref. 66,ref. 67,ref. 68,ref. 69]. However, similar to the analysis reporting on the 2008 recession, the effects on diet are not unidirectional. In fact, many people used the period of home isolation to improve their eating habits and to limit dietary excesses and bad eating behaviors. Having the opportunity to devote time daily to having breakfast and to cooking meals resulted in an increase in the consumption of fruit, vegetables, and pulses [ref. 56,ref. 60,ref. 64,ref. 67,ref. 68], and a general decrease in alcohol consumption [ref. 56,ref. 66,ref. 67].
Strengths and Limitations
Our review of the impact of the 2008 financial crisis on many health behaviors aimed to shed light on the links between changes in habits and health outcomes, an issue that has not yet been systematically investigated [ref. 3]. The focus on four southern European countries represents an added value, as they were hit harder by the crisis than were other European countries.
By focusing exclusively on health outcomes, our study did not look at the impact of the crisis on health systems, such as shortages in the health workforce or in medical supplies, for which several studies have shown a negative trend during the financial crisis [ref. 3,ref. 70,ref. 71].
The exact moment the financial crisis began is difficult to establish, and some studies, reporting data on different countries, have defined the duration of the crisis differently; this may have had an impact on the homogeneity of the reported results. The included studies had a high risk of bias in exposure and outcome assessment due to the study design, use of self-reported measures, and the lack of adjusting for potential confounding factors. Further, some observational studies did not apply any statistical tests [ref. 21,ref. 22,ref. 26,ref. 27,ref. 32,ref. 34,ref. 37,ref. 39,ref. 43]. Most importantly, although the studies included in our review investigated changes in population health status and health behaviors associated with the Great Recession, it cannot be established whether this was a causal relationship.
Due to the nature of the data of most of the included studies, which were not designed to measure exposure at the individual level, no causal relationship between the economic recession and changes in lifestyles can be established. We can, however, state that these changes occurred after the crisis. In fact, although a causal association between the financial crisis and trends in risk factors seems reasonable, we cannot exclude unmeasured confounding, which would provide alternative explanations for the observed trends. On the other hand, the financial crisis is a natural experiment at the population level and the possibility of its effects on the findings may be supposed [ref. 23].
Finally, self-reported information collected by questionnaire, as was the case for most of the included studies, may have been affected by information bias.
5. Conclusions
Our results seem to show that the crisis has had a negative effect on eating habits and a positive effect on alcohol consumption and on smoking, the consequence of mechanisms probably determined by decreased available income. Psychophysical stress linked to unemployment and job loss, as well as the worsening mental health observed in numerous studies, could explain the increase in the consumption of antidepressant and anxiolytic drugs.
These results suggest the need to implement health policies aimed at monitoring risk behaviors and for interventions aimed at contrasting the effects of the financial crisis in the countries studied. Inequalities in health behaviors should also be a priority area for action. Financial recommitment to public health system should accompany a substantial commitment to tackling the social determinants of poor health and wellbeing.
The identification of lifestyles and socioeconomic inequalities produced by the 2008 crisis may facilitate the understanding and the response to the possible effects of the current COVID-19 crisis.
The current pandemic provides harsh lessons on the societal vulnerabilities that arise from inequality. Investing in young people and supporting long-deprived regions and sectors of society are arguably the most powerful ways to break the chain of inequality transmitted from generation to generation. Adopting a broadened, equity-focused approach to population health should be an essential part of building a more resilient society that is better prepared to weather future pandemics.
References
- 1.International Monetary FundWorld Economic OutlookInternational Monetary FundWashington, DC, USA2011
- M. Karanikolos, P. Mladovsky, J. Cylus, S. Thomson, S. Basu, D. Stuckler, J.P. Mackenbach, M. McKee. Financial crisis, austerity, and health in Europe. Lancet, 2013. [DOI | PubMed]
- D. Parmar, C. Stavropoulou, J.P. Ioannidis. Health outcomes during the 2008 financial crisis in Europe: Systematic literature review. BMJ, 2016. [DOI | PubMed]
- M. Karanikolos, P. Heino, M. McKee, D. Stuckler, H. Legido-Quigley. Effects of the global financial crisis on health in high-income Oecd countries: A Narrative Review. Int. J. Health Serv., 2016. [DOI | PubMed]
- 5.WHOImpact of the Economic Crises on Mental HealthWorld Health OrganisationCopenhagen, Denmark2011134
- D. Zavras, A.I. Zavras, I.I. Kyriopoulos, J. Kyriopoulos. Economic crisis, austerity and unmet healthcare needs: The case of Greece. BMC Health Serv. Res., 2016. [DOI | PubMed]
- A. Petrelli, A. Rosano, A. Rossi, C. Mirisola, C. Cislaghi. The geography and economics of forgoing medical examinations or therapeutic treatments in Italy during the economic crisis. BMC Public Health, 2019. [DOI | PubMed]
- J.P. Mackenbach, I. Kulhánová, B. Artnik, M. Bopp, C. Borrell, T. Clemens, G. Costa, C. Dibben, R. Kalediene, O. Lundberg. Changes in mortality inequalities over two decades: Register based study of European countries. BMJ, 2016. [DOI]
- K. Heggebø, A.G. Tøge, E. Dahl, J.E. Berg. Socioeconomic inequalities in health during the Great Recession: A scoping review of the research literature. Scand. J. Public Health, 2019. [DOI | PubMed]
- M.C. de Goeij, M. Suhrcke, V. Toffolutti, D. van de Mheen, T.M. Schoenmakers, A.E. Kunst. How economic crises affect alcohol consumption and alcohol-related health problems: A realist systematic review. Soc. Sci. Med., 2015. [DOI | PubMed]
- G.E. Nagelhout, K. Hummel, M.C.M. de Goeij, H. de Vries, E. Kaner, P. Lemmens. How economic recessions and unemployment affect illegal drug use: A systematic realist literature review. Int. J. Drug Policy, 2017. [DOI | PubMed]
- G. Wells, B. Shea, D. O’Connell, J. Peterson, V. Welch, M. Losos, P. Tugwell. The Newcastle–Ottawa Scale (NOS) for Assessing the Quality of Non-Randomized Studies in Meta-Analysis. 2000
- I. Aguilar-Palacio, P. Carrera-Lasfuentes, M.J. Rabanaque. Youth unemployment and economic recession in Spain: Influence on health and lifestyles in young people (16–24 years old). Int. J. Public Health, 2015. [DOI | PubMed]
- R. Alves, J. Perelman. Dietary changes during the Great Recession in Portugal: Comparing the 2005/2006 and the 2014 health surveys. Public Health Nutr., 2019. [DOI | PubMed]
- E. Arroyo, A. Cabrera-Leon, G. Renart, C. Saurina, L. Serra Saurina, A. Daponte, M. Saez. Did psychotropic drug consumption increase during the 2008 financial crisis? A cross-sectional population-based study in Spain. BMJ Open, 2019. [DOI | PubMed]
- X. Bartoll, V. Toffolutti, D. Malmusi, L. Palencia, C. Borrell, M. Suhrcke. Health and health behaviours before and during the Great Recession, overall and by socioeconomic status, using data from four repeated cross-sectional health surveys in Spain (2001–2012). BMC Public Health, 2015. [DOI | PubMed]
- C. Blázquez-Fernández, D. Cantarero-Prieto, P. Perez. Do the unemployed hit the bottle during economic downturns? An empirical approach for Spain. BMC Public Health, 2019. [DOI | PubMed]
- M. Bonaccio, A. Di Castelnuovo, A. Bonanni, S. Costanzo, F. De Lucia, M. Persichillo, F. Zito, M.B. Donati, G. de Gaetano, L. Iacoviello. Decline of the Mediterranean diet at a time of economic crisis. Results from the Moli-sani study. Nutr. Metab. Cardiovasc. Dis., 2014. [DOI | PubMed]
- M. Bosque-Prous, A.E. Kunst, M.T. Brugal, A. Espelt. Changes in alcohol consumption in the 50- to 64-year-old European economically active population during an economic crisis. Eur. J. Public Health, 2017. [DOI | PubMed]
- E. Colell, A. Sanchez-Niubo, G.L. Delclos, F.G. Benavides, A. Domingo-Salvany. Economic crisis and changes in drug use in the Spanish economically active population. Addiction, 2015. [DOI | PubMed]
- M.G. de Matos, M. Reis, I. Camacho, C. Simoes, D. Gomez-Baya, C. Mota, G. Tome, T. Gaspar, M. do Ceu Machado. In times of economic recession, did Portuguese adolescents stay healthy so far, but no longer happy?. Arq. Med., 2015
- C. Diaz-Mendez, I. Garcia-Espejo. Social Inequalities in Following Official Guidelines on Healthy Diet During the Period of Economic Crisis in Spain. Int. J. Health Serv., 2019. [DOI | PubMed]
- F.T. Filippidis, S. Schoretsaniti, C. Dimitrakaki, C.I. Vardavas, P. Behrakis, G.N. Connolly, Y. Tountas. Trends in cardiovascular risk factors in Greece before and during the financial crisis: The impact of social disparities. Eur. J. Public Health, 2014. [DOI | PubMed]
- F.T. Filippidis, V. Gerovasili, C. Millett, Y. Tountas. Medium-term impact of the economic crisis on mortality, health-related behaviours and access to healthcare in Greece. Sci. Rep., 2017. [DOI | PubMed]
- J. Garcia-Mayor, A. Moreno-Llamas, E. De la Cruz-Sanchez. Inequalities in the long-term impact of the economic recession on preventive healthcare use and health-related lifestyle in Spain (2006–2017). Health Soc. Care Community, 2021. [DOI | PubMed]
- M.G. Madianos, T. Alexiou, A. Patelakis, M. Economou. Suicide, unemployment and other socioeconomic factors: Evidence from the economic crisis in Greece. Eur. J. Psychiat., 2014. [DOI]
- S. Marquez-Calderon, R. Villegas-Portero, V. Gosalbes Soler, F. Martinez-Pecino. Health promotion and prevention in the economic crisis: The role of the health sector. SESPAS report 2014. Gac. Sanit., 2014. [PubMed]
- N. Martin Bassols, J. Vall Castello. Effects of the great recession on drugs consumption in Spain. Econ. Hum. Biol., 2016. [DOI | PubMed]
- G. Mattei, R. De Vogli, S. Ferrari, L. Pingani, M. Rigatelli, G.M. Galeazzi. Impact of the economic crisis on health-related behaviors in Italy. Int. J. Soc. Psychiatry, 2017. [DOI | PubMed]
- A. Moreno-Lostao, J.M. Guerras, L. Lostao, L. de la Fuente, D. Martinez, F. Rodriguez-Artalejo, E. Regidor. Cardiovascular mortality and risk behaviours by degree of urbanization before, during and after the economic crisis in Spain. BMC Public Health, 2019. [DOI | PubMed]
- S. Perez-Romero, J.J. Gascon-Canovas, E. de la Cruz-Sanchez, J.F. Sanchez-Ruiz, P. Parra-Hidalgo, O. Monteagudo-Piqueras. Economic recession (2006–2012) and changes in the health status of the Spanish population. Salud Publica Mex, 2016. [PubMed]
- A. Petrelli, A. Di Napoli, A. Rossi, G. Costanzo, C. Mirisola, L. Gargiulo. The variation in the health status of immigrants and Italians during the global crisis and the role of socioeconomic factors. Int. J. Equity Health, 2017. [DOI | PubMed]
- L. Rajmil, A. Medina-Bustos, M.J. Fernandez De Sanmamed, A. Mompart-Penina. Impact of the economic crisis on children’s health in Catalonia: A before-after approach. BMJ Open, 2013. [DOI]
- K. Rathmann, T.K. Pfortner, F.J. Elgar, K. Hurrelmann, M. Richter. The great recession, adolescent smoking, and smoking inequalities: What role does youth unemployment play in 24 European Countries?. Nicotine Tob. Res., 2017. [DOI | PubMed]
- E. Regidor, R. Albaladejo, A. Mateo, L. de la Fuente, G. Barrio, P. Ortega. Macroeconomic fluctuations, changes in lifestyles and mortality from diabetes: A quasi experimental study. J. Epidemiol. Community Health, 2019. [DOI | PubMed]
- E.A. Sanidas, T.G. Papaioannou, D.P. Papadopoulos, K. Tatsi, M. Velliou, N. Dalianis, I. Paizis, G. Anastasiadis, G. Kelepesis, M. Bonou. The impact of financial crisis on coronary artery disease burden in Greece. Hellenic J. Cardiol., 2019. [DOI | PubMed]
- S. Sarti, M. Terraneo, M. Tognetti Bordogna. Stili di vita nell’Italia della crisi: Il cambiamento nelle abitudini insalubri secondo le condizioni lavorative. Sociologia del Lavoro, 2018. [DOI]
- M. Silva, A. Antunes, S. Azeredo-Lopes, G. Cardoso, M. Xavier, B. Saraceno, J.M. Caldas-De-Almeida. How did the use of psychotropic drugs change during the Great Recession in Portugal? A follow-up to the National Mental Health Survey. BMC Psychiatry, 2020. [DOI | PubMed]
- J. Spijker, P. Zueras. Socioeconomic health inequalities in the Catalan population aged 50+ during the last economic crisis. Rev. Esp. Salud Publica, 2018
- S. Trujillo-Aleman, G. Perez, V. Puig-Barrachina, M. Gotsens, J. Reynolds, S. Rueda, C. Borrell. Inequalities in health and health behaviours between couple and lone mothers before and during the financial crisis in Spain (2003–2012). SSM Popul. Health, 2019. [DOI | PubMed]
- F. Venetsanou, K. Emmanouilidou, O. Kouli, E. Bebetsos, N. Comoutos, A. Kambas. Physical activity and sedentary behaviors of young children: Trends from 2009 to 2018. Int. J. Environ. Res. Public Health, 2020. [DOI]
- Á.R. Zapata Moya, C.J. Navarro Yáñez. Urban regeneration policies and mental health in a context of economic crisis in Andalusia (Spain). J. House Built. Environ., 2021. [DOI]
- N.; Vallejo, L. The effect of the economic crisis on adolescents’ perceived health and risk behaviors: A multilevel analysis. Int. J. Environ. Res. Public Health, 2020. [DOI]
- D. Stuckler, S. Basu, M. Suhrcke, A. Coutts, M. McKee. The public health effect of economic crises and alternative policy responses in Europe:an empirical analysis. Lancet, 2009. [DOI | PubMed]
- G. Quaglio, T. Karapiperis, L. Van Woensel, E. Arnold, D. McDaid. Austerity and health in Europe. Health Policy, 2013. [DOI | PubMed]
- A. Kentikelenis, M. Karanikolos, I. Papanicolas, S. Basu, M. McKee, D. Stuckler. Health effects of financial crisis: Omens of a Greek tragedy. Lancet, 2011. [DOI | PubMed]
- N. Kondo, S.V. Subramanian, I. Kawachi, Y. Takeda, Z. Yamagata. Economic recession and health inequalities in Japan: Analysis with a national sample, 1986–2001. J. Epidemiol. Community Health, 2008. [DOI | PubMed]
- M.G. Marmot, J. Allen, R. Bell, E. Bloomer, P. Goldblatt. WHO European review of social determinants of health and the health divide. Lancet, 2012. [DOI | PubMed]
- R.K. Merton. The Matthew Effect in Science: The renard and communication systems of science are considered. Science, 1968. [DOI | PubMed]
- T.A. Di Prete, G.M. Eirich. Cumulative advantage as a mechanism for inequality: A review of theoretical and empirical developments. Ann. Rev. Sociol., 2006. [DOI]
- COVID-19-break the cycle of inequality. Lancet Public Health, 2021. [DOI | PubMed]
- M. Marmot, J. Allen, P. Goldblatt, E. Herd, J. Morrison. Build Back Fairer: The COVID-19 Marmot Review. The Pandemic, Socioeconomic and Health Inequalities in England, 2020
- COVID-19: Healthy Lifestyles also during the Emergency
- G.F. López-Sánchez, R. López-Bueno, A. Gil-Salmerón, R. Zauder, M. Skalska, J. Jastrzębska, Z. Jastrzębski, F.B. Schuch, I. Grabovac, M.A. Tully. Comparison of physical activity levels in Spanish adults with chronic conditions before and during COVID-19 quarantine. Eur. J. Publ. Health, 2021. [DOI]
- A. Ammar, M. Brach, K. Trabelsi, H. Chtourou, O. Boukhris, L. Masmoudi, B. Bouaziz, E. Bentlage, D. How, M. Ahmed. Effects of COVID-19 home confinement on eating behaviour and physical activity: Results of the ECLB-COVID19 International Online Survey. Nutrients, 2020. [DOI]
- R. López-Bueno, J. Calatayud, J. Casaña, J.A. Casajús, L. Smith, M.A. Tully, L.L. Andersen, G.F. López-Sánchez. COVID-19 Confinement and health risk behaviors in Spain. Front. Psychol., 2020. [DOI | PubMed]
- V. Balanzá-Martínez, F. Kapczinski, T. de Azevedo Cardoso, B. Atienza-Carbonell, A.R. Rosa, J.C. Mota, R.B. De Boni. The assessment of lifestyle changes during the COVID-19 pandemic using a multidimensional scale. Rev. Psiquiatr. Salud Ment., 2021. [DOI | PubMed]
- Ó. Martínez-de-Quel, D. Suárez-Iglesias, M. López-Flores, C.A. Pérez. Physical activity, dietary habits and sleep quality before and during COVID-19 lockdown: A longitudinal study. Appetite, 2020. [DOI | PubMed]
- M.B. Ruiz-Roso, P. de Carvalho Padilha, D.C. Mantilla-Escalante, N. Ulloa, P. Brun, D. Acevedo-Correa, W. Arantes Ferreira Peres, M. Martorell, M.T. Aires, L. de Oliveira Cardoso. COVID-19 confinement and changes of adolescent’s dietary trends in Italy, Spain, Chile, Colombia and Brazil. Nutrients, 2020. [DOI]
- D.I. Bourdas, E.D. Zacharakis. Evolution of changes in physical activity over lockdown time: Physical activity datasets of four independent adult sample groups corresponding to each of the last four of the six COVID-19 lockdown weeks in Greece. Data Brief, 2020. [DOI | PubMed]
- A. Castañeda-Babarro, A. Arbillaga-Etxarri, B. Gutiérrez-Santamaría, A. Coca. Physical activity change during COVID-19 confinement. Int. J. Environ. Res. Public Health, 2020. [DOI]
- M. García-Tascón, C. Sahelices-Pinto, C. Mendaña-Cuervo, A.M. Magaz-González. The Impact of the COVID-19 confinement on the habits of PA practice according to gender (male/female): Spanish case. Int. J. Environ. Res. Public Health, 2020. [DOI]
- G. Maugeri, P. Castrogiovanni, G. Battaglia, R. Pippi, V. D’Agata, A. Palma, M. Di Rosa, G. Musumeci. The impact of physical activity on psychological health during COVID-19 pandemic in Italy. Heliyon, 2020. [DOI | PubMed]
- Nutrition during the COVID-19 Emergency
- L.I. Sinisterra Loaiza, B. Vázquez Belda, J.M. Miranda López, A. Cepeda, A. Cardelle Cobas. Food habits in the Galician population during confinement for COVID-19. Nutr. Hosp., 2020. [PubMed]
- S. Pišot, I. Milovanović, B. Šimunič, A. Gentile, K. Bosnar, F. Prot, A. Bianco, G. Lo Coco, S. Bartoluci, D. Katović. Maintaining everyday life praxis in the time of COVID-19 pandemic measures (ELP-COVID-19 survey). Eur. J. Public Health, 2020. [DOI | PubMed]
- L. Di Renzo, P. Gualtieri, F. Pivari, F. Soldati, A. Attinà, G. Cinell, C. Leggeri, G. Caparello, L. Barrea, F. Scerbo. Eating habits and lifestyle changes during COVID-19 lockdown: An Italian survey. J. Transl. Med., 2020. [DOI | PubMed]
- A. Pietrobelli, L. Pecoraro, A. Ferruzzi, M. Heo, M. Faith, T. Zoller, F. Antoniazzi, G. Piacentini, S.N. Fearnbach, S.B. Heymsfield. Effects of COVID-19 lockdown on lifestyle behaviors in children with obesity living in Verona, Italy: A longitudinal study. Obesity, 2020. [DOI | PubMed]
- R. Cancello, D. Soranna, G. Zambra, A. Zambon, C. Invitti. Determinants of the lifestyle changes during COVID-19 pandemic in the residents of northern Italy. Int. J. Environ. Res. Public Health, 2020. [DOI | PubMed]
- T. Correia, G. Dussault, C. Pontes. The impact of the financial crisis on human resources for health policies in three southern-Europe countries. Health Policy, 2015. [DOI | PubMed]
- G. Rachiotis, C. Kourousis, M. Kamilaraki, E.K. Symvoulakis, G. Dounias, C. Hadjichristodoulou. Medical supplies shortages and burnout among greek health care workers during economic crisis: A pilot study. Int. J. Med. Sci., 2014. [DOI | PubMed]