
Content Analysis of Cannabis Discourses on Twitter/X in the U.S.
Abstract
This study analyzed more than 2 million tweets related to cannabis from the U.S.
This study used a deep-learning model to assess public perception of cannabis.
Public perception of cannabis and its use varies across states with varied cannabis regulatory policies.
Key topics were identified in cannabis-related tweets that expressed either negative or positive sentiments.
Article type: Research Article
Keywords: Marijuana, cannabis, Twitter/X, content analysis, deep learning
Affiliations: Clinical and Translational Science Institute, University of Rochester Medical Center, Rochester, New York; Goergen Institute for Data Science and Artificial Intelligence, University of Rochester, Rochester, New York; Department of Pediatrics, University of Rochester School of Medicine, Rochester, New York
License: © 2025 The Author(s) CC BY 4.0 This is an open access article under the CC BY license (http://creativecommons.org/licenses/by/4.0/).
Article links: DOI: 10.1016/j.focus.2025.100408 | PubMed: 41035944 | PMC: PMC12480873
Relevance: Moderate: mentioned 3+ times in text
Full text: PDF (892 KB)
INTRODUCTION
Cannabis, commonly known as marijuana, is a psychoactive drug regulated as a Schedule I substance under the Controlled Substances Act.ref. bib0001 Cannabis has garnered increasing attention from political candidates, state legislations, and medical researchers.ref. bib0002 As of February 2024, a total of 47 U.S. states, along with the District of Columbia (DC) and 3 territories, have legalized the medical use of cannabis.ref. bib0003 Furthermore, 24 states (such as Colorado, Washington, and California), DC, and 2 territories have legalized the recreational use of cannabis, with more states considering such actions.ref. bib0004 Despite this federal legal classification, cannabis is widely used in the U.S., with an annual use rate of 21.9%, which is 3 times higher than the global average.ref. bib0005 In 2024, approximately 55 million Americans reported currently using cannabis, and around 3,300 teenagers reported trying it for the first time every day.ref. bib0006 In addition, the average age of first-time cannabis users is generally lower than that of other illicit drug users.ref. bib0007 In 2022, for the first time in history, the total consumption of cannabis in various forms surpassed that of cigarettes.ref. bib0008
The legalization of cannabis, whether for medical or recreational purposes, not only reflects but also influences public sentiment regarding cannabis. Studies showed that residents in the states with less restrictive cannabis policies tend to have a greater number of positive discussions about cannabis on Twitter (now rebranded as X), evidenced by a high volume of favorable posts on Twitter/X.ref. 9, ref. 10, ref. 11 However, the public perception of cannabis in the U.S. is continuously evolving in response to changing policies and information.ref. bib0012 In states with medical cannabis laws, 8th grade students were more likely to perceive cannabis as harmful compared to their peers in states without such laws.ref. bib0012 Attitudes toward cannabis legalization vary significantly depending on state-specific demographics and regulations.ref. bib0013 For instance, women were less likely to be aware of increased cannabis potency than men, whereas adults with a graduate degree were more likely to recognize that cannabis is becoming more potent.ref. bib0013 Understanding these trends can be immensely beneficial for policymakers and researchers.
Twitter/X is a social media platform that enables users to share their opinions and experiences, making it an ideal platform to investigate public perceptions on social issues, including cannabis use.ref. bib0014,ref. bib0015 Previous studies have effectively utilized Twitter/X data to examine cannabis use across various demographic and geographic groups, as well as to assess users’ sentiments.ref. bib0009,ref. 16, ref. 17, ref. 18 For example, 12 major topics related to cannabis were identified from cannabis-related tweets, including using cannabis and its health risks and benefits.ref. bib0019 Studies have shown that youth exposed to cannabis promotions and brands on social media had a higher likelihood of using cannabis.ref. bib0020,ref. bib0021 Given the rapid changes in public perception and regulatory policy regarding cannabis in the U.S., it is essential to provide an updated analysis of public sentiment and cannabis use through social media data. By analyzing social media data related to cannabis, valuable insights into the public’s beliefs and sentiments toward cannabis can be gained. This study will utilize deep-learning language models guided by the results of qualitative content analyses to more accurately assess the sentiment toward cannabis on Twitter/X.
In this study, the authors aim to understand the public perception of cannabis and its use in the U.S., particularly in relation to varying cannabis legalization policies, by analyzing Twitter/X data through natural language processing techniques and deep-learning models. By gaining insights into these perceptions, policymakers and researchers can make informed decisions regarding future regulatory policies and enhance health communications.
METHODS
Study Sample
This study was reviewed and approved by the Research Subjects Review Board of the Office for Human Subject Protection (STUDY00006570). Patient consent for publication is not required as the data were analyzed anonymously.
Twitter/X data on cannabis were collected through Twitter/X streaming Application Programming Interface using keywords related to cannabis or marijuana, including “marijuana,” “cannabis,” “blunt,” “bong,” “budder,” “cbd,” “ganja,” “hash,” “hemp,” “indica,” “kush,” “marihuana,” “reefer,” “sativa,” “thc,” and “weed.”ref. bib0019 Between February 26th, 2022 and February 11th, 2023, the authors collected 63,029,489 tweets related to cannabis.
As previously described, several data preprocessing steps were conducted on the collected Twitter/X dataset.ref. bib0022,ref. bib0023 First, based on tweet ID, the authors removed all duplicate tweets. Next, all retweets were eliminated. This study aimed to understand public perception of cannabis through analyzing noncommercial tweets. To achieve this, the authors filtered out all tweets deemed commercial or advertising tweets by using a list of keywords, such as “sale,” “offer,” and “dollar,” regardless of the type of Twitter/X user accounts.ref. bib0024 In addition, any tweets created by social bots were detected and removed with the help of the Botometer Application Programming Interface.ref. bib0025,ref. bib0026 Finally, tweets from the U.S. were identified based on the geolocation information provided within the tweets and Twitter/X user accounts.ref. bib0027,ref. bib0028 After data preprocessing, 2,865,562 unique noncommercial tweets related to cannabis from the U.S were identified.
Measures
To assess the sentiment of tweets toward cannabis and to determine if Twitter/X users were potential cannabis users, the authors utilized a human-guided deep-learning model. The authors first randomly selected 500 cannabis-related tweets, and 5 authors labeled them (positive, negative, or neutral) according to the tweet’s sentiment toward cannabis and whether Twitter/X users were potential cannabis users (yes or no). In this study, the authors utilized a staggered pairwise hand-coding design to reduce the burden of hand-coding.ref. 29, ref. 30, ref. 31 Each human coder labeled 200 tweets, with each 100 tweets overlapping with another coder. The average Cohen’s κ statistic value among 5 different coders reached 0.63 for the sentiment and 0.78 for cannabis users, all considered substantial agreement. Any discrepancy was resolved through a group discussion among the 5 human coders, and the labeling criteria were updated accordingly. In addition, the authors did not identify any commercial tweets among these 500 noncommercial tweets. Subsequently, the authors randomly sampled another 5,000 cannabis-related tweets, and each trained author manually labeled 1,000 tweets. To further validate the consensus among human coders, 100 tweets were randomly selected from these 5,000 tweets and independently coded by 5 human coders. The Krippendorff’s α value was 0.75 for the sentiment and 0.81 for cannabis users.
To label the remaining tweets, the authors used the bidirectional encoder representations from transformers (BERT) model.ref. bib0032 As a popular state-of-the-art machine-learning model, the BERT model outperformed other traditional machine-learning text classification models.ref. bib0032 To achieve optimal efficiency and results, the pretrained BERT-large-uncased model with 24 layers and 340 million parameters was chosen. The authors customized the BERT-large-uncased model for their specific dataset by adding linear and dropout layers to ensure the correct output shape. To further optimize their model’s performance, the authors conducted hyperparameter tuning using a grid search to determine the best batch size and learning rate combination for their BERT-based model. Grid search is a systematic way of searching for the best combination of hyperparameters for a model, which is relatively straightforward to implement. After completing the grid search, the authors found that a batch size (the number of training examples processed together) of 32, a total of 15 epochs (the number of full passes through the entire training dataset), and a learning rate (the extent to which the model’s weights are updated during training) of 1e-5 produced the best results for their specific task of predicting the sentiment and classifying potential cannabis users. To train their model using their human-labeled tweets, the authors used the cross-entropy loss function, a standard function in classification tasks that measures the difference between the predicted probabilities and actual labels. In addition, the authors used the Adam optimizer, an adaptive optimization algorithm that adjusts the learning rate based on the gradient magnitudes of the parameters.
The authors divided their 5,500 human-labeled tweets into training and testing sets. The training set comprised 70% of the data, whereas the testing set contained 30%. The F1 score combines precision and recall using their harmonic mean, offering a balanced assessment of the model’s overall performance. Given the class-imbalanced nature of their labels, the authors chose to use the F1 score as the metric for measuring the model’s performance. High F1 scores were obtained by the pretrained BERT model for both cannabis user and sentiment classifications, with a score of 0.93 for classifying cannabis users and 0.84 for sentiment classification.
The authors grouped Twitter/X users into various U.S. states based on the geographical location provided by tweets or Twitter/X user accounts. For each state, the authors counted the number of unique Twitter/X and cannabis users (Twitter/X users who are potential cannabis users based on the study model). To account for variations in state population, the authors divided the number of Twitter/X and cannabis users in each state by the state population in 2022, as provided by the U.S. National Census Bureau.ref. bib0033
To estimate the age and sex of Twitter/X and potential cannabis users, the authors used a deep-learning facial recognition algorithm known as DeepFace.ref. bib0034 The user profile images were downloaded using the URLs provided in tweets. The DeepFace algorithm analyzes a user’s profile image on Twitter/X to infer their age and sex, as long as only a single face is detected in the image. Sex was classified into 2 categories: male and female. Twitter/X users were then classified into multiple age groups, including <18, 18–24, 25–34, 35–60, and >60 years.
To better understand the topics discussed in cannabis-related tweets that express either positive or negative sentiment toward cannabis, the Latent Dirichlet Allocation model was applied.ref. bib0024,ref. bib0035 This model identifies each topic by analyzing a distribution of words, which indicates the likelihood of that topic including those words. Based on the coherence score (the highest) and inter-topic distance (minimal overlap), the authors identified 3 major topics for tweets with positive or negative sentiment toward cannabis, respectively.
Statistical Analysis
To compare the sentiment toward cannabis and the prevalence of potential cannabis users on Twitter/X across various U.S. states, a 2-proportion z-test was conducted at a significance level of 0.05.
RESULTS
From February 2022 to February 2023, the authors have identified 2,865,562 unique noncommercial tweets related to cannabis from the U.S. As illustrated in Appendix Figure 1 (available online), fluctuations were observed in the number of tweets, including notable peaks on April 20, 2022 and October 6, 2022. The overall trend showed a decrease in the number of tweets mentioning cannabis during the study period.
To understand the sentiment of tweets toward cannabis, the authors used a human-guided deep-learning model to classify the sentiment of tweets as positive, negative, or neutral. Of the 2,865,562 cannabis-related tweets in the U.S., 648,018 tweets (22.62%) had a positive sentiment toward cannabis, 234,202 (8.17%) had a negative sentiment toward cannabis, and 1,983,342 (69.21%) had a neutral sentiment. A 2-proportion z-test indicated that the proportion of positive tweets was significantly higher than that of negative tweets (22.61% vs 8.17%, p<0.001). In addition, there was no clear temporal trend in the proportion of positive tweets throughout the study period, except for 2 notable peaks: one of them was on April 20, 2022 and the other on October 6, 2022 (Appendix Figure 2, available online).
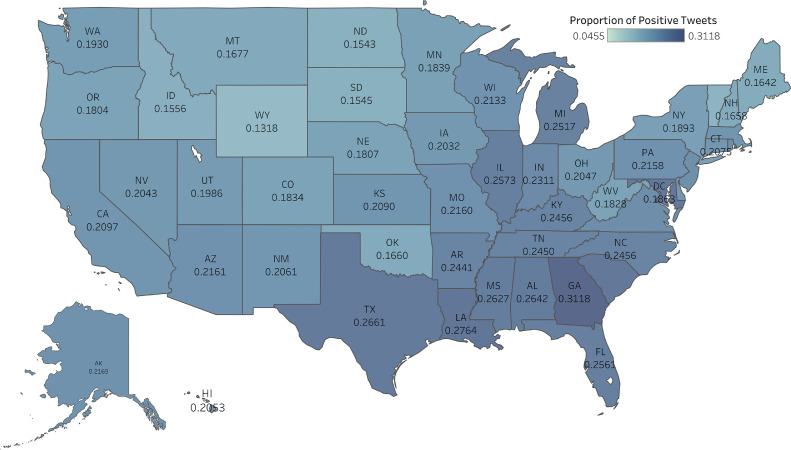
The proportion of positive tweets varied across various U.S. states (Figure 1). Some Western states, such as Idaho, Oregon, and Wyoming, showed a relatively lower proportion of positive tweets compared to that of some Eastern states, including North Carolina, Michigan, and Georgia. Georgia had the highest proportion of tweets with a positive sentiment (31.18%), followed by Texas (26.61%) and Alabama (26.42%). In contrast, Wyoming had the lowest proportion of positive tweets (13.18%) among all U.S. states. It is well known that U.S. states have varying regulatory policies regarding cannabis. There was no significant difference in the proportion of positive tweets between states that allow recreational cannabis and those that do not (20.41% vs 21.77%, p=0.9045). Similarly, there was no significant difference in the proportion of positive tweets between states that allow medical cannabis and those that do not (20.89% vs 22.38%, p=0.9124).
From the U.S. Twitter/X data related to cannabis, 821,451 unique Twitter/X users posted cannabis-related tweets during the study period. Using a human-guided deep-learning model, the authors identified 348,795 (42.46%) Twitter/X users as potential cannabis users (i.e., Twitter/X and cannabis users). No obvious trends in the proportion of Twitter/X and cannabis users were observed throughout the study period (Appendix Figure 3, available online). Nevertheless, potential cannabis users were more likely to post positive tweets than nonusers (47.56% vs 11.60%, p<0.001) (Appendix Figure 4, available online). Similarly, the proportion of negative tweets among cannabis users was significantly higher than that among nonusers (9.94% vs 7.39%, p<0.001). In contrast, nonusers were more likely to post neutral tweets than cannabis users (81.01% vs 42.50%, p<0.001).
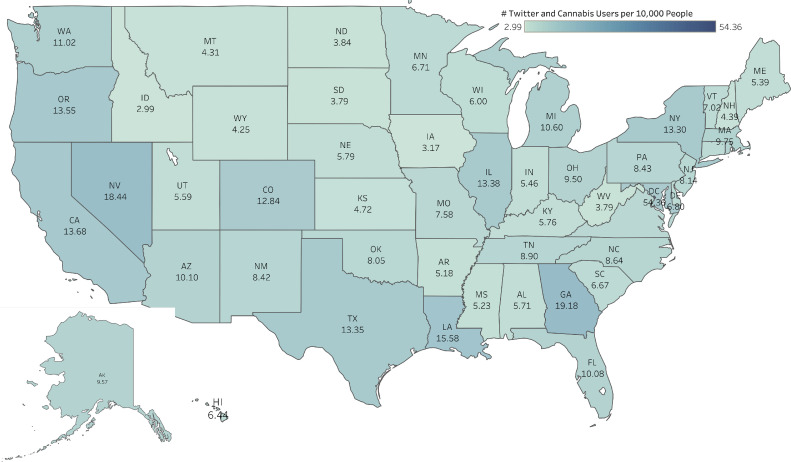
To compare the prevalence of Twitter/X and cannabis users across various U.S. states, the authors calculated the number of Twitter/X and cannabis users per 10,000 people based on each state’s population. As shown in Figure 2, Washington DC (54.36) had the most Twitter/X and cannabis users per 10,000 people in the U.S., followed by Georgia (19.18) and Nevada (18.44). In contrast, Idaho (2.99) had the lowest number of Twitter/X and cannabis users per 10,000 people in the U.S. In states that permit medical cannabis, there was an average of 9.67 Twitter/X and cannabis users per 10,000 people, which was higher than the average of 7.81 users per 10,000 people in states without medical cannabis. However, this difference was not statistically significant (p=0.9840). Similarly, in states where recreational cannabis is legal, there were 12.19 Twitter/X and cannabis users per 10,000 population, whereas states without recreational cannabis had 7.22 Twitter/X and cannabis users per 10,000 people. However, this difference was also not statistically significant (p=0.9522).
Among the 348,795 potential cannabis users identified on Twitter/X, the authors were able to estimate the basic demographics (including age group and sex) of 26,011 Twitter/X and cannabis users (7.46%), using a face recognition algorithm (DeepFace). As shown in Appendix Figure 5 (available online), the most prevalent age group among Twitter/X and cannabis users was the 25–34 years group, comprising 37.14% of the total Twitter/X and cannabis users, followed by the 18–24 years age group (35.01%) and 35–60 years age group (24.57%). The sex distribution among the Twitter/X and cannabis users was relatively balanced, with males making up 50.69% and females accounting for 49.31%.
In the case of those tweets with a neutral sentiment, they were mainly sharing general information related to cannabis, such as the regulatory policies (e.g., Maryland bill would legalize adult-use cannabis by July 1), and asking general questions about cannabis (e.g., “looking for the best cannabis product for maximum energy, please?”). To understand why Twitter/X users showed either positive or negative sentiment toward cannabis, the authors conducted topic modeling on positive and negative tweets. As shown in Table 1, there were 3 major topics in positive tweets, including Cannabis’s medical value (39.8%), Strong urge to use cannabis (30.7%), and Cannabis can improve overall life quality (29.5%). In contrast, as shown in Table 2, there were 3 major topics in negative tweets against cannabis, including Having difficulty quitting cannabis (41.8%), Complaining about the smell of cannabis (30.6%), and Worrying about the side effects of cannabis (26.7%).
Table 1: Major Topics in Positive Tweets Toward Cannabis
| Topics (n, %) | Top 10 keywords | Example tweets |
|---|---|---|
| Cannabis can improve overall life quality.(191,165/648,018, 29.5%) | Good, day, make, sleep, work, better, coffee, happy, always, music | |
| Strong urge to use cannabis(198,942/648,018, 30.7%) | Need, wanna, high, smoked, gonna, roll, homie, fat, yall, hit | |
| Cannabis’s medical value(257,911/648,018, 39.8%) | Legal, medical, legalize, possession, pain, really, help, love, better, lot |
PTSD, posttraumatic stress disorder.
Table 2: Major Topics in Negative Tweets Toward Cannabis
| Topics (n, %) | Top 10 keywords | Example tweets |
|---|---|---|
| Having difficulty quitting cannabis(97,896/234,202, 41.8%) | Alcohol, make, drugs, many, worse, brain, can’t, quit, never without | |
| Complaining about the smell of cannabis(71,666/234,202, 30.6%) | Hate, stop, smell, bad, car, don’t, smelling, smoked, really, smells | |
| Worrying about the side effects of cannabis(62,532/234,202, 26.7%) | Side, effects, makes, body, getting, cancer, cause, psychosis, bad, anxiety |
DISCUSSION
In this study, the authors analyzed Twitter/X posts related to cannabis from the U.S. and showed that Twitter/X users generally expressed a more positive than negative sentiment toward cannabis. Although there was no significant temporal trend in the proportion of positive tweets, the authors observed notable differences among various U.S. states. In addition, cannabis users on Twitter/X tended to be young adults, and their prevalence varied across various states. The authors identified 3 major topics from tweets expressing either positive or negative sentiment toward cannabis.
From February 2022 to February 2023, this study found a slight decrease in the number of tweets related to cannabis. The authors identified 2 peaks in tweet activity: one of them was on April 20, 2022 and the other on October 6, 2022. April 20 is recognized as an annual unofficial holiday for a cannabis-oriented celebration.ref. bib0036 On that day, cannabis producers, consumers, and advocates come together to celebrate and smoke cannabis. On October 6, 2022, President Biden announced a pardon for certain prior federal and DC offenses for using and possessing cannabis, which generated significant public attention and discussion on Twitter/X.ref. bib0037 The temporal trends in public perception showed that tweets during these 2 peaks were generally more positive compared to other tweets, suggesting that many Twitter/X users enjoyed smoking cannabis and welcomed the pardon. Overall, these study results demonstrated that Twitter/X could effectively capture key events and regulatory changes related to cannabis.
Various U.S. states have implemented varying regulatory policies regarding cannabis, with some allowing medical use and others permitting recreational use. As of 2022, a total of 21 states (including California, New Jersey, and Arizona) permit recreational cannabis use, whereas 40 states (such as Ohio, Arizona, and California) allow medical cannabis use. Conversely, 11 states (such as Louisiana, Indiana, and Mississippi) do not permit any legal use of cannabis. In this study, analysis of Twitter/X data did not reveal any significant difference in the public perception and use of cannabis among states with varied regulatory policies. Twitter/X users who tweeted about cannabis may not represent the whole population in each state. In addition, the prevalence of Twitter/X users can vary among states, which could introduce some biases into the findings of this study. Nevertheless, the findings of this study suggest that cannabis regulations may not significantly influence public sentiment or consumption of cannabis, a finding that warrants further investigation. Similarly, using Twitter/X data from 2007 to 2019 and various sentiment analysis tools, a previous study demonstrated that the proportion of positive tweets related to cannabis did not significantly differ among states with varied regulations.ref. bib0015 A possible explanation for this observation is that the lack of regulatory enforcement and social norms over the past decade may influence public sentiment and consumption, beyond simply distinguishing between legal and illegal status. In addition, the anonymous nature of social media may provide a space to discuss stigmatized topics such as cannabis use, potentially reducing the impact of cannabis’s legal status on tweeting behavior. Another possible reason could be that the volume of online cannabis discourse may decrease in states where recreational cannabis is already legal. However, the authors did observe variations among various states. For instance, Georgia has the highest proportion of positive tweets and the highest prevalence of cannabis users based on the data of this study. Previous polls indicated that more than half of the population in Georgia supports the state government in legalizing cannabis for adult recreational use.ref. bib0038 Conversely, Idaho, Wyoming, and Montana exhibited a lower proportion of positive tweets and prevalence of cannabis users. The underlying reasons for these differences require further exploration. A previous national survey study showed that the prevalence of cannabis use was significantly higher in states with legalized recreational use than in other states.ref. bib0039 The authors observed a similar pattern, although the differences were not significant in this study. In this study, the authors used an advanced deep-learning model to estimate the demographics, including age group and gender, of cannabis users on Twitter/X. Among these cannabis and Twitter/X users, young adults aged 18–34 years were the most dominant, which aligns with previous findings.ref. bib0040,ref. bib0041 A possible reason for this is that there was a notable shift from the use of alcohol and other drugs to cannabis use among young adults in recent years, partially because of recreational cannabis legalization.ref. bib0042,ref. bib0043
Among the cannabis-related tweets, 22.61% expressed a positive sentiment toward cannabis. Topic modeling results revealed 3 main topics in this positive sentiment, such as the medical benefits of cannabis and its potential to improve overall quality of life. Cannabis is often thought to alleviate symptoms of mood or anxiety disorders.ref. bib0044 However, numerous studies have shown that regular cannabis use is associated with increased depressive, psychotic disorders, and anxiety symptoms.ref. 45, ref. 46, ref. 47 In contrast, tweets that expressed a negative sentiment primarily cited difficulties in quitting cannabis, followed by complaints about its odor and side effects. There is substantial evidence indicating that cannabis use can lead to addiction and dependence syndrome.ref. 48, ref. 49, ref. 50 The findings from this study clearly demonstrate that cannabis addiction was the primary concern mentioned in negative tweets, which warrants increased attention. Studies have indicated that exposure to cannabis-related digital content, particularly those with a positive sentiment, is positively correlated with cannabis use among youth and young adults.ref. bib0021,ref. bib0051 This analysis showed a greater number of positive tweets than negative ones, aligning with findings from previous studies.ref. 52, ref. 53, ref. 54 These findings suggest that the public is more inclined to share favorable opinions about cannabis on social media, which might be partially influenced by the legalization of cannabis in many U.S. states. To reduce the prevalence of cannabis use, nationwide health education campaigns, such as those conducted through social media, should be launched to inform the public about the potential health risks associated with cannabis.
Limitations
This study has several limitations. First, the results from the Twitter/X data analysis should not be generalized to the general population. Second, many tweets lacked valid geolocation and user profile information, which were excluded from this analysis. Third, Cohen’s κ scores for human labeling were relatively low in this study. Despite the well-performing BERT models, there may have been some mislabeling in the data, which could have introduced bias. In addition, the user profile pictures used for the DeepFace model were not necessarily those of the actual Twitter/X users themselves, which could have introduced another source of inaccuracy. Fourth, because the authors did not have accurate demographic information about the Twitter/X users, they could not accurately compare public perception and cannabis use among varied demographic groups, which should be explored using other data sources in future studies. Similarly, given that the prevalence of Twitter/X use might differ among U.S. states, bias could have been introduced into the prevalence of cannabis users by normalizing it to the general population. Although there is currently no data available on the distribution of Twitter/X users by state, the findings of this study could be validated by comparing them to representative national survey data in the future. Fifth, the coronavirus disease 2019 (COVID-19) pandemic may have contributed to an increase in cannabis use.ref. bib0055 Even though this relationship could exist, the authors did not assess its impact on the current study. Sixth, the keyword list used for collecting cannabis-related tweets could have introduced bias in this study. This may occur because of missing pertinent tweets as a result of the authors not including certain relevant keywords, such as “medibles” and “420.” In addition, using ambiguous keywords such as “blunt” and “weed” could have introduced noise into the data and results. Finally, in light of the fast-evolving cannabis market and the emergence of new cannabis products (such as derived psychoactive cannabis products) in response to changing regulatory policies, it is crucial to include these novel products in the analysis and update the findings of this study with more recent data in the future.ref. bib0056 Considering the current challenges in accessing Twitter/X data after the academic account has been revoked, it is essential to explore other social media platforms including Reddit.
CONCLUSIONS
In this study, the authors analyzed Twitter/X data with the assistance of advanced deep-learning models and showed that the public perception and use of cannabis differ across U.S. states. The authors did not observe significant differences in the public perception of cannabis among states with varying cannabis policies. Through topic modeling, the potential reasons why Twitter/X users might hold either negative or positive views toward cannabis were identified. Overall, this research provides a comprehensive understanding of the public perceptions of cannabis and the effects of varied legalization policies in the U.S., which could help inform future policy development and health communication efforts to protect public health.
References
- 1FDA regulation of cannabis and cannabis-derived products, including cannabidiol (CBD)2024Food and Drug Administrationhttps://www.fda.gov/news-events/public-health-focus/fda-regulation-cannabis-and-cannabis-derived-products-including-cannabidiol-cbdUpdated July 16Accessed December 11, 2024
- JM. Bostwick. Blurred boundaries: the therapeutics and politics of medical marijuana. Mayo Clin Proc, 2012. [DOI | PubMed]
- 3State medical cannabis laws. Centers for Disease Control and Prevention. https://www.cdc.gov/cannabis/about/state-medical-cannabis-laws.html. Updated February 16, 2024. Accessed December 13, 2024.
- HG. Hull. Lost in the weeds of pot law: the role of legal ethics in the movement to legalize marijuana. Penn St L Rev, 2014
- R.A. Grucza, A. Agrawal, M.J. Krauss, P.A. Cavazos-Rehg, LJ. Bierut. Recent trends in the prevalence of marijuana use and associated disorders in the United States. JAMA Psychiatry, 2016. [DOI | PubMed]
- 6Marijuana addiction: rates & usage statistics. National Center for Drug Abuse Statistics. https://drugabusestatistics.org/marijuana-addiction/#:∼:text=Approximately%20half%20of%20Americans%2C%20some,marijuana%20on%20a%20monthly%20basis. Accessed December 11, 2024.
- T.P. Johnson, JA. Mott. The reliability of self-reported age of onset of tobacco, alcohol and illicit drug use. Addiction, 2001. [DOI | PubMed]
- Americans are smoking more marijuana than cigarettes, poll finds. August 31, 2022
- R. Daniulaityte, R.W. Nahhas, S. Wijeratne. “Time for dabs”: analyzing Twitter data on marijuana concentrates across the U.S. Drug Alcohol Depend, 2015. [DOI | PubMed]
- R. Daniulaityte, F.R. Lamy, G.A. Smith. Retweet to Pass the Blunt”: analyzing geographic and content features of cannabis-related tweeting across the United States. J Stud Alcohol Drugs, 2017. [DOI | PubMed]
- H.W. Meng, S. Kath, D. Li, QC. Nguyen. National substance use patterns on Twitter. PLoS One, 2017. [DOI]
- K.M. Keyes, M. Wall, M. Cerdá. How does state marijuana policy affect U.S. youth? Medical marijuana laws, marijuana use and perceived harmfulness: 1991–2014. Addiction, 2016. [DOI | PubMed]
- S.M. Resko, K.A. Szechy, T.J. Early, J.D. Ellis, D. Hicks, E. Agius. Perceptions of public health consequences of marijuana legalization. Addict Res Theor, 2021. [DOI]
- K. Weller, A. Bruns, J. Burgess, M. Mahrt, C. Puschmann. 2014
- J. van Draanen, H. Tao, S. Gupta, S. Liu. Geographic differences in cannabis conversations on Twitter: infodemiology study. JMIR Public Health Surveill, 2020. [DOI]
- E.P. Cabrera-Nguyen, P. Cavazos-Rehg, M. Krauss, L.J. Bierut, MA. Moreno. Young adults’ exposure to alcohol- and marijuana-related content on Twitter. J Stud Alcohol Drugs, 2016. [DOI | PubMed]
- P. Cavazos-Rehg, M. Krauss, R. Grucza, L. Bierut. Characterizing the followers and tweets of a marijuana-focused Twitter handle. J Med Internet Res, 2014. [DOI | PubMed]
- R. Daniulaityte, L. Chen, F.R. Lamy, R.G. Carlson, K. Thirunarayan, A. Sheth. “When ‘Bad’ is ‘Good’”: identifying personal communication and sentiment in drug-related tweets. JMIR Public Health Surveill, 2016. [DOI | PubMed]
- J.P. Allem, P. Escobedo, L. Dharmapuri. Cannabis surveillance with Twitter data: emerging topics and social bots. Am J Public Health, 2020. [DOI | PubMed]
- P.J. Trangenstein, J.M. Whitehill, M.C. Jenkins, D.H. Jernigan, MA. Moreno. Active cannabis marketing and adolescent past-year cannabis use. Drug Alcohol Depend, 2019. [DOI]
- J.M. Whitehill, P.J. Trangenstein, M.C. Jenkins, D.H. Jernigan, MA. Moreno. Exposure to cannabis marketing in social and traditional media and past-year use among adolescents in states with legal retail cannabis. J Adolesc Health, 2020. [DOI | PubMed]
- X. Lu, L. Chen, J. Yuan. User perceptions of different electronic cigarette flavors on social media: observational study. J Med Internet Res, 2020. [DOI]
- Q. Tang, R. Zhou, Z. Xie, D. Li. Monitoring and identifying emerging e-cigarette brands and flavors on Twitter: observational study. JMIR Form Res, 2022. [DOI]
- Y. Gao, Z. Xie, D. Li. Investigating the impact of the New York State flavor ban on e-cigarette-related discussions on Twitter: observational study. JMIR Public Health Surveill, 2022. [DOI]
- C.A. Davis, O. Varol, E. Ferrara, A. Flammini, F. Menczer. Proceedings of the 25th international conference companion on World Wide Web—WWW ’16 Companion, 2016. [DOI]
- J.P. Allem, L. Dharmapuri, A.M. Leventhal, J.B. Unger, T. Boley Cruz. Hookah-related posts to Twitter from 2017 to 2018: thematic analysis. J Med Internet Res, 2018. [DOI]
- Z. Xie, J. Ruan, Y. Jiang. Potential impact of FDA flavor enforcement policy on vaping behavior on Twitter. Int J Environ Res Public Health, 2022. [DOI]
- C. Zou, X. Wang, Z. Xie, D. Li. Public reactions towards the COVID-19 pandemic on Twitter in the United Kingdom and the United States. medRxiv, 2020. [DOI]
- 29Devotta KaP, Cheryl. Coding Qualitative Data: Working With a Team of Coders. 2015. https://utoronto.scholaris.ca/server/api/core/bitstreams/e758a33b-4bea-4223-a094-86231208c3ef/content; Accessed August 20, 2025.
- SN. Halpin. Inter-coder agreement in qualitative coding: considerations for its use. Am J Qual Res, 2024. [DOI]
- Y. Li, S. Twersky, K. Ignace. Constructing and communicating COVID-19 stigma on Twitter: a content analysis of tweets during the Early stage of the COVID-19 outbreak. Int J Environ Res Public Health, 2020. [DOI | PubMed]
- S. González-Carvajal, EC. Garrido-Merchán. Comparing BERT against traditional machine learning text classification. J Comput Cogn Eng, 2023. [DOI]
- 332022 National and state population estimates press kit. United States Census Bureau. https://www.census.gov/newsroom/press-kits/2022/2022-national-state-population-estimates.html. Updated December 22, 2022. Accessed June 4, 2025.
- 34Taigman Y, Yang M, Ranzato M, Wolf L. DeepFace: Closing the gap to human-level performance in face verification. 2014 IEEE conference on computer vision and pattern recognition. Columbus, OH, USA, 2014:1701–1708. 10.1109/CVRP.2014.220.
- 35M. David, A.Y.N. Blei and MI. Jordan, Latent dirichlet allocation, J Mach Learn Res, 3, 2003, 993–1022. https://www.jmlr.org/papers/volume3/blei03a/blei03a.pdf. Accessed September 10, 2025.
- M. King. 2007
- TW. House. Statement from President Biden on marijuana reform. White House, 2022
- M. Niesse. Georgia voters want marijuana legalized, AJC poll shows. AJC Politics, January 26, 2023
- S. Steigerwald, B.E. Cohen, M. Vali, D. Hasin, M. Cerda, S. Keyhani. Differences in opinions about marijuana use and prevalence of use by state legalization status. J Addict Med, 2020. [DOI | PubMed]
- T. Parekh, S. Pemmasani, R. Desai. Marijuana use among young adults (18–44 years of age) and risk of stroke: a behavioral risk factor surveillance system Survey Analysis. Stroke, 2020. [DOI | PubMed]
- B.H. Carlini, GL. Schauer. Cannabis-only use in the USA: prevalence, demographics, use patterns, and health indicators. J Cannabis Res, 2022. [DOI | PubMed]
- A.H. Weinberger, J. Zhu, J. Levin, S.J. Moeller, S.A. McKee, RD. Goodwin. Changes in alcohol use by cannabis use status among adolescents and young adults in the United States: emerging evidence for both substitution and complementarity. Alcohol Clin Exp Res, 2021. [DOI | PubMed]
- D.C.R. Kerr, N.S. Levy, H. Bae, A.E. Boustead, SS. Martins. Cannabis and alcohol use by U.S. Young adults, 2008–2019: changes in prevalence after recreational cannabis legalization. Am J Prev Med, 2023. [DOI | PubMed]
- A. Beletsky, C. Liu, B. Lochte, N. Samuel, I. Grant. Cannabis and anxiety: a critical review. Med Cannabis Cannabinoids, 2024. [DOI | PubMed]
- M. Sorkhou, R.H. Bedder, TP. George. The behavioral sequelae of cannabis use in healthy people: a systematic review. Front Psychiatry, 2021. [DOI]
- CD. Twomey. Association of cannabis use with the development of elevated anxiety symptoms in the general population: a meta-analysis. J Epidemiol Community Health, 2017. [DOI | PubMed]
- M. Di Forti, D. Quattrone, T.P. Freeman. The contribution of cannabis use to variation in the incidence of psychotic disorder across Europe (EU-GEI): a multicentre case-control study. Lancet Psychiatry, 2019. [DOI | PubMed]
- C. Lopez-Quintero, J. Pérez de los Cobos, D.S. Hasin. Probability and predictors of transition from first use to dependence on nicotine, alcohol, cannabis, and cocaine: results of the National Epidemiologic Survey on Alcohol and Related Conditions (NESARC). Drug Alcohol Depend, 2011. [DOI | PubMed]
- N.D. Volkow, R.D. Baler, W.M. Compton, SRB. Weiss. Adverse health effects of marijuana use. N Engl J Med, 2014. [DOI | PubMed]
- W. Hall, L. Degenhardt. Adverse health effects of non-medical cannabis use. Lancet, 2009. [DOI | PubMed]
- Y. Kim, L. Vera, J. Huang, S. Emery. Marijuana content on digital media and marijuana use among young people in the United States. Cannabis, 2022. [DOI | PubMed]
- P.A. Cavazos-Rehg, M. Krauss, S.L. Fisher, P. Salyer, R.A. Grucza, LJ. Bierut. Twitter chatter about marijuana. J Adolesc Health, 2015. [DOI | PubMed]
- F.R. Lamy, R. Daniulaityte, A. Sheth. Those edibles hit hard”: exploration of Twitter data on cannabis edibles in the U.S. Drug Alcohol Depend, 2016. [DOI | PubMed]
- M. Najafizada, A. Rahman, J. Donnan, Z. Dong, L. Bishop. Analyzing sentiments and themes on cannabis in Canada using 2018 to 2020 Twitter data. J Cannabis Res, 2022. [DOI | PubMed]
- K. Mehra, J. Rup, J.L. Wiese, T.M. Watson, S. Bonato, S. Rueda. Changes in self-reported cannabis use during the COVID-19 pandemic: a scoping review. BMC Public Health, 2023. [DOI | PubMed]
- M.E. Rossheim, K.K. Tillett, V. Vasilev. Types and brands of derived psychoactive cannabis products: an online retail assessment, 2023. Cannabis Cannabinoid Res, 2024. [DOI | PubMed]