
Glycolysis regulates Hedgehog signalling via the plasma membrane potential
Abstract
Changes in cell metabolism and plasma membrane potential have been linked to shifts between tissue growth and differentiation, and to developmental patterning. How such changes mediate these effects is poorly understood. Here, we use the developing wing of Drosophila to investigate the interplay between cell metabolism and a key developmental regulator—the Hedgehog (Hh) signalling pathway. We show that reducing glycolysis both lowers steady‐state levels of ATP and stabilizes Smoothened (Smo), the 7‐pass transmembrane protein that transduces the Hh signal. As a result, the transcription factor Cubitus interruptus accumulates in its full‐length, transcription activating form. We show that glycolysis is required to maintain the plasma membrane potential and that plasma membrane depolarization blocks cellular uptake of N‐acylethanolamides—lipoprotein‐borne Hh pathway inhibitors required for Smo destabilization. Similarly, pharmacological inhibition of glycolysis in mammalian cells induces ciliary translocation of Smo—a key step in pathway activation—in the absence of Hh. Thus, changes in cell metabolism alter Hh signalling through their effects on plasma membrane potential.
Article type: Research Article
Keywords: endocannabinoids, glycolysis, hedgehog signalling, metabolism, plasma membrane potential, Development & Differentiation, Membrane & Intracellular Transport, Metabolism
Affiliations: Max Planck Institute of Molecular Cell Biology and Genetics Dresden Germany; Present address: Department of Biochemistry Faculty of Medicine University of Toronto Toronto ON Canada; Biotechnologisches Zentrum Technische Universität Dresden Dresden Germany; Max Planck Institute for the Physics of Complex Systems Dresden Germany; Present address: Department of Physiology Development and Neuroscience University of Cambridge Cambridge UK; Cell Biology and Biophysics Unit European Molecular Biology Laboratory Heidelberg Germany; Department of Chemical Physiology and Biochemistry Oregon Health and Science University Portland OR USA; Center for Systems Biology Dresden Dresden Germany
License: © 2020 The Authors. Published under the terms of the CC BY 4.0 license CC BY 4.0 This is an open access article under the terms of the http://creativecommons.org/licenses/by/4.0/ License, which permits use, distribution and reproduction in any medium, provided the original work is properly cited.
Article links: DOI: 10.15252/embj.2019101767 | PubMed: 33021744 | PMC: PMC7604625
Relevance: Moderate: mentioned 3+ times in text
Full text: PDF (6.7 MB)
Introduction
Tissue growth is associated with changes in cell metabolism that limit the complete catabolism of glucose to CO2, diverting it towards the synthesis of cellular building blocks (Warburg, 1986; Cairns et al, 2011; Agathocleous & Harris, 2013). The metabolic state of the cell can also influence gene expression and help specify differentiation programs. For example, changes in the level of tricarboxylic acid (TCA) cycle metabolites, such as acetate or α‐ketoglutarate, can alter histone acetylation and methylation (Kaelin & McKnight, 2013). Less is known about how cell metabolism might affect the activity of developmental signalling pathways that control growth and patterning.
One conserved signalling system that controls growth and patterning from arthropods to vertebrates is the Hedgehog (Hh) pathway (Ingham et al, 2011). Here, we probe the effects of cell metabolism on the cell biological mechanisms underlying Hh signalling in the Drosophila wing imaginal disc. In the wing disc, Hh is produced in the posterior compartment, while its receptor Patched (Ptc) is expressed in the anterior compartment. In cells that are not exposed to Hh, Ptc destabilizes a key transducer of the Hh signal—the 7‐pass transmembrane protein Smoothened (Smo), reducing its levels on the basolateral membrane. Ptc is a Na+‐dependent RND family transporter that is thought to inhibit Smo by modulating the trafficking of small lipidic Smo regulators. Smo can be activated by cholesterol binding in vertebrates (Byrne et al, 2016; Huang et al, 2016; Luchetti et al, 2016; Myers et al, 2017; Xiao et al, 2017) or inhibited by molecules such as N‐acylethanolamides in both vertebrates and Drosophila (Khaliullina et al, 2015). As Hh spreads into the anterior compartment of the wing disc, it inhibits Ptc activity, thereby stabilizing Smo on the plasma membrane near the anterior–posterior (A/P) compartment boundary. Smo signalling blocks proteasomal processing of Cubitus interruptus (Ci), a Gli‐family transcription factor, and changes its activity from a transcriptional repressor (Ci75) to a transcriptional activator (Ci155). Ci155 then activates transcription of different target genes at different distances from the A/P boundary, including decapentaplegic (dpp), engrailed (en) and ptc. Upregulation of ptc transcription by Hh signalling is thought to limit the spread of the Hh ligand (Briscoe & Therond, 2013).
Interestingly, imaginal wing disc cells can release Hh in several different forms. One form is covalently modified by sterol at the C‐terminus and a fatty acid at the N‐terminus (Porter et al, 1996a,1996b; Pepinsky et al, 1998; Chamoun et al, 2001; Lee & Treisman, 2001; Micchelli et al, 2002). This form of Hh can be secreted on lipoproteins derived from the circulation, released on exosomes, or spread on membrane protrusions (Panakova et al, 2005; Bischoff et al, 2013; Gradilla et al, 2014; Matusek et al, 2014). In addition, wing discs release Hh in a monomeric, non‐sterol modified form (HhN) (Palm et al, 2013). Lipoprotein‐associated (Lpp‐associated) Hh can stabilize Smo and cause accumulation of full‐length Ci155 by preventing lipoprotein‐derived N‐acylethanolamides from destabilizing Smo (Khaliullina et al, 2009, 2015; Palm et al, 2013). Lipoprotein‐associated Hh cannot activate target gene transcription by itself, but it sensitizes imaginal disc cells to the sterol‐free form of Hh (HhN). Together, these two forms activate Ci155‐dependent target gene activation and growth (Palm et al, 2013).
Research on the protein Ecdysoneless (Ecd) has provided a possible connection between Hh signalling and cell metabolism. In Drosophila, Ecd is an interacting partner of the core splicing machinery that regulates steroid hormone production in the ring gland (Claudius et al, 2014). It is also required for imaginal tissue growth, independent of steroid production (Redfern & Bownes, 1983; Sliter, 1989; Gaziova et al, 2004). A connection between Ecd activity and Hh signalling was suggested from early experiments showing that ecd mutants could be partially rescued by driving Ecd expression in cells that receive the Hh signal but not in those that produce it (Gaziova et al, 2004). Subsequently, it has been shown that Ecd promotes glycolysis in both yeast and human tumours (Kainou et al, 2006; Dey et al, 2012). Given this function for Ecd in other systems, the genetic rescue experiment in Drosophila raises the possibility that glycolysis is important in Hh‐receiving cells for signal transduction.
Here, we address the open question of how cell metabolism influences developmental patterning systems by studying the interplay between glycolysis and the Hh signalling pathway. Upon downregulating glycolytic enzymes and Ecd in the Drosophila wing disc, and pharmacologically perturbing glycolytic activity in mammalian cell culture, we find an upregulation of Hh signalling. We investigate the molecular mechanism in the Drosophila wing disc and find that perturbing glycolysis blocks the cellular uptake of N‐acylethanolamides by depolarizing the plasma membrane. This change in plasma membrane potential interferes with Smo destabilization and sensitizes receiving cells to the Hh ligand. This work thereby provides a molecular mechanism for how cellular metabolism regulates the activity of a conserved developmental signalling pathway that controls tissue growth and patterning.
Results
Reducing glycolytic enzyme expression lowers steady‐state levels of ATP and growth
The Drosophila wing disc is a classic model system for studying the Hh pathway, but little is known about its metabolism or the importance of glycolysis to its normal developmental growth and signalling. To analyse the effect of perturbing glycolysis on energy homeostasis in the developing Drosophila wing, we generated flies expressing a FRET‐based reporter of ATP concentration (Tsuyama et al, 2013) under the control of the ubiquitously active ubiquitin promoter (ubi‐AT1.03NL) (Fig 1A). The FRET signal generated by this construct is strongly reduced by treatment of explanted wing discs with antimycin A, an inhibitor of oxidative phosphorylation, confirming that the construct is sensitive to cellular ATP levels (Fig 1B and D–F).
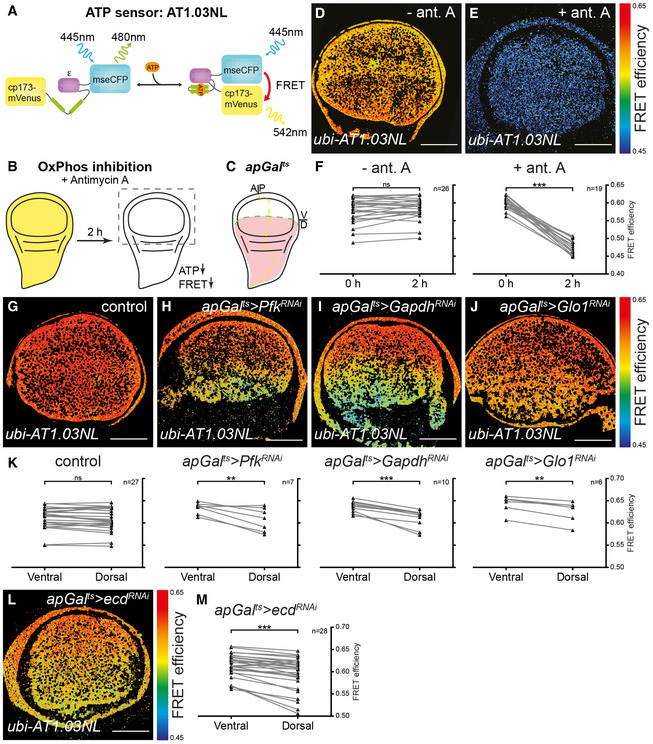
We then used this construct to determine the effect of downregulating key enzymes of the glycolytic pathway on steady‐state levels of ATP (Fig 1G–K). We spatially and temporally limited the induction of RNAi, using the ap‐Gal4 driver combined with the temperature‐sensitive Gal4 repressor, tub‐Gal80 ts (henceforward denoted apGal ts). This driver induces expression only in the dorsal compartment (Fig 1C), leaving the ventral compartment as an internal control, and the temporal control provided by tub‐Gal80 ts allowed us to restrict the duration of the knock‐down during larval development. We found that knock‐down of Phosphofructokinase (Pfk), a key control enzyme in glycolysis, lowers steady‐state levels of ATP (apGal ts >Pfk RNAi, Fig 1H and K). We also tested the effect of removing Glyceraldehyde‐3‐phosphate dehydrogenase (Gapdh). The Drosophila genome encodes two isoforms of Gapdh that are 97% identical at the protein level and 89% identical at the DNA level (Tso et al, 1985; Sun et al, 1988). Using an RNAi construct that targets both isoforms (Appendix Fig S1), we found that loss of Gapdh also results in lower steady‐state levels of ATP (apGal ts >Gapdh RNAi, Fig 1I and K). Lastly, we tested the effect of knocking down Glyoxalase 1 (Glo1), which converts methylglyoxal to D‐lactate. Methylglyoxal is formed non‐enzymatically from the triose phosphate substrates of Gapdh, and it accumulates when either Gapdh or Glo1 enzymatic activity is blocked (Tristan et al, 2011; Moraru et al, 2018). This highly reactive metabolite can inhibit glycolysis by glyoxylating Gapdh and lactate dehydrogenase (Leoncini et al, 1989; Morgan et al, 2002; Lee et al, 2005). As with Pfk and Gapdh knock‐down, loss of Glo1 during larval development reduces steady‐state levels of ATP, albeit to a lesser degree (apGal ts >Glo1 RNAi, Fig 1J and K).
To assess the functional consequences of reducing glycolysis in the developing wing, we quantified wing size and shape upon knocking down these and other enzymes of glycolysis throughout the entire wing disc during all of the development using C765‐Gal4 (Appendix Fig S2). Some RNAi lines produced wings that were proportionally smaller, while many other RNAi lines produced wings that were slightly misproportioned. This latter group included RNAi lines targeting Pfk (1/1 line), Gapdh2 (2/3 lines), Glo1 (1/1 line), as well as Hexokinase A (1/1 line), Aldolase (2/3 lines), Phosphoglycerate kinase (Pgk) (3/3 lines) and Pyruvate kinase (PyK) (2/2 lines).
Ecdysoneless is autonomously required for tissue growth and energy metabolism
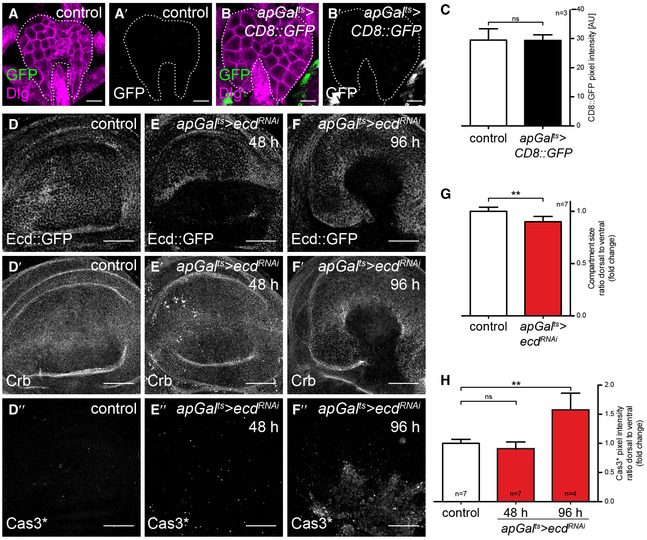
Given that Ecd has been shown in yeast and humans to promote glycolysis, we also investigated the possibility that Ecd could be used to more globally alter glycolysis (Kainou et al, 2006; Dey et al, 2012). A prerequisite for such an approach would be that Ecd indeed acts autonomously and does not influence wing growth indirectly via its function in the steroid‐producing gland. To confirm an autonomous role for Ecd in wing disc growth, we performed a spatially and temporally controlled RNAi‐mediated knock‐down using apGal ts to drive ecd RNAi in the dorsal compartment of the wing disc (apGal ts >ecd RNAi). We confirmed that apGal ts does not induce gene expression in the ring gland (Fig EV1A–C), indicating that steroid hormone production should be unperturbed. Induction of ecd RNAi for 48 h depletes a fosmid Ecd::GFP fusion construct (Sarov et al, 2016), confirming knock‐down efficiency (Fig EV1D and E). Under these conditions, the size of the dorsal compartment is also reduced compared to the ventral compartment (compare Fig EV1D/D′ with E/E′, quantified in G). Staining for activated Caspase‐3 (Cas3*) revealed that cell death is only increased in the dorsal compartment after very long inductions of ecd RNAi and not yet by 48 h (Fig 1D″–F″, quantified in H), consistent with what has been observed in ecd mutant clones (Gaziova et al, 2004; Claudius et al, 2014). We conclude that ecd knock‐down first reduces tissue growth and later activates apoptosis.
We next explored the potential for Ecd to regulate wing disc metabolism. Given that ecd knock‐down in pancreatic cancer cells lowers steady‐state ATP levels (Dey et al, 2012), we tested whether its knock‐down in Drosophila has similar effects. We induced ecd RNAi for 48 h in the dorsal compartment of ubi‐AT1.03NL wing discs using apGal ts and observed a drop in steady‐state levels of ATP in the dorsal ecd RNAi tissue (Fig 1L and M), mimicking the effect of glycolytic enzyme knock‐down in the wing (Fig 1G–K) and loss of Ecd in pancreatic cancer cells (Dey et al, 2012).
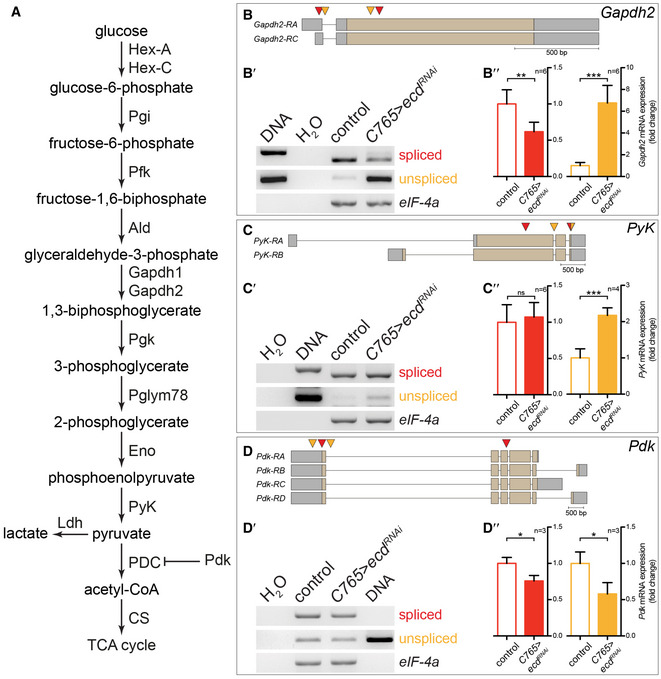
Given that Ecd is known to interact with basic components of the splicing machinery (Guruharsha et al, 2011; Havugimana et al, 2012; Claudius et al, 2014; Hein et al, 2015), we investigated the possibility that the reduction of ATP levels upon ecd knock‐down could be caused by aberrant splicing of glycolytic enzymes. Semi‐quantitative RT–PCR analysis of selected glycolytic enzymes indeed revealed reduced splicing of Gapdh2 and PyK mRNA, and lowered levels of both spliced and unspliced mRNAs for Pyruvate dehydrogenase kinase (Pdk) upon knock‐down of ecd throughout the entire wing disc (C765>ecd RNAi, Fig EV2A–D). The expression and splicing of the translation initiation factor eIF‐4a was not affected by loss of Ecd, however, indicating that there is not a general block in splicing efficiency (Appendix Fig S3E–E″). We observed the same effect on Gapdh2 splicing upon knock‐down of the interacting partner of Ecd, brr2, a core member of the splicing machinery (C765>brr2 RNAi, Appendix Fig S4A and A′).
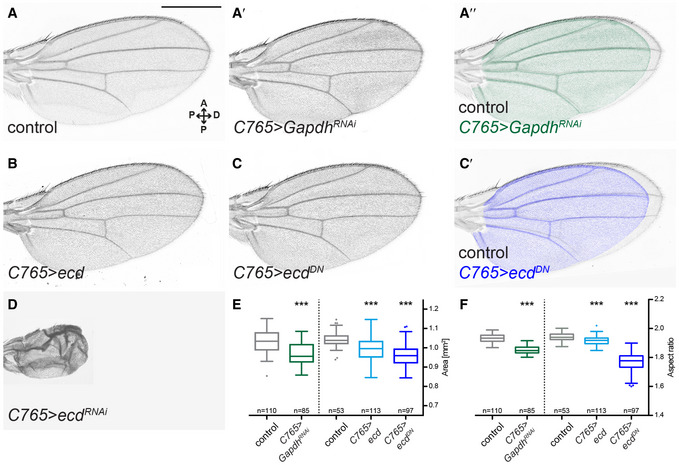
Lastly, we assessed the phenotypic consequences of Ecd loss of function on the adult wing morphology. The ecd RNAi is problematic for this purpose, given that long‐term induction produces adults with vestigial wings (Claudius et al, 2014) (Fig 2D). Thus, we devised an alternative approach of over‐expressing a dominant‐negative allele (see Methods). Expression of this construct has the same effect on Gapdh2 splicing as ecd RNAi (C765>ecd DN, Appendix Fig S4B and B′). In other respects, this construct produces milder phenotypes than ecd RNAi, giving rise to flies with smaller wings that are proportionally broader along the A/P axis—similar to the knock‐down of Gapdh, as well as other glycolytic enzymes (Fig 2A–C′, E and F, Appendix Fig S2).
Taken together, our results are consistent with the hypothesis that the glycolysis‐promoting function of Ecd shown in yeast and in human cells is conserved in Drosophila. Ecd is required autonomously for tissue growth, correct splicing of several glycolytic enzymes, maintenance of steady‐state levels of ATP and properly proportioned adult wings. While we cannot rule out the possibility that loss of Ecd also affects genes unrelated to glycolysis, the phenotypic similarity with respect to ATP levels and adult wing phenotype between Gapdh and Ecd loss of function suggests that they act functionally in the same pathway and that aberrant splicing of Gapdh2 contributes to the growth defect in the wing.
Glycolytic activity influences Smoothened membrane accumulation
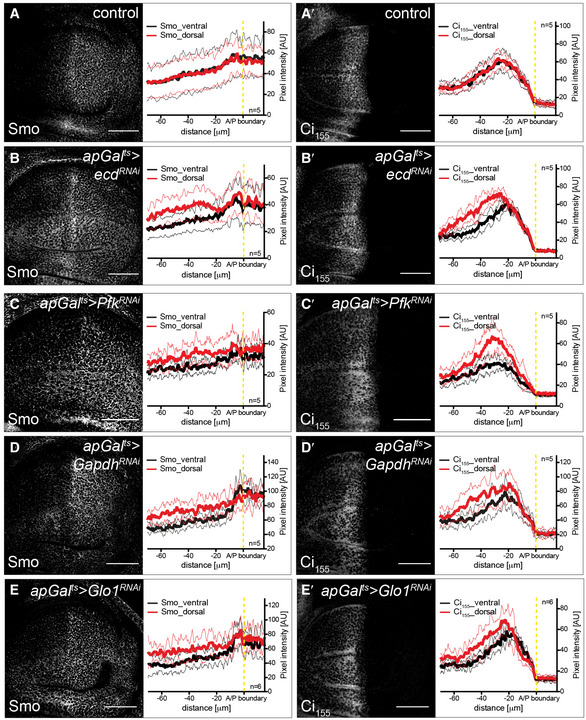
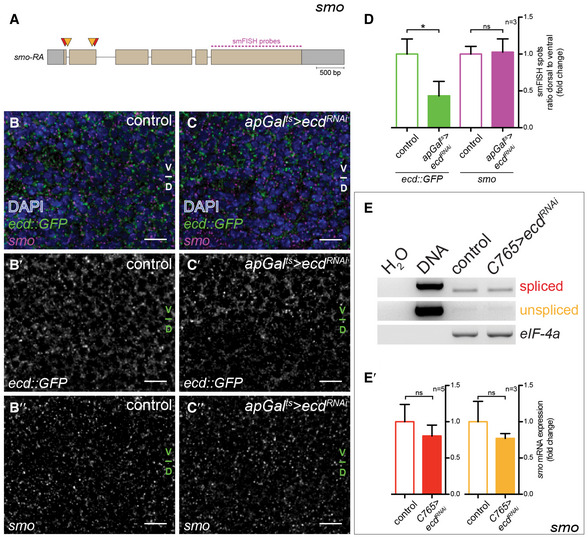
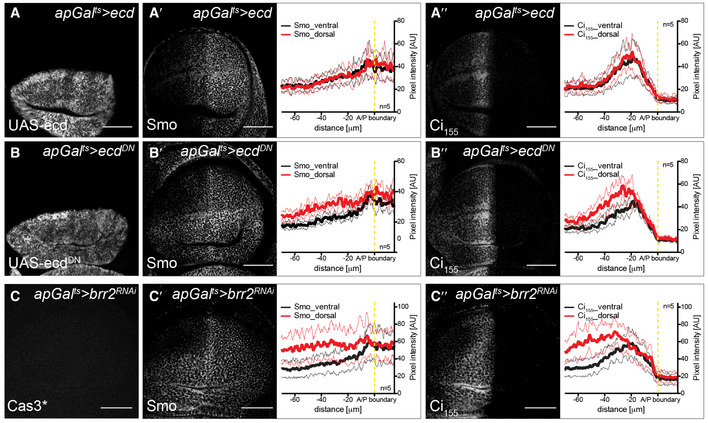
The wing shape phenotype exhibited by Ecd and glycolytic enzymes, such as Gapdh, suggests that they can affect the signalling systems that drive tissue growth and patterning. We next explored the coupling between metabolism and Hh pathway activity by determining how Smo membrane localization is affected by loss of glycolytic activity. We found that loss of Ecd autonomously elevates Smo accumulation on the basolateral membrane (Fig 3A and B) without altering levels or splicing of smo mRNA (Fig EV3). Additionally, loss of Ecd stabilizes Ci155 in most of the anterior compartment, except at the most anterior end (Fig 3A′ and B′). Expression of the dominant‐negative Ecd construct (apGal ts >ecd DN, Fig EV4A–B″) had the same effect. Also, we found that inducing RNAi against the splicing component brr2 similarly affected Smo and Ci155 (apGal ts >brr2 RNAi, Fig EV4C–C″), indicating that the function of Ecd as a splicing regulator is likely important for its role in affecting Hh signalling. To confirm that glycolysis specifically could cause such effect on Hh signalling, we again used the knock‐downs of single metabolic enzymes. Indeed, we found that RNAi directed against Pfk, Gapdh and Glo1 also induced Smo accumulation and Ci155 stabilization (Fig 3C–E′). Taken together, these data suggest that interfering with glycolysis increases the stability of Smo and its ability to block the processing of Ci155 to its repressor form.
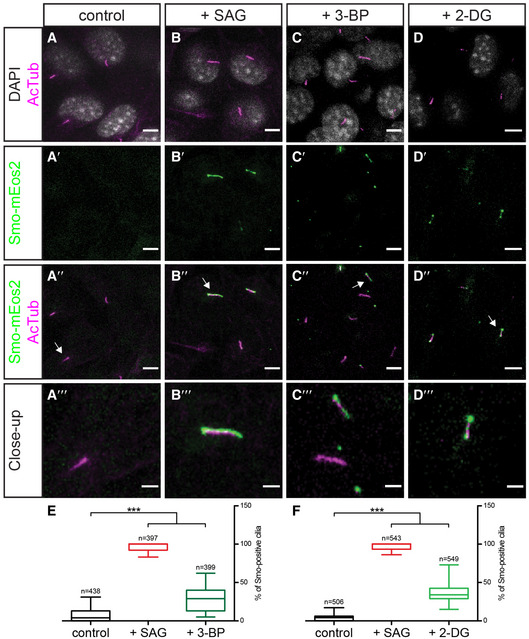
We next investigated whether the influence of glycolysis on Smo membrane localization is conserved across phyla. In mammalian cells, activation of Hh signalling causes Smo to accumulate in the primary cilium (Corbit et al, 2005; Rohatgi et al, 2007), rather than on the basolateral membrane as in Drosophila. We inhibited glycolysis pharmacologically by treating NIH3T3 cells expressing Eos‐tagged Smo (Smo‐mEos2) (Kim et al, 2014) with either 3‐bromopyruvate (3‐BP) or 2‐deoxyglucose (2‐DG). 2‐DG inhibits hexokinase, while 3‐BP inhibits both hexokinase and Gapdh (Ganapathy‐Kanniappan et al, 2013). In cells treated with 2‐DG or 3‐BP, Smo‐mEos2 accumulates in the primary cilium despite the fact that Hh ligands are not present (Fig 4A–F), indicating that glycolytic metabolism is required to keep Smo out of the primary cilium in mammalian cells in the absence of Hh ligands. This result indicates that the effect of cell metabolism on Smo accumulation is conserved across phyla.
Loss of Ecdysoneless sensitizes cells to Hedgehog
To examine whether the effects of metabolism on Drosophila Smo accumulation does not require the Hh ligand, we first investigated how the loss of Ecd influences the distribution of Hh. Immunostaining revealed no obvious differences in Hh protein levels or distribution upon ecd knock‐down in the dorsal compartment (Fig 5A and B). Thus, loss of Ecd does not stabilize Smo protein by increasing the amount of Hh released into the anterior compartment. We then specifically knocked down ecd in the posterior Hh‐producing cells and observed no effect on Smo levels in the anterior compartment (Appendix Fig S5), again suggesting that Ecd does not act by regulating Hh production. In contrast, anterior knock‐down of ecd stabilized both Smo and Ci155 (Appendix Fig S6), suggesting that Ecd normally acts directly in receiving tissue to prevent ectopic Smo activation. These results are consistent with the early observation that whole animal mutants of ecd can be rescued by driving Ecd expression specifically in Hh‐receiving but not producing cells (Gaziova et al, 2004).
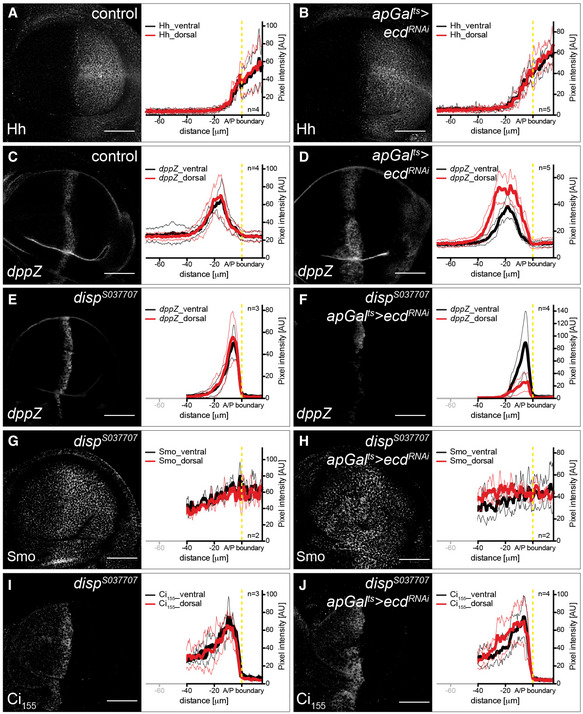
To test whether Hh ligand contributes to the effect of Ecd on the Hh signalling pathway, we examined target gene expression in a dispatched (disp) mutant background. Disp is required for the release of Hh ligands from producing cells (Burke et al, 1999). In the presence of Disp, loss of Ecd broadens the range of dppZ expression (Fig 5C and D). However, in the absence of Disp, when Hh ligands cannot be released, ecd knock‐down actually reduces dppZ expression (Fig 5E and F). This result indicates that Hh ligand is required for target gene activation upon ecd knock‐down. Even though target gene activation is reduced, however, knock‐down of ecd in a disp mutant does not reduce Smo membrane accumulation or Ci155 stabilization but actually slightly increases it (Fig 5G–J). In this case, how could the knock‐down of ecd affect target gene activation but not Ci and Smo? Our previous published results suggest that stabilization and activation of Ci155 are differently affected by lipoprotein‐associated (Lpp‐associated) Hh and sterol‐free Hh (HhN) (Khaliullina et al, 2009; Palm et al, 2013). In this way, the phenotype caused by loss of Ecd resembles that of flooding wing discs with Lpp‐associated Hh (and the phenotype caused by lpp knock‐down)—it can stabilize Ci155 but must cooperate with another form of Hh to activate Ci155 for target gene activation. When imaginal discs are exposed to Lpp‐associated Hh, they require much lower levels of HhN to fully activate target genes (Palm et al, 2013). Similarly, stabilization of Ci155 by ecd RNAi appears to sensitize imaginal cells to the endogenous Hh emanating from the posterior compartment—allowing the same levels of Hh to activate Ci‐dependent gene expression over a broader range.
In total, our data from Drosophila suggest that, as in mammalian cells, perturbation of glycolysis affects the Hh signalling pathway without requiring the Hh ligand. We note, however, that the effects of loss of Ecd in Drosophila are more pronounced in the presence of ligand, indicating that Hh activation of the pathway contributes to the Ecd phenotype.
Plasma membrane potential depends on glycolysis
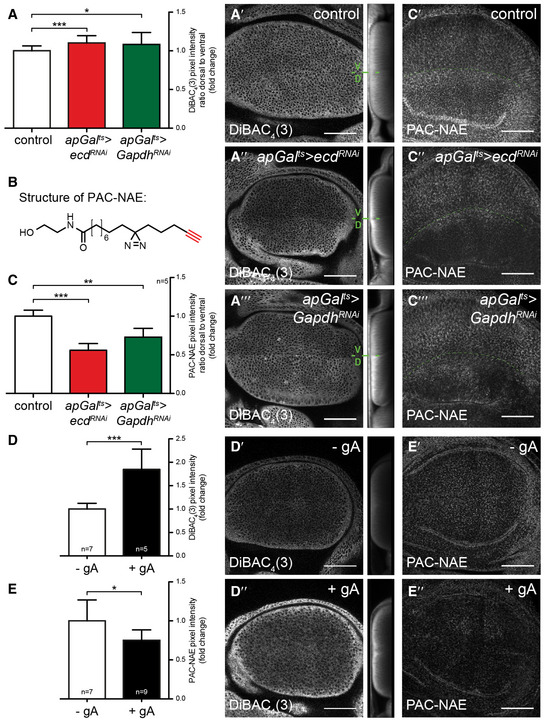
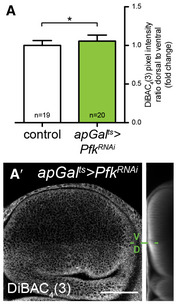
How could changes in metabolism stabilize Smo independently of the Hh ligand? Several small lipidic molecules are known to modulate Smo activity (Bijlsma et al, 2006; Myers et al, 2013, 2017; Khaliullina et al, 2015; Huang et al, 2016; Byrne et al, 2018). Many small metabolites depend on Na+‐driven transporters for their uptake into cells (Tsukaguchi et al, 1999; Ritzel et al, 2001; Wright et al, 2004; Gurav et al, 2015). Indeed, Ptc activity has recently been shown to be Na+‐dependent (Myers et al, 2017). The transmembrane Na+ gradient that drives these transport processes is generated by the Na+/K+‐ATPase. This electrogenic pump produces opposing gradients of Na+ and K+ across the plasma membrane and establishes the transmembrane potential. Experiments in other cells suggest that the activity of the Na+/K+‐ATPase is coupled to glycolysis. Two sequential glycolytic enzymes, Gapdh and Pgk, are present in complexes with the Na+/K+‐ATPase and may locally supply it with ATP (Mercer & Dunham, 1981; Balaban & Bader, 1984; Lynch & Balaban, 1987; James et al, 1999). We therefore wondered whether glycolysis might influence Hh signalling through its effects on the plasma membrane potential. To investigate this idea, we asked how loss of Ecd, Pfk or Gapdh affected staining with the plasma membrane potential‐sensitive dye DiBAC4(3). Indeed, induction of RNAi against either ecd or Gapdh in the dorsal compartment of the wing disc lowers plasma membrane potential, compared to the control ventral compartment (Fig 6A–A‴), as does Pfk RNAi (Fig EV5). This result suggests that glycolysis may increase Na+/K+‐ATPase activity in the wing disc.
Cellular N‐acylethanolamide uptake depends on glycolysis and cation gradients
N‐acylethanolamides delivered by the Drosophila lipoprotein, Lipophorin (Lpp), are required for Ptc‐mediated destabilization of Smo in the wing disc (Khaliullina et al, 2009, 2015). Since the Hh pathway is affected similarly by reducing glycolysis and by loss of Lpp, we tested whether the depolarization of the plasma membrane caused by ecd or Gapdh knock‐down might interfere with cellular uptake of N‐acylethanolamides. To study N‐acylethanolamide trafficking, we synthesized a photoactivatable and clickable N‐acylethanolamide analogue (PAC‐NAE). PAC‐NAE contains a C15 fatty acid featuring diazirine and alkyne modifications (Fig 6B). After incubation with tissue explants, PAC‐NAE intracellular localization can be visualized by attaching azide‐modified fluorescent dyes using click chemistry (Haberkant et al, 2013; Gaebler et al, 2016; Höglinger et al, 2017; Müller et al, 2020). To study N‐acylethanolamide trafficking, we loaded PAC‐NAE onto preparations of Drosophila Lpp at levels comparable to those observed in circulation and applied these lipoproteins to explanted wing discs. We then visualized the tissue distribution of PAC‐NAE after attachment of Alexa 555 azide. PAC‐NAE accumulation is autonomously reduced by knock‐down of either ecd or Gapdh in the dorsal compartment (Fig 6C–C‴). In Gapdh RNAi tissue, the reduction of PAC‐NAE uptake is less pronounced near the A/P boundary (Fig 6C‴). Overall, these data indicate that reducing glycolysis inhibits uptake of PAC‐NAE. To determine whether plasma membrane depolarization would be sufficient to account for this inhibition, we applied PAC‐NAE to wing discs that were incubated with gramicidin A (gA), which forms cation‐permeable channels that dissipate the plasma membrane potential (Fig 6D–D″). GA treatment strongly reduces uptake of PAC‐NAE compared to control discs (Fig 6E–E″). Taken together, these data suggest that reducing glycolysis stabilizes Smo and Ci155 in a Hh‐independent fashion by altering the plasma membrane potential and inhibiting N‐acylethanolamide uptake.
Discussion
Patterns of growth and differentiation during development are functionally associated with changes in cell metabolism (Kaelin & McKnight, 2013; Shyh‐Chang et al, 2013; Buck et al, 2015; Oginuma et al, 2017; Müller et al, 2020). Shifts between oxidative and glycolytic metabolism can alter the balance of differentiated T‐cell and macrophage populations (Buck et al, 2015), and regulate the balance of proliferation and differentiation in the mouse cerebellum (Gershon et al, 2013) and in Drosophila neuroblasts (Homem et al, 2014). While it is clear that metabolite levels can exert strong effects on histone acetylation and methylation (Agathocleous & Harris, 2013; Kaelin & McKnight, 2013; Shyh‐Chang et al, 2013), many mysteries remain about how metabolic shifts cause changes in gene expression programs.
Many intriguing studies have also linked tissue growth, patterning and regeneration to changes in plasma membrane potential (Levin, 2007). For example, frog and chick embryos develop differences in transmembrane potential on the left and right sides of the primitive streak that are important for left–right symmetry breaking (Levin, 2007). In planaria, plasma membrane potential is lower in the head than in the tail, and reducing plasma membrane potential during regeneration leads to two‐headed worms (Beane et al, 2011). It has been challenging to identify the molecular mechanisms underlying such dramatic developmental changes.
Here, we establish a mechanistic link between cell metabolism, plasma membrane potential and developmental signalling. We show that changes in cell metabolism alter the plasma membrane potential and that altered plasma membrane potential directly influences the activity of the Hh pathway. Interestingly, other studies have shown that inhibiting glycolysis phenocopies loss of Wnt signalling during vertebrate somitogenesis (Oginuma et al, 2017) and alters Notch signalling in the Drosophila wing disc (Saj et al, 2010), although the mechanistic bases of these effects are not known. Thus, it appears that the metabolic state of developing tissues may broadly influence how they respond to many morphogenetic signals. It will be interesting to investigate whether changes in plasma membrane potential might affect the activity of these pathways.
Our findings highlight an important role for glycolysis in maintaining plasma membrane potential in the wing disc. The activity of the Na+/K+‐ATPase is key to generating plasma membrane potential—it consumes ATP to pump 3 Na+ out of the cell for every 2 K+ that enter the cell (Skou & Esmann, 1992). Resting plasma membrane potential is further tuned by channels that control cellular permeability to specific anions and cations (Ashmore & Meech, 1986). Previous studies in cultured cells have suggested that the activity of the Na+/K+‐ATPase is coupled to glycolysis. Glycolysis appears to be more efficient than oxidative phosphorylation in supplying ATP to the Na+/K+‐ATPase (Balaban & Bader, 1984; James et al, 1999), and work in erythrocytes suggests this could be due to its physical association with a membrane pool of Gapdh and Pgk (Mercer & Dunham, 1981). Our finding that ecd, Gapdh and Pfk knock‐down each alters the plasma membrane potential in the wing disc suggests that Na+/K+‐ATPase activity in this tissue may also be preferentially supported by glycolysis. It will be interesting to explore whether a subset of glycolytic enzymes associates with the Drosophila Na+/K+‐ATPase.
We show that the plasma membrane potential is necessary for the cellular uptake of N‐acylethanolamide. Endocannabinoid family lipids delivered to the wing disc by circulating lipoproteins are required to prevent Smo activation in the absence of Hh ligands (Khaliullina et al, 2009, 2015; Palm et al, 2013). The potential energy available from the transmembrane Na+ gradient generated by the Na+/K+‐ATPase is exploited by many transmembrane transporters to move a wide variety of nutrients and other small molecules into cells (Tsukaguchi et al, 1999; Ritzel et al, 2001; Wright et al, 2004; Bergeron et al, 2013), and our data are consistent with the idea that N‐acylethanolamide uptake depends on such a Na+‐coupled transporter. Interestingly, recent work suggests that the repressive activity of Ptc relies on the Na+ gradient (Myers et al, 2017). Several studies suggest a key role for cholesterol in Smo activation and suggest that Ptc might deplete cholesterol from the vicinity of Smo (Myers et al, 2013, 2017; Huang et al, 2016; Byrne et al, 2018; Zhang et al, 2018). It has also been proposed that Ptc regulates trafficking of an inhibitor that competes with cholesterol for Smo binding (Myers et al, 2017). It will be interesting to explore whether Ptc affects N‐acylethanolamide uptake, or whether these lipids depend on other membrane potential‐dependent transporters.
In summary, we have revealed a molecular mechanism through which glycolysis affects Hh pathway activity in both Drosophila and mammalian cells. Changes in glycolysis leading to lower ATP levels depolarize the plasma membrane and thereby reduce uptake of Hh pathway inhibitory lipids. This work is an important step towards understanding how membrane potential influences development and regeneration. Furthermore, this work provides mechanistic insight into how cellular metabolism can be connected to the conserved developmental signalling pathways that regulate tissue growth and patterning.
Materials and Methods
Drosophila stocks and genetics
The following stocks were used: wild‐type Oregon‐R‐C (BDSC, #5), disp S037707 (Burke et al, 1999), dpp‐lacZ BS3.0 (Blackman et al, 1991), fosEcd (Sarov et al, 2016), Gapdh1::GFP V5 (this study), GFP Myc ::Gapdh2 (this study), ubi‐AT1.03NL (this study), ap‐Gal4 (BDSC, #3041), C765‐Gal4 (BDSC, #36523), dpp‐Gal4 (BDSC, #1553), en(105)‐Gal4 (Eugster et al, 2007), tub‐Gal80 ts (BDSC, #7019 or #7017), UAS‐Ald RNAi (VDRC, #101339, #27541 or #47668), UAS‐brr2 RNAi (VDRC, #110666), UAS‐ecd RNAi (BDSC, #41676 or VDRC, #103145), UAS‐Eno RNAi (VDRC, #110090), UAS‐Gapdh RNAi (BDSC, #26302), UAS‐Gapdh1 RNAi (BDSC, #36842, #62212; VDRC #31631 or #100596), UAS‐Gapdh2 RNAi (VDRC, #106562, #23645, or #23646), UAS‐Glo1 RNAi (VDRC, #26832), UAS‐Hex-A RNAi (BDSC, #35155), UAS‐Pfk RNAi (VDRC, #3017), UAS‐Pgk RNAi (BDSC, #33633; VDRC, #110081 or #33798), UAS‐PyK RNAi (BDSC, #35218 or VDRC, #49533), UAS‐Treh RNAi (BDSC, #50585, #51810 or VDRC, #30731), UAS‐ecd::TAG (this study) and UAS‐ecdQ650*::TAG (this study).
For all experiments, flies were raised on a standard food containing cornmeal, malt, sugar beet syrup, yeast and soy meal. If not specified otherwise, experiments were performed at 25°C. For all experiments using ap‐Gal4, tub‐Gal80 ts (apGal ts), larvae were grown at 20°C until day 1–6 after an overnight egg collection (AEL), then transferred to 30°C and dissected 30, 48, 96 or 120 h later. For the experiment using dpp‐Gal4, tub‐Gal80 ts (dppGal ts), larvae were grown at 20°C until day 5 AEL, then transferred to 30°C and dissected 48 h later. For all experiments using C765‐Gal4, larvae were transferred to 29°C immediately AEL at 25°C. In all cases, respective controls were handled in the same manner.
The genotypes of the wing discs and adult wings analysed in this paper are described in Appendix Table S1.
Generation of transgenic flies
Sequence information of the oligonucleotides used for the generation of transgenic flies is listed in Appendix Table S2.
The FRET‐based ATP sensor ubi‐AT1.03NL line was generated as follows. The ATP sensor sequence was amplified from the pUAST‐AT1.03NL plasmid (a gift from T. Uemura, Graduate School of Biostudies, Kyoto University, Kyoto, Japan) (Tsuyama et al, 2013) using the primers AT_NL_AvrII_f and AT_NL_SpeI_r, and cloned into the pCM43‐ubi‐SV40 vector (Aigouy et al, 2010). Transgenic flies were generated by phiC31‐mediated integration into the VK00033 landing site by BestGene (Chino Hills, CA, USA).
The CRISPR/Cas9 Gapdh1::GFP and GFP::Gapdh2 lines were generated according to Port et al (2014). Briefly, the optimal protospacer‐adjacent motif (PAM) was selected with the online tool (http://targetfinder.flycrispr.neuro.brown.edu/) (Gratz et al, 2014) and located 11 bp downstream of the start codon of Gapdh1 and Gapdh2, respectively. For Gapdh1::GFP, oligos for gRNAs (Gapdh1_sense and Gapdh1_antisense) were ordered from Sigma‐Aldrich (Munich, Germany) and cloned into pCFD3 vector (Port et al, 2014). Two homology arms (~1.2 kb each) were amplified from gDNA generated from wild‐type flies by PCR using the primer pairs Gapdh1_left_f & Gapdh1_left_r and Gapdh1_right_f & Gapdh1_right_r, and the sGFP‐tag was amplified from the fosEcd construct encoding C‐terminally tagged Ecd (Sarov et al, 2016) using the primers Gapdh1_sGFP_f & Gapdh1_sGFP_r. The primers Gapdh1_sGFP_r and Gapdh1_right_f additionally contained a V5‐tag sequence. To generate the construct for homology‐directed repair (HDR), the amplified PCR products encoding the left homology arm, sGFP‐ and V5‐tag, and the right homology arm were cloned together into pBluescript‐KS(+) (a gift from E. Knust, MPI‐CBG, Dresden, Germany) by Gibson assembly. For GFP::Gapdh2, the following oligos for gRNAs (Gapdh2_sense and Gapdh2_antisense) were ordered and cloned into pCFD3 vector. Two homology arms (~1.1 kb each) were amplified from gDNA generated from wild‐type flies by PCR using the primer pairs NotI_Gapdh2_f & NcoI_Gapdh2_r and EarI_Gapdh2_f & KpnI_Gapdh2_r, and the sGFP‐tag was amplified from the fosEcd construct encoding C‐terminally tagged Ecd (Sarov et al, 2016) using the primers NcoI_Gapdh2_sGFP_f & EarI_Gapdh2_sGFP_r. The primers EarI_Gapdh2_sGFP_r and EarI_Gapdh2_f additionally contained a 3xMyc‐tag sequence. To generate the construct for homology‐directed repair (HDR), the amplified PCR products encoding the left homology arm, sGFP‐ and 3xMyc‐tag, and the right homology arm were cloned together into pBluescript‐KS(+) by standard molecular biology techniques. For both Gapdh1::GFP and GFP::Gapdh2, respective plasmids (gRNAs and HDR) were validated by sequencing and then injected into embryos expressing Cas9 under control of nanos promoter (BDSC, #54591). F0 flies were crossed to w1118 line (BDSC, #3605), and F1 progeny was screened for GFP signal. The founder flies were verified by sequencing, and the genetic background was cleaned by outcrossing to w1118 for three generations.
The UAS‐ecd and UAS‐ecd DN lines were generated as follows. For generation of the UAS‐ecd::TAG (UAS‐ecd) construct, the ecd gene was amplified from cDNA generated from wild‐type flies using the primers NotI_cEcd_f and SacI_cEcd_r, and the protein tag (TAG = 2xTY1‐SGFP‐V5‐preTEV‐BLRP‐3xFLAG) was amplified from the fosEcd using the primers SacI_fosEcd_f and KpnI_fosEcd_r. Both fragments were cloned into the pUASTattB vector (Bischof et al, 2007) using standard ligation. The UAS‐ecdQ650*::TAG (UAS‐ecdDN) construct is based on a lethal ecd allele, ecd l(3)23, whose predicted mutant protein product is missing the C‐terminal 35 amino acids (Gaziova et al, 2004). The ecd gene was amplified from cDNA generated from wild‐type flies using the primers NotI_cEcd_f and Q650*_r, and the protein tag (TAG = 2xTY1‐SGFP‐V5‐preTEV‐BLRP‐3xFLAG) was amplified from the fosEcd construct using the primers Q650*_f and KpnI_fosEcd_r. Both fragments were fused together using overlap extension PCR and then cloned into the pUASTattB vector using standard ligation. Before injections, all constructs were confirmed by sequencing. Transgenic flies were generated by phiC31‐mediated integration into the VK00033 landing site (BDSC, #24871).
Mammalian cell culture
NIH3T3/Smo‐mEos2 cells (Kim et al, 2014) (a gift from P. Beachy, SUSM, Stanford, CA, USA) were grown to confluence on coverslips in DMEM (Thermo Fisher Scientific, #31966021) supplemented with 10% FBS (Thermo Fisher Scientific, #10270106), 1% penicillin/streptomycin (Thermo Fisher Scientific, #15140122) and 1% MEM non‐essential amino acids (Thermo Fisher Scientific, #11140050) at 37°C. For SAG, 3‐BP and 2‐DG treatment, cells were then shifted to serum‐deprived medium containing 0.5% FBS instead of 10% FBS and incubated for 24 h with 100 nM SAG (Merck, #566660), 25 mM of 2‐DG (ROTH, #CN96.3) or 15 μM 3‐BP (Sigma‐Aldrich, #16490‐10G), respectively, or without any compound at 37°C.
Anti‐Ecd antibody
For anti‐Ecd, a peptide corresponding to amino acids 670–684 of Drosophila Ecd (FlyBase: CG5714‐PA) was conjugated to keyhole limpet hemocyanin (KLH) and used to immunize guinea pigs (Eurogentec, Seraing, Belgium).
Measurement of ATP using FRET‐based ATP sensor
Wing discs from up‐crawling third‐instar larvae were dissected within 10 min in Grace’s medium supplemented with 5% FBS and 20 nM 20‐hydroxyecdysone (Dye et al, 2017). Dissected wing discs were mounted with their basal side up on glass‐bottom dishes (MatTek Corporation, #P35G‐1.0‐20‐C) with a double‐sided tape spacer and immobilized with a Whatman™ Cyclopore™ track‐etched polycarbonate membrane filter (GE Healthcare Life Sciences, #7062‐2513). Imaging of ubi‐AT1.03NL wing discs was performed on an Olympus IX81 microscope equipped with Yokogawa spinning disk (CSU‐W1, Yokogawa) and Ixon Ultra EMCCD camera (Andor). The sensitized emission method was used to measure FRET. Wing discs were excited with a 445 nm laser twice in a sequential manner. Upon first excitation, emission of mse‐CFP was collected using an HQ 480/40 bandpass filter. Upon second excitation, emission of cpVenus‐FRET was collected using an HQ 542/27 filter. The emission of cpVenus‐FRET has contributions from the energy transfer from mse‐CFP and bleed‐through of mse‐CFP into the HQ 542/27 filter. The bleed‐through was estimated by exciting wing discs expressing CFP‐tagged human cytoplasmic β‐actin (BDSC, #7064) under the control of ubi‐Gal4 and acquiring images through an HQ 480/40 filter (I D) and its bleed‐through in an HQ 542/27 filter (I bth). The fraction of FRET intensity contributed by bleed‐through is given by,
For the acquisition of a z‐stack of a wing disc, donor and FRET images were sequentially acquired for each z‐plane before moving the stage to the next plane. Wing discs were imaged using 30 z‐planes 0.5 μm apart.
A custom‐written MATLAB (MathWorks) script was used to estimate the FRET efficiency from the fluorescence images. Both donor and FRET images were smoothened using a 5 × 5 averaging kernel. The background was estimated from a region of the image without the wing disc. Donor (I D) and FRET (I F) images were background subtracted. Then, the FRET intensity was corrected for bleed‐through as,
The FRET efficiency (η) was calculated as,
Antimycin A treatment
Samples were prepared and placed on the microscope stage. Immediately after imaging for the first time (time point 0 h), 100 μM antimycin A (Sigma‐Aldrich, #A8674) was added.
Immunofluorescence
Wing discs from up‐crawling third‐instar larvae were stained as described earlier (Greco et al, 2001). Briefly, wing discs were dissected in PBS, fixed in 4% paraformaldehyde for 20 min and rinsed five times in PBS. Wing discs were then permeabilized with 0.05% Triton X‐100 in PBS (PBX) twice for 10 min, blocked three times for 15 min in PBX + 1 mg/ml BSA + 250 mM NaCl and incubated overnight with the primary antibody in PBX + 1 mg/ml BSA (BBX) at 4°C. After washing twice for 20 min in BBX, wing discs were blocked twice for 20 min in the blocking solution BBX + 4% normal goat serum and incubated for at least 3 h with the secondary antibody in the blocking solution. After washing three times for 15 min each in PBX and twice in PBS, wing discs were finally mounted in VectaShield® (Vector Labs, #H‐1000). To stain ring glands, ring glands from up‐crawling third‐instar larvae were dissected and fixed as wing discs but were then permeabilized with 0.1% Triton X‐100 in PBS three times for 10 min, blocked for 30 min – 1 h in 0.1% Triton X‐100 in PBS + 10% normal goat serum and incubated overnight with the primary antibody in the blocking solution at 4°C. After washing three times for 10 min in blocking solution, ring glands were incubated for 3 h with the secondary antibody in the blocking solution. After washing twice for 10 min with 0.1% Triton X‐100 in PBS and once with PBS, ring glands were finally mounted in ProLong Gold (Thermo Fisher Scientific, #P10144). The following primary antibodies were used: rabbit anti‐cleaved Caspase‐3 (Asp175) (1:500) (Cell Signaling #9661), mouse anti‐Dlg (1:200) (DSHB, #4F3, concentrate), chicken anti‐ß Galactosidase (1:2,000) (Abcam, #ab134435), rat anti‐Ci155 (1:30) (DSHB, #2A1, concentrate), rat anti‐Crb2.8 (1:1,000) (Richard et al, 2006) (a gift from E. Knust, MPI‐CBG, Dresden, Germany), chicken anti‐GFP (1:1,000) (Abcam, #ab13970), rabbit anti‐GFP (1:1,500) (Thermo Fisher Scientific, #A‐11122), rabbit anti‐Hh (1:500) (Richard et al, 2006) and mouse anti‐Smo (1:50) (DSHB, #20C6, concentrate). Secondary antibodies conjugated with Alexa Fluor® 488, 555 and 647 were diluted 1:1,000 or, in the latter case, 1:500 (Thermo Fisher Scientific).
NIH3T3/Smo‐mEos2 cells treated with SAG, 2‐DG or 3‐BP were rinsed with PBS a few times before fixing with 4% paraformaldehyde for 10 min at room temperature. After washing twice with PBS, cells were permeabilized with 0.15% Triton X‐100, 5% normal goat serum and 0.1% BSA in PBS for 20 min at room temperature. Then, cells were incubated overnight at 4°C with anti‐acetylated tubulin (1:1,000) (Sigma‐Aldrich, #T7451) as primary antibody to stain for primary cilia. After washing several times with PBS, cells were incubated with goat anti‐mouse Alexa Fluor® 647 (1:1,000) (Thermo Fisher Scientific, #A‐21236) as secondary antibody for 1 h at room temperature. Cells were washed again before staining with DAPI (1:10,000) (Roche, #10236276001) for 10 min at room temperature and then mounted onto glass slides in VectaShield®.
smFISH
Custom Stellaris® FISH probes were designed against GFP or smo mRNA by utilizing the Stellaris® FISH probe designer Biosearch Technologies, Inc. (Petaluma, CA, USA). Wing discs were hybridized with GFP and smo Stellaris® FISH probe sets labelled with Quasar 670 and Quasar 570 (Biosearch Technologies, Inc.), respectively, following the manufacture’s protocol using 250 nM per probe set. Briefly, wing discs from up‐crawling third‐instar larvae were dissected in PBS, fixed with 4% paraformaldehyde for 40 min on ice and then washed twice in PBS for 5 min. For permeabilization, wing discs were incubated overnight in 70% ethanol at 4°C. After washing for 10 min with wash buffer A (Biosearch Technologies, #SMF‐WA1‐60), wing discs were incubated overnight with Stellaris® FISH probes in hybridization buffer (Biosearch Technologies, #SMF‐HB1‐10) at 37°C. Subsequently, wing discs were washed in wash buffer A for 30 min at 37°C and in wash buffer B (Biosearch Technologies, #SMF‐WA1‐20) for 30 min at room temperature. Wing discs were finally mounted in VectaShield®.
RNA extraction and cDNA synthesis
For each genotype, 50 wing discs were dissected in ice‐cold PBS from up‐crawling third‐instar larvae and collected in an iced 1.5‐ml microcentrifuge tube. PBS was removed as much as possible before proceeding immediately with total RNA extraction using the RNeasy Mini Kit (Qiagen, #74104) according to the manufacturer’s protocol (including on‐column DNase digestion). Then, 500 ng of total RNA was used to synthesize cDNA from polyadenylated RNA using SuperScript® III Reverse Transcriptase Kit (Thermo Fisher Scientific, #18080093) according to the manufacturer’s protocol.
Semi‐quantitative PCR
PCR using Phusion High‐Fidelity DNA Polymerase (NEB, #M0530L) was performed according to standard protocols (27 cycles) with 2 μl of cDNA, using water as a negative control and genomic DNA from wild‐type flies (50–75 ng/μl) as a positive control. The intensities of the PCR bands were quantified using the Gels plugin in Fiji (Schindelin et al, 2012). The following primer pairs were used (see Appendix Table S3 for sequence information): eIF4A‐F and eIF4A‐R, eIF4A_intron_f and eIF4A_intron_r, Gapdh2‐F and Gapdh2‐R, Gapdh2‐intron‐F and Gapdh2‐intron‐R or Gapdh2‐intron‐R2, Pdk‐F and Pdk‐R, Pdk‐intron‐F and Pdk‐intron‐R, PyK‐F and PyK‐R, PyK‐intron‐F and PyK‐R, smo‐F and smo‐R, and smo‐intron‐F and smo‐intron‐R.
Protein extracts from wing imaginal discs
For each genotype, 25 wing discs were dissected in ice‐cold PBS from up‐crawling third‐instar larvae and collected in an iced 1.5‐ml microcentrifuge tube. PBS was removed as much as possible before adding 25 μl RIPA buffer (50 mM Tris–HCl pH 7.5, 150 mM NaCl, 0.1% SDS, 1% sodium deoxycholate, 1% Triton X‐100, 1% NP‐40). Samples were homogenized on ice using a BioVortexer. SDS loading buffer was added to the samples before analysed by Western blotting.
Western blotting
Western blotting was essentially performed according to standard protocols. The primary antibodies used were as follows: goat anti‐E‐Cad dP‐20 (1:100) (Santa Cruz Biotechnology, #sc‐15751) and guinea pig anti‐Ecd C‐term (1:750) (this study). The secondary antibodies used were as follows: anti‐goat HRP (1:5,000) (Millipore, #AP180P) and anti‐guinea pig HRP (1:2,500) (Dianova, #106‐035‐003).
Membrane potential assay
To investigate the plasma membrane potential, we used the membrane potential‐sensitive dye DiBAC4(3) (Thermo Fisher Scientific, #B438). Wing discs from up‐crawling third‐instar larvae were dissected in Grace’s medium supplemented with 5% FBS and 20 nM 20‐hydroxyecdysone (full medium) (Dye et al, 2017), and incubated with 500 nM DiBAC4(3) in full medium for 15 min at 29°C. After washing twice with full medium, wing discs were mounted and imaged immediately. A higher fluorescence intensity of DiBAC4(3) indicates depolarization of the plasma membrane.
PAC‐NAE synthesis
PAC‐NAE was synthesized as follows. A solution of PAC‐FA (100 mg, 378 μmol) (Haberkant et al, 2013), HBTU (100 mg, 267 μmol), HOBT (10 mg, 74 μmol) and DIEA (100 μl, 575 μmol) in NMP (3 ml) was treated with ethanolamine (300 μl, 4.97 mmol) and stirred for 1 h. The reaction mixture was transferred onto a mixture of ethyl acetate and H2O (1:1, 200 ml). The layers were separated and the organic layer washed with H2O (3 × 100 ml) and saturated NaCl solution (100 ml) and dried over MgSO4. The solvent was removed under reduced pressure and the residue purified by flash chromatography on silica gel using the eluent system dichloromethane/MeOH 95:5. The product was obtained as a colourless solid.
1H‐NMR (400 MHz, CDCl3) δ = δ 6.03 (s, 1H), 3.76–3.68 (t, J = 5.3 Hz, 2H), 3.41 (m, 2H), 2.25–2.12 (m, 4H), 1.95 (t, J = 2.7 Hz, 1H), 1.62 (m, 2H), 1.48 (m, 2H), 1.40–1.17 (m, 12H), 1.06 (m, 2H) ppm.
13C‐NMR (100 MHz, CDCl3) δ = 174.58, 83.46, 68.88, 62.62, 42.55, 36.56, 32.82, 31.84, 29.17, 29.15, 29.12, 29.09, 28.44, 25.65, 23.77, 22.75, 17.97 ppm.
MS (ESI) calculated for [M+H+]: 308.23, found: 308.23
Yield: 52 mg (169 μmol, 45%)
Lipophorin isolation and labelling with PAC‐NAE
The isolation procedure of Lipophorin (Lpp) particles was adapted from Panakova et al (2005). Briefly, 10 ml feeding third‐instar larvae were first washed with water and then with TNE buffer (100 mM Tris–HCl pH 7.5, 150 mM NaCl, 0.2 mM EGTA, cOmplete™ protease inhibitor cocktail (Roche, #000000011697498001)). All following steps were conducted at 4 °C (unless stated otherwise). Larvae were homogenized in TNE buffer in a tissue grinder with a loose pestle, and the homogenate was centrifuged for 10 min at 1,000 × g and afterwards for 3 h at 142,000 × g. The resulting supernatant (10 ml) was mixed with 40 μl 10 mM PAC‐NAE (EtOH solution) and sonicated for 5 min. Subsequently, KBr was added to a final concentration of 0.33 mg/ml, and the samples were centrifuged at 192,000 × g for 64 h at 8°C. The top fraction (containing labelled Lpp particles) was desalted on NAP‐5 columns (Sigma‐Aldrich, #GE17‐0853‐01). Lpp particles were eluted with Grace’s medium, aliquoted, snap‐frozen and stored at −80°C.
The concentration of PAC‐NAE on Lpp particles was determined by a combination of two‐step lipid extraction, click chemistry and TLC. Briefly, lipids were extracted from Lpp by a two‐step procedure. The volume of Lpp particles was brought to 100 μl with PBS and mixed with 100 μl chloroform:methanol 10:1 (v/v) for 5 min in an Eppendorf ThermoMixer (1200 rpm). Afterwards, samples were centrifuged at 14,000 × g for 5 min and the lower (organic) phase was collected to a new tube. Next, the upper (hydrophilic) phase was re‐extracted with 100 μl chloroform:methanol 2:1 (v/v). The pooled lipid fractions were dried in a SpeedVac, mixed with 30 μl click reaction mixture (0.27 μl 10 mM 3‐azido‐7‐hydroxycoumarin, 6.75 μl 10 mM [acetonitrile]4CuBF4, 22.98 μl EtOH), shortly vortexed and incubated for 30 min in a SpeedVac at 35‐40 °C (until the complete evaporation of the solvent). Afterwards, lipid extracts were dissolved in chloroform:methanol 2:1 (v/v) and 10 μl was applied onto a 10 × 10 cm standard silica TLC plate (Merck, #105633). The plate was developed in CHCl3:MeOH:H2O:AcOH 65:25:4:1 (v/v/v/v) for 5 cm, dried in a stream of warm air and further developed in hexane:ethyl acetate 1:1 (v/v) (9 cm) (adapted from Gaebler et al (2013)). Imaging was performed with a GelDoc system (365 nm). In parallel, the standard curve of PAC‐NAE was prepared and used for calculation of the concentration. The final concentration of PAC‐NAE was within 1–2 μM range.
Lipophorin‐mediated PAC‐NAE uptake
Wing discs from up‐crawling third‐instar larvae were dissected in Grace’s medium, washed twice and incubated for 1 min with 1.5 μM PAC‐NAE labelled Lpp particles. Afterwards, wing discs were washed with PBS and fixed with 4% paraformaldehyde for 20 min at room temperature. After washing twice with 0.05% Triton X in PBS for 10 min, the conjugation between the alkyne (PAC‐NAE) and azide groups (Alexa Fluor 555 azide, Thermo Fisher Scientific, #A20012) was performed via click chemistry reaction using Click‐iT Cell Reaction Buffer Kit (Thermo Fisher Scientific, #C10269). Subsequently, wing discs were mounted in VectaShield® and imaged.
PAC‐NAE uptake after gramicidin A treatment was performed as described above, but wing discs were chased with Grace’s medium supplemented with 5% FBS and 20 nM 20‐hydroxyecdysone (Dye et al, 2017) for 20 min before fixation and click chemistry reaction.
Gramicidin A treatment
Wild‐type wing discs from up‐crawling third‐instar larvae were dissected in Grace’s medium supplemented with 5% FBS and 20 nM 20‐hydroxyecdysone (full medium) (Dye et al, 2017) and incubated with 1 μM gramicidin A (Sigma‐Aldrich, #50845) in full medium for 30 min at 29°C. Before proceeding with either the membrane potential assay or PAC‐NAE uptake, wing discs were washed twice with full medium.
Mounting of adult wings
Male flies were collected in isopropanol 2 days after eclosion. After at least 2 days in isopropanol, wings were dissected in isopropanol and mounted on glass slides using the resin Euparal (Carl‐Roth, #7356.2) as mounting medium.
Microscopy and image analysis
Immunohistochemical images were acquired using a Zeiss LSM 510 confocal microscope equipped with a Plan‐Neofluar 40×/1.3 oil objective, an Olympus FluoViewTM FV1000 confocal microscope equipped with an UPlanSApochromat 60×/1.35 oil objective, or using a Zeiss LSM 880 confocal microscope equipped with a Zeiss C‐Apochromat 40×/1.2 W or Zeiss Plan‐Apochromat 63x/1.4 Oil DIC objective. Images of adult wings were acquired using a Zeiss Axioscan.Z1 widefield slide scanner equipped with a Plan‐Apochromat 10×/0.45 air objective as a series of tiles with 10% overlap that were stitched together by the microscope software (convex hull tile module, online stitching method, Zeiss ZEN). Fiji (Schindelin et al, 2012) was used for image processing and analysis. All images of wing discs were orientated so that the A/P boundary is vertical and the D/V boundary is horizontal, with the anterior compartment to the left and the dorsal compartment to the bottom. Immunohistochemical images show maximal projections that were generated using the maximal intensity function in Fiji.
Only ring glands and wing discs that were processed in parallel, imaged using the same microscope settings, and properly mounted were used for quantifications. For quantification of immunohistochemical staining of CD8::GFP in ring glands, the mean pixel intensity of two regions of interest of 25 × 25 μm per ring gland was determined using ROI manager, and the average of these was used for the statistical analysis. For quantification of compartment size, wing disc folds served as morphological landmarks to outline the region of the wing pouch and the D/V boundary. The area of dorsal and ventral compartment was then determined using ROI manager. For quantification of immunohistochemical staining for Cas3*, regions of interest (87.5 × 22.5 μm each) were selected in the dorsal and ventral compartments and the mean pixel intensity in these regions was determined using ROI manager. For quantification of immunohistochemical stainings for Ci155, dppZ, Hh and Smo, a rectangle of 100 × 20 μm was positioned in a way that 80 μm of its width covered the anterior compartment, while the remaining 20 μm of its width covered the posterior compartment. The A/P boundary was determined according to anti‐Ci155 or anti‐Ptc co‐immunostaining. The pixel intensity was determined as a function of distance from the A/P boundary using the Plot Profile function in FIJI. For quantification of PAC‐NAE pixel intensity upon gramicidin A treatment, a region of interest of 103.5 × 74.5 μm was selected. The mean grey value was measured using ROI manager. PAC‐NAE pixel intensity upon genetic perturbations was quantified the same way, but regions of interest of 80 × 22 μm and 52 × 22 μm were selected anteriorly and posteriorly, respectively, in the dorsal and ventral compartments. Pixel intensity of each compartment is plotted as the average of the anterior and posterior mean grey value. For quantification of DiBAC4(3) pixel intensity, z‐stacks of wing discs were resliced, avoiding interpolation from anterior to posterior. The sum of slices corresponding to 104 μm total thickness was generated. For the analysis of the effect of genetic perturbations, a region of interest of 41.5 μm x the size of the z‐stack was selected in the dorsal and ventral compartments, respectively. For the analysis of the effect of gramicidin A, a region of interest of 83 μm x the size of the z‐stack was selected. The integrated density was measured using ROI manager. For quantification of smFISH spots, regions of interest (75 × 26 μm each) were selected in the dorsal and ventral compartments. After setting the threshold manually, smFISH spots were counted using the 3D Object Counter function. To determine the number of cilia and calculate the percentage of Smo localization in NIH3T3/Smo‐mEos2 cells, images from three technical replicates were analysed using Fiji. The size and shape of adult wings were measured using a custom‐made Fiji macro that calculates the major and minor axes, as well as the total area of the wing blade based on manual delimitation of the perimeter of the wing blade. Pixel calculations were converted into millimetres.
For all quantifications, GraphPad Prism 5 was used to plot the results and to perform the statistical analyses. Statistical details of experiments can be found in the figures and figure legends.
Statistical analysis of Ci155, dppZ, Hh and Smo expression
To determine whether the expression of Ci155, dppZ, Hh and Smo is significantly affected after the different genetic perturbations used in this study, the area under the curve of the representative staining was determined for each wing disc. To correct for differences in staining intensity between wing discs, the ratio of the area under the curve of the representative staining in the dorsal and ventral compartments was calculated for each perturbation and compared to the ratio from control wing discs using Student’s t‐test. For enGal ts > ecd RNAi and dppGal ts >ecd RNAi experiments, differences in staining intensity between wing discs were corrected by adjusting the pixel intensity of control wing discs to match pixel intensity of enGal ts >ecd RNAi or dppGal ts >ecd RNAi wing discs in the posterior compartment. Hence, the areas under the curve of the representative staining in control and enGal ts>ecd RNAi or dppGal ts>ecd RNAi wing discs could be compared using Student’s t‐test.
Conflict of interest
The authors declare that they have no conflict of interest.
Author contributions
SS performed the experiments in Figs 2, 3 and 5, and EV1, EV2, EV3, EV4, EV5, and Appendix Figs S1 and S3–S6. TB generated the Gapdh1::GFP and GFP::Gapdh2 CRISPR/Cas9 lines and performed the experiments in Fig 6. IN performed the experiments in Fig 1, with methods established by KVI, and Appendix Fig S2, with contribution by NAD. SAZ performed the experiments in Fig 4. HK performed key preliminary experiments. AN synthesized PAC‐NAE in consultation with CS. SS and SE designed the study. SS, NAD and SE wrote the manuscript with discussions and feedback from all authors.
Supplementary Materials
- Appendix (PDF)
- Expanded View Figures PDF (PDF)
- Code EV1 (ZIP)
- Source Data for Expanded View and Appendix (ZIP)
- Review Process File (PDF)
- Source Data for Figure 1 (XLSX)
- Source Data for Figure 2 (XLSX)
- Source Data for Figure 3 (XLSX)
- Source Data for Figure 4 (XLSX)
- Source Data for Figure 5 (XLSX)
- Source Data for Figure 6 (XLSX)
References
- Metabolism in physiological cell proliferation and differentiation.. Trends Cell Biol, 2013. [PubMed]
- Cell flow reorients the axis of planar polarity in the wing epithelium of Drosophila .. Cell, 2010. [PubMed]
- Ionic basis of membrane potential in outer hair cells of guinea pig cochlea.. Nature, 1986. [PubMed]
- Studies on the relationship between glycolysis and (Na+ + K+)‐ATPase in cultured cells.. Biochim Biophys Acta, 1984. [PubMed]
- A chemical genetics approach reveals H, K‐ATPase‐mediated membrane voltage is required for planarian head regeneration.. Chem Biol, 2011. [PubMed]
- SLC13 family of Na(+)‐coupled di‐ and tri‐carboxylate/sulfate transporters.. Mol Aspects Med, 2013. [PubMed]
- Repression of smoothened by patched‐dependent (pro‐)vitamin D3 secretion.. PLoS Biol, 2006. [PubMed]
- An optimized transgenesis system for Drosophila using germ‐line‐specific phiC31 integrases.. Proc Natl Acad Sci USA, 2007. [PubMed]
- Cytonemes are required for the establishment of a normal Hedgehog morphogen gradient in Drosophila epithelia.. Nat Cell Biol, 2013. [PubMed]
- An extensive 3′ cis‐regulatory region directs the imaginal disk expression of decapentaplegic, a member of the TGF‐beta family in Drosophila .. Development, 1991. [PubMed]
- The mechanisms of Hedgehog signalling and its roles in development and disease.. Nat Rev Mol Cell Biol, 2013. [PubMed]
- T cell metabolism drives immunity.. J Exp Med, 2015. [PubMed]
- Dispatched, a novel sterol‐sensing domain protein dedicated to the release of cholesterol‐modified hedgehog from signaling cells.. Cell, 1999. [PubMed]
- Multiple ligand binding sites regulate the Hedgehog signal transducer Smoothened in vertebrates.. Curr Opin Cell Biol, 2018. [PubMed]
- Structural basis of Smoothened regulation by its extracellular domains.. Nature, 2016. [PubMed]
- Regulation of cancer cell metabolism.. Nat Rev Cancer, 2011. [PubMed]
- Skinny hedgehog, an acyltransferase required for palmitoylation and activity of the hedgehog signal.. Science, 2001. [PubMed]
- Unexpected role of the steroid‐deficiency protein ecdysoneless in pre‐mRNA splicing.. PLoS Genet, 2014. [PubMed]
- Vertebrate Smoothened functions at the primary cilium.. Nature, 2005. [PubMed]
- Overexpression of ecdysoneless in pancreatic cancer and its role in oncogenesis by regulating glycolysis.. Clin Cancer Res, 2012. [PubMed]
- Cell dynamics underlying oriented growth of the Drosophila wing imaginal disc.. Development, 2017. [PubMed]
- Lipoprotein‐heparan sulfate interactions in the Hh pathway.. Dev Cell, 2007. [PubMed]
- Alkyne lipids as substrates for click chemistry‐based in vitro enzymatic assays.. J Lipid Res, 2013. [PubMed]
- A highly sensitive protocol for microscopy of alkyne lipids and fluorescently tagged or immunostained proteins.. J Lipid Res, 2016. [PubMed]
- Anticancer efficacy of the metabolic blocker 3‐bromopyruvate: specific molecular targeting.. Anticancer Res, 2013. [PubMed]
- Cell‐autonomous roles of the ecdysoneless gene in Drosophila development and oogenesis.. Development, 2004. [PubMed]
- Hexokinase‐2‐mediated aerobic glycolysis is integral to cerebellar neurogenesis and pathogenesis of medulloblastoma.. Cancer Metab, 2013. [PubMed]
- Exosomes as Hedgehog carriers in cytoneme‐mediated transport and secretion.. Nat Commun, 2014. [PubMed]
- Highly specific and efficient CRISPR/Cas9‐catalyzed homology‐directed repair in Drosophila .. Genetics, 2014. [PubMed]
- Argosomes: a potential vehicle for the spread of morphogens through epithelia.. Cell, 2001. [PubMed]
- Slc5a8, A Na+‐coupled high‐affinity transporter for short‐chain fatty acids, is a conditional tumour suppressor in colon that protects against colitis and colon cancer under low‐fiber dietary conditions.. Biochemical J, 2015
- A protein complex network of Drosophila melanogaster .. Cell, 2011. [PubMed]
- In vivo profiling and visualization of cellular protein‐lipid interactions using bifunctional fatty acids.. Angew Chem, 2013. [PubMed]
- A census of human soluble protein complexes.. Cell, 2012. [PubMed]
- A human interactome in three quantitative dimensions organized by stoichiometries and abundances.. Cell, 2015. [PubMed]
- Trifunctional lipid probes for comprehensive studies of single lipid species in living cells.. Proc Natl Acad Sci USA, 2017. [PubMed]
- Ecdysone and mediator change energy metabolism to terminate proliferation in Drosophila neural stem cells.. Cell, 2014. [PubMed]
- Cellular cholesterol directly activates smoothened in hedgehog signaling.. Cell, 2016. [PubMed]
- Mechanisms and functions of Hedgehog signalling across the metazoa.. Nat Rev Genet, 2011. [PubMed]
- Stimulation of both aerobic glycolysis and Na(+)‐K(+)‐ATPase activity in skeletal muscle by epinephrine or amylin.. Am J Physiol, 1999. [PubMed]
- Influence of metabolism on epigenetics and disease.. Cell, 2013. [PubMed]
- Spsgt1, a new essential gene of Schizosaccharomyces pombe, is involved in carbohydrate metabolism.. Yeast, 2006. [PubMed]
- Patched regulates Smoothened trafficking using lipoprotein‐derived lipids.. Development, 2009. [PubMed]
- Endocannabinoids are conserved inhibitors of the Hedgehog pathway.. Proc Natl Acad Sci USA, 2015. [PubMed]
- Simultaneous measurement of smoothened entry into and exit from the primary cilium.. PLoS ONE, 2014. [PubMed]
- Sightless has homology to transmembrane acyltransferases and is required to generate active Hedgehog protein.. Curr Biol, 2001. [PubMed]
- Methylglyoxal can modify GAPDH activity and structure.. Ann N Y Acad Sci, 2005. [PubMed]
- Inhibition of the glycolytic pathway by methylglyoxal in human platelets.. Cell Biochem Funct, 1989. [PubMed]
- Large‐scale biophysics: ion flows and regeneration.. Trends Cell Biol, 2007. [PubMed]
- Cholesterol activates the G‐protein coupled receptor Smoothened to promote Hedgehog signaling.. Elife, 2016
- Coupling of aerobic glycolysis and Na+‐K+‐ATPase in renal cell line MDCK.. Am J Physiol, 1987. [PubMed]
- The ESCRT machinery regulates the secretion and long‐range activity of Hedgehog.. Nature, 2014. [PubMed]
- Membrane‐bound ATP fuels the Na/K pump. Studies on membrane‐bound glycolytic enzymes on inside‐out vesicles from human red cell membranes.. J Gen Physiol, 1981. [PubMed]
- Rasp, a putative transmembrane acyltransferase, is required for Hedgehog signaling.. Development, 2002. [PubMed]
- Elevated levels of the reactive metabolite methylglyoxal recapitulate progression of type 2 diabetes.. Cell Metab, 2018. [PubMed]
- Inactivation of cellular enzymes by carbonyls and protein‐bound glycation/glycoxidation products.. Arch Biochem Biophys, 2002. [PubMed]
- Synthesis and cellular labeling of caged phosphatidylinositol derivatives.. Chem A Eur J, 2020
- Hedgehog pathway modulation by multiple lipid binding sites on the smoothened effector of signal response.. Dev Cell, 2013. [PubMed]
- Rapid, direct activity assays for Smoothened reveal Hedgehog pathway regulation by membrane cholesterol and extracellular sodium.. Proc Natl Acad Sci USA, 2017. [PubMed]
- A gradient of glycolytic activity coordinates FGF and Wnt signaling during elongation of the body axis in amniote embryos.. Dev Cell, 2017. [PubMed]
- Secretion and signaling activities of lipoprotein‐associated hedgehog and non‐sterol‐modified hedgehog in flies and mammals.. PLoS Biol, 2013. [PubMed]
- Lipoprotein particles are required for Hedgehog and Wingless signalling.. Nature, 2005. [PubMed]
- Identification of a palmitic acid‐modified form of human Sonic hedgehog.. J Biol Chem, 1998. [PubMed]
- Optimized CRISPR/Cas tools for efficient germline and somatic genome engineering in Drosophila .. Proc Natl Acad Sci USA, 2014. [PubMed]
- Hedgehog patterning activity: role of a lipophilic modification mediated by the carboxy‐terminal autoprocessing domain.. Cell, 1996a. [PubMed]
- Cholesterol modification of hedgehog signaling proteins in animal development.. Science, 1996b. [PubMed]
- Pleiotropic effects of the “ecdysoneless‐1” mutation of Drosophila melanogaster .. Molec Gen Genet, 1983
- DPATJ plays a role in retinal morphogenesis and protects against light‐dependent degeneration of photoreceptor cells in the Drosophila eye.. Dev Dyn, 2006. [PubMed]
- Recent molecular advances in studies of the concentrative Na+‐dependent nucleoside transporter (CNT) family: identification and characterization of novel human and mouse proteins (hCNT3 and mCNT3) broadly selective for purine and pyrimidine nucleosides (system cib).. Mol Membr Biol, 2001. [PubMed]
- Patched1 regulates hedgehog signaling at the primary cilium.. Science, 2007. [PubMed]
- A combined ex vivo and in vivo RNAi screen for notch regulators in Drosophila reveals an extensive notch interaction network.. Dev Cell, 2010. [PubMed]
- A genome‐wide resource for the analysis of protein localisation in Drosophila .. Elife, 2016. [PubMed]
- Fiji: an open‐source platform for biological‐image analysis.. Nat Methods, 2012. [PubMed]
- Stem cell metabolism in tissue development and aging.. Development, 2013. [PubMed]
- The Na, K‐ATPase.. J Bioenerg Biomembr, 1992. [PubMed]
- Imaginal disc‐autonomous expression of a defect in sensory bristle patterning caused by the lethal(3)ecdysoneless1 (1(3)ecd1) mutation of Drosophila melanogaster .. Development, 1989. [PubMed]
- Differential regulation of the two glyceraldehyde‐3‐phosphate dehydrogenase genes during Drosophila development.. Mol Cell Biol, 1988. [PubMed]
- The diverse functions of GAPDH: views from different subcellular compartments.. Cell Signal, 2011. [PubMed]
- Structure of two unlinked Drosophila melanogaster glyceraldehyde‐3‐phosphate dehydrogenase genes.. J Biol Chem, 1985. [PubMed]
- A family of mammalian Na+‐dependent L‐ascorbic acid transporters.. Nature, 1999. [PubMed]
- In vivo fluorescent adenosine 5′‐triphosphate (ATP) imaging of Drosophila melanogaster and Caenorhabditis elegans by using a genetically encoded fluorescent ATP biosensor optimized for low temperatures.. Anal Chem, 2013. [PubMed]
- On the origin of cancer cells.. Science, 1956. [PubMed]
- Surprising versatility of Na+‐glucose cotransporters: SLC5.. Physiology, 2004. [PubMed]
- Cholesterol modification of smoothened is required for hedgehog signaling.. Mol Cell, 2017. [PubMed]
- Structural basis for cholesterol transport‐like activity of the hedgehog receptor patched.. Cell, 2018. [PubMed]