Pan-cancer gene signature analysis of macrophage polarization and compound prediction for reprogramming tumor-associated macrophages toward M1-like macrophages
Abstract
Background:
Resting tumor-associated macrophages (TAMs) are stimulated by the tumor microenvironment and can be primarily polarized into two subtypes: M1-and M2-like. M1-like TAMs promote inflammation and eradicate tumor cells, whereas M2-like TAMs suppress inflammation and facilitate tumor development. However, the mechanisms underlying phenotypic switching in these macrophages remain unclear. Therefore, we aimed to characterize the gene expression profiles of M1-like and M2-like TAMs in pan cancers.
Methods:
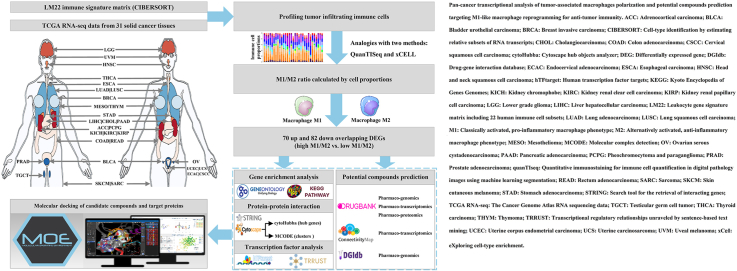
Three computational methods were used to estimate the infiltration score of TAMs in 9239 tumor samples across 31 solid cancer types, based on RNA sequencing databases. Tumor samples were divided into high- and low-score groups based on the median M1/M2 ratio. Furthermore, gene enrichment, protein interactions, and transcription factors were analyzed. Multiple pharmaco–omics profiles were used to identify potential drugs. Finally, binding between the compounds and drug targets was validated using molecular docking.
Results:
Of the top 100 dysregulated genes in each cancer type, 70 and 82 genes with upregulated and downregulated expression, respectively, were consistently differentially expressed. We identified candidate drugs targeting protein phosphatase 2A (PP2A), a core protein. These included efaproxiral, hesperidin, ezetimibe, calcitriol, and linopirdine.
Conclusions:
This study provides a pan-cancer characterization of the TAM polarization-related gene profile. Network pharmacology and molecular docking analyses revealed five promising therapeutic agents for TAM reprogramming. Thus, our findings provide valuable insights into the enhancement of immune responses to inhibit tumor immune escape and metastasis.
Article type: Research Article
Keywords: Tumor-associated macrophages, Macrophage activation, Tumor microenvironment, Molecular docking simulation
Affiliations: Department of Oncology, The First Affiliated Hospital of Nanjing Medical University, Nanjing, Jiangsu 210029, China; Department of Radiotherapy, The Friendship Hospital of Ili Kazak Autonomous Prefecture, Ili, Xinjiang 835000, China; Department of Gastroenterology, Nanjing Drum Tower Hospital Clinical College of Nanjing Medical University, Nanjing, Jiangsu 210008, China; Department of Radiotherapy, Jiangsu Province Hospital of Chinese Medicine, The Affiliated Hospital of Nanjing University of Chinese Medicine, Nanjing, Jiangsu 210029, China; Department of Gastroenterology, The First Affiliated Hospital of Nanjing Medical University, Nanjing, Jiangsu 210029, China; Department of Gastroenterology, Huai’an Hospital Affiliated to Yangzhou University (The Fifth People’s Hospital of Huai’an), Huaian, Jiangsu 223300, China
License: © 2025 The Authors CC BY 4.0 This is an open access article under the CC BY license (http://creativecommons.org/licenses/by/4.0/).
Article links: DOI: 10.1016/j.cpt.2025.05.002 | PubMed: 41567365 | PMC: PMC12818233
Relevance: Moderate: mentioned 3+ times in text
Full text: PDF (2.2 MB)
Introduction
The mononuclear phagocyte system (MPS), a part of innate immunity, primarily comprises macrophages and their precursor cells, monocytes. Upon exposure to certain stimuli, including infection, injury, or inflammation, monocytes are recruited to the inflamed tissues and differentiate into macrophages and dendritic cells.ref. bib1 Macrophage diversity and plasticity are hallmarks of the monocyte-macrophage lineage.ref. bib2 Macrophages adapt to microenvironmental signals and can rapidly switch their functions by polarizing into two extreme forms in vitro: classically (M1) and alternatively (M2) activated macrophages.ref. bib3 M1 macrophages promote inflammation and kill tumor cells. Subsets of M2 macrophages, which are mainly involved in anti-inflammatory responses and support tumor growth, include M2a, M2b, M2c, and M2d. These subtypes express distinct chemokines and chemokine receptors.ref. bib4 Furthermore, many macrophages express a combination of M1-like and M2-like cell phenotypes.ref. 5, ref. 6, ref. 7 The tumor microenvironment (TME) modulates tumor-associated macrophages (TAMs), which mainly comprise two polarizable subtypes – M1-like TAMs and M2-like TAMs. Additionally, TAMs may reside between or outside the M1 or M2 states.ref. bib8 M1-like and M2-like TAM polarization balance is a highly plastic and dynamically continuous process governed by signaling pathways and transcriptional and post-transcriptional regulatory networks.ref. bib9
The recruitment and polarization of M2-like TAMs play important roles in vessel maturation, malignant metastasis, invasion, and tumor cell dormancy.ref. bib10 M2-like TAMs play a cancer-promoting role and serve as potential targets for overcoming resistance to anti-tumor therapy.ref. bib11,ref. bib12 Some compounds may promote the repolarization of tumor-supportive M2-like TAMs to tumor-suppressive M1-like TAMs. These compounds include monophosphoryl lipid A (MPLA), interferon (IFN) γ,ref. bib13 lactate oxidase (LOX)ref. bib14 and an M2-like TAM-targeting micellar nanodrug that could be triggered only in the acidic TME but not in the neutral-pH environment of healthy organs.ref. bib15 The induction of M1-like TAMs and reprogramming of anti-inflammatory M2-like TAMs to pro-inflammatory M1-like TAMs offer a promising strategy for maximizing tumor-killing abilities and reducing pathogenicity.
Grounded in the philosophical concepts of holism and reductionism, pan-cancer research seeks to unify multiple approaches.ref. bib16,ref. bib17 Previous studies have focused on isolated single cancer types. In contrast, pan-cancer research explores both the heterogeneity and commonalities of cancers. Thus, the shift toward pan-cancer research provides a more comprehensive understanding of the mechanisms underlying cancer development. It simultaneously explores the universality of cancer and elucidates local mechanisms to reveal its specificity and diversity. This consequently eliminates the division and composition fallacies, which means making overly simplistic judgments about the logical relationships between the whole and its parts, in the understanding of cancer as a complex systemic disease.
The advent of single-cell RNA sequencing (scRNA-seq) technology has revealed the heterogeneity of cancer cells and the similarities in TME subtypes across different cancer types.ref. 18, ref. 19, ref. 20, ref. 21, ref. 22 In this study, we aimed to characterize the gene expression profiles of M1-like and M2-like TAMs in pan-cancers across 31 solid tumor types based on published RNA sequencing (RNA-seq) gene expression datasets. We further aimed to identify potential targets and pathways of TAM polarization by constructing a drug–target interaction network. By targeting macrophage polarization to shift the balance from M2-like to M1-like phenotypes, this study provides a strategy for remodeling the immunosuppressive TME, thereby restricting tumor cell survival and metastasis.
Methods
Data acquisition and preprocessing
We obtained the RNA-seq gene expression data of 31 solid cancers: brain lower grade glioma (LGG), uveal melanoma (UVM), head and neck squamous cell carcinoma (HNSC), thyroid carcinoma (THCA), esophageal carcinoma (ESCA), lung adenocarcinoma (LUAD), lung squamous cell carcinoma (LUSC), breast carcinoma (BRCA), mesothelioma (MESO), thymoma (THYM), stomach adenocarcinoma (STAD), liver hepatocellular carcinoma (LIHC), cholangiocarcinoma (CHOL), pancreatic adenocarcinoma (PAAD), adrenocortical carcinoma (ACC), pheochromocytoma and paraganglioma (PCPG), kidney chromophobe (KICH), kidney renal clear cell carcinoma (KIRC), kidney renal papillary cell carcinoma (KIRP), colon adenocarcinoma (COAD), rectum adenocarcinoma (READ), bladder urothelial carcinoma (BLCA), prostate adenocarcinoma (PRAD), testicular germ cell tumors (TGCTs), ovarian serous cystadenocarcinoma (OV), uterine corpus endometrial carcinoma (UCEC), uterine carcinosarcoma (UCS), endocervical adenocarcinoma (ECAC), cervical squamous cell carcinoma (CSCC), skin cutaneous melanoma (SKCM), and sarcoma (SARC) [Table 1]. The data were downloaded from The Cancer Genome Atlas (TCGA) (http://portal.gdc.cancer.gov/). The M1 and M2 macrophage compositions of the samples were calculated using three gene-based algorithms: cell-type identification by estimating relative subsets of RNA transcripts (CIBERSORT), quantitative immunostaining for immune cell quantification in digital pathology images using machine learning segmentation (quanTIseq), and eXploring cell-type enrichment (xCell).ref. 23, ref. 24, ref. 25
Table 1: Characterization of 31 solid cancer types in The Cancer Genome Atlas.
| Solid cancer type (n = 31) | Grouped in M1/M2 ratio | Total samples (n = 9239) | |
|---|---|---|---|
| High density (≥median) | Low density (<median) | ||
| Adrenocortical cancer | 39 | 40 | 79 |
| Bladder cancer | 202 | 200 | 402 |
| Breast cancer | 536 | 536 | 1072 |
| Cervical cancer | 138 | 138 | 276 |
| Bile duct cancer | 18 | 18 | 36 |
| Colon cancer | 225 | 225 | 450 |
| Esophageal cancer | 40 | 40 | 80 |
| Head and neck cancer | 248 | 247 | 495 |
| Kidney chromophobe | 33 | 32 | 65 |
| Kidney clear cell carcinoma | 263 | 263 | 526 |
| Kidney papillary cell carcinoma | 144 | 143 | 287 |
| Lower grade glioma | 250 | 250 | 500 |
| Liver cancer | 185 | 184 | 369 |
| Lung adenocarcinoma | 255 | 255 | 510 |
| Lung squamous cell carcinoma | 248 | 248 | 496 |
| Mesothelioma | 41 | 40 | 81 |
| Ovarian cancer | 177 | 177 | 354 |
| Pancreatic cancer | 88 | 88 | 176 |
| Pheochromocytoma & paraganglioma | 88 | 87 | 175 |
| Prostate cancer | 241 | 240 | 481 |
| Rectal cancer | 82 | 81 | 163 |
| Sarcoma | 129 | 129 | 258 |
| Melanoma | 52 | 51 | 103 |
| Stomach cancer | 187 | 186 | 373 |
| Testicular cancer | 75 | 74 | 149 |
| Thyroid cancer | 248 | 248 | 496 |
| Thymoma | 60 | 59 | 119 |
| Endometrioid cancer | 268 | 267 | 535 |
| Uterine carcinosarcoma | 28 | 28 | 56 |
| Uveal melanoma | 39 | 38 | 77 |
M1: Classically activated, pro-inflammatory macrophage phenotype; M2: Alternatively activated, anti-inflammatory macrophage phenotype.
Identification of gene expression profiles related to macrophage polarization in pan-cancers
Using the median ratio of M1/M2 TAMs as the cutoff point, TCGA pan-cancer samples were divided into high- and low-M1/M2 ratio groups. The differentially expressed genes (DEGs) related to macrophage polarization were obtained from RNA-seq expression profiles using the “DESeq2 (Differential Expression analysis based on the Sequential 2 distribution model)” R package. The cut-off criteria were adjusted P value (also called false discovery rate [FDR]) < 0.01 and fold change (FC) ≥ 1.5.
Screening of potential targets using gene enrichment, protein interaction, and transcription factor analysis
Gene ontology (GO) functional analysis and Kyoto Encyclopedia of Genes Genomes (KEGG) pathways analysisref. bib26 against M1 and M2 macrophage-associated DEGs were performed using the GO-KEGG-Bubble tool in Hiplot (ORG) (https://hiplot.org), a comprehensive and easy-to-use web service for boosting publication-ready biomedical data visualization.ref. bib27 FDR <0.05 indicated a statistically significant difference in enriched GO/KEGG terms.
The search tool for the retrieval of interacting genes/proteins (STRING), a database containing human proteins with core network interactions, was used to construct a protein–protein interaction (PPI) network.ref. bib28 The interaction score was set at the highest confidence level (0.9), following the official recommendations. Key gene signatures were extracted from DEGs-based PPI complexes through molecular complex detection (MCODE) and cytoHubba (Cytoscape Hub Objects Analyzer) modules using the Cytoscape software (v3.8.0).ref. bib29 The graph theoretic clustering algorithm, MCODE, detects core clusters representing molecular complexes in PPI networks.ref. bib30 In this study, the Cytoscape plugin cytoHubba was used to predict hub genes in the PPI network. Eleven topological methods are provided in cytoHubba, including the Maximal Clique Centrality (MCC), Density of Maximum Neighborhood Component (DMNC), Maximum Neighborhood Component (MNC), Degree, Edge Percolated Component (EPC), and seven centralities (Bottleneck, EcCentricity, Closeness, Radiality, Betweenness, Stress, and Clustering Coefficient).ref. bib31
Multiple interconnected factors, including transcription factor (TF) and co-factor binding, regulate macrophage differentiation, activation, and polarization.ref. bib1 A database of human transcription factor targets (hTFtarget), which contains comprehensive TF-target regulation from chromatin immunoprecipitation sequencing (ChIP-Seq) data in cell lines, tissues, and cells, was used to identify the TF-encoding genes among macrophage polarization DEGs.ref. bib32 Transcriptional regulatory relationships unraveled by sentence-based text mining (TRRUST) included TF-target regulatory relationships in humans from PubMed articles that describe experimental studies and provide a mode of regulation, including activation and repression.ref. bib33 Universal Protein Knowledgebase (UniprotKB), which provides experimentally validated and article-published PPI, was used to select the final candidate drug targets.ref. bib34
Prediction of compounds as agonists of M1-like tumor-associated macrophage polarization or inhibitors of M2-like tumor-associated macrophage polarization in pan-cancers
We predicted the potential compounds associated with M1-like and M2-like macrophage polarization across pharmacogenomic, pharmacotranscriptomic, and pharmacoproteomic datasets in public databases. DrugBank provides pharmacotranscriptomic and pharmacoproteomic research data, including change directions, upregulated/downregulated, and increased/decreased. M1 and M2 macrophage-associated DEGs were uploaded to the Connectivity Map (CMap)ref. bib35 on the cloud-based CLUE (CMap Legacy Umbrella Environment) software platform (https://clue.io) to identify perturbagens that elicit similar or opposing gene expression signatures. We also collected potential drugs from the drug–gene interaction database (DGIdb),ref. bib36 a public platform that integrates resources from Drug Target Commons (DTC),ref. bib37 Guide to Pharmacology,ref. bib38 ChEMBL (CHEMistry BioMedicine Library),ref. bib39 and others.
Molecular docking of candidate compounds and drug targets
The Molecular Operating Environment (MOE) is a drug discovery software platform that includes molecular modeling, virtual screening, and stimulations.ref. bib40 In this study, ligands (candidate compounds) were prepared in ChEMBL and minimized in MOE. Next, hydrogen atoms were added to the ligands. Protein structures of drug target genes were obtained from the Protein Data Bank (PDB).ref. bib41 Docking was performed until the minimum energy of the drug ligand was achieved. The molecular docking scores of the generated poses of the candidate drug ligands were ranked based on the binding affinity to identify the optimal drugs.
Results
Differential gene expression analysis in high-vs. low-M1/M2 ratio groups in pan-cancers
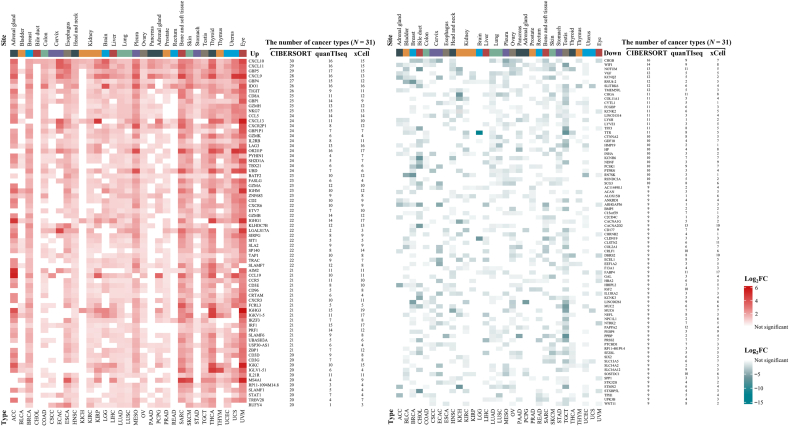
We analyzed DEGs related to M1-like and M2-like TAM polarization in 31 solid cancer types with FDR <0.01 and |log2FC| ≥ 0.58: LGG, UVM, HNSC, THCA, ESCA, LUAD, LUSC, BRCA, MESO, THYM, STAD, LIHC, CHOL, PAAD, ACC, PCPG, KICH, KIRC, KIRP, COAD, READ, BLCA, PRAD, TGCT, OV, UCEC, UCS, ECAC, CSCC, SKCM, and SARC. Among the top 100 DEGs in each cancer type, we screened 70 genes with upregulated expression and 82 with downregulated expression, which were consistently differentially expressed in most solid cancer types [Figure 1 and Supplementary Table 1]. Statistical analysis revealed that DEGs with downregulated expression had higher genetic heterogeneity than those with upregulated expression in the high-M1/M2 ratio vs. the low-M1/M2 ratio in 31 solid cancer types. For instance, the top-ranked common gene, C-X-C motif chemokine ligand 10 (CXCL10) is overexpressed in 30 cancer types, whereas chromogranin B (CHGB) expression is downregulated in 16 of the 31 TCGA solid cancers.
Gene enrichment and pathway analyses
We performed gene enrichment and pathway analyses using the GO-KEGG-Bubble tool in Hiplot to elucidate the role of DEGs related to M1-like and M2-like TAM polarization in pan-cancers. The top 10 enriched GO biological processes (BPs), GO cellular components (CCs), GO molecular functions (MFs), and KEGG pathways ordered by gene count are shown in Figure 2 and listed in Supplementary Table 2.
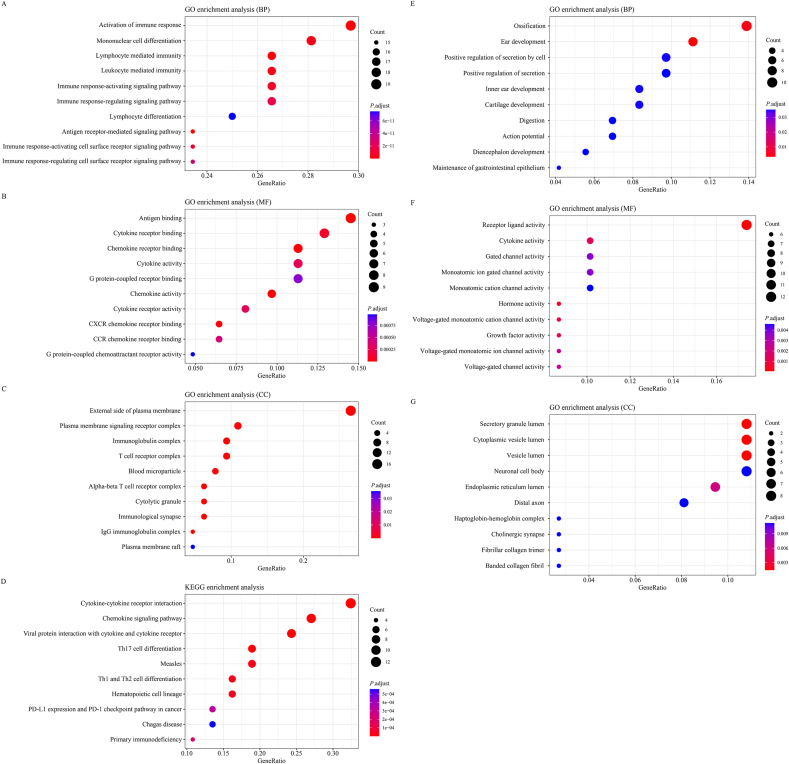
For GO BP, up-DEGs were mainly enriched in the activation of immune response, whereas down-DEGs were primarily enriched in ossification. For the GO CCs, up-DEGs tended to be associated with the external side of the plasma membrane, whereas down-DEGs tended to be associated with the secretory granule lumen. For GO MF, several DEGs with significantly upregulated expression were enriched in antigen binding, and down-DEGs were enriched in receptor ligand activity.
The functional implications of the identified DEGs were further investigated using KEGG pathway analysis. The top four enriched KEGG pathways of the upregulated DEGs were cytokine–cytokine receptor interactions, chemokine signaling pathways, viral protein interactions with cytokines and cytokine receptors, and T helper 17 (Th17) cell differentiation. Downregulated DEGs were mainly enriched in cytokine–cytokine receptor interactions; however, the calculated FDR was >0.05.
Protein–protein interaction network construction and hub gene selection
A PPI network of up-DEGs was constructed, consisting of 70 nodes and 142 edges, with a mean node degree of 10. The PPI network of down-DEGs consisted of 82 nodes and 25 edges, with a mean node degree of 4. The M1-and M2-like TAM polarization-related DEGs were evaluated using the cytoHubba plugin and clustered using the MCODE plugin based on topology to locate densely connected regions with the following criteria: MCODE score >4, degree cut-off = 2, node density cut-off = 0.1, node score cut-off = 0.2, K-core = 2, and max depth from seed = 100. Moreover, 38 and 24 hub genes with upregulated and downregulated expression, respectively, were identified using five methods (MCC, DMNC, MNC, Degree and EPC) in cytoHubba [Supplementary Table 3]. Subsequently, hub genes were clustered in MCODE, and three significant modules were obtained from the protein network shown in Figure 3 and listed in Table 2. The seed proteins were granzyme H (GZMH) and signal transducer and activator of transcription 1 (STAT1), whose expression was upregulated. In contrast, the expression of VGF (non-acronymic, the neurosecretory protein, also known as secretogranin VII) was downregulated in high-M1/M2 ratio vs. low-M1/M2 ratio pan-cancers.
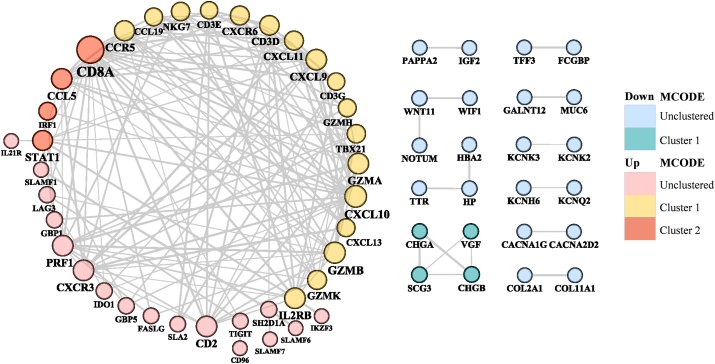
Table 2: Hub genes identified using the MCODE clustering algorithm and Cytoscape plugin cytoHubba.
| M1/M2 | MCODE cluster | Node | MCODE score | Degree | Betweenness centrality | Closeness centrality |
|---|---|---|---|---|---|---|
| Up | Cluster 1 | GZMH (seed) | 5.5714 | 7 | 0.0004 | 0.4512 |
| CCL19 | 4.4643 | 7 | 0.0006 | 0.4111 | ||
| CD3E | 5.0000 | 6 | 0.0128 | 0.4744 | ||
| GZMB | 4.5818 | 13 | 0.0242 | 0.5139 | ||
| CXCL9 | 4.9333 | 12 | 0.0335 | 0.5286 | ||
| IL2RB | 5.5714 | 12 | 0.0937 | 0.5692 | ||
| CXCR6 | 5.0000 | 9 | 0.0224 | 0.5000 | ||
| TBX21 | 4.7619 | 8 | 0.0065 | 0.5068 | ||
| CD3D | 5.0000 | 10 | 0.1358 | 0.5139 | ||
| CXCL10 | 4.9333 | 14 | 0.0846 | 0.5441 | ||
| CD3G | 5.0000 | 6 | 0.0128 | 0.4744 | ||
| CXCL11 | 5.1667 | 9 | 0.0048 | 0.4302 | ||
| GZMA | 4.9333 | 12 | 0.0209 | 0.5362 | ||
| CCR5 | 5.0000 | 11 | 0.0312 | 0.5139 | ||
| GZMK | 4.4643 | 9 | 0.0129 | 0.5068 | ||
| CXCL13 | 4.4643 | 7 | 0.0006 | 0.4111 | ||
| NKG7 | 4.4643 | 8 | 0.0065 | 0.4868 | ||
| Cluster 2 | STAT1 (seed) | 3.7333 | 11 | 0.1244 | 0.5286 | |
| CCL5 | 3.0128 | 12 | 0.0268 | 0.5286 | ||
| CD8A | 3.1765 | 24 | 0.4087 | 0.7115 | ||
| IRF1 | 3.0000 | 7 | 0.0215 | 0.3776 | ||
| Down | Cluster 1 | VGF (seed) | 4.0000 | 3 | 0.0000 | 0.7500 |
| SCG3 | 3.6667 | 4 | 0.1667 | 1.0000 | ||
| CHGB | 3.6667 | 4 | 0.1667 | 1.0000 | ||
| CHGA | 4.0000 | 3 | 0.0000 | 0.7500 |
String: highest confidence >0.9. Criteria: MCODE score >4, degree cut-off = 2, node score cut-off = 0.2, K-core = 2, and maximum depth from seed = 100. cytoHubba: Cytoscape hub objects analyzer; M1: Classically activated, pro-inflammatory macrophage phenotype; M2: Alternatively activated, anti-inflammatory macrophage phenotype; MCODE: Molecular complex detection.
Transcription factor and candidate drug target screening
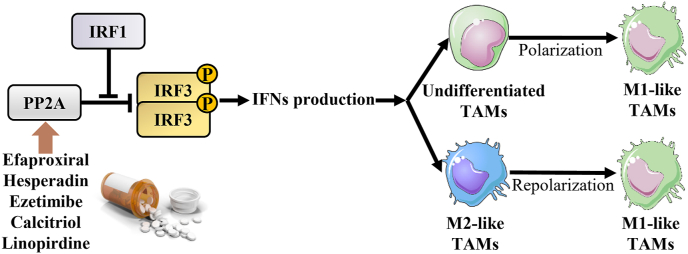
We queried the M1 and M2 TAM polarization-related up/downregulated DEGs of three MCODE clusters (21 up-DEGs and four down-DEGs) in the hTFtarget platform to determine whether DEGs could regulate other dysregulated genes as potential TFs at the protein level. The resulting four TFs were T-box transcription factor 21 (TBX21), STAT1, and interferon regulatory factor 1 (IRF1), which were clustered in two vital modules, and SIX homeobox 2 (SIX2), which was not significantly enriched in the clusters listed in Table 3. IRF1 can enhance the phosphorylation and activation of IRF3 by blocking the interaction between IRF3 and its protein phosphatase 2A (PP2A) and inducing the production of IFNs after IRF3 dimerization and transfer into the nucleus.ref. bib42 Furthermore, IRF3 activity is deactivated by the complex of PP2A and the receptor for activated C kinase 1 (RACK1), and PP2A-deficient macrophages can enhance type I IFN signaling.ref. bib43 PP2A was ultimately selected for subsequent molecular docking of TAM polarization-related targets with the predicted compound ligands.
Table 3: Transcription factor prediction in dysregulated genes using the hTFtarget database.
| Expression | Transcription factor | Co-regulated genes | Gene count | Dataset count |
|---|---|---|---|---|
| Upregulated | TBX21 | TAP1, CCL5, SP140, CRTAM, LAG3, CCR5, CD2, NKG7, UBASH3A, STAT1, ZBP1, SIT1, IGLV1-51, SLA2, CXCR3, CXCR6, ZNF683, IL2RB, GBP5, RUFY4, CXCR2P1, FASLG, PRF1, KLHDC7B, GBP4, USP30-AS1, AIM2, IRF1, TRAC, CD96, CCL19, IL21R, TRBV28, SLAMF6, SLAMF1 | 35 | 3 |
| IRF1 | TAP1, IDO1, CRTAM, LAG3, STAT1, ZBP1, KLHDC7B, CCR5, GBP1P1, IKZF3, CD8A, ZNF683, GBP1, IL2RB, GBP5, GBP4, PRF1, CXCL11, AIM2, TRAC, CD96, USP30-AS1, LGALS17A, ETV7, CXCL9, BATF2, CD3E, CXCL10, UBASH3A | 29 | 11 | |
| STAT1 | TAP1, IRF1, ETV7, CXCL9, ZBP1, CXCL11, LAG3, USP30-AS1, BATF2, PRF1, CXCL10, AIM2 | 12 | 18 | |
| Downregulated | SIX2 | SLITRK6, BMP5, HHIPL2, COL11A1, HP, LYVE1, CRLF1, DHRS2, SCG3, TFF3, SPP1, RNU4-2, AC114498.1, CHGA, TMEM59L, CACNA1G, ANKRD1 | 17 | 3 |
hTFtarget: Human transcription factor targets; IRF1: Interferon regulatory factor 1; SIX2: SIX homeobox 2; STAT1: signal transducer and activator of transcription 1; TBX21: T-box transcription factor 21; TAP1: Transporter associated with antigen processing 1; CCL5: C–C motif chemokine ligand 5; SP140: SP140 nuclear body protein; CRTAM: Cytotoxic and regulatory T-cell molecule; LAG3: Lymphocyte-activation gene 3; CCR5: C–C chemokine receptor type 5; CD2: CD2 molecule; NKG7: Natural killer cell granule protein 7; UBASH3A: Ubiquitin associated and SH3 domain containing A; STAT1: Signal transducer and activator of transcription 1; ZBP1: Z-DNA binding protein 1; SIT1: Signaling threshold regulating transmembrane adaptor 1; IGLV1-51: Immunoglobulin lambda variable 1–51; SLA2: Src-like adaptor 2; CXCR3: C-X-C motif chemokine receptor 3; CXCR6: C-X-C motif chemokine receptor 6; ZNF683: Zinc finger protein 683; IL2RB: Interleukin 2 receptor subunit beta; GBP5: Guanylate binding protein 5; RUFY4: RUN and FYVE domain containing 4; FASLG: Fas ligand; PRF1: Perforin 1; KLHDC7B: Kelch domain containing 7B; GBP4: Guanylate binding protein 4; AIM2: Absent in melanoma 2; IRF1: Interferon regulatory factor 1; TRAC: T cell receptor alpha constant; CD96: CD96 molecule; CCL19: C–C motif chemokine ligand 19; IL21R: Interleukin 21 receptor; TRBV28: T cell receptor beta variable 28; SLAMF6: SLAM family member 6; SLAMF1: SLAM family member 1; IDO1: Indoleamine 2,3-dioxygenase 1; GBP1P1: Guanylate binding protein 1 pseudogene 1; IKZF3: IKAROS family zinc finger 3; CD8A: CD8 subunit alpha; GBP1: Guanylate binding protein 1; CXCL11: C-X-C motif chemokine ligand 11; LGALS17A: Galectin 17A; ETV7: ETS variant transcription factor 7; CXCL9: C-X-C motif chemokine ligand 9; BATF2: Basic leucine zipper ATF-like transcription factor 2; CD3E: CD3e molecule; CXCL10: C-X-C motif chemokine ligand 10; SLITRK6: SLIT and NTRK like family member 6; BMP5: Bone morphogenetic protein 5; HHIPL2: Hedgehog interacting protein like 2; COL11A1: Collagen type XI alpha 1 chain; HP: Haptoglobin; LYVE1: Lymphatic vessel endothelial hyaluronan receptor 1; CRLF1: Cytokine receptor like factor 1; DHRS2: Dehydrogenase/reductase 2; SCG3: Secretogranin III; TFF3: Trefoil factor 3; SPP1: Secreted phosphoprotein 1 (osteopontin); CHGA: Chromogranin A; TMEM59L: Transmembrane protein 59 like; CACNA1G: Calcium voltage-gated channel subunit alpha1 G; ANKRD1: Ankyrin repeat domain 1.
Potential compound prediction and molecular docking with candidate targets
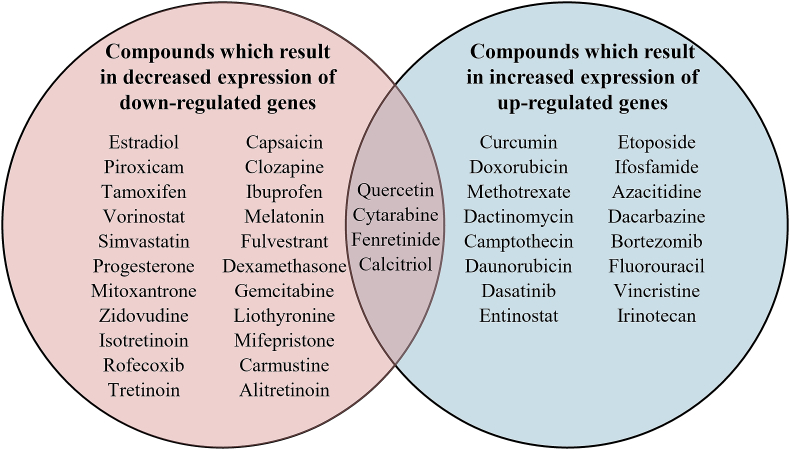
Based on the negative log10Q value (fdr_q_nlog10) and normalized connectivity score (norm_cs), we employed CMap and the library of integrated cellular signatures (LINCS L1000) to predict potential compounds by querying the dysregulated tags of 70 up-DEGs and 82 down-DEGs separately at the transcriptomic level [Supplementary Table 4]. The negative norm_cs reflects a compound capable of generating a gene signature that exhibits a negative correlation with the input genes. The intersection compounds obtained from the CMap and pharmaco-transcriptomics datasets in DrugBank are listed in Supplementary Table 5. In total, 46 compounds were predicted to belong to the intersection of DrugBank and CMap. The compounds activating M1-like TAM polarization, blocking M2-like TAM polarization, or promoting M2 to M1 phenotype reprogramming mainly did so through inhibition of topoisomerase, histone deacetylase, dihydrofolate reductase, polar auxin transport, retinoid receptor, vitamin D receptor, estrogen receptor, nuclear factor kappa B (NF-κB) pathways. As shown in Supplementary Table 6, we also analyzed the compounds at the pharmacogenomic level (DGIdb); the intersection between DGIdb and DrugBank included five compounds: ezetimibe, hesperidin, linopirdine, phensuximide, and efaproxiral. We identified 26 compounds that decreased the expression of down-DEGs and 20 compounds that increased the expression of up-DEGs at high M1/M2 ratios vs. low M1/M2 ratios [Figure 4]. Four compounds were identified at the intersection: quercetin, cytarabine, fenretinide, and calcitriol.
The 10 active ligands were subjected to molecular modeling; LB-100, a PP2A inhibitor, was used as the reference docking drug. Five of the 11 compounds were identified as potential drugs based on final molecular docking scores (MOE_S): efaproxiral (MOE_S = −6.89), hesperidin (MOE_S = −6.86), ezetimibe (MOE_S = −6.62), calcitriol (MOE_S = −6.55), and linopirdine (MOE_S = −6.41), with a cut-off score of < −6 [Table 4 and Figure 5].
Table 4: Results of 11 ligands docked with PP2A using MOE software.
| Rank | PP2A-binding compounds | MOE_S | E_conf | E_place | E_refine |
|---|---|---|---|---|---|
| 1 | Efaproxiral | −6.892 | −24.854 | −39.327 | −31.329 |
| 2 | Hesperadin | −6.857 | 38.651 | −32.951 | −25.980 |
| 3 | Ezetimibe | −6.624 | 17.719 | −56.466 | −33.995 |
| 4 | Calcitriol | −6.553 | −7.391 | −69.945 | −25.595 |
| 5 | Linopirdine | −6.412 | 31.238 | −45.572 | −33.482 |
| 6 | Fenretinide | −5.709 | −48.245 | −32.390 | −30.974 |
| 7 | LB-100 | −5.622 | −3.612 | −57.545 | −24.844 |
| 8 | Quercetin | −5.438 | 1.293 | −45.377 | −29.722 |
| 9 | Cytarabine | −4.912 | −74.238 | −54.214 | −13.421 |
| 10 | Phensuximide | −4.876 | −28.260 | −21.256 | −21.027 |
| 11 | Cantharidinate | −4.618 | 10.381 | −22.819 | −21.031 |
E_conf: Energy of the conformer; E_place: Score from the placement stage; E_refine: Score from the refinement stage; MOE: Molecular Operating Environment; MOE_S: Final molecular docking score; PP2A: Protein phosphatase 2A.
Discussion
TAMs can be derived from circulating monocytes or tissue-resident macrophages (TRMs) that coordinate critical homeostatic and reparative functions.ref. bib44 The significant transcriptomic diversity of monocyte/macrophage clusters has been revealed through pan-cancer analysis using single-cell sequencing technologies.ref. bib45 Considering the tissue specificity of TAMs, we excluded some cancer types from the blood, including lymphoid neoplasms, diffuse large B-cell lymphoma (DLBCL), and acute myeloid leukemia-like (LAML). Rather, we focused on the 31 solid cancer types listed in Table 1. An in-depth cross-sectional comparison of the distribution of TAMs using the three algorithms demonstrated the diversity of TAMs in pan-cancers. The expression levels of the DEGs with upregulated expression in the high-M1/M2 ratio groups vs. the low-M1/M2 ratio groups showed a high degree of consistency: the top-ranked gene was overexpressed in 30 of 31 solid cancer types. However, we considered that the expression of DEGs is likely triggered by systemic chronic inflammatory responses that ultimately lead to alterations in the TME.
The activation of vital TFs regulates the skewing of macrophages toward M1- or M2-like phenotypes. For instance, STAT1, IRF9, Kruppel-like factor 6 (KLF6), and NF-κB are involved in M1-type polarization, whereas peroxisome proliferator-activated receptors (PPARs), STAT3, STAT6, IRF4, KLF4 are related to M2-type polarization.ref. bib46 In the present study, we identified two TFs – STAT1 and IRF1 – through data analysis. The Janus kinase 1 (JAK1)/STAT1/IRF1 signaling pathway, which is activated by the binding of IFN-γ to IFN receptors, prevents mammary cancer formation by maintaining growth control.ref. bib47 PP2A, an important phosphatase for IRF3, restricts type I IFN signaling after recruitment by RACK1 and FBXO17 (F-Box Protein 17).ref. bib41 IRF1 may augment the phosphorylation of IRF3 by inhibiting the interaction between IRF3 and PP2A, resulting in the production of IFNs via IRF3 dimerization and nuclear import. Thus, PP2A may serve as a target for the treatment of M1-like TAM polarization.
Unknown drugs targeting PP2A were screened from candidate compounds targeting dysregulated genes in the high-and low-M1/M2 ratio groups. LB-100 was used as a positive reference docking drug to demonstrate the reliability of the docking positive drugs via conformational analysis. We identified efaproxiral, hesperidin, ezetimibe, calcitriol, and linopiridine as tumor treatments for M0-to-M1 polarization or M2-to-M1 repolarization. Efaproxiral, the compound with the best MOE score, is an allosteric modifier of hemoglobin. It can facilitate oxygen release from hemoglobin and increase tissue oxygen levels to consistently and reproducibly increase tumor oxygenation when used in combination with radiation therapy.ref. 48, ref. 49, ref. 50 The expression of JAK2 and STAT3, which can promote M2-type macrophage polarization, is significantly decreased after stimulation with hesperidin derivatives-12 (HDND-12) in M1-like TAMs.ref. bib51
The present study has some limitations: (1) existing tools such as CIBERSORT, xCell, and quanTIseq methods measure immune cell levels but are limited to the detection of M1 and M2 types that are located at distinct opposite ends within the continuous dynamic polarization axis of TAMs. The limitation is based on M1–M2 dichotomy. Thus, future studies employing scRNA-seq are required to comprehensively characterize the molecular phenotypes of TAM subpopulations. (2) Supplemental analysis of lymphoid neoplasm DLBCL (TCGA-DLBCL) and LAMLs (TCGA-LAML), along with dysregulated gene expression profiling in M1-like vs. M2-like TAMs, indicated a difference between solid and hematological cancers. The present study focused on solid tumors to ensure cohort homogeneity. However, future studies are required to expand the validation to hematological malignancies and systematically assess differences in pathway activation, mutational signatures, and therapeutic vulnerabilities, which may facilitate the establishment of tissue-specific treatment strategies. (3) In vitro and/or in vivo studies are required to further validate the biological relevance of our computational findings. Although this study focused on pan-cancer bioinformatic screening to prioritize recurrently dysregulated genes, we acknowledge that functional validation remains essential. Therefore, future studies should validate the function of PP2A, along with the comparative pharmacological advantages of PP2A over upstream candidates. Furthermore, functional research is required to reveal the molecular mechanisms linking TAM polarization-related dysregulated genes in pan-cancers to their therapeutic roles.
In conclusion, pan-cancer transcriptional analysis identified DEGs in the phenotypic shifts of TAMs. Regulating the expression of these genes did not excessively increase or reduce the M1-like/M2-like TAMs ratio, which is promising for maintaining a fine-tuned balance of macrophage polarization status. Our comprehensive analysis demonstrates the expression features of TAM polarization-related genes from a pan-cancer perspective and provides new insights into M1-like TAMs reprogramming. These insights may facilitate the enhancement of immune responses to inhibit tumor immune escape and metastasis.
Authors contribution
Xiaojing Liu and Cheng Liu: data curation, formal analysis, writing – original draft, visualization, writing – review and editing; Yuting Jin, Jing Xu, and Chunyan Xu: validation, writing – review and editing; Wei Zhu: conceptualization, investigation, supervision, writing – review and editing. All the authors have read and approved the final paper.
Ethics statement
None.
Data availability statement
The datasets used in this study are available from the corresponding author upon reasonable request.
Declaration of generative AI and AI-assisted technologies in the writing process
The authors declare that generative artificial intelligence (AI) and AI assisted technologies were not used in the writing process or any other process during the preparation of this manuscript.
Funding
None.
Conflict of interest
The authors declare that they have no known competing financial interests or personal relationships that could have appeared to influence the work reported in this paper.
References
- T. Kuznetsova, K.H.M. Prange, C.K. Glass, M.P.J. de Winther. Transcriptional and epigenetic regulation of macrophages in atherosclerosis. Nat Rev Cardiol, 2020. [DOI | PubMed]
- A. Shapouri-Moghaddam, S. Mohammadian, H. Vazini. Macrophage plasticity, polarization, and function in health and disease. J Cell Physiol, 2018. [DOI]
- P.J. Murray, T.A. Wynn. Protective and pathogenic functions of macrophage subsets. Nat Rev Immunol, 2011. [DOI | PubMed]
- A. Mantovani, A. Sica, S. Sozzani, P. Allavena, A. Vecchi, M. Locati. The chemokine system in diverse forms of macrophage activation and polarization. Trends Immunol, 2004. [DOI | PubMed]
- G.T. Bardi, M.A. Smith, J.L. Hood. Melanoma exosomes promote mixed M1 and M2 macrophage polarization. Cytokine, 2018. [DOI | PubMed]
- U.A. de León, A. Vázquez-Jiménez, M. Matadamas-Guzmán, O. Resendis-Antonio. Boolean modeling reveals that cyclic attractors in macrophage polarization serve as reservoirs of states to balance external perturbations from the tumor microenvironment. Front Immunol, 2022. [DOI]
- P.S. Zeiner, C. Preusse, A. Golebiewska. Distribution and prognostic impact of microglia/macrophage subpopulations in gliomas. Brain Pathol, 2019. [DOI | PubMed]
- C. Ngambenjawong, H.H. Gustafson, S.H. Pun. Progress in tumor-associated macrophage (TAM)-targeted therapeutics. Adv Drug Deliv Rev, 2017. [DOI | PubMed]
- N. Wang, H. Liang, K. Zen. Molecular mechanisms that influence the macrophage m1-m2 polarization balance. Front Immunol, 2014. [DOI | PubMed]
- L. Cassetta, J.W. Pollard. A timeline of tumour-associated macrophage biology. Nat Rev Cancer, 2023. [DOI | PubMed]
- B. Ruffell, L.M. Coussens. Macrophages and therapeutic resistance in cancer. Cancer Cell, 2015. [DOI | PubMed]
- S. Wang, J. Wang, Z. Chen. Targeting M2-like tumor-associated macrophages is a potential therapeutic approach to overcome antitumor drug resistance. npj Precis Oncol, 2024. [DOI | PubMed]
- L. Sun, T. Kees, A.S. Almeida. Activating a collaborative innate-adaptive immune response to control metastasis. Cancer Cell, 2021. [DOI | PubMed]
- Z.X. Liao, Y.C. Fa, I.M. Kempson, S.J. Tseng. Repolarization of M2 to M1 macrophages triggered by lactate oxidase released from methylcellulose hydrogel. Bioconjug Chem, 2019. [DOI | PubMed]
- H. Xiao, Y. Guo, B. Li. M2-Like tumor-associated macrophage-targeted codelivery of STAT6 inhibitor and IKKβ siRNA induces M2-to-M1 repolarization for cancer immunotherapy with low immune side effects. ACS Cent Sci, 2020. [DOI | PubMed]
- J.N. Weinstein, E.A. Collisson, G.B. Mills. The cancer Genome atlas pan-cancer analysis project. Nat Genet, 2013. [DOI | PubMed]
- K.A. Hoadley, C. Yau, T. Hinoue. Cell-of-Origin patterns dominate the molecular classification of 10,000 tumors from 33 types of cancer. Cell, 2018. [DOI | PubMed]
- N.A. Giraldo, R. Sanchez-Salas, J.D. Peske. The clinical role of the TME in solid cancer. Br J Cancer, 2019. [DOI | PubMed]
- S. Cheng, Z. Li, R. Gao. A pan-cancer single-cell transcriptional atlas of tumor infiltrating myeloid cells. Cell, 2021. [DOI | PubMed]
- A. Bagaev, N. Kotlov, K. Nomie. Conserved pan-cancer microenvironment subtypes predict response to immunotherapy. Cancer Cell, 2021. [DOI | PubMed]
- L. Zheng, S. Qin, W. Si. Pan-cancer single-cell landscape of tumor-infiltrating T cells. Science, 2021. [DOI]
- H. Luo, X. Xia, L.B. Huang. Pan-cancer single-cell analysis reveals the heterogeneity and plasticity of cancer-associated fibroblasts in the tumor microenvironment. Nat Commun, 2022. [DOI | PubMed]
- A.M. Newman, C.L. Liu, M.R. Green. Robust enumeration of cell subsets from tissue expression profiles. Nat Methods, 2015. [DOI | PubMed]
- F. Finotello, C. Mayer, C. Plattner. Molecular and pharmacological modulators of the tumor immune contexture revealed by deconvolution of RNA-seq data. Genome Med, 2019. [DOI | PubMed]
- D. Aran, Z. Hu, A.J. Butte. xCell: digitally portraying the tissue cellular heterogeneity landscape. Genome Biol, 2017. [DOI | PubMed]
- M. Kanehisa, M. Furumichi, Y. Sato, M. Kawashima, M. Ishiguro-Watanabe. KEGG for taxonomy-based analysis of pathways and genomes. Nucleic Acids Res, 2023. [DOI | PubMed]
- J. Li, B. Miao, S. Wang. Hiplot: a comprehensive and easy-to-use web service for boosting publication-ready biomedical data visualization. Briefings Bioinf, 2022. [DOI]
- D. Szklarczyk, J.H. Morris, H. Cook. The STRING database in 2017: quality-controlled protein-protein association networks, made broadly accessible. Nucleic Acids Res, 2017. [DOI | PubMed]
- P. Shannon, A. Markiel, O. Ozier. Cytoscape: a software environment for integrated models of biomolecular interaction networks. Genome Res, 2003. [DOI | PubMed]
- G.D. Bader, C.W.V. Hogue. An automated method for finding molecular complexes in large protein interaction networks. BMC Bioinf, 2003. [DOI]
- C.H. Chin, S.H. Chen, H.H. Wu, C.W. Ho, M.T. Ko, C.Y. Lin. cytoHubba: identifying hub objects and sub-networks from complex interactome. BMC Syst Biol, 2014. [DOI | PubMed]
- Q. Zhang, W. Liu, H.M. Zhang. hTFtarget: a comprehensive database for regulations of human transcription factors and their targets. Genom Proteom Bioinform, 2020. [DOI]
- H. Han, J.W. Cho, S. Lee. TRRUST v2: an expanded reference database of human and mouse transcriptional regulatory interactions. Nucleic Acids Res, 2018. [DOI | PubMed]
- T.U. Consortium. UniProt: the universal protein Knowledgebase in 2023. Nucleic Acids Res, 2022. [DOI]
- A. Subramanian, R. Narayan, S.M. Corsello. A Next generation connectivity Map: L1000 platform and the first 1,000,000 profiles. Cell, 2017. [DOI | PubMed]
- M. Cannon, J. Stevenson, K. Stahl. DGIdb 5.0: rebuilding the drug–gene interaction database for precision medicine and drug discovery platforms. Nucleic Acids Res, 2023. [DOI]
- J. Tang, Z.U. Tanoli, B. Ravikumar. Drug target commons: a community effort to build a consensus knowledge base for drug-target interactions. Cell Chem Biol, 2018. [DOI | PubMed]
- S.D. Harding, J.F. Armstrong, E. Faccenda. The IUPHAR/BPS Guide to PHARMACOLOGY in 2024. Nucleic Acids Res, 2024. [DOI | PubMed]
- A. Gaulton, L.J. Bellis, A.P. Bento. ChEMBL: a large-scale bioactivity database for drug discovery. Nucleic Acids Res, 2012. [DOI | PubMed]
- S. Vilar, G. Cozza, S. Moro. Medicinal chemistry and the molecular operating environment (MOE): application of QSAR and molecular docking to drug discovery. Curr Top Med Chem, 2008. [DOI | PubMed]
- H.M. Berman, J. Westbrook, Z. Feng. The protein Data Bank. Nucleic Acids Res, 2000. [DOI | PubMed]
- J. Wang, H. Li, B. Xue. IRF1 promotes the innate immune response to viral infection by enhancing the activation of IRF3. J Virol, 2020. [DOI | PubMed]
- L. Long, Y. Deng, F. Yao. Recruitment of phosphatase PP2A by RACK1 adaptor protein deactivates transcription factor IRF3 and limits type I interferon signaling. Immunity (Camb, Mass), 2014. [DOI]
- A. Vogel, T. Weichhart. Tissue-resident macrophages – early passengers or drivers in the tumor niche?. Curr Opin Biotechnol, 2023. [DOI]
- C. Wei, Y. Ma, M. Wang. Tumor-associated macrophage clusters linked to immunotherapy in a pan-cancer census. npj Precis Oncol, 2024. [DOI | PubMed]
- H. Li, T. Jiang, M.Q. Li, X.L. Zheng, G.J. Zhao. Transcriptional regulation of macrophages polarization by MicroRNAs. Front Immunol, 2018. [DOI | PubMed]
- F. Zhou. Molecular mechanisms of IFN-gamma to up-regulate MHC class I antigen processing and presentation. Int Rev Immunol, 2009. [DOI | PubMed]
- H. Hou, N. Khan, O.Y. Grinberg. The effects of Efaproxyn (efaproxiral) on subcutaneous RIF-1 tumor oxygenation and enhancement of radiotherapy-mediated inhibition of tumor growth in mice. Radiat Res, 2007. [DOI | PubMed]
- B. Stea, E. Shaw, T. Pintér. Efaproxiral red blood cell concentration predicts efficacy in patients with brain metastases. Br J Cancer, 2006. [DOI | PubMed]
- C. Scott, J. Suh, B. Stea, A. Nabid, J. Hackman. Improved survival, quality of life, and quality-adjusted survival in breast cancer patients treated with efaproxiral (Efaproxyn) plus whole-brain radiation therapy for brain metastases. Am J Clin Oncol, 2007. [DOI | PubMed]
- M. Sharifnia, Z. Eftekhari, P. Mortazavi. Niosomal hesperidin attenuates the M1/M2-macrophage polarization-based hepatotoxicity followed chlorpyrifos -induced toxicities in mice. Pestic Biochem Physiol, 2024. [DOI]