Integrative Multi-Omics Analysis Reveals Critical Molecular Networks Linking Intestinal-System Diseases to Colorectal Cancer Progression
Abstract
Background/Objectives: Colorectal cancer (CRC) frequently co-occurs with intestinal system diseases (ISDs), yet their molecular interplay remains poorly understood. We employed a comprehensive bioinformatics approach to elucidate shared genetic signatures and pathways between CRC and ISDs. Methods: We systematically analyzed 12 microarray and RNA-seq datasets encompassing 989 samples across seven ISDs and CRC. Differentially expressed genes (DEGs) were identified using Limma and DESeq2. Functional enrichment analysis was performed using clusterProfiler. Protein–protein interaction networks were constructed via STRING and visualized with Cytoscape to identify hub genes. Clinical significance of shared genes was further assessed through survival analysis and validated by immunohistochemistry staining of 30 paired CRC–normal tissue samples. Results: Integrating bioinformatics and machine learning approaches, we uncovered 160 shared DEGs (87 upregulated, 73 downregulated), which predominantly enriched cell metabolism, immune homeostasis, gut–brain communication, and inflammation pathways. Network analysis revealed nine key hub proteins linking CRC and ISDs, with seven upregulated (CD44, MYC, IL17A, CXCL1, FCGR3A, SPP1, and IL1A) and two downregulated (CXCL12 and CCL5). Survival analysis demonstrated the prognostic potential of these shared genes, while immunohistochemistry confirmed their differential expression in CRC tissues. Conclusions: Our findings unveil potential biomarkers and therapeutic targets, providing insights into ISD-influenced CRC progression and offering a robust foundation for improved diagnostic and treatment strategies in ISD-associated CRC.
Article type: Research Article
Keywords: bioinformatics, machine learning, intestinal system diseases, CRC, comorbidity
Affiliations: Suzhou Research Center of Medical School, Suzhou Hospital, Affiliated Hospital of Medical School, Nanjing University, Suzhou 215163, China; dg21300014@smail.nju.edu.cn (S.J.); 15895571861@163.com (R.Z.); dongkaiguo@126.com (D.G.); 20234133046@stu.suda.edu.cn (Y.L.); yangnj09@163.com (Y.Y.); State Key Laboratory of Pharmaceutical Biotechnology, School of Life Sciences, Nanjing University, Nanjing 210023, China; 231850129@smail.nju.edu.cn; School of Basic Medicine, Tianjin Medical University, Tianjin 300102, China; fmmult@foxmail.com; State Key Laboratory of Natural Medicines, China Pharmaceutical University, Nanjing 211198, China
License: © 2024 by the authors. CC BY 4.0 Licensee MDPI, Basel, Switzerland. This article is an open access article distributed under the terms and conditions of the Creative Commons Attribution (CC BY) license (https://creativecommons.org/licenses/by/4.0/).
Article links: DOI: 10.3390/biomedicines12122656 | PubMed: 39767563 | PMC: PMC11673540
Relevance: Moderate: mentioned 3+ times in text
Full text: PDF (9.1 MB)
1. Introduction
Comorbidity, which was originally defined as “any distinct additional clinical entity that has existed or may occur during the clinical course of a patient who has the index disease under study” [ref. 1], has emerged as a critical factor in modern healthcare. Comorbidity is associated with worse health outcomes, more complex clinical management, and increased healthcare costs. This coexistence of multiple diseases within an individual not only poses challenges for patient care, but also raises fundamental questions about underlying etiological connections and their implications for health policy [ref. 2]. In the context of cancer, comorbidities can profoundly affect medical care, emotional distress, and mortality rates [ref. 3]. Notably, studies have demonstrated that comorbid conditions in breast- and colon-cancer patients are associated with 1.1- to 5.8-fold and 1.2- to 4.8-fold increases in mortality rates, respectively, compared to patients without comorbidities [ref. 4]. These findings underscore the critical need for a comprehensive understanding of disease interactions, particularly in complex malignancies such as colorectal cancer (CRC).
The interplay between colorectal cancers and gastrointestinal system (GIS) disorders has been extensively investigated through epidemiological studies [ref. 5,ref. 6,ref. 7,ref. 8,ref. 9,ref. 10], albeit with some conflicting evidence [ref. 11,ref. 12]. Among GIS disorders, several intestinal system diseases (ISDs) have demonstrated strong associations with colorectal cancer progression [ref. 5,ref. 6,ref. 7,ref. 8,ref. 9,ref. 10]. These ISDs include colorectal conventional adenoma (Tubular/Tubulovillous/Villous adenoma, simplified as TVAD), sessile serrated polyps (SSPs), hyperplastic polyps (HPs), Crohn’s disease (CD), ulcerative colitis (UC), intestinal tuberculosis (ITB), and irritable bowel syndrome (IBS).
CRC development involves multiple precursor lesions, each with distinct molecular and histological features. Conventional adenomas, characterized by nuclear dysplasia, have long been recognized as potential CRC precursors [ref. 13,ref. 14,ref. 15]. Epidemiological studies have consistently shown that patients with advanced adenomas exhibit higher CRC incidence and mortality rates compared to the general population or individuals without polyps [ref. 16,ref. 17]. Approximately 85% of CRCs are thought to evolve through adenoma-to-cancer sequences associated with specific molecular alterations, including the 5-hydroxymethylcytosine signature in circulating cell-free DNA [ref. 18]. SSPs, characterized by BRAF mutations and the CpG island methylator phenotype, represent the major precursor lesions among the remaining 20–30% of CRC cases [ref. 19]. These lesions develop cytological dysplasia during colorectal tumorigenesis progression. Recent research has identified the Type II-O plus III/IV pit pattern as a common feature of SSPs with cytological dysplasia in both proximal and distal colon, potentially serving as a hallmark of high-risk serrated lesions [ref. 20]. SSPs can develop as primary tumors or evolve from hyperplastic polyps, and their combination of serrated and dysplastic features often leads to rapid progression towards carcinoma [ref. 21]. Hyperplastic polyps, the most frequent polyps (80–90%), were traditionally considered benign, but are now recognized as potential precursors, particularly attributed to the difficulty in being distinguished histologically from SSP [ref. 22]. Nevertheless, patients with adenoma/polyp subtype had a higher risk of CRC incidence than the general individuals in the largely screening-naïve population.
The relationship between inflammatory conditions and CRC presents unique challenges in disease progression and treatment. Inflammatory bowel diseases (IBDs), particularly in the case of CD and UC patients, demonstrate distinct pathophysiology from the typical adenoma–carcinoma sequence, and exhibit a higher risk of CRC, accounting for up to 10% of IBD-related deaths [ref. 23]. ITB, sharing clinical similarities with CD, presents diagnostic challenges, particularly in regions where both conditions are prevalent. Recent studies have demonstrated that CRC patients with active Mycobacterium tuberculosis infections can safely undergo anti-cancer chemotherapy while receiving appropriate tuberculosis treatment, suggesting potential shared molecular mechanisms [ref. 24,ref. 25].
IBS, a leading functional gastrointestinal disorder affecting over 9% of adults globally [ref. 26], presents another dimension to the CRC risk profile [ref. 27]. Recent meta-analyses have shown an increased short-term risk of CRC following IBS diagnosis, emphasizing the need for vigilant screening, particularly in younger patients [ref. 28]. The clinical overlap between IBS and CRC symptoms, particularly during mild disease activity, can lead to initial misdiagnosis [ref. 29]. Given that 24–43% of CRC patients are frail and over half have at least one comorbid condition, the high heterogeneity of CRC sources and undetected molecular signatures presents significant challenges in disease management [ref. 30]. This complexity underscores the critical need for effective analytical methods to identify early indicative and prognostic biomarkers.
To achieve early identification and characterization of CRC, we develop a comprehensive framework based on bioinformatics and machine learning models to investigate the role of ISDs in CRC and how they contribute to the occurrence and development of CRC by influencing molecular pathways and genes in CRC.
2. Materials and Methods
2.1. Search Strategy and Literature Screening
We systematically searched major databases (PubMed, Web of science) for epidemiological and clinical studies on CRC progression in patients with ISDs published until December 2023, by 2 independent authors (S.J. and H.H.) without language restrictions. We originally studied epidemiological, clinical and gastrointestinal endoscope studies to identify CRC linked to ISDs (i.e., CRCs that are affected by the presence of ISDs). CRC is linked to various gastrointestinal system disorders, among which we selected for study TVAD, SSPs, HP, UC, CD, ITB and IBS. We first obtained some datasets [ref. 31,ref. 32] that could provide free retrieval. In this work, each disease was searched based on particular criteria (as shown) in the dataset.
We filtered twelve different microarray and RNA-seq datasets with accession numbers GSE4183, GSE164541, GSE46513, GSE81804, GSE92415, GSE9686, GSE59071, GSE26305 and GSE36701 [ref. 33,ref. 34,ref. 35,ref. 36,ref. 37,ref. 38,ref. 39,ref. 40,ref. 41]. The TVAD dataset (GSE4183 and GSE164541) is the mRNA expression dataset, which consists of biopsy and tissue specimens, which are stored in the RNAlater™ Stabilization Solution at −80 °C [ref. 33,ref. 40] with 13 control and 20 case samples. The SSPs dataset (GSE46513) is a microarray dataset derived from biopsy samples, which consists of 7 SSPs subjects and 8 control subjects [ref. 34]. The HP dataset (GSE81804) is a microarray dataset from 5 patients with Colon polyp with villous component and 5 normal colon mucosa tissues, extracted by NGS [ref. 35]. The UC datasets (GSE92415 and GSE9686) are derived from RNA extraction on Affymetrix microarrays derived from the biopsy samples, which consists of 95 UC subjects and 26 control subjects [ref. 36,ref. 41]. The CD datasets (GSE59071 and GSE26305) are microarray datasets collected from the mucosal biopsies having 10 CD subjects and 13 control samples extracted by Affymetrix Human Gene 1.0 ST Array [ref. 37,ref. 38]. The ITB dataset (GSE26305) is a microarray dataset from 2 patients with ITB and 2 normal colon mucosa tissues [ref. 38]. The IBS dataset (GSE36701) is a microarray dataset derived from biopsy samples, which consists of 87 IBS subjects and 77 healthy volunteers [ref. 39]. The CRC datasets (GSE164541 and TCGA) are RNA-seq datasets, obtained from biopsy and tissue specimens, which consists of 652 CRC and 56 adjacent normal tissues [ref. 32,ref. 40]. To evaluate the patient’s survival for the dysregulated significant genes which overlapped between ISDs and CRC, we acquired clinical and RNA-seq data for CRC from the cBioPortal [ref. 42,ref. 43]. We used clinical and genetic factors to assess the survival in patients with CRC.
2.2. Data Preprocessing and Identification of DEG
Microarrays and RNA-seq datasets based on gene expression analysis are sensitive methods for studying global gene expression and identifying molecular pathways that may be activated in human tissues affected by disease. We can mine these data to identify biomarker genes associated with CRC progression and the survival of cancer patients. We filtered the datasets to select those that show minimum deviation and noise.
Due to the data generated from different platforms, we use a normalized and Z-score five-point conversion of data preprocessing, in order to avoid complications [ref. 44]. For microarray data from GEO, the differentially expressed genes (DEGs) were identified using the Limma R package on normalized count data. For high-throughput sequencing from GEO and TCGA, the DEGs were identified using the DESeq2 R package on normalized count data. The parameters |Log2 fold change| ≥ 1.0 and the False Discovery Rate (FDR) < 0.05 were used as the screening criteria for DEGs. Moreover, the heatmap and volcano plot of DEGs from the databases were constructed using pheatmap and ggplot2 R packages. The Bonferroni, Benjamini–Hochberg and FDR methods were used to adjust p-values. Gene-expression dysregulation can be expressed mathematically, as follows:
2.3. Pathway and Functional Enrichment Analysis
To reveal the potential biological functions and underlying mechanisms of genes and to look over how the factor that contributes to the generation of a trait from the ISDs tissues relates to the expression alterations of the CRC gene, we used the R package “clusterProfiler” to analyze Gene Ontology (GO) and the Kyoto Encyclopedia of Genes and Genes (KEGG) term enrichment of the target genes. GO terms, including biological processes (BPs), cellular components (CCs), molecular functions (MFs), and KEGG pathways with FDR < 0.05, were considered statistically significant.
2.4. Identification of Hub Genes
The protein–protein interaction (PPI) network of DEIOSGs was constructed using the STRING, and visualized using the Cytoscape [ref. 45]. The highest confidence score of 900 was used as a cutoff value for interaction. The MCODE of the Cytoscape was used to determine the key genes in the PPI network and the setting of topology parameters is described in the previous study [ref. 46].
2.5. Survival Analysis
CRC is a complex cancer disease caused by genetic and epigenetic abnormalities that affect gene expression. To develop a prognostic model to predict the survival of patients with CRC, we acquired clinical and RNA-seq data for CRC cancer (TCGA, PanCancer Atlas) from the cBioPortal [ref. 43] where both clinical and RNA-seq data are available for 647 CRC patients.
We performed the transformation of the RNA-seq data using Z-scores transformation for each gene expression value. Meanwhile, we, determined the altered and normal samples by setting the threshold value as follows:
To predict the effect of clinical and genetic factors that affect the relative risk of a patient’s survival for biomarker genes that are common to ISDs and the CRC, we applied the standard Cox Proportional Hazards Model for univariate and multivariate analysis [ref. 47]. In brief, we identified differentially expressed genes (DEGs) between IBD and CRC samples. These DEGs were then subjected to univariate Cox proportional hazards analysis to assess their individual associations with patient survival. Genes demonstrating significant prognostic value (p < 0.05) in the univariate analysis were subsequently evaluated through individual multivariate Cox regression analyses to assess their independent prognostic significance, while accounting for other clinical variables. This systematic approach allowed us to identify robust prognostic biomarkers that maintain their predictive value, independently of other clinical factors.
2.6. The ROC Curve Analysis and Expression Analysis
We performed receiver operating characteristic (ROC) curve analysis on each screened hub gene to verify its accuracy. The “pROC” package was used for ROC curve analysis. The hub genes with AUC > 0.8 were deemed useful for disease diagnosis.
2.7. Sample Collection and Immunohistochemical Staining Evaluation
In order to verify the expression of 9 hub genes in CRC, the tissues (30 cases of colon cancer tissues with normal paired samples) were purchased from Shanghai Outdo Biotech Co., Ltd. (Shanghai, China), and the research protocols were approved by the Clinical Research Ethics Committee of the hospital.
The 5 μm thick formalin-fixed paraffin-embedded tissue slides were deparaffinized in xylene and rehydrated through an ethanol gradient, ending with a distilled water wash. The sections were repaired in a water bath kettle filled with Tri-EDTA antigen repair buffer and then immersed in 3% H2O2 for 10 min to block endogenous Peroxidase activity. The sections with antigen retrieval were blocked with 5% bovine serum albumin (BSA) containing 3‰ Triton for 1 h, and primary anti-CD44 (CST, #37259), anti-IL17A (Abcam, ab79056), anti-CXCL1 (Absin, abs120475), anti-SPP1 (Absin, abs110628), anti-FCGR3A (Absin, abs136527), anti-IL1A (Absin, abs113204), anti-c-MYC (GeneTex, GTX103436), anti-CCL5 (CST, #36467) and anti-CXCL12 (CST, #97958) (see Table S3 for details) were incubated overnight at 4 °C. Next, the sections were incubated with the corresponding fluorescent and HRP secondary antibody for 45 min at room temperature. Lastly, all slides were counterstained with DAPI for 5 min and enclosed in ProLong Diamond Antifade Mountant (Thermo Fisher Scientific, Waltham, MA, USA). The specimens were then photographed with a light microscope (BX51; Olympus, Tokyo, Japan) and a Leica TCS SP8 confocal microscope (Leica Microsystems, Mannheim, Germany).
2.8. Statistical Analyses
Firstly, the chosen gene-expression datasets and their matrix information were downloaded and converted to Expression Set class for differential gene expression analysis (patients and controls). We created a design model which was then filtered using LIMMA/DESeq2. We identified DEGs through the use of the adjusted p-value and absolute log Fold change (logFC) value of the threshold (maximum of 0.01 and at least 1.0, respectively). After comparing them, we obtained all the upregulated and downregulated DEGs. We then constructed upregulated and downregulated disease networks as well as upregulated and downregulated PPI networks, and performed a condensed analysis to identify signaling pathways and ontological pathways. Then, the clinical and genetic factors were prepared for the same patients. Subsequently, the Cox Proportional Hazard Model was used for univariate and multivariate analysis to identify cancer biomarker genes associated with cancer patient survival. Finally, a PL estimator was fitted to construct a survival curve for biomarker DEGs, and we compared our results with those in gold-standard databases and the literature.
3. Results
3.1. Data Analysis Flowchart
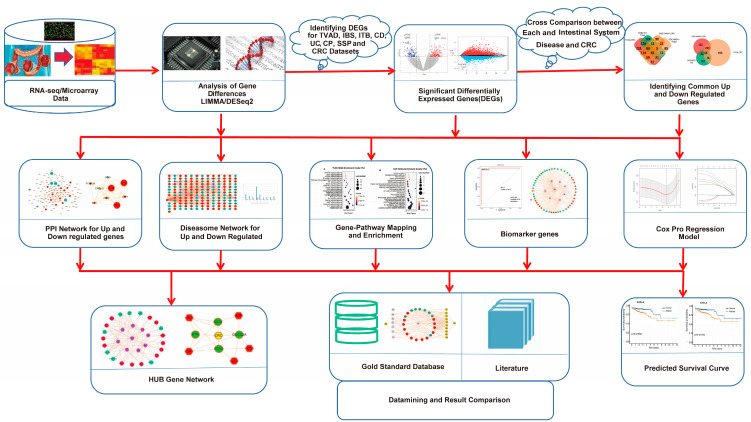
A sophisticated multistage quantitative framework was designed and developed using an integrated pipeline of bioinformatics and machine learning methodologies to analyze the comorbidity related to ISDs and CRC (Figure 1). This comprehensive approach integrates multiple layers of genomic and clinical data to elucidate the molecular underpinnings of ISD-CRC comorbidity. By leveraging advanced bioinformatics tools and machine learning algorithms, the framework provides a holistic view of the shared genetic architecture and potential prognostic indicators for these interrelated conditions.
3.2. Gene Expression Analysis
To elucidate the molecular mechanisms underlying the influence of ISDs on CRC progression, we conducted a comprehensive analysis of gene expression profiles derived from microarray and RNA-sequencing data obtained from the National Center for Biotechnology Information (NCBI) and the National Cancer Institute (NCI) databases. Employing a novel analytical approach, we identified statistically significant differentially expressed genes (DEGs) using stringent criteria (p < 0.01 and |log2 fold change| > 1), as summarized in Table 1.
Table 1: Statistics of the DEGs for selected intestinal disorders and colon cancer.
| Disease Name | GEO Number | Tissues | Platform | Location | Control Samples | Case Samples | Sigt.Genes | UpReg.Genes | DownReg.Genes |
|---|---|---|---|---|---|---|---|---|---|
| TVAD | GSE4183 | biopsy samples | Affymetrix Human Genome U133 Plus 2.0 Array | Hungary | 8 | 15 | 1744 | 1096 | 648 |
| TVAD | GSE164541 | Triplicate tissue samples | Illumina HiSeq 2500 | China | 5 | 5 | 1121 | 214 | 907 |
| CD | GSE26305 | biopsy samples | Illumina HumanWG-6 v3.0 expression beadchip | India | 2 | 2 | 440 | 228 | 212 |
| CD | GSE59071 | biopsy samples | Affymetrix Human Gene 1.0 ST Array | Belgium | 11 | 8 | 693 | 167 | 526 |
| CRC | TCGA | biopsy samples | High-throughput sequencing | USA Canada | 51 | 647 | 2141 | 1169 | 972 |
| CRC | GSE164541 | Triplicate tissue samples | Illumina HiSeq 2500 | China | 5 | 5 | 2082 | 710 | 1372 |
| ITB | GSE26305 | biopsy samples | Illumina HumanWG-6 v3.0 expression beadchip | India | 2 | 2 | 877 | 564 | 313 |
| UC | GSE92415 | biopsy samples | Affymetrix HT HG-U133+ PM Array Plate | Europe | 21 | 87 | 1187 | 366 | 821 |
| UC | GSE9686 | biopsy samples | Affymetrix GeneChip Human Genome U133 Plus 2.0 Array | USA | 5 | 8 | 2013 | 751 | 1262 |
| IBS | GSE36701 | biopsy samples | Affymetrix Human Genome U133 Plus 2.0 Array | UK | 77 | 87 | 2137 | 0 | 2137 |
| SSPs | GSE46513 | biopsy samples | Illumina HiSeq 2000 | USA | 8 | 7 | 746 | 336 | 410 |
| HP | GSE81804 | biopsy samples | Affymetrix Human Gene 2.0 ST Array | China (Taiwan) | 5 | 5 | 340 | 94 | 246 |
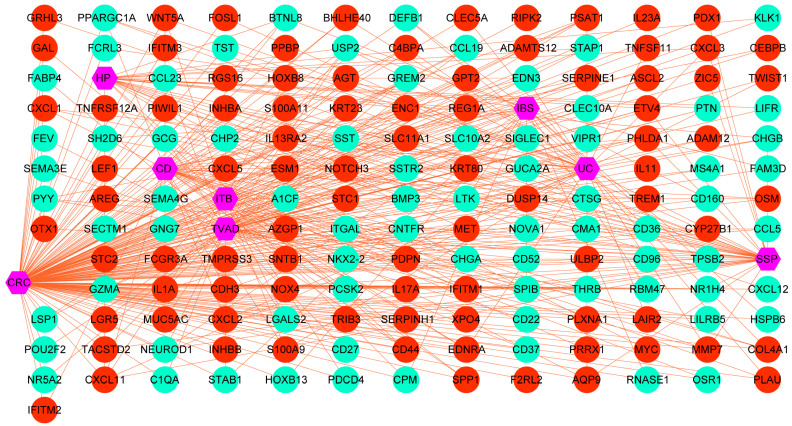
We then systematically identified overlapping DEGs between ISDs and CRC, which we designated as potential biomarker genes. This was achieved by cross-referencing upregulated and downregulated genes in ISDs with their counterparts in CRC. This analysis revealed distinct sets of biomarker genes for each ISD-CRC pair: 63 marker genes for TVAD and CRC, 52 for CD and CRC, 44 for UC and CRC, 31 for HP and CRC, 40 for SSP and CRC, 40 for ITB and CRC, and 36 for IBS and CRC. To assess the statistical significance and potential diagnostic utility of these biomarker genes, we performed hypergeometric tests and calculated Jaccard indices (Table S1). These analyses provided quantitative measures of the genes’ predictive power for CRC and other ISD-related disorders. To visualize and interpret the complex relationships between CRC and ISDs, we constructed two separate diseasome networks, one for upregulated and another for downregulated genes shared between ISDs and CRC (Figure 2 and Figure S1). These networks offer a systems-level view of the molecular interplay between these conditions. Further characterization of the identified biomarker genes revealed subsets with specific functional roles, including immune-related genes, RNA-binding proteins (RBPs), and transcription factors. The distribution of these functional categories across ISD-CRC biomarker gene sets is detailed in Table S2, providing insights into the regulatory mechanisms potentially driving the observed comorbidities.
3.3. Pathway and Functional Association Analysis
To elucidate the molecular mechanisms underlying the comorbidity between Intestinal System Diseases (ISDs) and Colorectal Cancer (CRC), we conducted a comprehensive pathway enrichment analysis using the identified biomarker genes common to both conditions. Utilizing the EnrichR platform and KEGG pathway databases, we systematically explored the signaling pathways activated in each ISD-CRC pair. Our analysis focused on the top 20 statistically significant pathways (adjusted p-value < 0.01) for each comparison, as illustrated in Figure 3. Meanwhile, we performed Gene Ontology (GO) term enrichment analysis for the identified biomarker genes to further characterize their functional implications in the context of ISDs and CRC. This analysis provided deeper insights into the biological processes, molecular functions, and cellular components associated with the observed comorbidities.
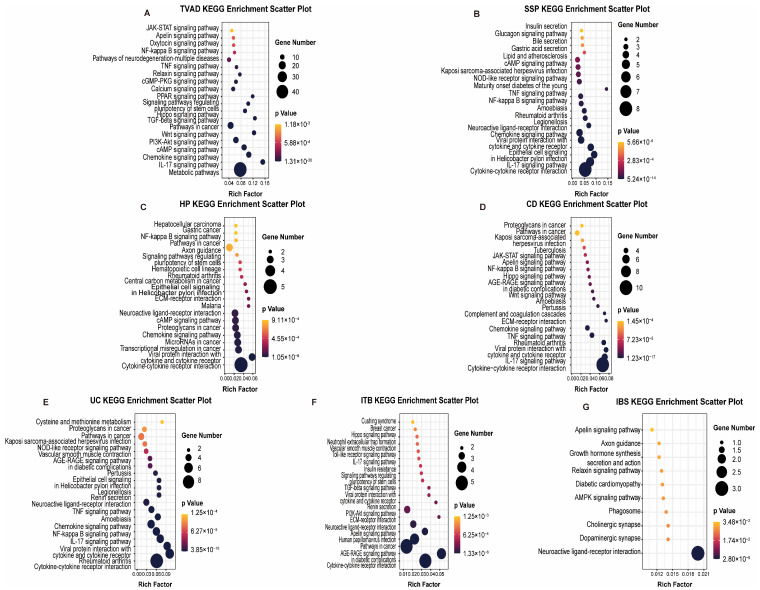
TVAD and CRC shared enrichment in metabolic pathways, particularly those involved in amino acid and nucleotide metabolism, suggesting alterations in cellular energetics as a common feature. CD and CRC exhibited significant enrichment in inflammatory and immune-related pathways, including cytokine–cytokine receptor interaction and TNF signaling. This highlights the potential role of chronic inflammation in promoting carcinogenesis. UC and CRC are enriched in cytokine–cytokine receptor interaction, NF-κB signaling, and TNF signaling pathways, indicating that persistent inflammatory signaling in UC may drive the progression to CRC. HP and CRC shared enrichment in cytokine–cytokine receptor interaction, transcriptional misregulation, microRNA pathways, chemokine signaling, cAMP signaling, and neuroactive ligand–receptor interactions. This diverse set of pathways indicates a complex interplay of inflammatory, transcriptional, and signaling mechanisms in HP-associated CRC risk. IBS and CRC exhibited shared enrichment in neuroendocrine signaling pathways and gut–brain-axis communication, suggesting a potential role for stress-related factors in carcinogenesis. ITB and CRC showed overlapping activation of pathways related to extracellular matrix remodeling and epithelial–mesenchymal transition, such as focal adhesion and ECM–receptor interaction, indicating potential mechanisms for tissue invasion and metastasis. SSP showed significant overlap in immune-related events and epithelial cell signaling pathways, suggesting that inflammatory processes and alterations in epithelial cell behavior may be key drivers in SSP-related carcinogenesis.
3.4. Protein–Protein Interaction (PPI) Analysis
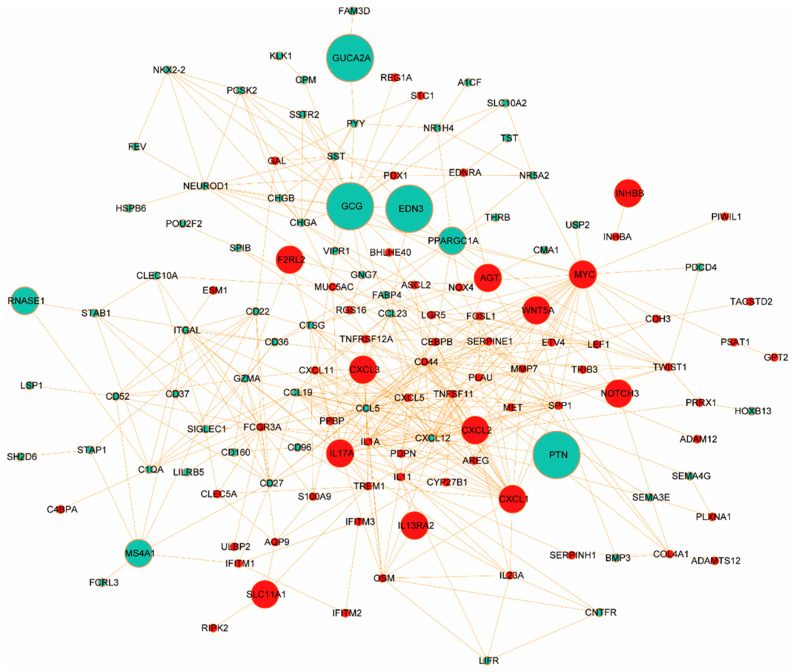
To further explore the functional interplay among those identified DEGs in ISDs and CRC, we constructed a comprehensive PPI network using the STRING database (https://www.string-db.org/, accessed on 2 December 2023). We applied stringent criteria (confidence score ≥ 0.9 and topological degree > 5) to identify high-confidence interactions, resulting in a network comprising 132 nodes and 456 edges (Figure 4). Protein nodes that did not interact with other proteins were removed. Topological analysis of this network was performed using the MCODE plugin (version 2.0.0) in Cytoscape to detect densely connected regions, which potentially represent functional modules. We identified significant clustering modules based on rigorous criteria (MCODE score > 10 and number of nodes > 20). Subsequently, hub genes were determined using the CytoHubba plugin (version 0.1), focusing on nodes with a degree > 10. Our analysis revealed a distinct set of hub proteins for upregulated and downregulated DEGs, with seven hub proteins (CD44, MYC, IL17A, CXCL1, FCGR3A, SPP1, and IL1A) for upregulated DEGs and two hub proteins (CXCL12 and CCL5) for downregulated DEGs. These hub proteins, illustrated in Figure S2A (MCODE analysis) and Figure S2B (CytoHubba analysis), demonstrate high degrees of connectivity within the network, suggesting their pivotal roles in the molecular pathogenesis of ISD-associated CRC.
The identified hub proteins encompass a diverse range of functional categories, including cell adhesion molecules (CD44), transcription factors (MYC), inflammatory mediators (IL17A, IL1A), chemokines (CXCL1, CXCL12, CCL5), and immune receptors (FCGR3A). Notably, the presence of both pro-inflammatory (e.g., IL17A) and homeostatic (e.g., CXCL12) factors underscores the complex interplay between chronic inflammation and cancer progression in the intestinal microenvironment. These hub proteins represent potential biomarkers and therapeutic targets for CRC, particularly in the context of pre-existing ISDs. Their central positions in the PPI network suggest they may serve as key mediators in signal-transduction cascades driving CRC progression. Future studies should focus on elucidating the specific mechanisms by which these proteins contribute to the transition from chronic intestinal inflammation to malignancy.
3.5. Validation of Hub Proteins with Survival Analysis
We conducted a comprehensive survival analysis using patient gene expression data from the TCGA dataset to elucidate the genes significantly associated with CRC progression and patient survival. Our study focused on genes common to CRC and ISDs of the gastrointestinal system. We employed both univariate and multivariate Cox Proportional Hazard Models, along with the Product-Limit (PL) estimator, to assess the survival function for significant genes in two groups: those with altered and those with unaltered expression. This analysis revealed a set of statistically significant differentially expressed genes (DEGs) common to CRC and the selected ISDs (Table 2). Using a threshold of p ≤ 0.05, we identified several genes significantly associated with CRC survival: five genes for TVAD and CRC, eight for CD and CRC, nine for UC and CRC, six for HP and CRC, seven for SSP and CRC, six for ITB and CRC, and one for IBS and CRC. Positive regression coefficients indicated higher hazard ratios and worse prognosis.
Table 2: The regression results of the Cox model for the DEGs that are common to ISDs and CRC. The parameter legends of the table are Coef for estimated coefficients and HR for hazard.
| ISD | Gene Symbol | Univariate Cox | Multivariate Cox | ||||||
|---|---|---|---|---|---|---|---|---|---|
| HR | HR.95L | HR.95H | p Value | HR | HR.95L | HR.95H | p Value | ||
| TVAD | GUCA2A | 1.00002 | 1.00001 | 1.00004 | 0.00500 | 1.00144 | 1.00078 | 1.00210 | 0.00002 |
| GCG | 1.00009 | 1.00001 | 1.00016 | 0.00207 | 1.04378 | 1.02168 | 1.06636 | 0.00009 | |
| MS4A1 | 1.00016 | 1.00000 | 1.00032 | 0.04845 | 1.05744 | 1.01616 | 1.10041 | 0.03981 | |
| PTN | 0.97874 | 0.96409 | 0.99361 | 0.00523 | 1.00011 | 1.00006 | 1.00017 | 0.00003 | |
| EDN3 | 1.00075 | 1.00008 | 1.00142 | 0.02923 | 1.00038 | 1.00011 | 1.00064 | 0.00513 | |
| CD | GUCA2A | 1.00002 | 1.00001 | 1.00004 | 0.00500 | 1.00144 | 1.00078 | 1.00210 | 0.00002 |
| EDN3 | 1.00075 | 1.00008 | 1.00142 | 0.02923 | 1.00038 | 1.00011 | 1.00064 | 0.00513 | |
| CXCL1 | 0.99876 | 0.99777 | 0.99974 | 0.00131 | 1.01249 | 1.00631 | 1.01871 | 0.00007 | |
| WNT5A | 0.99887 | 0.99816 | 0.99958 | 0.00172 | 1.02524 | 1.01432 | 1.03627 | 0.00000 | |
| CXCL2 | 0.99921 | 0.99853 | 0.99990 | 0.02483 | 1.00091 | 1.00039 | 1.00143 | 0.00065 | |
| IL13RA2 | 1.00003 | 1.00001 | 1.00005 | 0.00057 | 1.06190 | 1.03580 | 1.08866 | 0.00000 | |
| SLC11A1 | 1.00046 | 1.00010 | 1.00081 | 0.00119 | 1.38585 | 1.18743 | 1.61742 | 0.00003 | |
| PPARGC1A | 0.99987 | 0.99975 | 1.00000 | 0.04510 | 1.00033 | 1.00002 | 1.00063 | 0.02638 | |
| UC | GUCA2A | 1.00002 | 1.00001 | 1.00004 | 0.00500 | 1.00144 | 1.00078 | 1.00210 | 0.00002 |
| EDN3 | 1.00075 | 1.00008 | 1.00142 | 0.02923 | 1.00038 | 1.00011 | 1.00064 | 0.00513 | |
| CXCL1 | 0.99876 | 0.99777 | 0.99974 | 0.00131 | 1.01249 | 1.00631 | 1.01871 | 0.00007 | |
| WNT5A | 0.99887 | 0.99816 | 0.99958 | 0.00172 | 1.02524 | 1.01432 | 1.03627 | 0.00000 | |
| CXCL2 | 0.99921 | 0.99853 | 0.99990 | 0.02483 | 1.00091 | 1.00039 | 1.00143 | 0.00065 | |
| IL13RA2 | 1.00003 | 1.00001 | 1.00005 | 0.00057 | 1.06190 | 1.03580 | 1.08866 | 0.00000 | |
| PPARGC1A | 0.99987 | 0.99975 | 1.00000 | 0.04510 | 1.00033 | 1.00002 | 1.00063 | 0.02638 | |
| CXCL3 | 1.00016 | 1.00002 | 1.00030 | 0.00225 | 1.04923 | 1.02417 | 1.07490 | 0.00010 | |
| AGT | 1.00082 | 1.00043 | 1.00122 | 0.00005 | 1.00710 | 1.00419 | 1.01001 | 0.00000 | |
| HP | GUCA2A | 1.00002 | 1.00001 | 1.00004 | 0.00500 | 1.00144 | 1.00078 | 1.00210 | 0.00002 |
| GCG | 1.00009 | 1.00001 | 1.00016 | 0.00207 | 1.04378 | 1.02168 | 1.06636 | 0.00009 | |
| PTN | 0.97874 | 0.96409 | 0.99361 | 0.00523 | 1.00011 | 1.00006 | 1.00017 | 0.00003 | |
| EDN3 | 1.00075 | 1.00008 | 1.00142 | 0.02923 | 1.00038 | 1.00011 | 1.00064 | 0.00513 | |
| CXCL3 | 1.00016 | 1.00002 | 1.00030 | 0.00225 | 1.04923 | 1.02417 | 1.07490 | 0.00010 | |
| MYC | 1.00086 | 1.00008 | 1.00164 | 0.03002 | 1.01964 | 1.00500 | 1.03449 | 0.00840 | |
| SSP | GUCA2A | 1.00002 | 1.00001 | 1.00004 | 0.00500 | 1.00144 | 1.00078 | 1.00210 | 0.00002 |
| GCG | 1.00009 | 1.00001 | 1.00016 | 0.00207 | 1.04378 | 1.02168 | 1.06636 | 0.00009 | |
| CXCL1 | 0.99876 | 0.99777 | 0.99974 | 0.00131 | 1.01249 | 1.00631 | 1.01871 | 0.00007 | |
| CXCL2 | 0.99921 | 0.99853 | 0.99990 | 0.02483 | 1.00091 | 1.00039 | 1.00143 | 0.00065 | |
| PPARGC1A | 0.99987 | 0.99975 | 1.00000 | 0.04510 | 1.00033 | 1.00002 | 1.00063 | 0.02638 | |
| CXCL3 | 1.00016 | 1.00002 | 1.00030 | 0.00225 | 1.04923 | 1.02417 | 1.07490 | 0.00010 | |
| ZIC5 | 1.00016 | 1.00002 | 1.00031 | 0.03053 | 1.00001 | 1.00000 | 1.00002 | 0.01373 | |
| ITB | WNT5A | 0.99887 | 0.99816 | 0.99958 | 0.00172 | 1.02524 | 1.01432 | 1.03627 | 0.00000 |
| IL13RA2 | 1.00003 | 1.00001 | 1.00005 | 0.00057 | 1.06190 | 1.03580 | 1.08866 | 0.00000 | |
| NOTCH3 | 0.98949 | 0.98012 | 0.99895 | 0.02952 | 1.00129 | 1.00038 | 1.00220 | 0.00561 | |
| OSR1 | 1.00007 | 1.00002 | 1.00013 | 0.00140 | 1.00135 | 1.00068 | 1.00202 | 0.00008 | |
| INHBB | 1.00008 | 1.00005 | 1.00012 | 0.00002 | 1.00767 | 1.00467 | 1.01069 | 0.00000 | |
| AGT | 1.00082 | 1.00043 | 1.00122 | 0.00005 | 1.00710 | 1.00419 | 1.01001 | 0.00000 | |
| IBS | RNASE1 | 1.00824 | 1.00112 | 1.01541 | 0.02315 | 1.04461 | 1.01940 | 1.07044 | 0.00046 |
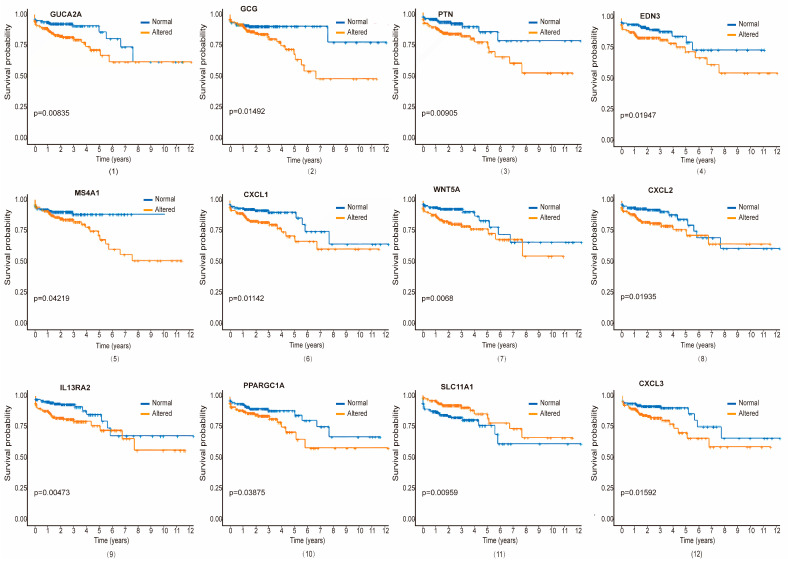
Survival curves for each significant gene, comparing altered and unaltered expression groups, were generated using the PL estimation function (Figure 5 and Figure S3). As illustrated, we identified 21 genes as the most significant prognostic indicators for CRC patients, with varying associations across different ISDs. Among them, genes such as gene number 1–5 (GUCA2A, GCG, PTN, EDN3, and MS4A1) for TVAD and CRC, 1, 4, 6–11 (GUCA2A, EDN3, CXCL1, WNT5A, CXCL2, IL13RA2, PPARGC1A, and SLC11A1) for CD and CRC, 1, 4, 6–10, 12–13 (GUCA2A, EDN3, CXCL1, WNT5A, CXCL2, IL13RA2, PPARGC1A, CXCL3, and AGT) for UC and CRC, 1–4, 12, 14 (GUCA2A, GCG, PTN, EDN3, CXCL3, and MYC) for HP and CRC, 1–2, 6, 8, 10, 12, 15 (GUCA2A, GCG, CXCL1, CXCL2, PPARGC1A, CXCL3, and ZIC5) for SSP and CRC, 7, 9, 13, 16–18 (WNT5A, IL13RA2, AGT, NOTCH3, OSR1, and INHBB) for ITB and CRC and 19 (RNASE1) for IBS and CRC are associated with survival of the CRC patients. Notably, two genes (F2RL2 and IL17A) were uniquely related to CRC patient survival. In both univariate and multivariate analyses, p ≤ 0.05 indicated a significant difference in survival between the genetically altered and unaltered groups. This approach allowed us to determine the joint role of important clinical and genetic factors in CRC patient survival.
3.6. Validation Against Gold-Standard Databases and Immunohistochemical Verification
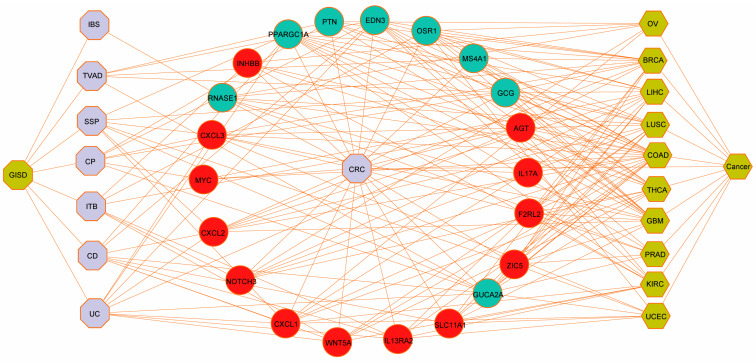
To validate our findings, we compared our results against three gold-standard benchmark databases: dbGaP, OMIM, and Oncomine. We used the EnrichR tool to perform gene set enrichment analysis on the dysregulated DEGs identified in our pipeline, with a p-value threshold of <0.05.
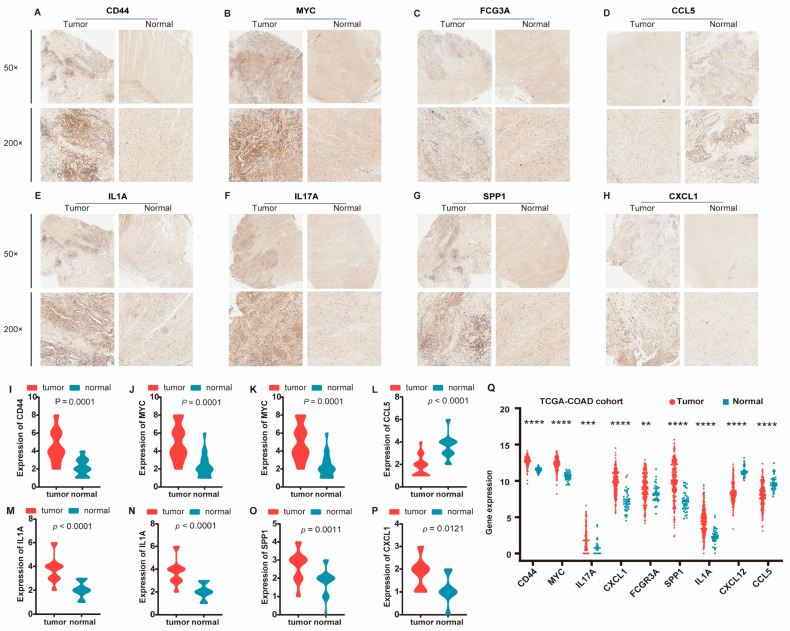
We constructed a comprehensive disease–gene association network using the list of cancers, as shown in Figure 6, which confirmed that the significant genes we identified in ISDs have known disease associations. This systematic benchmarking against gold-standard data strengthened our confidence in the computational methods employed. For further validation, we performed immunohistochemical analysis on clinical samples, focusing on the nine hub proteins identified by PPI network analysis of DEGs. The immunohistochemical analysis revealed significantly higher expression of CD44, MYC, IL17A, CXCL1, FCGR3A, SPP1, and IL1A in cancer tissues, while CXCL12 and CCL5 showed significantly higher expression in adjacent normal tissues (Figure 7A–H and Figure S4). Gene expression patterns were visualized using the ggplot2 R package (Figure 7I–P). Additionally, we validated these findings using the TCGA-COAD cohort (Figure 7Q).
Overall, our integrated bioinformatics and machine learning approach, coupled with experimental validation, provides strong evidence that ISDs may influence CRC progression. This study not only identifies potential prognostic biomarkers, but also suggests new avenues for therapeutic interventions in CRC.
4. Discussion
Our comprehensive study employing integrated bioinformatics and machine learning approaches has unveiled significant molecular and genetic links between ISDs and CRC. In general, results of our analyses indicate that the ISDs share dysregulated genes and molecular pathways and that people with ISD disorders—TVAD, UC, SSPs, HP, CD, ITB and IBS—have a higher chance of developing CRC. By analyzing microarray and RNA-seq gene expression data from both ISDs and CRC, we have provided solid proof that ISDs can interact with CRC at multiple levels. The identification of critical DEGs shared between ISDs and CRC forms the foundation of this interaction. Particularly, our analysis revealed that TVAD shares 63 significant DEGs with CRC, CD shares 52, UC shares 44, HP shares 31, SSP shares 40, ITB shares 40, and IBS shares 36 crucial DEGs with CRC. This substantial genetic overlap not only demonstrates the potential for ISDs to influence CRC development and progression, but also provides a molecular basis for understanding the increased susceptibility to CRC observed in individuals with certain ISDs. The construction of disease–gene association networks further visualizes these intricate connections, offering a clear representation of how ISDs and CRC are intertwined at the genetic level. These networks serve as a powerful tool for identifying key molecular players that may mediate the ISD-CRC relationship and provide targets for future investigations into the mechanisms of this comorbidity.
The functional annotation and enrichment analysis of the dysregulated genes shared between ISDs and CRC have uncovered several key molecular and ontological pathways, providing strong evidence that ISDs have an impact on CRC cancer. These pathways, including those involved in inflammation, immune response, cellular metabolism and gut–brain-axis communication offer mechanistic insights into how ISDs might modulate CRC pathobiology. The identification of hub genes further emphasizes the central role of specific molecular players in mediating the ISD-CRC relationship. These hub genes are implicated in critical signaling pathways that control significant molecular processes in the pathobiology of CRC cancer, such as cell adhesion, inflammation and immune homeostasis. The alteration of these pathways in the context of ISDs suggests that the chronic inflammatory state or other molecular perturbations associated with ISDs may create a microenvironment conducive to CRC development or progression. These findings align with the growing body of evidence linking chronic inflammation to increased cancer risk and provide a molecular framework for understanding this relationship in the specific context of ISDs and CRC [ref. 16,ref. 17,ref. 23].
Our multi-omics analysis, incorporating protein–protein interaction data, further reinforces the impact of ISDs on CRC cancer and provides compelling evidence for the involvement of shared genes in the pathophysiology of CRC cancer. Those shared DEGs between each ISD and CRC underscore the potential for these disorders to influence various aspects of CRC biology. These genes are not merely coincidental overlaps, but represent key molecular nodes through which ISDs may exert their influence on CRC. For instance, genes involved in inflammatory signaling, such as cytokines and their receptors, may contribute to a pro-tumorigenic environment when dysregulated in the context of ISDs. Similarly, alterations in genes controlling cell adhesion or extracellular-matrix remodeling could facilitate tumor invasion and metastasis. The identification of these shared molecular pathways not only enhances our understanding of the ISD-CRC relationship, but also presents potential targets for therapeutic interventions aimed at mitigating the increased CRC risk in ISD patients.
To assess the prognostic significance of the identified biomarkers and further elucidate their role in CRC pathophysiology, we employed the Cox Proportional Hazard Model, a robust statistical method for survival analysis. This approach revealed a total of 50 prognostic genes significantly associated with CRC patient survival. The identification of these genes not only provides potential novel prognostic markers, but also offers insights into the molecular determinants of clinical CRC outcomes in the context of ISD comorbidity. Specifically, we identified five DEGs for TVAD and CRC, eight for CD and CRC, nine for UC and CRC, six for HP and CRC, seven for SSP and CRC, six for ITB and CRC, and one for IBS and CRC as biomarker genes that affect the survival of CRC patients. These findings suggest that the molecular alterations associated with ISDs may not only contribute to CRC development, but also influence disease progression and patient survival. This underscores the importance of considering ISD comorbidity in CRC prognosis and treatment planning, potentially leading to more personalized and effective therapeutic strategies.
The validation of our putative biomarker genes using established databases and independent CRC samples corroborates their relevance to CRC progression and patient survival, further strengthening the evidence for the possible impact of ISD disorders on cancer. The high correlation of these genes with both CRC progression and patient survival suggests that they may serve as valuable tools for risk assessment, prognosis, and treatment selection in CRC patients, particularly those with ISD comorbidities. Moreover, these validated biomarkers may provide important clues for future functional studies aimed at elucidating the precise mechanisms through which ISDs influence CRC biology. Such investigations could lead to the development of novel therapeutic strategies targeting the specific molecular pathways disrupted in the context of ISD-CRC comorbidity, potentially improving outcomes for this high-risk patient population.
However, due to the small sample size from the limited number of studies involved, and different cell types for cross disease or comorbidity analysis, it is possible to miss the genes associated with diseases. Moreover, unpublished gray literature was not searched, although the two searched databases—PubMed, and Web of science—covered the vast majority of relevant journals for the subject. The results in comorbidity biomarker discovery should be further validated in high-quality studies with larger sample sizes, which will further improve the individualized treatment of quality complications in CRC patients.
5. Conclusions
In this work, we explored the use of bioinformatics and machine learning models to integrate and evaluate gene expression, multi-omic, clinical, and molecular data in order to find relationships between disease comorbidity and diseasomes. Our analysis revealed a complex interactome of hub proteins (including immune regulators FCGR3A and IL17A, inflammatory mediators IL1A and CXCL1, adhesion molecules CD44 and SPP1, chemokines CXCL12 and CCL5, and the transcription factor MYC) linking ISD and CRC, underscoring the intricate interplay between immune dysregulation, chronic inflammation, and altered cellular adhesion in disease progression. These findings provide support for the etiologic heterogeneity of colorectal neoplasia and explain why people with intestinal disabilities are more susceptible to developing CRCs. Our suggested methodologies are applicable to identifying a wide range of disease characteristics, particularly those present long before symptoms manifest, and can also aid in improving our comprehension of the intricate pathophysiology of disease-risk phenotypes and the variability of disease comorbidity.
References
- J.M. Valderas, B. Starfield, B. Sibbald, C. Salisbury, M. Roland. Defining comorbidity: Implications for understanding health and health services. Ann. Fam. Med., 2009. [DOI | PubMed]
- T. Kreutzburg, F. Peters, H.C. Rieß, S. Hischke, U. Marschall, L. Kriston, H. L’Hoest, A. Sedrakyan, E.S. Debus, C.A. Behrendt. Editor’s Choice—Comorbidity Patterns Among Patients with Peripheral Arterial Occlusive Disease in Germany: A Trend Analysis of Health Insurance Claims Data. Eur. J. Vasc. Endovasc. Surg., 2020. [DOI | PubMed]
- T.V. Merluzzi, E.J. Philip, B. Gomer, C.A. Heitzmann Ruhf, D. Kim. Comorbidity, Functional Impairment, and Emotional Distress: A Coping Mediation Model for Persons with Cancer. Ann. Behav. Med. A Publ. Soc. Behav. Med., 2021. [DOI | PubMed]
- D. Boakye, B. Rillmann, V. Walter, L. Jansen, M. Hoffmeister, H. Brenner. Impact of comorbidity and frailty on prognosis in colorectal cancer patients: A systematic review and meta-analysis. Cancer Treat. Rev., 2018. [DOI | PubMed]
- N.J. Van Leersum, M.L.G. Janssen-Heijnen, M.W.J.M. Wouters, H.J.T. Rutten, J.W. Coebergh, R.A.E.M. Tollenaar, V.E.P.P. Lemmens. Increasing prevalence of comorbidity in patients with colorectal cancer in the South of the Netherlands 1995–2010. Int. J. Cancer, 2013. [DOI | PubMed]
- E.B. Ostenfeld, M. Nørgaard, R.W. Thomsen, L.H. Iversen, J.B. Jacobsen, M. Søgaard. Comorbidity and survival of Danish patients with colon and rectal cancer from 2000–2011: A population-based cohort study. Clin. Epidemiol., 2013. [DOI | PubMed]
- L.H. Iversen, M. Nørgaard, J. Jacobsen, S. Laurberg, H.T. Sørensen. The impact of comorbidity on survival of Danish colorectal cancer patients from 1995 to 2006—A population-based cohort study. Dis. Colon Rectum, 2009. [DOI | PubMed]
- R. Erichsen, E. Horváth-Puhó, L.H. Iversen, T.L. Lash, H.T. Sørensen. Does comorbidity interact with colorectal cancer to increase mortality? A nationwide population-based cohort study. Br. J. Cancer, 2013. [DOI | PubMed]
- S. Bopanna, A.N. Ananthakrishnan, S. Kedia, V. Yajnik, V. Ahuja. Risk of colorectal cancer in Asian patients with ulcerative colitis: A systematic review and meta-analysis. Lancet Gastroenterol. Hepatol., 2017. [DOI | PubMed]
- I. Kellokumpu, M. Kairaluoma, J.P. Mecklin, H. Kellokumpu, V. Väyrynen, E.V. Wirta, E. Sihvo, T. Kuopio, T.T. Seppälä. Impact of Age and Comorbidity on Multimodal Management and Survival from Colorectal Cancer: A Population-Based Study. J. Clin. Med., 2021. [DOI | PubMed]
- C. Castano-Milla, M. Chaparro, J.P. Gisbert. Systematic review with meta-analysis: The declining risk of colorectal cancer in ulcerative colitis. Aliment. Pharmacol. Ther., 2014. [DOI | PubMed]
- P. Wieszczy, M.F. Kaminski, R. Franczyk, M. Loberg, J. Kobiela, M. Rupinska, B. Kocot, M. Rupinski, O. Holme, U. Wojciechowska. Colorectal Cancer Incidence and Mortality After Removal of Adenomas During Screening Colonoscopies. Gastroenterology, 2020. [DOI | PubMed]
- J.K. Lee, C.D. Jensen, T.R. Levin, C.A. Doubeni, A.G. Zauber, J. Chubak, A.S. Kamineni, J.E. Schottinger, N.R. Ghai, N. Udaltsova. Long-term Risk of Colorectal Cancer and Related Death After Adenoma Removal in a Large, Community-based Population. Gastroenterology, 2020. [DOI | PubMed]
- X. He, K. Wu, S. Ogino, E.L. Giovannucci, A.T. Chan, M. Song. Association Between Risk Factors for Colorectal Cancer and Risk of Serrated Polyps and Conventional Adenomas. Gastroenterology, 2018. [DOI | PubMed]
- A. Duvvuri, V.T. Chandrasekar, S. Srinivasan, A. Narimiti, C. Dasari, V. Nutalapati, K.F. Kennedy, M. Spadaccini, G. Antonelli, M. Desai. Risk of Colorectal Cancer and Cancer Related Mortality After Detection of Low-risk or High-risk Adenomas, Compared With No Adenoma, at Index Colonoscopy: A Systematic Review and Meta-analysis. Gastroenterology, 2021. [DOI | PubMed]
- B. Click, P.F. Pinsky, T. Hickey, M. Doroudi, R.E. Schoen. Association of Colonoscopy Adenoma Findings with Long-term Colorectal Cancer Incidence. JAMA, 2018. [DOI | PubMed]
- X. He, D. Hang, K. Wu, J. Nayor, D.A. Drew, E.L. Giovannucci, S. Ogino, A.T. Chan, M. Song. Long-term Risk of Colorectal Cancer After Removal of Conventional Adenomas and Serrated Polyps. Gastroenterology, 2020. [DOI | PubMed]
- Z. Xiao, W. Wu, C. Wu, M. Li, F. Sun, L. Zheng, G. Liu, X. Li, Z. Yun, J. Tang. 5-Hydroxymethylcytosine signature in circulating cell-free DNA as a potential diagnostic factor for early-stage colorectal cancer and precancerous adenoma. Mol. Oncol., 2021. [DOI | PubMed]
- M. Song, L. Emilsson, S.R. Bozorg, L.H. Nguyen, A.D. Joshi, K. Staller, J. Nayor, A.T. Chan, J.F. Ludvigsson. Risk of colorectal cancer incidence and mortality after polypectomy: A Swedish record-linkage study. Lancet Gastroenterol. Hepatol., 2020. [DOI | PubMed]
- Y. Tanaka, H.O. Yamano, E. Yamamoto, H.O. Matushita, H. Aoki, K. Yoshikawa, R. Takagi, E. Harada, M. Nakaoka, Y. Yoshida. Endoscopic and molecular characterization of colorectal sessile serrated adenoma/polyps with cytologic dysplasia. Gastrointest. Endosc., 2017. [DOI | PubMed]
- A.N. Burnett-Hartman, J. Chubak, X. Hua, R. Ziebell, A. Kamineni, L.C. Zhu, M.P. Upton, R.C. Malen, S. Hardikar, P.A. Newcomb. The association between colorectal sessile serrated adenomas/polyps and subsequent advanced colorectal neoplasia. Cancer Causes Control, 2019. [DOI | PubMed]
- D.E. Aust, G.B. Baretton. Serrated polyps of the colon and rectum (hyperplastic polyps, sessile serrated adenomas, traditional serrated adenomas, and mixed polyps)-proposal for diagnostic criteria. Virchows Arch. Int. J. Pathol., 2010. [DOI | PubMed]
- W. Mohammed, P. Hoskin, A. Henry, A. Gomez-Iturriaga, A. Robinson, A. Nikapota. Short-term Toxicity of High Dose Rate Brachytherapy in Prostate Cancer Patients with Inflammatory Bowel Disease. Clin. Oncol., 2018. [DOI | PubMed]
- T. Hirashima, Y. Tamura, Y. Han, S. Hashimoto, A. Tanaka, T. Shiroyama, N. Morishita, H. Suzuki, N. Okamoto, S. Akada. Efficacy and safety of concurrent anti-Cancer and anti-tuberculosis chemotherapy in Cancer patients with active Mycobacterium tuberculosis: A retrospective study. BMC Cancer, 2018. [DOI | PubMed]
- T. Hirashima, T. Nagai, H. Shigeoka, Y. Tamura, H. Yoshida, K. Kawahara, Y. Kondoh, K. Sakai, S. Hashimoto, M. Fujishima. Comparison of the clinical courses and chemotherapy outcomes in metastatic colorectal cancer patients with and without active Mycobacterium tuberculosis or Mycobacterium kansasii infection: A retrospective study. BMC Cancer, 2014. [DOI | PubMed]
- P. Oka, H. Parr, B. Barberio, C.J. Black, E.V. Savarino, A.C. Ford. Global prevalence of irritable bowel syndrome according to Rome III or IV criteria: A systematic review and meta-analysis. Lancet. Gastroenterol. Hepatol., 2020. [DOI | PubMed]
- G. Fond, A. Loundou, N. Hamdani, W. Boukouaci, A. Dargel, J. Oliveira, M. Roger, R. Tamouza, M. Leboyer, L. Boyer. Anxiety and depression comorbidities in irritable bowel syndrome (IBS): A systematic review and meta-analysis. Eur. Arch. Psychiatry Clin. Neurosci., 2014. [DOI | PubMed]
- X. Wu, J. Wang, Z. Ye, J. Wang, X. Liao, M. Liv, Z. Svn. Risk of Colorectal Cancer in Patients with Irritable Bowel Syndrome: A Meta-Analysis of Population-Based Observational Studies. Front. Med., 2022. [DOI]
- I. Aziz, M. Simren. The overlap between irritable bowel syndrome and organic gastrointestinal diseases. Lancet Gastroenterol. Hepatol., 2021. [DOI | PubMed]
- B.K. Edwards, A.M. Noone, A.B. Mariotto, E.P. Simard, F.P. Boscoe, S.J. Henley, A. Jemal, H. Cho, R.N. Anderson, B.A. Kohler. Annual Report to the Nation on the status of cancer, 1975-2010, featuring prevalence of comorbidity and impact on survival among persons with lung, colorectal, breast, or prostate cancer. Cancer, 2014. [DOI | PubMed]
- T. Barrett, S.E. Wilhite, P. Ledoux, C. Evangelista, I.F. Kim, M. Tomashevsky, K.A. Marshall, K.H. Phillippy, P.M. Sherman, M. Holko. NCBI GEO: Archive for functional genomics data sets—Update. Nucleic Acids Res., 2013. [DOI | PubMed]
- Z. Zhang, H. Li, S. Jiang, R. Li, W. Li, H. Chen, X. Bo. A survey and evaluation of Web-based tools/databases for variant analysis of TCGA data. Brief. Bioinform., 2019. [DOI | PubMed]
- O. Galamb, B. Wichmann, F. Sipos, S. Spisák, T. Krenács, K. Tóth, K. Leiszter, A. Kalmár, Z. Tulassay, B. Molnár. Dysplasia-carcinoma transition specific transcripts in colonic biopsy samples. PLoS ONE, 2012. [DOI | PubMed]
- D.A. Delker, B.M. McGettigan, P. Kanth, S. Pop, D.W. Neklason, M.P. Bronner, R.W. Burt, C.H. Hagedorn. RNA sequencing of sessile serrated colon polyps identifies differentially expressed genes and immunohistochemical markers. PLoS ONE, 2014. [DOI | PubMed]
- W.R. Lin, J.M. Chiang, S.N. Lim, M.Y. Su, T.H. Chen, S.W. Huang, C.W. Chen, R.C. Wu, C.L. Tsai, Y.H. Lin. Dynamic bioenergetic alterations in colorectal adenomatous polyps and adenocarcinomas. EBioMedicine, 2019. [DOI | PubMed]
- W.J. Sandborn, B.G. Feagan, C. Marano, H. Zhang, R. Strauss, J. Johanns, O.J. Adedokun, C. Guzzo, J.F. Colombel, W. Reinisch. Subcutaneous golimumab induces clinical response and remission in patients with moderate-to-severe ulcerative colitis. Gastroenterology, 2014. [DOI | PubMed]
- W. Vanhove, P.M. Peeters, D. Staelens, A. Schraenen, J. Van der Goten, I. Cleynen, S. De Schepper, L. Van Lommel, N.L. Reynaert, F. Schuit. Strong Upregulation of AIM2 and IFI16 Inflammasomes in the Mucosa of Patients with Active Inflammatory Bowel Disease. Inflamm. Bowel Dis., 2015. [DOI | PubMed]
- V. Ahuja, S. Subodh, A. Tuteja, V. Mishra, S.K. Garg, N. Gupta, G. Makharia, S.K. Acharya. Genome-wide gene expression analysis for target genes to differentiate patients with intestinal tuberculosis and Crohn’s disease and discriminative value of FOXP3 mRNA expression. Gastroenterol. Rep., 2016. [DOI]
- C. Swan, N.P. Duroudier, E. Campbell, A. Zaitoun, M. Hastings, G.E. Dukes, J. Cox, F.M. Kelly, J. Wilde, M.G. Lennon. Identifying and testing candidate genetic polymorphisms in the irritable bowel syndrome (IBS): Association with TNFSF15 and TNFalpha. Gut, 2013. [DOI | PubMed]
- Q. Hong, B. Li, X. Cai, Z. Lv, S. Cai, Y. Zhong, B. Wen. Transcriptomic Analyses of the Adenoma-Carcinoma Sequence Identify Hallmarks Associated with the Onset of Colorectal Cancer. Front. Oncol., 2021. [DOI | PubMed]
- R. Carey, I. Jurickova, E. Ballard, E. Bonkowski, X. Han, H. Xu, L.A. Denson. Activation of an IL-6:STAT3-dependent transcriptome in pediatric-onset inflammatory bowel disease. Inflamm. Bowel Dis., 2008. [DOI | PubMed]
- M.H. Rahman, H.K. Rana, S. Peng, X. Hu, C. Chen, J.M. Quinn, M.A. Moni. Bioinformatics and machine learning methodologies to identify the effects of central nervous system disorders on glioblastoma progression. Brief. Bioinform., 2021. [DOI | PubMed]
- J. Torcivia-Rodriguez, H. Dingerdissen, T.C. Chang, R. Mazumder. A Primer for Access to Repositories of Cancer-Related Genomic Big Data. Methods Mol. Biol., 2019. [PubMed]
- M.H. Rahman, S. Peng, X. Hu, C. Chen, M.R. Rahman, S. Uddin, J.M. Quinn, M.A. Moni. A Network-Based Bioinformatics Approach to Identify Molecular Biomarkers for Type 2 Diabetes that Are Linked to the Progression of Neurological Diseases. Int. J. Environ. Res. Public Health, 2020. [DOI | PubMed]
- D. Szklarczyk, A.L. Gable, K.C. Nastou, D. Lyon, R. Kirsch, S. Pyysalo, N.T. Doncheva, M. Legeay, T. Fang, P. Bork. The STRING database in 2021: Customizable protein-protein networks, and functional characterization of user-uploaded gene/measurement sets. Nucleic Acids Res., 2021. [DOI | PubMed]
- A. Singh, C.P. Shannon, B. Gautier, F. Rohart, M. Vacher, S.J. Tebbutt, K.A. Lê Cao. DIABLO: An integrative approach for identifying key molecular drivers from multi-omics assays. Bioinformatics, 2019. [DOI | PubMed]
- L. Chen, D. Lu, K. Sun, Y. Xu, P. Hu, X. Li, F. Xu. Identification of biomarkers associated with diagnosis and prognosis of colorectal cancer patients based on integrated bioinformatics analysis. Gene, 2019. [DOI | PubMed]