ETS2 targets ZMYND11 to inhibit thyroid cancer progression via the mTOR signaling pathway
Abstract
Background:
Despite advancements in thyroid cancer (THCA) treatment, the prognosis for advanced cases remains poor. Cellular senescence is crucial in tumor progression, with ETS2 emerging as a key regulator. However, the role of ETS2 and its interaction with ZMYND11 in THCA is unclear.
Methods:
Differentially expressed genes (DEGs) connected with cellular senescence were determined from The Cancer Genome Atlas (TCGA)-THCA dataset. Functional analysis, prognostic risk model, and nomogram were then performed to identify ETS2 as a hub gene. The roles of ETS2 and ZMYND11 were explored using Western blotting (WB), co-immunoprecipitation (Co-IP), and quantitative real-time polymerase chain reaction (qRT-PCR). Effects of ETS2 overexpression and knockdown of ZMYND11 on apoptosis, cell proliferation, epithelial-mesenchymal transition (EMT), and mTOR signaling were evaluated. In vivo, a xenograft model was established using Cal-62 cells with or without ETS2 overexpression to assess tumor growth and protein expression.
Results:
ETS2 was notably downregulated in THCA, and its low expression was connected to adverse prognosis. ETS2 overexpression inhibited THCA cell invasion, migration, proliferation, and induced apoptosis. ETS2 also regulated the expression of EMT markers, indicating its role in inhibiting THCA progression. Co-IP analysis showed that ETS2 interacted with ZMYND11. Knockdown of ZMYND11 attenuated the inhibitory effect of ETS2 on THCA cell behavior and mTOR pathway regulation. In vivo, ETS2 overexpression reduced tumor growth and increased ETS2 and ZMYND11 expression in xenograft tumors.
Conclusion:
This study identified the cellular senescence gene ETS2 as a tumor suppressor in THCA, which interacts with ZMYND11 to regulate THCA tumor progression through the mTOR pathway, thereby inhibiting cell senescence. Targeting the ETS2–ZMYND1 axis may provide new therapeutic strategies and prognostic biomarkers for THCA.
Affiliations: Department of Endocrinology, Huai’an Clinical Medical College of Jiangsu University & Huai’an Hospital of Huai’an City & Huai’an Cancer Hospital &The Affiliated Huai’an Hospital of Jiangsu College Of Nursing, Huai’an City, Jiangsu Province, China; Jiangsu Key Laboratory of Medical Science and Laboratory Medicine, School of Medicine, Jiangsu university, Zhenjiang, Jiangsu, P.R. China; Department of Central Laboratory, Huai’an Clinical Medical College of Jiangsu University & Huai’an Hospital of Huai’an City & Huai’an Cancer Hospital &The Affiliated Huai’an Hospital of Jiangsu College Of Nursing, Huai’an City, Jiangsu Province, China; Department of Neurology, Huai’an Clinical Medical College of Jiangsu University & Huai’an Hospital of Huai’an City & Huai’an Cancer Hospital &The Affiliated Huai’an Hospital of Jiangsu College Of Nursing, Huai’an City, Jiangsu Province, China; Department of cardiovascular medicine, Huai’an Clinical Medical College of Jiangsu University & Huai’an Hospital of Huai’an City & Huai’an Cancer Hospital &The Affiliated Huai’an Hospital of Jiangsu College Of Nursing, Huai’an City, Jiangsu Province, China; Department of Clinical Laboratory, Huai’an Clinical Medical College of Jiangsu University & Huai’an Hospital of Huai’an City & Huai’an Cancer Hospital &The Affiliated Huai’an Hospital of Jiangsu College of Nursing, Huai’an, China; Endoscopy Center, Minhang Hospital, Fudan University, Shanghai, China,; Department of General Surgery, Huai’an Clinical Medical College of Jiangsu University & Huai’an Hospital of Huai’an City & Huai’an Cancer Hospital & The Affiliated Huai’an Hospital of Jiangsu College of Nursing, Huai’an City, Jiangsu Province, China,; Department of Endocrinology, The Affiliated Chuzhou Hospital of Traditional Chinese Medicine of Jiangsu College of Nursing, Huai’an, China
License: © 2025 Shu et al CC BY 4.0 This is an open access article distributed under the terms of the Creative Commons Attribution License, which permits unrestricted use, distribution, and reproduction in any medium, provided the original author and source are credited.
Article links: DOI: 10.1371/journal.pone.0328881 | PubMed: 40938895 | PMC: PMC12431355
Relevance: Relevant: mentioned in keywords or abstract
Full text: PDF (19.8 MB)
Introduction
As a potentially lethal malignant tumor, thyroid cancer (THCA) grows rapidly [ref. 1]. It is highly invasive, especially in the undifferentiated form, with a negative prognosis and low survival rate, presenting a serious threat to the health of patients. Papillary thyroid cancer accounts for 80–90% of occurrences of thyroid cancer, making it the most prevalent kind of all types [ref. 2]. Since 2000, the occurrence of THCA has increased by 20% every year, and by 2022 it has become the third most prevalent cancer in China [ref. 3]. THCA is more prevalent in females than in males and is specifically prevalent in young and elderly people [ref. 4]. Current treatment strategies for thyroid cancer include radioactive iodine therapy, surgical intervention, targeted therapy, and immunotherapy [ref. 5]. Cellular senescence refers to a stable state of proliferation arrest in cells after irreversible damage or stress. Recently, the function of cell senescence in THCA has received increasing attention. The senescence-associated secretory phenotype (SASP) may serve a promoting function in tumor growth and metastasis by promoting angiogenesis, tumor cell proliferation, and immune escape [ref. 6]. Studies have shown that senescence-related characteristics may become important biomarkers for estimating the prognosis of THCA and guiding immunotherapy, such as DOCK6 and ADAMTSL4 [ref. 7]. These findings offer fresh perspectives on the diagnosis and management of thyroid cancer and emphasize the significance of aging mechanisms in cancer research.
ETS2 is a transcription factor closely related to cell senescence and belongs to the ETS family. It is essential for many biological activities, comprising cell proliferation, apoptosis, differentiation, development, and tumorigenesis [ref. 8]. As one of the cell senescence-related genes, ETS2 is involved in regulating multiple key cell signaling pathways in tumors, such as the JAK/STAT, RAS/MAPK, and PI3K/AKT pathways, which perform an essential function in the occurrence and progression of cancer. In some cancer types, ETS2 exhibits oncogenic properties. For example, overexpression of ETS2 is intimately related to tumor progression, invasion, and metastasis in breast cancer, colorectal cancer, and prostate cancer [ref. 9]. Research findings have also indicated that ETS2 may encourage the development of cancer by activating genes like Myc and Cyclin D1 that are involved in cell survival and proliferation [ref. 10]. Additionally, ETS2 has the potential to act as a specific marker for the early detection of acute myocardial infarction (AMI), and its early detection capability provides a new opportunity for timely intervention in cardiovascular diseases [ref. 11]. Cellular senescence-related gene markers have also been shown to reliably predict patient prognosis and immunotherapy efficacy, especially in immunotherapy for hepatocellular carcinoma, in which ETS2 is a key research subject.
ZMYND11, also known as BS69, is a zinc finger domain-containing protein belonging to the MYND domain protein family. ZMYND11 can function as a co-repressor of transcription, interacting with promoter regions of specific genes and inhibiting their transcription [ref. 12]. Previous studies have indicated interactions between ETS2 and ZMYND11. Research by Plotnik JP et al. demonstrated that ETS1 and ETS2 have opposing regulatory roles in the gene expression program for cell migration, with the function of ETS2 being specifically modulated by the co-repressor ZMYND11, which determines its oncogenic or tumor-suppressive roles in different cellular contexts [ref. 13]. Similarly, Wei G et al. found that BS69 acts as a co-repressor interacting with ETS2, and phosphorylation of ETS2 reduces this interaction, potentially shifting its function from a repressor to an activator [ref. 14]. Therefore, this research aims to investigate the roles and mechanistic pathways of ETS2 and ZMYND11 in THCA, thereby providing new directions for the treatment of THCA.
Despite advances in THCA treatment, including radioiodine therapy, surgery, targeted therapy, and immunotherapy, the prognosis of advanced cases remains poor. Recent studies have highlighted key factors in the progression of THCA, like ETS2, a transcriptional regulator implicated in tumor development and metastasis in various cancers [ref. 15]. ETS2 is known to regulate key cellular processes by modulating multiple signaling pathways. This research attempts to clarify the function of ETS2 in THCA by exploring its interaction with ZMYND11. By investigating their effects on cell proliferation, epithelial-mesenchymal transition (EMT), apoptosis, and the mTOR pathway, this investigation aims to find possible therapeutic targets and biomarkers to ultimately improve the prognosis and therapeutic strategies of THCA.
Materials and methods
Analysis of differentially expressed genes related to cellular senescence in THCA
Samples connected to THCA were acquired from The Cancer Genome Atlas (TCGA) database via the Sangerbox tool (http://vip.sangerbox.com/home.html) for this research. The dataset included 512 THCA tumor samples and 59 adjacent normal samples from TCGA. The selection of cutoff values for DEGs was based on commonly accepted thresholds in bioinformatics studies to balance the sensitivity and specificity of gene identification. DEGs were characterized based on a log2 fold change (FC) threshold of <−1 for downregulated genes and >1 for upregulated genes, as this level of change is generally considered significant in gene expression studies. Additionally, a P-value threshold of <0.05 was applied to ensure the statistical robustness of the identified DEGs, reducing the likelihood of false positives. These criteria were selected to provide a reliable and interpretable set of DEGs for subsequent analyses. To investigate the relationship between DEGs and cellular senescence, 278 genes connected with cell senescence were acquired from the CellAge database (https://genomics.senescence.info/cells/). Intersection analysis of cell senescence-related genes and DEGs was performed using the Venn online graph tool (https://bioinformatics.psb.ugent.be/webtools/Venn/) to identify overlapping genes.
Gene Ontology (GO) and Kyoto Encyclopedia of Genes and Genomes (KEGG) pathway enrichment analysis
The enrichment analysis for cellular senescence-associated genes in THCA, focusing on GO and KEGG pathways, was conducted via the Xiantao Academic platform (https://www.xiantao.love/products). This analysis sought to highlight key biological processes, cellular structures, molecular functions, and signaling pathways. A P-value < 0.05 was applied as the significance threshold for all results obtained from the enrichment analysis.
Univariate Cox regression analysis and protein-protein interaction (PPI) analysis
To evaluate the prognostic significance of cellular senescence-related genes in THCA, we employed univariate Cox regression analysis. Cox regression is based on the proportional hazards assumption, which posits that the hazard ratio for the effect of a covariate is constant over time. To ensure the validity of this assumption in our analysis, we evaluated the proportional hazards through diagnostic tests. 95% confidence intervals (CIs) and Hazard ratios (HRs) were measured to determine genes significantly connected to overall survival. P-values < 0.05 suggested that the findings were statistically significant. In addition, with the Search tool for the retrieval of interacting genes/proteins (STRING; https://string-db.org/) database, PPI networks were built, and Cytoscape software (version 3.10.2) was utilized to display the results.
Prognostic feature construction and risk model evaluation using least absolute shrinkage and selection operator (LASSO) regression
The creation of prognostic characteristics used the LASSO regression analysis in R, utilizing the “glmnet” package. LASSO regression assumes that there is sparsity among the features, meaning that only a small subset of the variables were truly associated with the outcome, while others have coefficients shrunk to zero. This assumption ensures that the model can effectively handle high-dimensional data and prevent overfitting. LASSO regression was employed to identify relevant prognostic features from a set of nine prognostic genes, with optimal gene selection determined through 10-fold cross-validation. Based on this analysis, the following algorithm was used to determine a risk score for every patient: Riskscore=(0.2922)*MMP9+(0.7243)*SRSF1+(−0.4812)*FASTK+(−0.1894)*CBX7+(−1.0796)*ETS2. Based on the median value of the computed risk scores, groups of patients then categorized as high-risk and low-risk were formed. Kaplan-Meier survival curves were generated to compare survival differences between these groups utilizing the “survival” package in R. The “timeROC” R package was utilized to create receiver operating characteristic (ROC) curves, which evaluated the predictive capacity of the risk model. Throughout the studies, statistical significance was measured with a threshold of P < 0.05.
Construction of prognostic nomogram for THCA
Five key signature genes were identified from the prognostic risk model. To evaluate the relevance of the prognosis of these selected genes and clinical variables (comprising age, gender, pN stage, pT stage, and pM stage), univariate and multivariate Cox regression analyses were performed via the “survival” R package. To find independent prognostic factors, variables having a P-value < 0.05 in the univariate analysis were added to the multivariate model. Subsequently, the “rms” R program was employed to create a nomogram that predicted the overall survival rates at 1, 3, and 5 years. Calibration curves were generated to evaluate the concordance between observed and predicted survival rates, enabling the identification of hub genes in this study.
Expression analysis and survival analysis of ETS2 in pan-cancer
To validate the biological characteristics of the hub gene, we initially conducted a pan-cancer expression analysis, focusing particularly on THCA tumor tissues, utilizing the Gene Expression Profiling Interactive Analysis (GEPIA) database (http://gepia.cancer-pku.cn/). This platform provides comprehensive gene expression profiling among many forms of cancer, allowing for the assessment of differential expression patterns. Subsequently, Kaplan-Meier survival analyses were performed to assess the impact of differential expression of these key genes on progression-free survival (PFS) and disease-free survival (DFS) in THCA patients, determining the prognostic significance associated with their expression levels.
Immunohistochemical (IHC) analysis of ETS2 in THCA tissues
Thyroid tissue samples that were formalin-fixed, paraffin-embedded (FFPE) were provided by the Shanghai Minhang Central Hospital on 28/06/2024 and authorized by the Institutional Ethics Committee (2024-Approval-015–112). IHC staining was performed using an IHC kit (BOSTER, China). After being deparaffinized and rehydrated, the tissue slices were incubated at 95°C for ten minutes in Tris-EDTA buffer (Solarbio, China) for antigen retrieval. An incubation period of 10 minutes at room temperature inhibited endogenous peroxidase activity. After blocking the sections with 5% bovine serum albumin (BSA) for 30 minutes at room temperature, they were treated with an anti-ETS2 antibody (1:100, Abcam, China) overnight at 4°C. Following incubation, the slices were subjected to a biotin-labeled goat anti-mouse IgG secondary antibody and visualized using a DAB substrate kit (ZSGB, Beijing, China). subsequently, 1% hematoxylin was applied to the slices for counterstaining and imaged using a Leica DMI3000B microscope.
Ethics approval and consent to participate
Our study was conducted with the approval of the Ethics Committee of Shanghai Minhang Central Hospital, and informed consent for the relevant research was obtained(2024-approval-015-112).
All animal experiments were performed in accordance with the guidelines for the care and use of laboratory animals and were approved by the Animal Ethics Committee of Hefei National Comprehensive Science Center Institute of Health (Approval No. IHM-API-2025-007). All efforts were made to minimize animal suffering and reduce the number of animals used.
Cell culture conditions
THCA cell lines (Cal-62, TPC-1, and BC-PAP) and normal thyroid epithelial cells (Nthy-ori 3-1) were acquired from Procell (Wuhan, China). Every cell was cultured in RPMI-1640 medium (Gibco, Shanghai, China), which was enhanced with 1% penicillin-streptomycin and 10% fetal bovine serum (FBS). At 37°C, the cells were maintained in a humidified atmosphere with 5% CO2.
Cell transfection
In 24-well plates, Cal-62 and TPC-1 cells were seeded at a density of 2 × 10⁴ cells per well and grown for a whole night in a complete growth medium to reach approximately 70–80% confluence. By the manufacturer’s instructions, Lipofectamine 2000 (BioSharp, China) was employed for transfections. ETS2 overexpression plasmids and ZMYND11 knockdown plasmids, along with their respective negative controls (over-NC, si-NC), were introduced into the cells. The sequence used for the ZMYND11 knockdown was GAAGGGAAATACCGAAGTTAT. 48 hours after transfection, cells were collected for further analyses. All transfection procedures followed standardized protocols to ensure reproducibility and accuracy.
Quantitative real-time polymerase chain reaction (qRT-PCR)
TRIzol reagent (Thermo Fisher Scientific, Shanghai, China) was applied to extract total RNA from Cal-62 and TPC-1 cells by the manufacturer’s instructions. The quantity and quality of RNA were assessed utilizing a NanoDrop spectrophotometer (Thermo Fisher Scientific, Shanghai, China). Subsequently, cDNA synthesis was performed via the PrimeScript RT Kit (Takara, Shiga, Japan) with 1 μg of total RNA as the template. To analyze the gene expression levels, qRT-PCR was conducted by the StepOnePlus Real-Time PCR System (Applied Biosystems, Shanghai, China). SYBR Green PCR Master Mix (Applied Biosystems, Shanghai, China) was utilized for qRT-PCR reactions. Gene expression analysis was conducted utilizing the 2-ΔΔCT method, with β-actin serving as the internal control for normalization. The primer sequences employed in qRT-PCR are listed in Table 2.
Table 2: Primer sequences for qRT-PCR.
| Target | Direction | Sequence (5’-3’) |
|---|---|---|
| ETS2 | Forward | GGCCCGGTTTCTACAGGAAG |
| ETS2 | Reverse | CTTTGGAATTCCGCAGCGAC |
| ZMYND11 | Forward | ACAAAAAGACGACAGGCGGA |
| ZMYND11 | Reverse | ACGGGTGGTCTCTTTAGGGT |
| Bax | Forward | CTGCAGAGGATGATTGCCG |
| Bax | Reverse | TGCCACTCGGAAAAAGACCT |
| Bcl-2 | Forward | TCCCTCGCTGCACAAATACTC |
| Bcl-2 | Reverse | ACGACCCGATGGCCATAGA |
| Caspase-3 | Forward | AGGGGTCATTTATGGGACA |
| Caspase-3 | Reverse | TACACGGGATCTGTTTCTTTG |
| Caspase-9 | Forward | AGGCCCCATATGATCGAGGA |
| Caspase-9 | Reverse | TCGACAACTTTGCTGCTTGC |
| E-cadherin | Forward | ACATACACTCTCTTCTCTC |
| E-cadherin | Reverse | GTCATTCTGATCGGTTAC |
| N-cadherin | Forward | GGGTGGAGGAGAAGAAGACCAG |
| N-cadherin | Reverse | GGCATCAGGCTCCACAGT |
| Vimentin | Forward | AACCTGAGGGAAACTAAT |
| Vimentin | Reverse | TTGATAACCTGTCCATCT |
| ZEB1 | Forward | GAAAGTGTTACAGATGCAG |
| ZEB1 | Reverse | TTCCTTTCCTGTGTCATC |
| ZEB2 | Forward | ATGAAGCAGCCGATCATGGCG |
| ZEB2 | Reverse | CACACATCTTGGAGCAAAAGCATG |
| Snail | Forward | GAAAAGGGACTGTGAGTA |
| Snail | Reverse | GAATAGTTCTGGGAGACA |
| Slug | Forward | CTGGTCAAGAAGCATTTC |
| Slug | Reverse | GGGGAAATAATCACTGTATG |
| S6K1. | Forward | CACATAACCTGTGGTCTGTTGCTG |
| S6K1. | Reverse | AGATGCAAAGCGAACTTGGGA |
| NF-κB1 | Forward | GCCTCCACAAGGCAGCAAATA |
| NF-κB1 | Reverse | CACCACTGGTCAGAGACTCGGTAA |
| COX2 | Forward | AAGTCC CTGAGCATCTACG |
| COX2 | Reverse | TTCCTA CACCAGCAACC |
| 4EBP1 | Forward | TATGACCGGAAATTCCTGATG |
| 4EBP1 | Reverse | CCATCTCAAACTGTGACTCTTCA |
| β-actin | Forward | TCCTTCCTGGGCATGGAG |
| β-actin | Reverse | AGGAGGGGCAATGATCTT |
Western blotting (WB)
By applying RIPA lysis buffer that has been enhanced with inhibitors (Thermo Fisher Scientific, Shanghai, China) of proteases and phosphatases, protein lysates of Cal-62 and TPC-1 cells were generated. With a BCA protein assay kit (Beyotime, Jiangsu, China), the protein content was ascertained. Proteins in equal quantities were separated by SDS-PAGE and then put onto a PVDF membrane (BSA, Beyotime, Jiangsu, China). All antibodies were purchased from Abcam, Shanghai, China. Primary antibodies were employed to identify the following proteins on the membrane: ETS2, Bax, Caspase-3, Bcl-2, Caspase-9, N-cadherin, E-cadherin, Vimentin, ZEB1, ZEB2, Snail, Slug, ZMYND11, S6K1, NF-κB, COX2, and 4EBP1, with β-actin serving as a loading control. Except for 4EBP1 and β-actin, which were diluted at 1:2000, all other antibodies were diluted at 1:1000. An ECL chemiluminescence detection kit (Beyotime, Jiangsu, China) was applied to observe the protein bands, following incubation with secondary antibodies. A densitometric analysis was executed via the ImageJ software (version 2.0).
Cell Counting Kit-8 (CCK-8) assay
The CCK-8 test (CK04, Dojindo, China) was employed to assess the activity of cell proliferation. After treatment, Cal-62 and TPC-1 cells were cultured at a concentration of 5 × 10³ cells per well in 96-well plates. Ten microliters of CCK-8 reagent were supplied to every well at the predetermined intervals of time (0, 24, 48, 72, and 96 hours). The plates were then cultured for 4 hours at 5% CO2 at 37°C in a cell culture incubator. Following the incubation period, a Thermo Fisher Scientific microplate reader (Shanghai, China) was employed to determine the 450 nm absorbance.
Transwell migration and invasion assay
Cells were harvested and resuspended at a concentration of 5 × 10⁴ cells/well 24 hours after the experiment. These cells were then added into the top chamber of a Transwell insert (24-well format). To replicate the extracellular matrix barrier, Matrigel (Corning) was pre-coated on the top chamber for the invasion experiment. The lower chamber was supplemented with a complete medium to act as a chemoattractant. Following 48 hours of incubation at 37°C, cells remaining in the upper chamber, which did not migrate or invade, were carefully eliminated with a cotton swab. situated beneath the membrane were adhered to utilizing 4% paraformaldehyde and stained with DAPI to visualize the nuclei. Migrated or invaded cells were then visualized and quantified under a fluorescence microscope. Images were subsequently captured for documentation.
Flow cytometry
To evaluate cell apoptosis in TPC-1 and Cal-62 cells, flow cytometry analysis was performed in this work. After being plated on 24-well plates at a density of 1 × 10⁴ cells per well, the Cal-62 and TPC-1 cells were cultured for 24 hours. Following dissociation with trypsin-EDTA and washing with PBS, cells were cultured with 5 μL of PI and 5 μL Annexin V-FITC of solution at ambient temperature for 15 minutes for apoptosis analysis. Subsequently, a flow cytometer (Jiyuan, Guangzhou, China) was used to assess the staining of PI and Annexin V, and FlowJo software was used to analyze the results.
Co-immunoprecipitation (Co-IP) assays
Co-IP assays were conducted to validate the relationship between ETS2 and ZMYND11. Plasmids with overexpressed ETS2 or empty vector controls were transfected into Cal-62 and TPC-1 cells. Forty-eight hours post-transfection, protease inhibitor-containing IP lysis solution (Thermo Fisher Scientific, USA) was employed to lyse the cells. The lysates were incubated with an anti-ETS2 antibody for a whole night at 4°C with gentle rotation to allow for immune complex formation. These complexes were then captured using Protein A/G agarose beads (Thermo Fisher Scientific, USA), followed by washing three times with cold lysis buffer to remove non-specifically bound proteins. The bound proteins were dissociated by heating the beads in the SDS-PAGE loading buffer.
Mouse xenograft model
Six BALB/c nude mice, aged 4–5 weeks, were obtained from Vital River Laboratory Animal Technology Co., Ltd. The mice were housed in specific pathogen-free (SPF) conditions with a 12-hour light/dark cycle and were provided with food and water ad libitum. All animal experiments were approved by the Hefei National Comprehensive Science Center Institute of Health (Approval No.: IHM-API-2025–007) and were conducted in accordance with the guidelines for the care and use of laboratory animals.
The mice were randomly divided into two groups (n = 3 per group). Cal-62 thyroid cancer cells were transfected with an expression plasmid (over-ETS2 group) or an empty vector (vector) and suspended in PBS. Each mouse was subcutaneously injected with 1 × 10⁶ cells into the right flank. All mice were euthanized on day 24 after injection. Tumors were carefully excised, photographed, and weighed. The tumor tissues were fixed in 4% paraformaldehyde, embedded in paraffin, and sectioned for subsequent IHC analysis of ETS2 and ZMYND 11 expression.
The IHC experiments were performed as described previously. The antibodies used were anti-ETS2 (1:100, Abcam, China) and anti-ZMYND11 (1:250, Abcam, China). Imaging was conducted using a Leica DMI3000B microscope.
Statistical analysis
For statistical analysis of our dataset, the R programming language was employed. Student’s t-test was utilized to assess intergroup differences and mean values along with their standard deviations (SD) were reported. Tukey’s post-hoc test was performed in conjunction with analysis of variance (ANOVA) to evaluate differences between several groups. There was a predefined significance level of P < 0.05.
Results
Identification and functional analysis of cellular senescence-related genes in THCA
This research identified DEGs from the TCGA-THCA dataset. Following criteria based on FC and P-value, we detected 3,260 downregulated and 557 upregulated DEGs (Fig 1A). A topological analysis was conducted further to understand the connection between these DEGs and cellular senescence, revealing 61 overlapping genes (Fig 1B). After that, GO and KEGG enrichment analyses were employed on these 61 overlapping genes to elucidate their functional roles and contributions to biological processes (Figs 1C, 1D; detailed results in Table 1). Univariate Cox regression analysis was applied to refine these genes, identifying nine crucial genes associated with prognosis (Fig 1E). To gain insights into the complex intracellular processes and signaling pathways, a PPI network analysis was performed on the nine prognostic genes (Fig 1F).
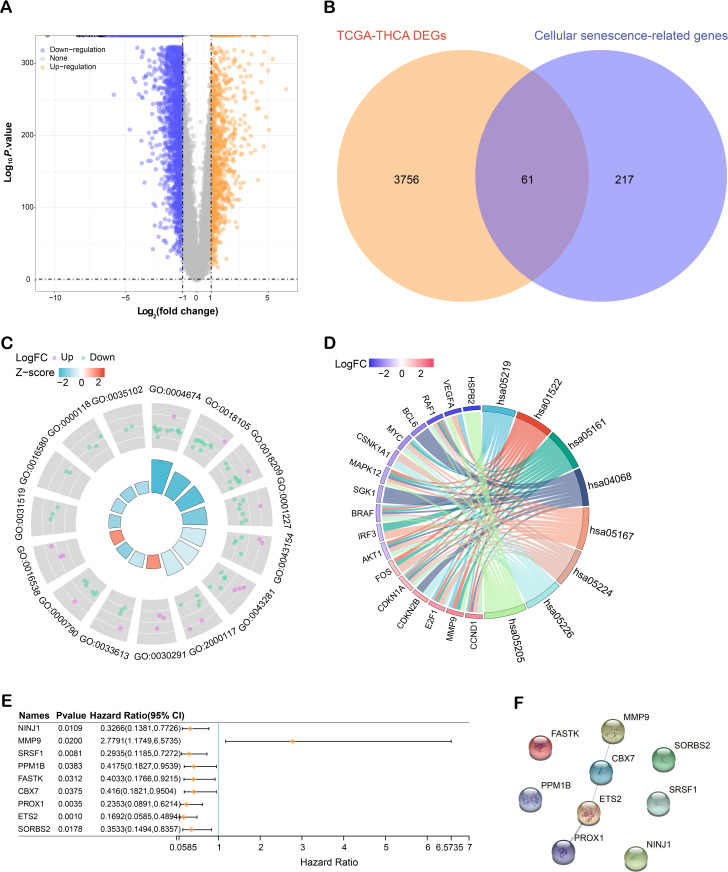
Table 1: GO and KEGG pathway enrichment analysis of differentially expressed genes in THCA.
| ONTOLOGY | ID | Description |
|---|---|---|
| BP | GO:0018105 | peptidyl-serine phosphorylation |
| BP | GO:0018209 | peptidyl-serine modification |
| BP | GO:0043154 | negative regulation of cysteine-type endopeptidase activity involved in apoptotic process |
| BP | GO:0043281 | regulation of cysteine-type endopeptidase activity involved in apoptotic process |
| BP | GO:2000117 | negative regulation of cysteine-type endopeptidase activity |
| CC | GO:0000790 | nuclear chromatin |
| CC | GO:0031519 | PcG protein complex |
| CC | GO:0016580 | Sin3 complex |
| CC | GO:0000118 | histone deacetylase complex |
| CC | GO:0035102 | PRC1 complex |
| MF | GO:0004674 | protein serine/threonine kinase activity |
| MF | GO:0001227 | DNA-binding transcription repressor activity, RNA polymerase II-specific |
| MF | GO:0030291 | protein serine/threonine kinase inhibitor activity |
| MF | GO:0033613 | activating transcription factor binding |
| MF | GO:0016538 | cyclin-dependent protein serine/threonine kinase regulator activity |
| KEGG | hsa05219 | Bladder cancer |
| KEGG | hsa01522 | Endocrine resistance |
| KEGG | hsa05161 | Hepatitis B |
| KEGG | hsa04068 | FoxO signaling pathway |
| KEGG | hsa05167 | Kaposi sarcoma-associated herpesvirus infection |
| KEGG | hsa05224 | Breast cancer |
| KEGG | hsa05226 | Gastric cancer |
| KEGG | hsa05205 | Proteoglycans in cancer |
GO, gene ontology; BP, biological process; CC, cellular component; MF, molecular function; KEGG, kyoto encyclopedia of genes and genomes.
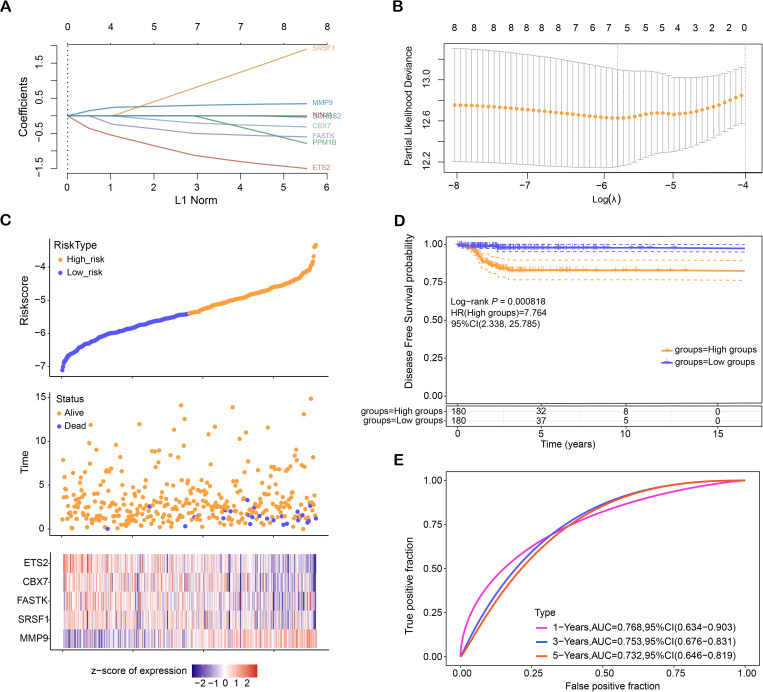
Identification of prognostic genes for THCA using LASSO regression and risk model evaluation
LASSO proportional hazards regression, combined with 10-fold cross-validation, was employed to detect potential prognostic genes. The optimal gene features were selected at lambda. min = 0.0048, resulting in the identification of eight candidate genes (Figs 2A, 2B). Risk scores were then determined for every patient, and based on the median cutoff point, patients were stratified into high-risk and low-risk groups. As shown in Fig 2C, a heatmap displays the survival outcomes of all patients and the expression patterns of the five characteristic genes (ETS2, CBX7, FASTK, SRSF1, MMP9). The Kaplan-Meier survival analysis demonstrates a significant difference in DFS between the high-risk and low-risk groups (P = 0.000818). Patients in the high-risk group have a markedly worse DFS, with a hazard ratio (HR) of 7.764 (95% CI: 2.338–25.785), indicating they are approximately 7.8 times more likely to experience disease recurrence or progression compared to the low-risk group. The high-risk group shows a sharp decline in DFS probability within the first 5 years, while the low-risk group maintains a high DFS probability over time, highlighting the prognostic value of risk stratification (Fig 2D). The ROC curves that are time-dependent proved the prognostic accuracy of the risk model, with the highest AUC observed at one year (AUC = 0.768), reflecting strong predictive performance (Fig 2E).
Prognostic value of ETS2 and clinical variables in THCA
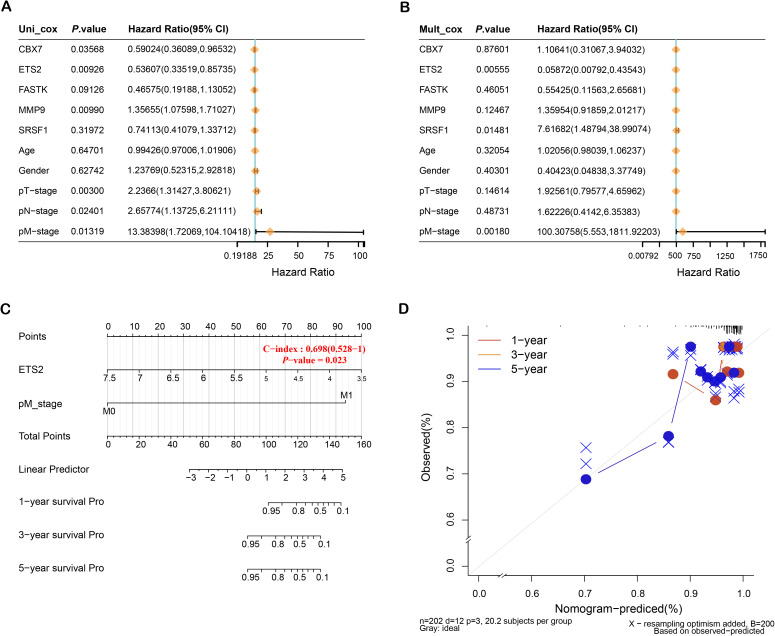
Investigations of the five distinctive genes and clinical factors by univariate and multivariate Cox regression revealed that ETS2 and pM stage are key prognostic factors (Figs 3A, 3B). Consequently, ETS2 was found to be a critical gene in this study. The nomogram analysis and calibration curves for key prognostic variables further demonstrated that ETS2 possesses excellent predictive capability for the survival of patients at 1, 3, and 5 years (Figs 3C, 3D). These results imply that ETS2 could represent a valuable target for therapy and prognostic biomarkers in THCA.
Differential expression and prognostic significance of ETS2 in THCA
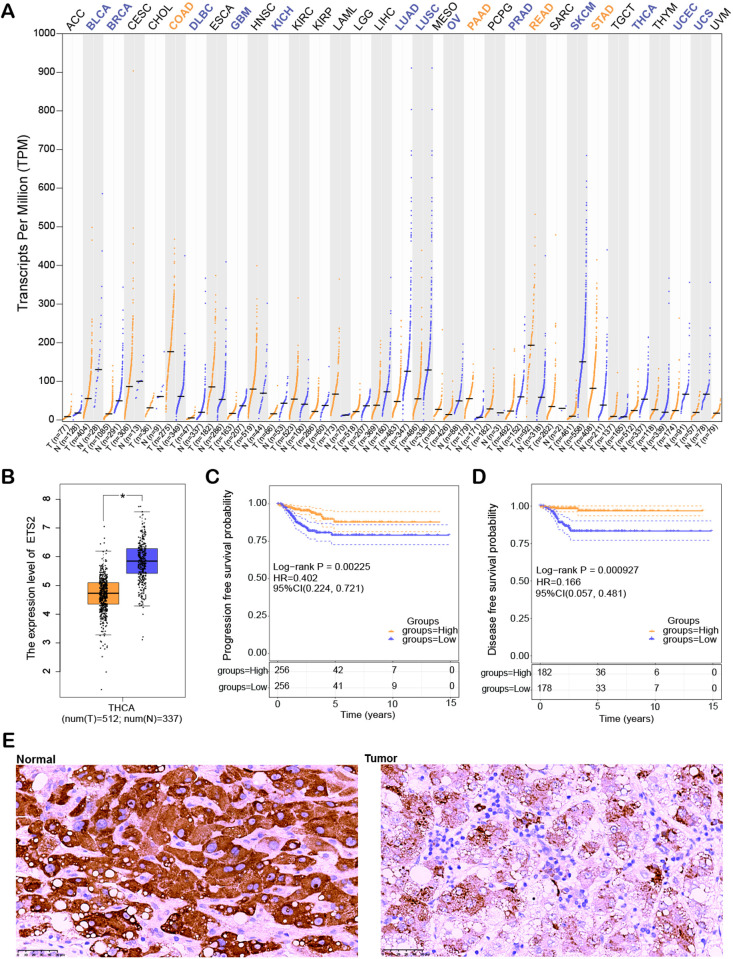
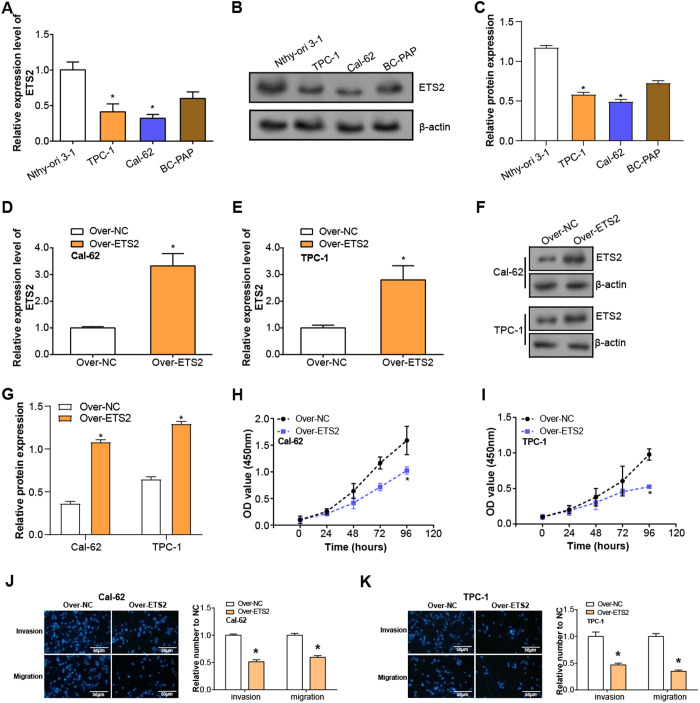
Pan-cancer analysis utilizing the GEPIA2 database revealed significant variation in ETS2 expression across multiple cancer types. Notably, ETS2 was discovered to be downregulated in various cancers, such as THCA, bladder cancer (BLCA), diffuse large B-cell lymphoma (DLBC), glioblastoma multiforme (GBM), and breast cancer (BRCA), with the most pronounced downregulation observed in THCA (Figs 4A, 4B). revealed a substantial correlation between lower PFS and DFS and low ETS2 expression (Figs 4C, 4D). Additionally, IHC analysis demonstrated that ETS2 expression was markedly higher in normal tissue relative to THCA tumor tissue (Fig 4E). These outcomes suggest that ETS2 expression level perhaps connected to a poor prognosis and that it may be important in the initiation and development of THCA.
ETS2 overexpression inhibits THCA cell behavior
The expression of ETS2 in several THCA cell lines (TPC-1, Cal-62, BC-PAP) was analyzed and compared with normal thyroid cells (Nthy-ori 3–1). qRT-PCR outcomes demonstrated that the mRNA expression of ETS2 in both THCA cell lines (TPC-1, Cal-62) was significantly downregulated compared with normal thyroid cells (Fig 5A). WB analysis further verified the decreased protein level of ETS2 in these cancer cell lines (Fig 5B, 5C). qRT-PCR and WB verified the transfection efficiency of ETS2 overexpression plasmid in TPC-1 and Cal-62cells and confirmed the high expression of ETS2 (Figs 5D–5G). CCK-8 assay showed a significant decrease in cell proliferation after ETS2 overexpression, suggesting that it has a suppressive impact on the proliferation of THCA cells (Fig 5H, 5I). In addition, Transwell experiments also found that after ETS2 overexpression, the quantity of invasive and migrating cells was considerably decreased, suggesting that ETS2 markedly reduced the migration and invasion ability of THCA cells (Figs 5J, 5K), further supporting the function of ETS2 overexpression in inhibiting the proliferation, invasion, and migration of THCA cells.
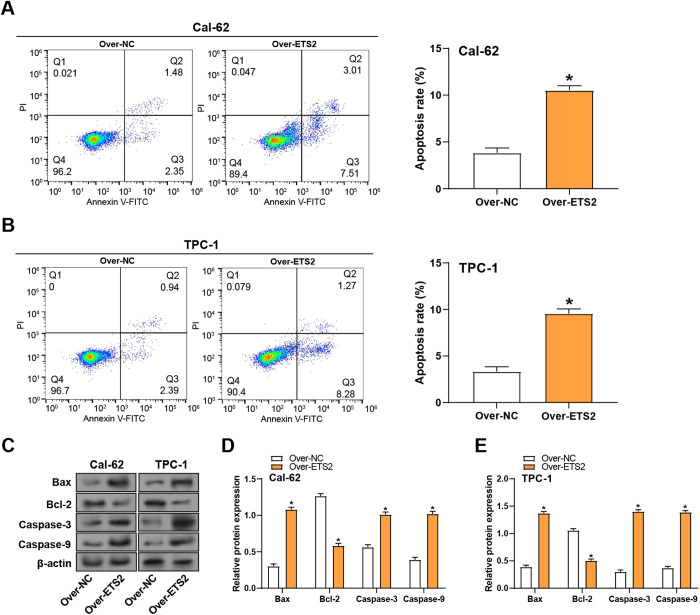
ETS2 overexpression promotes apoptosis in THCA cells
Flow cytometry was utilized to evaluate the impact of ETS2 overexpression on apoptosis in Cal-62 and TPC-1 cells. The outcomes revealed a notable rise in the quantity of Cal-62 and TPC-1 apoptotic cells following ETS2 overexpression, indicating that ETS2 enhances apoptosis in thyroid cancer cells (Figs 6A, 6B). WB analysis was conducted to assess the results of ETS2 overexpression on apoptosis-related proteins, including Bax, Bcl-2, Caspase-9, and Caspase-3. The outcomes revealed that ETS2 overexpression led to increased expression of Caspase-9, Bax, and Caspase-3, while Bcl-2 expression was decreased in Cal-62 and TPC-1 cells (Figs 6C–6E). These findings suggest that ETS2 overexpression promotes apoptosis in THCA cells by modulating the expression of key apoptotic regulators.
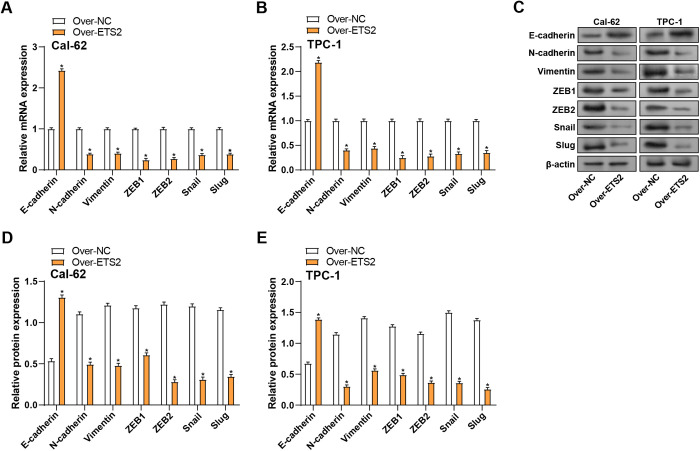
ETS2 overexpression regulates EMT marker expression in THCA cells
The EMT process enables cancer cells to acquire enhanced migratory and invasive capabilities. This study investigated the impact of ETS2 overexpression on the levels of proteins linked to EMT in THCA cells. qRT-PCR findings showed that ETS2 overexpression suppressed the mRNA expression of N-cadherin, Vimentin, ZEB1, ZEB2, Slug, and Snail and enhanced the mRNA expression of E-cadherin in comparison to the control group (Figs 7A, 7B). WB analysis corroborated these findings at the protein level (Figs 7C–7E). These results demonstrate that ETS2 overexpression can reverse the EMT process in THCA cells, suggesting a possible involvement in preventing progression and metastasis.
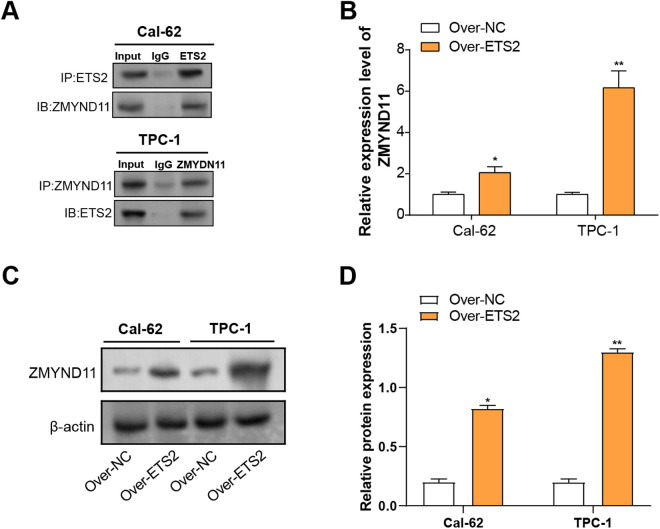
Validation of the interaction between ETS2 and ZMYND11 in THCA cells
To learn more about the connection between ETS2 and ZMYND11, Co-IP and expression analysis were performed. Co-IP results demonstrated that ZMYND11 interacts with ETS2 in the THCA cell lines (Fig 8A). Subsequent qRT-PCR analysis revealed that ETS2 overexpression significantly increased ZMYND11 mRNA levels in both cell lines, with a more pronounced effect observed in TPC-1 cells (Fig 8B). In line with the mRNA results, WB analysis verified a noteworthy rise in ZMYND11 protein levels following ETS2 overexpression in THCA cell lines (Figs 8C, 8D). These findings suggest that ETS2 positively regulates ZMYND11 expression in THCA cells.
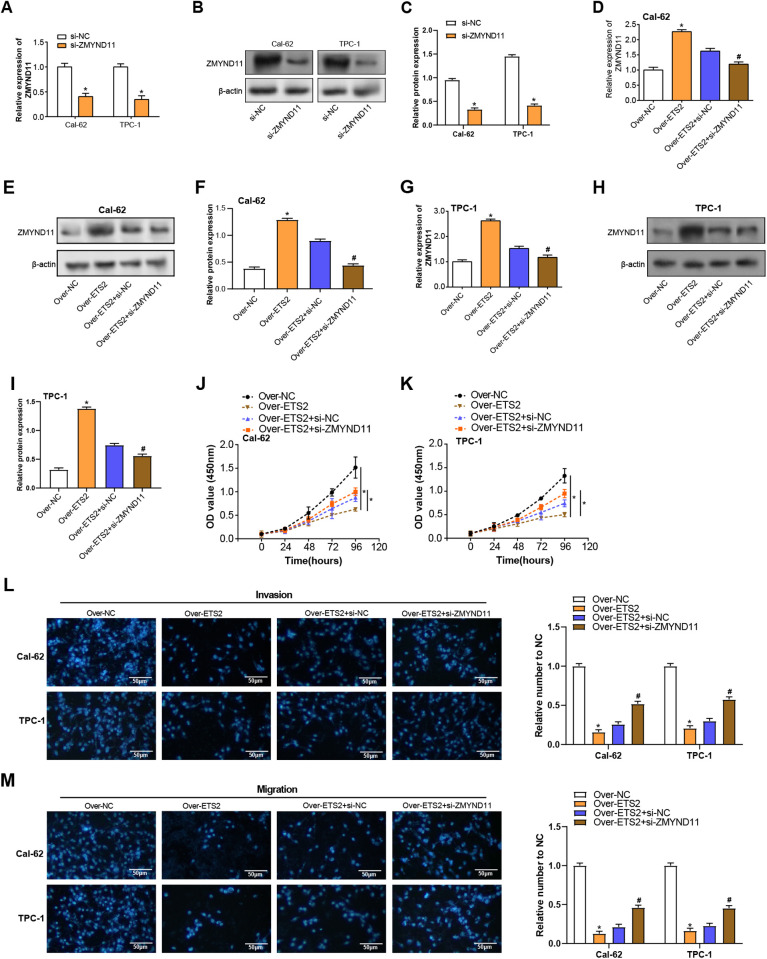
ZMYND11 knockdown attenuates the inhibitory effect of ETS2 overexpression on THCA cell behavior
To investigate the functional relationship between ETS2 and ZMYND11 in THCA cells, ZMYND11 knockdown was performed using siRNA in Cal-62 and TPC-1 cells. qRT-PCR and WB analysis confirmed that ZMYND11 mRNA and protein levels were greatly decreased after siRNA transfection in comparison to the control (Fig 9A–9C). Subsequent knockdown of ZMYND11 in ETS2-overexpressing cells caused ZMYND11 expression to significantly decline at the levels of proteins and Mrna (Fig 9D–9F). Functionally, the knockdown of ZMYND11 partially reversed the restraint of ETS2 overexpression on cell growth, as confirmed by the CCK-8 assay in both TPC-1 and Cal-62 cells (Fig 9J, 9K). Furthermore, Transwell assays indicated that the enhanced invasion and migration abilities observed in ETS2-overexpressing cells were significantly attenuated after ZMYND11 knockdown (Figs 9L, 9M). These results suggest that ZMYND11 mediates the way that ETS2 affects THCA cell invasion, migration, and proliferation, highlighting the functional interaction between these two genes.
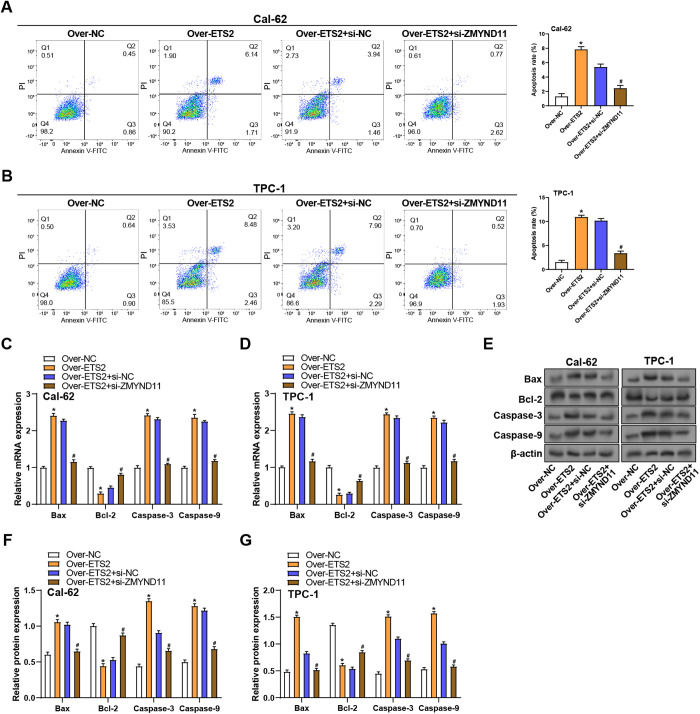
ZMYND11 knockdown reverses ETS2-mediated apoptosis in THCA cells
To discover the role of ZMYND11 in ETS2-induced apoptosis in THCA cells, flow cytometry and expression analysis of apoptosis-related genes were performed. Flow cytometry with Annexin V/PI staining demonstrated that ETS2 overexpression notably elevated apoptosis in TPC-1 and Cal-62 cells relative to the control group. However, ZMYND11 knockdown in ETS2-overexpressing cells markedly reduced the percentage of apoptotic cells (Figs 10A, 10B). Gene expression analysis by qRT-PCR showed that ETS2 overexpression led to a significant rise in pro-apoptotic genes and a decrease in the anti-apoptotic gene in Cal-62 and TPC-1 cells. Knockdown of ZMYND11 reversed these changes, restored Bcl-2 levels, and reduced the levels of pro-apoptotic genes (Figs 10C, 10D). WB analysis further confirmed these findings at the protein level, indicating that in ETS2-overexpressing cells, ZMYND11 knockdown decreased Caspase-9, Caspase-3, and Bax levels while raising Bcl-2 protein expression (Figs 10E, 10F, 10G). These findings imply that ZMYND11 is crucial for mediating the ETS2-induced apoptosis that occurs in THCA cells.
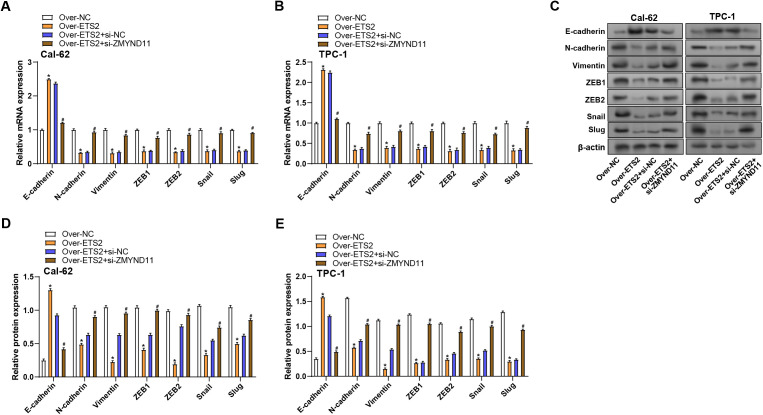
ZMYND11 knockdown reverses ETS2-induced EMT marker expression in THCA cells
We investigated the impacts of ETS2 overexpression and/or ZMYND11 knockdown on the expression levels of EMT-related proteins to learn more about whether ZMYND11 and ETS2 affect the EMT process in THCA cells. qRT-PCR results demonstrated that ETS2 overexpression markedly elevated the levels of E-cadherin while suppressing the levels of Vimentin, N-cadherin, ZEB1, ZEB2, Snail, and Slug in contrast to the group under control. On the other hand, ETS2 overexpression and ZMYND11 knockdown caused a decline in E-cadherin expression and a significant increase in Vimentin, N-cadherin, ZEB1, ZEB2, Snail, and Slug expression (Figs 11A, 11B). These results were further supported by WB analysis, which validated the observed changes at the protein level (Figs 11C–11E). Overall, these findings suggest that ETS2 is essential for controlling the EMT process, and its effects may be mediated through modulation of ZMYND11 expression.
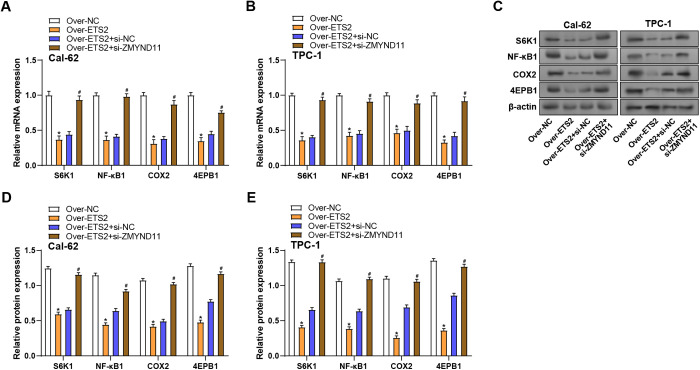
ZMYND11 knockdown regulates ETS2-mediated regulation of mTOR pathway-related genes
Finally, to explore the effect of ZMYND11 on ETS2-mediated regulation of genes linked to the mTOR pathway, we analyzed the expression levels of key signaling molecules in THCA cells. qRT-PCR analysis revealed that ETS2 overexpression significantly decreased the mRNA expression in both cell lines. However, the knockdown of ZMYND11 in ETS2-overexpressing cells reversed this effect, resulting in a notable rise in the levels of S6K1, NF-κB1, COX2, and 4EBP1 (Figs 12A, 12B). Similar to the mRNA results, this result was also confirmed at the protein level (Figs 12C–12E). These findings suggest that ZMYND11 is essential for controlling ETS2-mediated regulation of the mTOR signaling cascade in THCA cells.
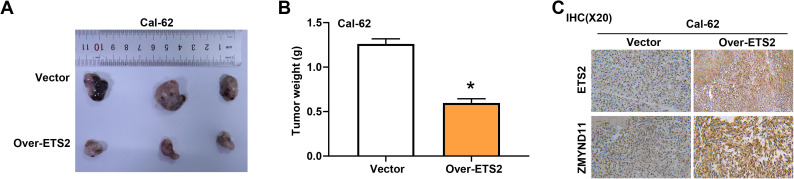
ETS2 overexpression suppresses tumor growth in vivo
To further validate the tumor-suppressive role of ETS2 in thyroid cancer, we established a mouse xenograft model using Cal-62 cells overexpressing ETS2 or a control vector. The results showed that, compared with the control group, tumors derived from the ETS2 overexpression group exhibited a significantly reduced weight, indicating that ETS2 inhibits tumor growth in vivo (Fig 13A, 13B). In addition, IHC staining was performed on xenograft tumor tissues to assess the expression of ETS2 and ZMYND11 (Fig 13C). The results revealed a marked increase in both ETS2 and ZMYND11 expression in the ETS2 overexpression group compared to the vector group. These findings are consistent with our in vitro data and suggest that ETS2 not only inhibits tumor growth but may also positively regulate ZMYND11 expression in thyroid cancer tissues.
Discussion
Previous investigations have identified the presence of senescent cells and cancer-associated fibroblasts (CAFs) in various thyroid cancer subtypes, including papillary, poorly differentiated, and anaplastic thyroid cancers [ref. 16]. These cells were found to coexist at the invasive edges of tumors, particularly in cases with BRAF mutations or BRAF-like molecular subtypes, correlating with local invasion [ref. 17]. In the present study, analysis of the TCGA-THCA dataset identified 61 DEGs associated with cellular senescence pathways, with ETS2 emerging as a key prognostic gene. ETS2, known for its dual role in regulating cell proliferation and apoptosis, was markedly downregulated in THCA, and lower expression of ETS2 was connected to poorer PFS and DFS. IHC analysis confirmed reduced ETS2 protein levels in THCA tissues in contrast to typical tissues, underscoring its capability to serve as a therapeutic target and biomarker. Additionally, previous research by Ren Y et al. highlighted distinct roles of ETS1 and ETS2 across cancers, with ETS1 involved in oxidative stress regulation and ETS2 in transcriptional control [ref. 18]. Thus, further investigation into the function of ETS2 in THCA could offer insightful information about therapy.
ETS2, a gene involved in cellular response and senescence, is a key factor in thyroid cancer progression [ref. 19]. A complicated relationship between ETS2 and several signaling pathways has been identified by recent investigations. For instance, Yin X. et al. demonstrated that elevated exosomal miR-663b in bladder cancer targets ETS2 inhibitors and promotes proliferation and EMT [ref. 20]. Similarly, Ichikawa MK. et al. highlighted the function of ETS2 in senescence, enhancing the levels of Snail and ZEB1/2 under TGF-β and Ras signaling [ref. 21]. EMT plays a crucial part in embryonic development, tissue regeneration, and cancer metastasis [ref. 22]. It is defined by the upregulation of mesenchymal markers like Vimentin and N-cadherin and the reduction of epithelial markers like E-cadherin. This process is regulated by transcription-related factors including Slug, Snail, ZEB2, and ZEB1. In THCA, EMT enhances invasiveness and metastasis, leading to a poor prognosis. Genes and pathways associated with EMT, including PI3K/AKT and MAPK/EMT, have been implicated in THCA progression [ref. 23]. Inhibition or reversal of EMT, for example by targeting the interaction of HER2 with the MAPK/EMT pathway, could provide a potential therapeutic strategy. EMT also supports the maintenance of stem cells for cancer, increasing tumor invasiveness and treatment refractoriness [ref. 24]. Our results demonstrate that ETS2 overexpression in THCA cells inhibits migration, proliferation, and invasion while enhancing apoptosis and regulating the levels of EMT-related markers. This highlights ETS2 as a possible therapeutic objective for THCA.
The results of this investigation underscore the significant regulatory roles of ETS2 and ZMYND11 in THCA and their impact on tumor progression. ZMYND11, characterized by its MYND domain, is crucial in protein-protein interactions and transcriptional regulation. In cancer, ZMYND11 modulates gene expression related to the cell cycle, differentiation, and apoptosis, influencing tumor growth [ref. 25]. For instance, Zhang Z. et al. identified that elevated microRNA-196b in ovarian cancer promotes cell proliferation, invasion, and migration by targeting ZMYND11, suggesting that its function can be modulated by specific microRNAs, with abnormal expression contributing to malignancy [ref. 26]. Additionally, Meng X. et al. demonstrated that USP53 interacts with ZMYND11 to enhance its deubiquitination and stability, inhibiting breast cancer cell proliferation and inducing apoptosis [ref. 27]. Recent studies also suggest that ETS1, another member of the ETS transcription factor family, may crosstalk with ETS2 in regulating ZMYND11 expression and its downstream effects [ref. 13]. ETS1 has been implicated in various cancers, including lung and breast cancer, where it cooperates with other transcription factors like ETS2 to influence gene expression related to cell invasion and metastasis [ref. 28]. The potential interaction between ETS1 and ZMYND11 in the context of THCA could provide a more complex regulatory mechanism underlying tumor progression. Our study confirms the direct interaction between ETS2 and ZMYND11 in THCA cells through Co-IP assay, showing that ZMYND11 knockdown can counteract the impacts of overexpressing ETS2 on invasion, proliferation, migration, apoptosis, and EMT. These findings emphasize the vital function of ETS2 in regulating these processes, mediated through its interaction with ZMYND11. Understanding the ETS2–ZMYND11 axis offers deeper insights into their collaborative role in thyroid cancer and suggests potential therapeutic targets for THCA management.
The mTOR pathway regulates essential cellular functions including proliferation, growth, metabolism, and survival, a crucial signaling network [ref. 29]. mTOR, a serine/threonine kinase, integrates environmental signals, including nutrients, oxygen, and energy status, to regulate cell behavior [ref. 30]. Earlier investigations have highlighted the function of mTOR in THCA. For example, Derwich A. et al. reviewed the expression of proteins and genes linked to mTOR in papillary thyroid carcinoma (PTC) and their association with disease risk and clinical outcomes [ref. 31]. Similarly, Lv J. et al. demonstrated that M2 tumor-associated macrophages (TAMs) promote the invasiveness and stemness of anaplastic thyroid carcinoma (ATC) cells by secreting IGF-1 and IGF-2, thereby activating the IR-A/IGF1R-mediated PI3K/AKT/mTOR signaling pathway [ref. 32]. mTORC1, a key part of the mTOR pathway, promotes protein synthesis by activating S6K1 and inhibiting eukaryotic translation initiation factor 4E-BP1 [ref. 33]. Additionally, the mTOR pathway can modulate NF-κB1 activity and influence COX2 expression, contributing to inflammation and cancer progression [ref. 34]. Our research examined the functions of ETS2 and ZMYND11 in modulating the mTOR signaling pathway in THCA cells. Our findings indicate that ETS2 overexpression significantly reduces the expression levels of S6K1, NF-κB1, COX2, and 4E-BP1. However, when ETS2 overexpression is combined with ZMYND11 knockdown, the expression levels of these mTOR pathway components are restored. This suggests that the regulatory impact of ETS2 on the mTOR pathway is mediated through its interaction with ZMYND11. These results highlight the complex interplay between ETS2, ZMYND11, and the mTOR signaling pathway in THCA cells, providing novel perspectives into potential pathways of THCA development and therapeutic targets.
In our study, while we have made significant progress in understanding the roles of ETS2 and ZMYND11 in thyroid cancer, we must acknowledge that our research has certain limitations. Firstly, a notable limitation of our study is the absence of in vivo validation using thyroid cancer animal models. Secondly, our investigation into the specific mechanisms by which ETS2 and ZMYND11 regulate the mTOR signaling pathway, while suggestive, lacks depth. The precise molecular interactions and downstream effects require further elucidation. Thirdly, our analysis of the correlation between ETS2 and ZMYND11 expression and patient prognosis, although indicative, is limited by a relatively small sample size. This restricts the generalizability of our conclusions. Lastly, our study did not yield breakthrough findings in terms of novel mechanisms. The field is in need of innovative discoveries that can significantly advance our understanding of THCA pathogenesis. In summary, while our study provides a comprehensive analysis of ETS2 and ZMYND11 in THCA, it is essential to address these limitations through future research that incorporates in vivo models, advanced molecular techniques, larger sample sizes, and a focus on uncovering novel mechanisms. This will lead to a more profound understanding of THCA and potentially identify new therapeutic strategies.
Conclusion
This study shows that the cellular senescence-related gene ETS2 has a major function in controlling cell proliferation, apoptosis, and EMT in THCA. Overexpression of ETS2 inhibits the growth, invasion, and migration of THCA cells while promoting apoptosis. The interaction between ETS2 and ZMYND11, and knockdown of ZMYND11 reverses these effects, restoring key components of the mTOR pathway and EMT markers. These results emphasize the significance of the ETS2–ZMYND11 axis in cellular senescence and thyroid cancer progression, underscoring its possible use as a THCA treatment target.
Supplementary Materials
References
- Y Wang, J Yang, S Chen, W Wang, L Teng. Identification and Validation of a Prognostic Signature for Thyroid Cancer Based on Ferroptosis-Related Genes.. Genes (Basel)., 2022. [DOI | PubMed]
- AK Lam. Papillary thyroid carcinoma: current position in epidemiology, genomics, and classification.. Papillary Thyroid Carcinoma: Methods and Protocols., 2022
- B Han, R Zheng, H Zeng, S Wang, K Sun, R Chen. Cancer incidence and mortality in China, 2022.. J Natl Cancer Cent., 2024. [DOI | PubMed]
- J Wang, F Yu, Y Shang, Z Ping, L Liu. Thyroid cancer: incidence and mortality trends in China, 2005–2015.. Endocrine., 2020. [PubMed]
- F Nabhan, PH Dedhia, MD Ringel. Thyroid cancer, recent advances in diagnosis and therapy.. Int J Cancer., 2021. [DOI | PubMed]
- Z Dong, Y Luo, Z Yuan, Y Tian, T Jin, F Xu. Cellular senescence and SASP in tumor progression and therapeutic opportunities.. Mol Cancer., 2024. [DOI | PubMed]
- K Hong, K Cen, Q Chen, Y Dai, Y Mai, Y Guo. Identification and validation of a novel senescence-related biomarker for thyroid cancer to predict the prognosis and immunotherapy.. Front Immunol., 2023. [DOI | PubMed]
- L-Y Zhang, Y Tan, X-J Luo, J-F Wu, Y-R Ni. The roles of ETS transcription factors in liver fibrosis.. Hum Cell., 2023. [DOI | PubMed]
- H Wang, R Huang, W Guo, X Qin, Z Yang, Z Yuan. RNA-binding protein CELF1 enhances cell migration, invasion, and chemoresistance by targeting ETS2 in colorectal cancer.. Clin Sci (Lond)., 2020. [DOI | PubMed]
- L Du, Y Liu, C Li, J Deng, Y Sang. The interaction between ETS transcription factor family members and microRNAs: A novel approach to cancer therapy.. Biomed Pharmacother., 2022. [DOI | PubMed]
- J Xiang, J Shen, L Zhang, B Tang. Identification and validation of senescence-related genes in circulating endothelial cells of patients with acute myocardial infarction.. Front Cardiovasc Med., 2022. [DOI | PubMed]
- L Wu, J Huang, P Trivedi, X Sun, H Yu, Z He. Zinc finger myeloid Nervy DEAF-1 type (ZMYND) domain containing proteins exert molecular interactions to implicate in carcinogenesis.. Discov Oncol., 2022. [DOI | PubMed]
- JP Plotnik, PC Hollenhorst. Interaction with ZMYND11 mediates opposing roles of Ras-responsive transcription factors ETS1 and ETS2.. Nucleic Acids Res., 2017. [DOI | PubMed]
- G Wei, AE Schaffner, KM Baker, KC Mansky, MC Ostrowski. Ets-2 interacts with co-repressor BS69 to repress target gene expression.. Anticancer Res., 2003. [PubMed]
- CEM Thornton, J Hao, PP Tamarapu, I Landa. Multiple ETS Factors Participate in the Transcriptional Control of TERT Mutant Promoter in Thyroid Cancers.. Cancers (Basel)., 2022. [DOI | PubMed]
- E Minna, S Brich, K Todoerti, S Pilotti, P Collini, E Bonaldi. Cancer Associated Fibroblasts and Senescent Thyroid Cells in the Invasive Front of Thyroid Carcinoma.. Cancers (Basel)., 2020. [DOI | PubMed]
- P Soares, AA Póvoa, M Melo, J Vinagre, V Máximo, C Eloy. Molecular Pathology of Non-familial Follicular Epithelial-Derived Thyroid Cancer in Adults: From RAS/BRAF-like Tumor Designations to Molecular Risk Stratification.. Endocr Pathol., 2021. [DOI | PubMed]
- Y Ren, B Chen, M Zhang. Distinct Prognostic and Immunological Roles of ETS1 and ETS2: A Pan-Cancer Analysis.. Biomed Res Int., 2023. [DOI | PubMed]
- Y Wang, Z Huang, M Sun, W Huang, L Xia. ETS transcription factors: Multifaceted players from cancer progression to tumor immunity.. Biochim Biophys Acta Rev Cancer., 2023. [DOI | PubMed]
- X Yin, X Zheng, M Liu, D Wang, H Sun, Y Qiu. Exosomal miR-663b targets Ets2-repressor factor to promote proliferation and the epithelial-mesenchymal transition of bladder cancer cells.. Cell Biol Int., 2020. [DOI | PubMed]
- MK Ichikawa, K Endo, Y Itoh, AH Osada, Y Kimura, K Ueki. Ets family proteins regulate the EMT transcription factors Snail and ZEB in cancer cells.. FEBS Open Bio., 2022. [DOI | PubMed]
- E Nowak, I Bednarek. Aspects of the Epigenetic Regulation of EMT Related to Cancer Metastasis.. Cells., 2021. [DOI | PubMed]
- V Veschi, A Turdo, C Modica, F Verona, S Di Franco, M Gaggianesi. Recapitulating thyroid cancer histotypes through engineering embryonic stem cells.. Nat Commun., 2023. [DOI | PubMed]
- D Greaves, Y Calle. Epithelial Mesenchymal Transition (EMT) and Associated Invasive Adhesions in Solid and Haematological Tumours.. Cells., 2022. [DOI | PubMed]
- X Wang, H Feng, W Dong, F Wang, G Zhang, J Wu. Hsa_circ_0008225 inhibits tumorigenesis of glioma via sponging miR-890 and promoting ZMYND11 expression.. J Pharmacol Sci., 2020. [DOI | PubMed]
- Z Zhang, L Xu, Z Hu, B Yang, J Xu. MicroRNA-196b promotes cell growth and metastasis of ovarian cancer by targeting ZMYND11.. Minerva Med., 2022. [DOI | PubMed]
- X Meng, H Chen, Z Tan, W Yan, Y Liu, J Lv. USP53 Affects the Proliferation and Apoptosis of Breast Cancer Cells by Regulating the Ubiquitination Level of ZMYND11.. Biol Proced Online., 2024. [DOI | PubMed]
- Y Ren, B Chen, M Zhang. Distinct Prognostic and Immunological Roles of ETS1 and ETS2: A Pan-Cancer Analysis.. Biomed Res Int., 2023. [DOI | PubMed]
- NV Popova, M Jücker. The Role of mTOR Signaling as a Therapeutic Target in Cancer.. Int J Mol Sci., 2021. [DOI | PubMed]
- GY Liu, DM Sabatini. mTOR at the nexus of nutrition, growth, ageing and disease.. Nat Rev Mol Cell Biol., 2020. [DOI | PubMed]
- A Derwich, M Sykutera, B Bromińska, M Andrusiewicz, M Ruchała, N Sawicka-Gutaj. Clinical Implications of mTOR Expression in Papillary Thyroid Cancer-A Systematic Review.. Cancers (Basel)., 2023. [DOI | PubMed]
- J Lv, C Liu, F-K Chen, Z-P Feng, L Jia, P-J Liu. M2‑like tumour‑associated macrophage‑secreted IGF promotes thyroid cancer stemness and metastasis by activating the PI3K/AKT/mTOR pathway.. Mol Med Rep., 2021. [DOI | PubMed]
- C Maracci, S Motta, A Romagnoli, M Costantino, P Perego, D Di Marino. The mTOR/4E-BP1/eIF4E Signalling Pathway as a Source of Cancer Drug Targets.. Curr Med Chem., 2022. [DOI | PubMed]
- X Li, D Shang, H Shen, J Song, G Hao, Y Tian. ZSCAN16 promotes proliferation, migration and invasion of bladder cancer via regulating NF-kB, AKT, mTOR, P38 and other genes.. Biomed Pharmacother., 2020. [DOI | PubMed]