Diagnostic Accuracy of Magnetic Resonance Imaging Measures of Brain Atrophy Across the Spectrum of Progressive Supranuclear Palsy and Corticobasal Degeneration
Abstract
Question:
Can widely available atrophy measures on magnetic resonance imaging (MRI) increase diagnostic accuracy of progressive supranuclear palsy (PSP) and corticobasal degeneration (CBD)?
Findings:
In this diagnostic study of 326 participants, different methods for quantifying cerebral atrophy on MRI at first diagnosis were applied. The combination of cortical and subcortical measures of atrophy had excellent diagnostic accuracy for the differentiation between PSP, CBD, and other pathologies, even in the subgroup of participants who did not have a movement disorder at diagnosis.
Meaning:
These findings suggest that structural MRI could be used to increase diagnostic certainty of underlying PSP and CBD in diverse clinically relevant scenarios.
Affiliations: Sant Pau Memory Unit, Department of Neurology, Hospital de la Santa Creu i Sant Pau, Biomedical Research Institute Sant Pau, Universitat Autònoma de Barcelona, Barcelona, Spain; Atlantic Fellow for Equity in Brain Health at the University of California, San Francisco, Department of Neurology, University of California, San Francisco; Centro de Investigación en Red-Enfermedades Neurodegenerativas (CIBERNED), Madrid, Spain; Center for Neurodegenerative Diseases and the Aging Brain, Department of Clinical Research in Neurology, University of Bari Aldo Moro, Pia Fondazione Cardinale G. Panico, Tricase, Lecce, Italy; Institute of Nanotechnology, National Research Council, Lecce, Italy; Memory and Aging Center, Department of Neurology, University of California, San Francisco; Parkinson’s Disease & Movement Disorders Unit, Hospital Clínic, Instituto de Investigaciones Biomédicas August Pi i Sunyer, CIBERNED, European Reference Network for Rare Neurological Diseases, Institut de Neurociències, Universitat de Barcelona, Catalonia, Spain; Movement Disorders Unit, Sant Pau Hospital and Biomedical Research Institute, Barcelona, Spain; Universitat Autònoma de Barcelona, Barcelona, Spain; Department of Basic Medicine, Neuroscience, and Sense Organs, University of Bari Aldo Moro, Bari, Italy; Department of Medical and Surgical Sciences, Institute of Neurology, Magna Graecia University, Catanzaro, Italy; Neuroimaging Research Unit, Institute of Molecular Bioimaging and Physiology, National Research Council, Catanzaro, Italy
License: Copyright 2022 Illán-Gala I et al. JAMA Network Open. CC BY 4.0 This is an open access article distributed under the terms of the CC-BY License.
Article links: DOI: 10.1001/jamanetworkopen.2022.9588 | PubMed: 35486397 | PMC: PMC9055455
Relevance: Relevant: mentioned in keywords or abstract
Full text: PDF (10.2 MB)
Introduction
Four-repeat tauopathies (4RT) are neuropathologically defined by the morphologic appearance and anatomical distribution of 4-repeat tau aggregates.1,2 Progressive supranuclear palsy (PSP) and corticobasal degeneration (CBD) are the 2 most common 4RT, and they represent frequent forms of late-onset frontotemporal lobar degeneration (FTLD).3,4 Similar to other FTLD subtypes, PSP and CBD show partially overlapping patterns of cortical neurodegeneration, mainly involving the superior frontal and perirolandic cortices.5,6 Unlike other causes of FTLD, 4RT are characterized by more severe subcortical neurodegeneration and variable cortical involvement.7
Historically, PSP and CBD have been labeled atypical parkinsonian syndromes because seminal descriptions emphasized motor features, such as akinesia, dystonia, or ocular motor abnormalities, with minimal responsiveness to levodopa therapy in most patients.8,9 However, over the last decades, 4RT have been associated with a wide range of phenotypes,10,11,12,13 including nonfluent variant primary progressive aphasia (nfvPPA), behavioral variant frontotemporal dementia (bvFTD), and an amnestic syndrome resembling Alzheimer dementia (AD).14,15,16
There are no effective treatments against 4RT, but increasing numbers of disease-modifying treatments are being tested.17 A barrier to successful 4RT trials is the lack of diagnostic biomarkers to select patients and measure treatment effects.18,19 Imaging biomarkers, particularly magnetic resonance imaging (MRI)–based biomarkers, have shown promise,20 but objective and reproducible measurements of atrophy are lacking. The recent Movement Disorders Society PSP Diagnostic Criteria update faced the challenge of insufficient evidence supporting the inclusion of neuroimaging biomarkers.18,21 The magnetic resonance parkinsonism index (MRPI) allows the quantification of midbrain and superior cerebellar peduncle atrophy, and provides excellent differentiation between PSP–Richardson syndrome (PSP-RS) and Parkinson disease (PD).22 In addition, other MRI-based measurements, such as cortical thickness and brainstem segmentations, have also shown promise for the diagnosis of 4RT,23,24 but their specific value for diagnosing PSP and CBD among their full spectrum of clinical presentations is unknown.
In this autopsy-confirmed study, we compared the diagnostic accuracy of antemortem MRPI and other cortical and subcortical MRI measures to differentiate among PSP, CBD, and other pathologies. We hypothesized that the combination of cortical and subcortical measures would outperform the MRPI alone and allow for improved discrimination among PSP, CBD, and other pathologies.
Methods
Participant Selection and Neuropathological Diagnosis
We searched the University of California, San Francisco, Memory and Aging Center (UCSF MAC) database for all patients with at least 1 MRI study (N = 4479). We excluded 4133 participants without a neuropathological diagnosis or with low-quality MRI. In patients with multiple MRI studies, we selected the first study suitable for analysis regardless of the diagnosis at MRI. This search identified a consecutive series of 326 participants with an MRI suitable for analysis and neuropathological data spanning all major neuropathological diagnoses: AD, PD, PD with Lewy body dementia, FTLD, and cerebrovascular disease. FTLD cases were further classified based on the consensus nomenclature for FTLD.25,26,27 Brain autopsies were performed at different brain banks following previously published methods.16 For the aims of this study, 3 main groups of interest were defined: PSP (68 participants), CBD (44 participants), and other pathologies (214 participants, including all other pathologies). Group details are shown in Table 1.
Table 1. : Characteristics of the Sample
| Characteristics | Participants, No. (%) | |||
|---|---|---|---|---|
| 4RT | Other pathologies (n = 214) | |||
| PSP (n = 68) | CBD (n = 44) | Combined (n = 112) | ||
| Age at symptom onset, mean (SD), y | 64.1 (6.98)zoi220292t1n1 | 60.0 (7)zoi220292t1n2 | 62.5 (7)zoi220292t1n3 | 57.1 (9)zoi220292t1n2,zoi220292t1n4 |
| Age at MRI, mean (SD), y | 69.5 (5)zoi220292t1n1 | 64.2 (6)zoi220292t1n2 | 67.4 (6)zoi220292t1n3 | 62.4 (8)zoi220292t1n2,zoi220292t1n4 |
| Years of education, mean (SD) | 16.2 (3) | 16.1 (2) | 16.2 (3) | 16.2 (2) |
| Biological sex | ||||
| Men | 32 (47.1) | 19 (43.2) | 51 (45.5)zoi220292t1n3 | 125 (58.4)zoi220292t1n4 |
| Women | 36 (52.9) | 25 (56.8) | 61 (54.5)zoi220292t1n3 | 89 (41.6)zoi220292t1n4 |
| Diagnosis at MRI | ||||
| PSP-RS | 43 (63.2)zoi220292t1n1 | 3 (6.8)zoi220292t1n2 | 46 (41.1)zoi220292t1n3 | 3 (1.4)zoi220292t1n2,zoi220292t1n4 |
| CBS | 11 (16.2) | 12 (27.3)zoi220292t1n3 | 23 (20.5) | 22 (10.3)zoi220292t1n5 |
| PSP-RS or CBS | 54 (79.4)zoi220292t1n1 | 15 (34.1)zoi220292t1n6 | 69 (61.6)zoi220292t1n3 | 25 (11.7)zoi220292t1n4,zoi220292t1n7 |
| MMSE, mean (SD)zoi220292t1n8 | 25.5 (4.81)zoi220292t1n3 | 24.0 (6.24) | 24.9 (5.44)zoi220292t1n3 | 22.6 (7.00)zoi220292t1n2,zoi220292t1n4 |
| Years from MRI to death, mean (SD) | 3.69 (2.01)zoi220292t1n1 | 3.25 (1.62)zoi220292t1n2 | 3.52 (1.87)zoi220292t1n3 | 4.82 (3.27)zoi220292t1n2,zoi220292t1n4 |
| Primary neuropathological diagnosis | ||||
| PSP | 68 (100) | 0 | 68 (60.7) | 0 |
| CBD | 0 | 44 (100) | 44 (39.3) | 0 |
| Pick disease | 0 | 0 | 0 | 26 (12.1) |
| FTLD-TDP | ||||
| Type A | 0 | 0 | 0 | 26 (12.1) |
| Type B | 0 | 0 | 0 | 34 (15.9) |
| Type C | 0 | 0 | 0 | 26 (12.1) |
| MND-TDP | 0 | 0 | 0 | 11 (5.1) |
| Other FTLD | 0 | 0 | 0 | 32 (15.0) |
| AD | 0 | 0 | 0 | 45 (21.0) |
| PD, LBD, MSA | 0 | 0 | 0 | 11 (5.1) |
| Other | 0 | 0 | 0 | 3 (1.4) |
P < .05 compared with CBD and other pathologies.
P < .05 compared with PSP.
P < .05 compared with other pathologies.
P < .05 compared with combined 4RT.
P < .05 compared with CBD.
P < .05 compared with PSP and other pathologies.
P < .05 compared with PSP and CBD.
MMSE data was available in 307 participants (94%).
Abbreviations: 4RT, four-repeat tau isoform tauopathies; AD, Alzheimer disease; CBD, corticobasal disease; CBS, corticobasal syndrome; FTLD, frontotemporal lobar degeneration; LBD, Lewy body dementia; MMSE, Mini-Mental State Examination; MND, motor neuron disease; MRI, magnetic resonance image; MSA, multiple-system atrophy; PD, Parkinson disease; PSP, progressive supranuclear palsy; PSP-RS, progressive supranuclear palsy with Richardson syndrome; TDP, TAR DNA binding protein 43.
This study followed the Standards for Reporting Diagnostic Accuracy (STARD) reporting guideline. The study was approved by the UCSF institutional review board and was conducted following the Declaration of Helsinki,28 and written informed consent was obtained from all participants.
Clinical Evaluation
Data were collected from October 27, 1994, to September 29, 2019. All participants included in the autopsy cohort had been clinically evaluated at the moment of MRI acquisition and received a clinical diagnosis based on patient and informant interviews, neurologic examination, and neuropsychological testing.29 The primary clinical syndrome at MRI was prospectively recorded, and patients were classified as PSP-RS or probable corticobasal syndrome (CBS) following previously established criteria.12,30 We also recorded the estimated age at symptom onset, sex, years of education, age at MRI, Mini-Mental State Examination score at the moment of MRI acquisition, and the last clinical diagnosis in participants with more than 1 visit.
Structural MRI Acquisition and Brain Atrophy Measures
The images were acquired on 4 different MRI scans using different imaging protocols. Details on brain MRI acquisition are presented in the eMethods in the Supplement.
Statistical Analysis
Data were analyzed from March 1 to September 14, 2021. Between-group differences in demographic variables were assessed using Mann-Whitney U or Kruskal-Wallis test for continuous variables and Fisher exact test for categorical data. Correlations between MRPI measures and Freesurfer segmentation–related measures of brainstem atrophy were determined with Pearson coefficients with bootstrapping-based 95% CIs.
We followed a data-driven approach to select a set of cortical and subcortical regional composites that would maximize the capacity for identifying patients with PSP and/or CBD regardless of phenotype. We defined 4 comparisons of interest: (1) PSP and other pathologies (including CBD), (2) CBD and other pathologies (including PSP); (3) 4RT (either PSP or CBD) and other pathologies; and (4) PSP and CBD (considering a clinical scenario with increased certainty of 4RT). First, we regressed out the potential confounders age, sex, total intracranial volume, and MRI scan based on an underlying fitting of regressions models. Next, Cohen d effect sizes were calculated using the resulting residuals for each of the 4 comparisons of interest. In a second step, we used multinomial logistic regression models (MLRM) to determine the diagnostic value of combining cortical and subcortical measures of atrophy to discriminate PSP, CBD, and other pathologies. Because of the large number of neuroimaging measures and to reduce the number of factors in MLRM, we only considered neuroimaging measures with at least a moderate effect size (as defined by absolute Cohen d > 0.5). We defined 2 different MLRM combining cortical and subcortical measures: one considering MRPI-derived brainstem areas (MLRM-BA) and another considering Freesurfer-derived brainstem volumes (MLRM-BV). In each MLRM, we entered age, sex, and all atrophy measures with at least a moderate effect size. We included age and sex as independent factors in each MLRM, because these variables showed statistically significant differences between the groups of interest. Finally, backward stepwise regression was used to select a unique set of cortical and subcortical regions for each MLRM. In addition, to ensure that the MLRM validated in this study could be tested in other samples, we tested additional MLRMs including raw neuroimaging measures (ie, without regressing out the potential confounders age, sex, total intracranial volume [TIV], and MRI scan). Of note, the accuracy of MLRM including unadjusted neuroimaging measures was very similar to MLRM including age-, sex-, TIV- and MRI-adjusted neuroimaging measures (eFigures 10-13 in the Supplement).
Receiver operating characteristic (ROC) curve analyses determined the diagnostic accuracy of clinical and neuroimaging measures and MLRM combining cortical and subcortical atrophy measures. To determine the diagnostic accuracy of each MLRM, we entered their estimated probabilities in ROC analyses. We calculated areas under the curve (AUROC) with 95% CIs, and we compared ROC curves with a nonparametric test that accounts for the correlation of the curves (DeLong test).31 Robust cutoffs maximizing the Youden index and their corresponding accuracy, sensitivity, and specificity were determined with stratified bootstrapping of 1000 samples, as implemented in the cutpointr package.32 The accuracy of MLRM was further validated following 5-fold cross-validation. To explore whether the diagnostic utility of neuroimaging measures and MLRM could be affected by baseline clinical characteristics, we examined ROC curves in subgroups of participants with and without a clinical diagnosis of PSP-RS or CBS.
All analyses and figures were performed using R statistical software version 4.1.1 (R Project for Statistical Computing; packages tidyverse, ggplot2, ggseg, ggstatsplot, effectsize, car, pROC, caret, nnet, cutpointr). Statistical significance for all tests was set at 5% (α = .05), all statistical tests were 2 sided, and all P values were corrected for multiple comparisons (Bonferroni).
Results
Baseline Characteristics of the Sample
Baseline characteristics of the 326 included participants are shown in Table 1. The mean (SD) age was 64.1 (8.0) years, and 176 participants (54%) were male. At the time of MRI, a diagnosis of PSP-RS was most common in the PSP group (43 of 68 [63%]), whereas a diagnosis of CBS was most common in the CBD group (12 of 44 [27%]). The 2 most common clinical diagnoses in the other pathologies group were bvFTD (97 [45%]) and CBS (22 [10%]). Overall, 43 participants with a definitive diagnosis of 4RT (48%) did not present with PSP-RS or probable CBS. Details on the predominant clinical phenotype at MRI and the last diagnosis during follow-up for each group can be found in eTable 1 in the Supplement.
Correlations Between Brainstem Measures of Atrophy
Brainstem measurement obtained for the calculation of MRPI and their counterparts obtained with Freesurfer were highly correlated (eFigures 1-4 in the Supplement).
Group Comparison of Measures of Brainstem Atrophy
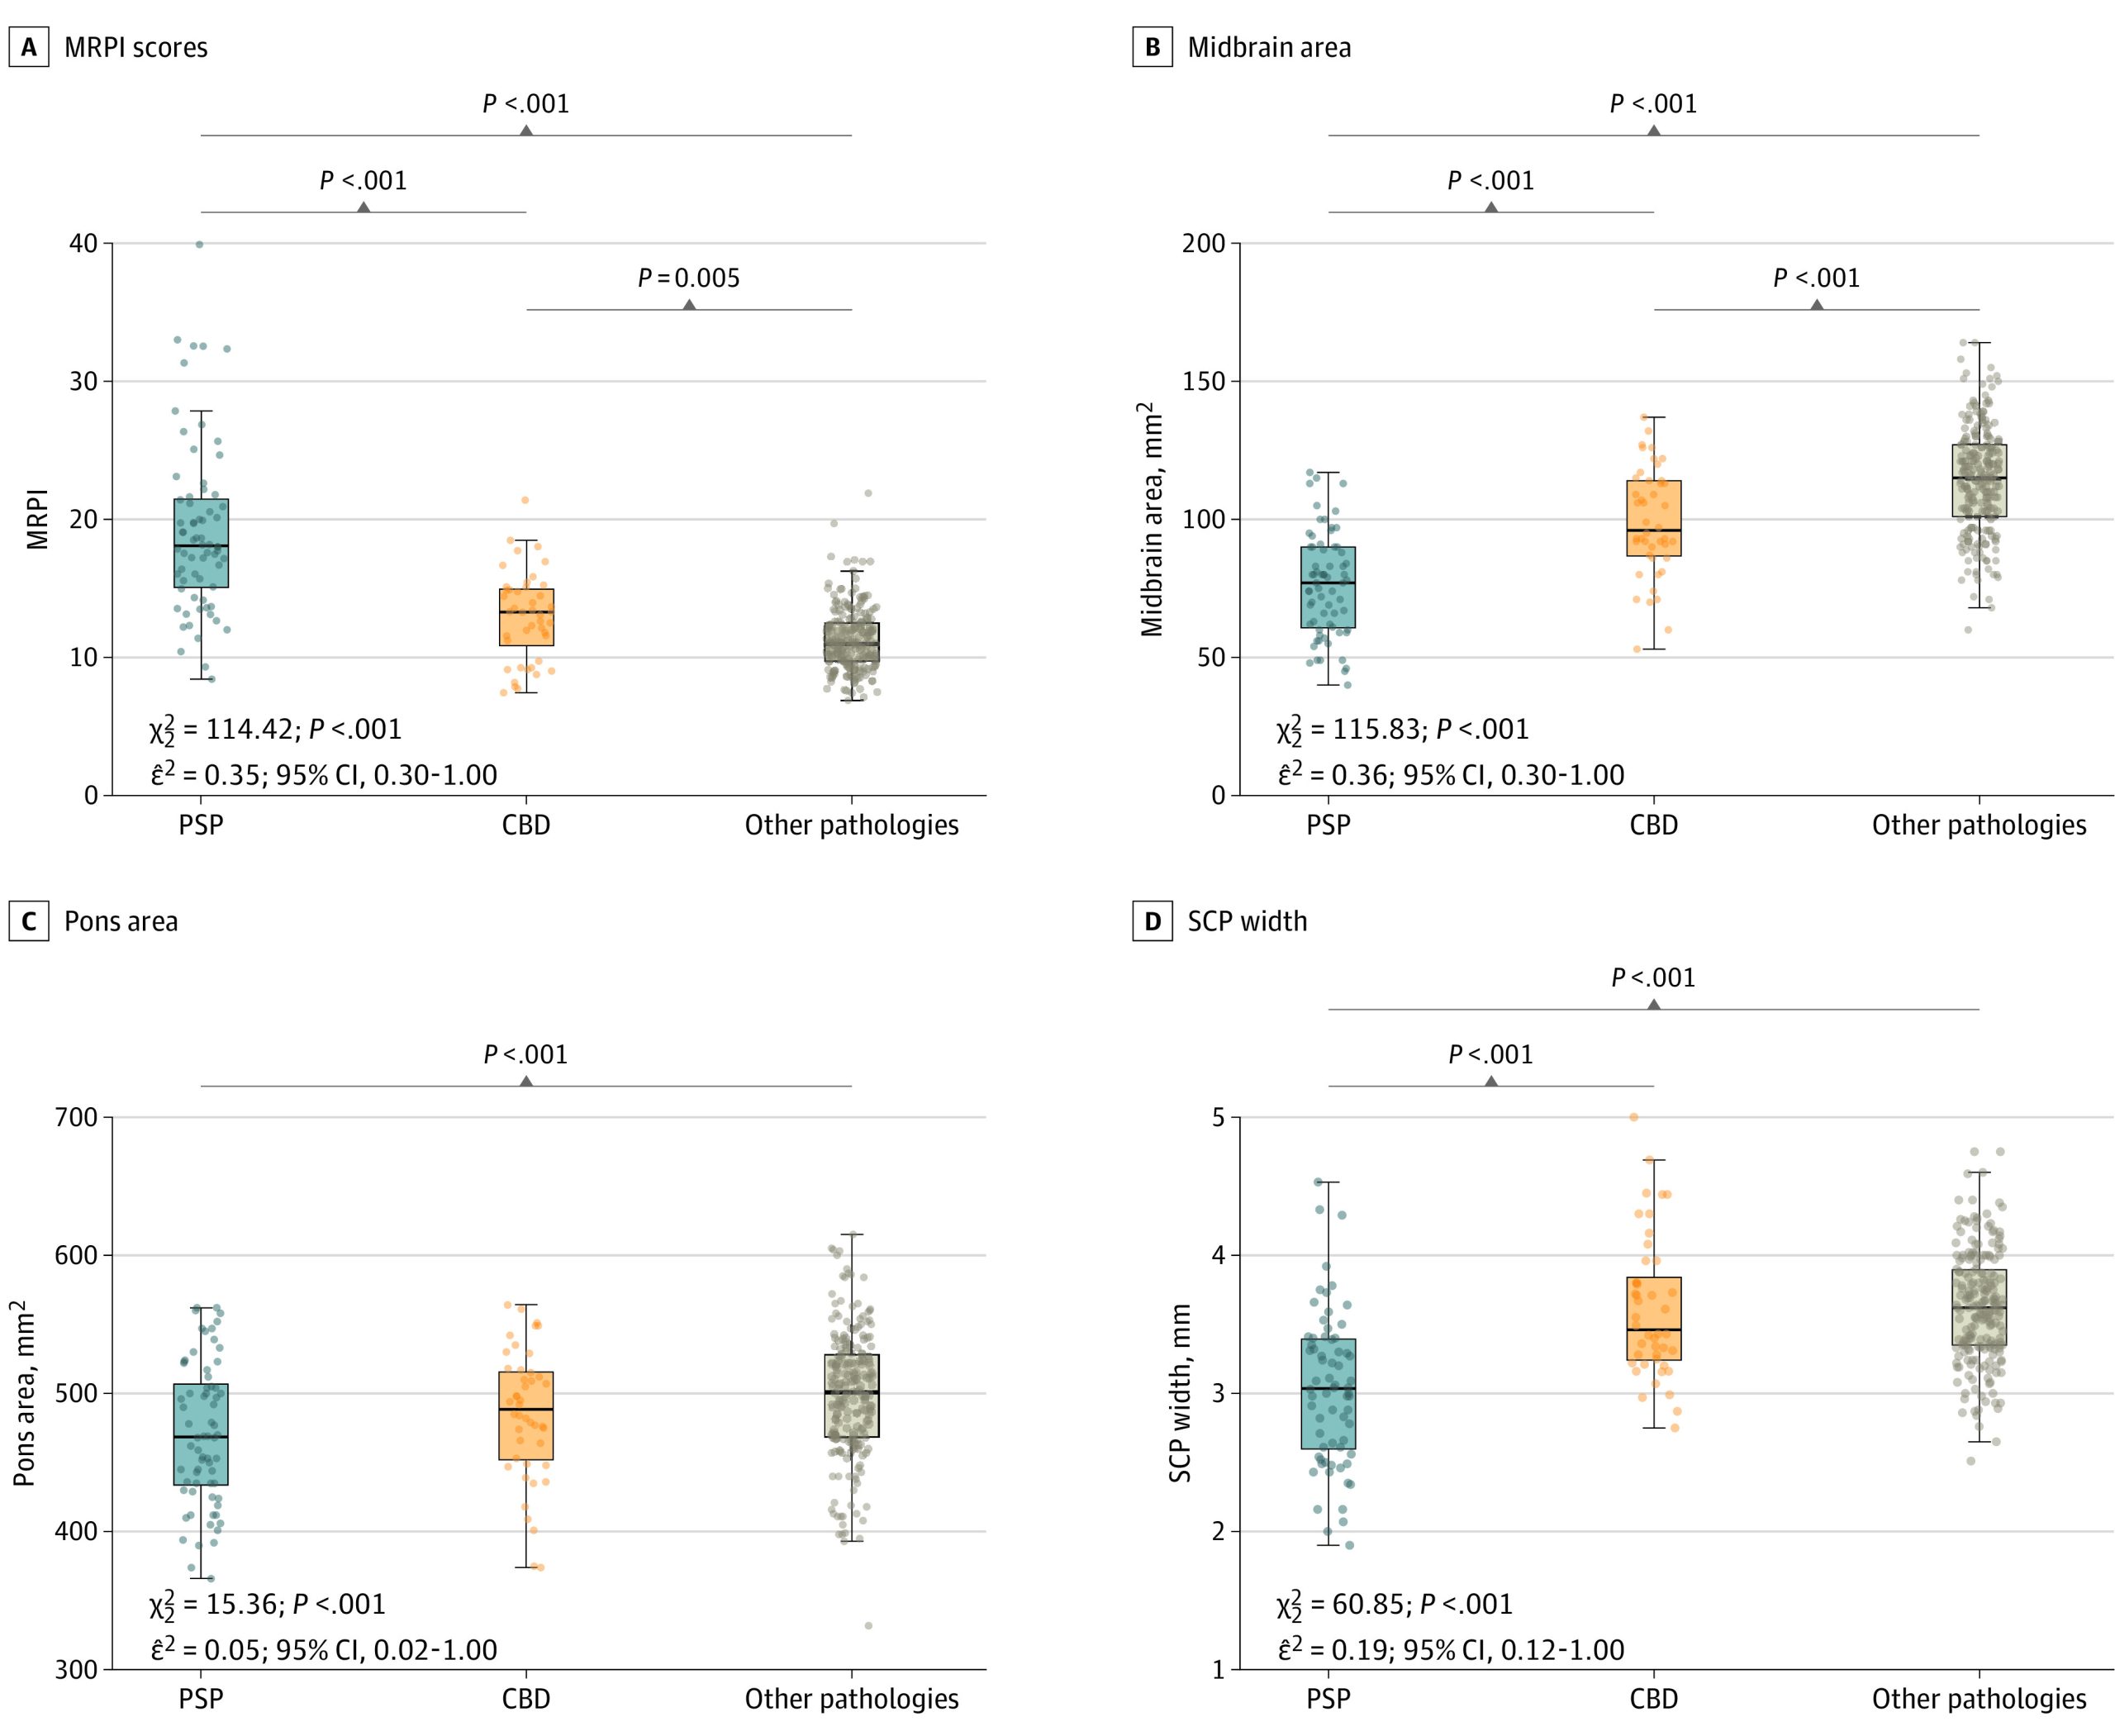
As shown in Figure 1 and eTable 2 in the Supplement, we observed a gradient of MRPI and midsagittal midbrain area across PSP, CBD, and other pathologies. PSP had the smallest values, followed by CBD. Other pathologies had larger values than both PSP and CBD. For example, for the midsagittal midbrain area, the mean (SD) volumes were 76.1 (19.0) mm2 for PSP, 99.0 (20.0) mm2 for CBD, and 114.0 (20.0) mm2 for other pathologies. Similar group differences were observed when comparing the brainstem volumes obtained with Freesurfer segmentation in equivalent regions (eFigure 5 in the Supplement). Brainstem measures of atrophy were also similar within neuropathological subgroups included in the other pathologies group (eFigure 6 and eFigure 7 in the Supplement) and between participants presenting with PSP-RS or CBS and the subgroup of participants with other clinical presentations (eFigure 8 and eFigure 9 in the Supplement).
Effect Sizes of Measures of Atrophy for the Discrimination Between Groups
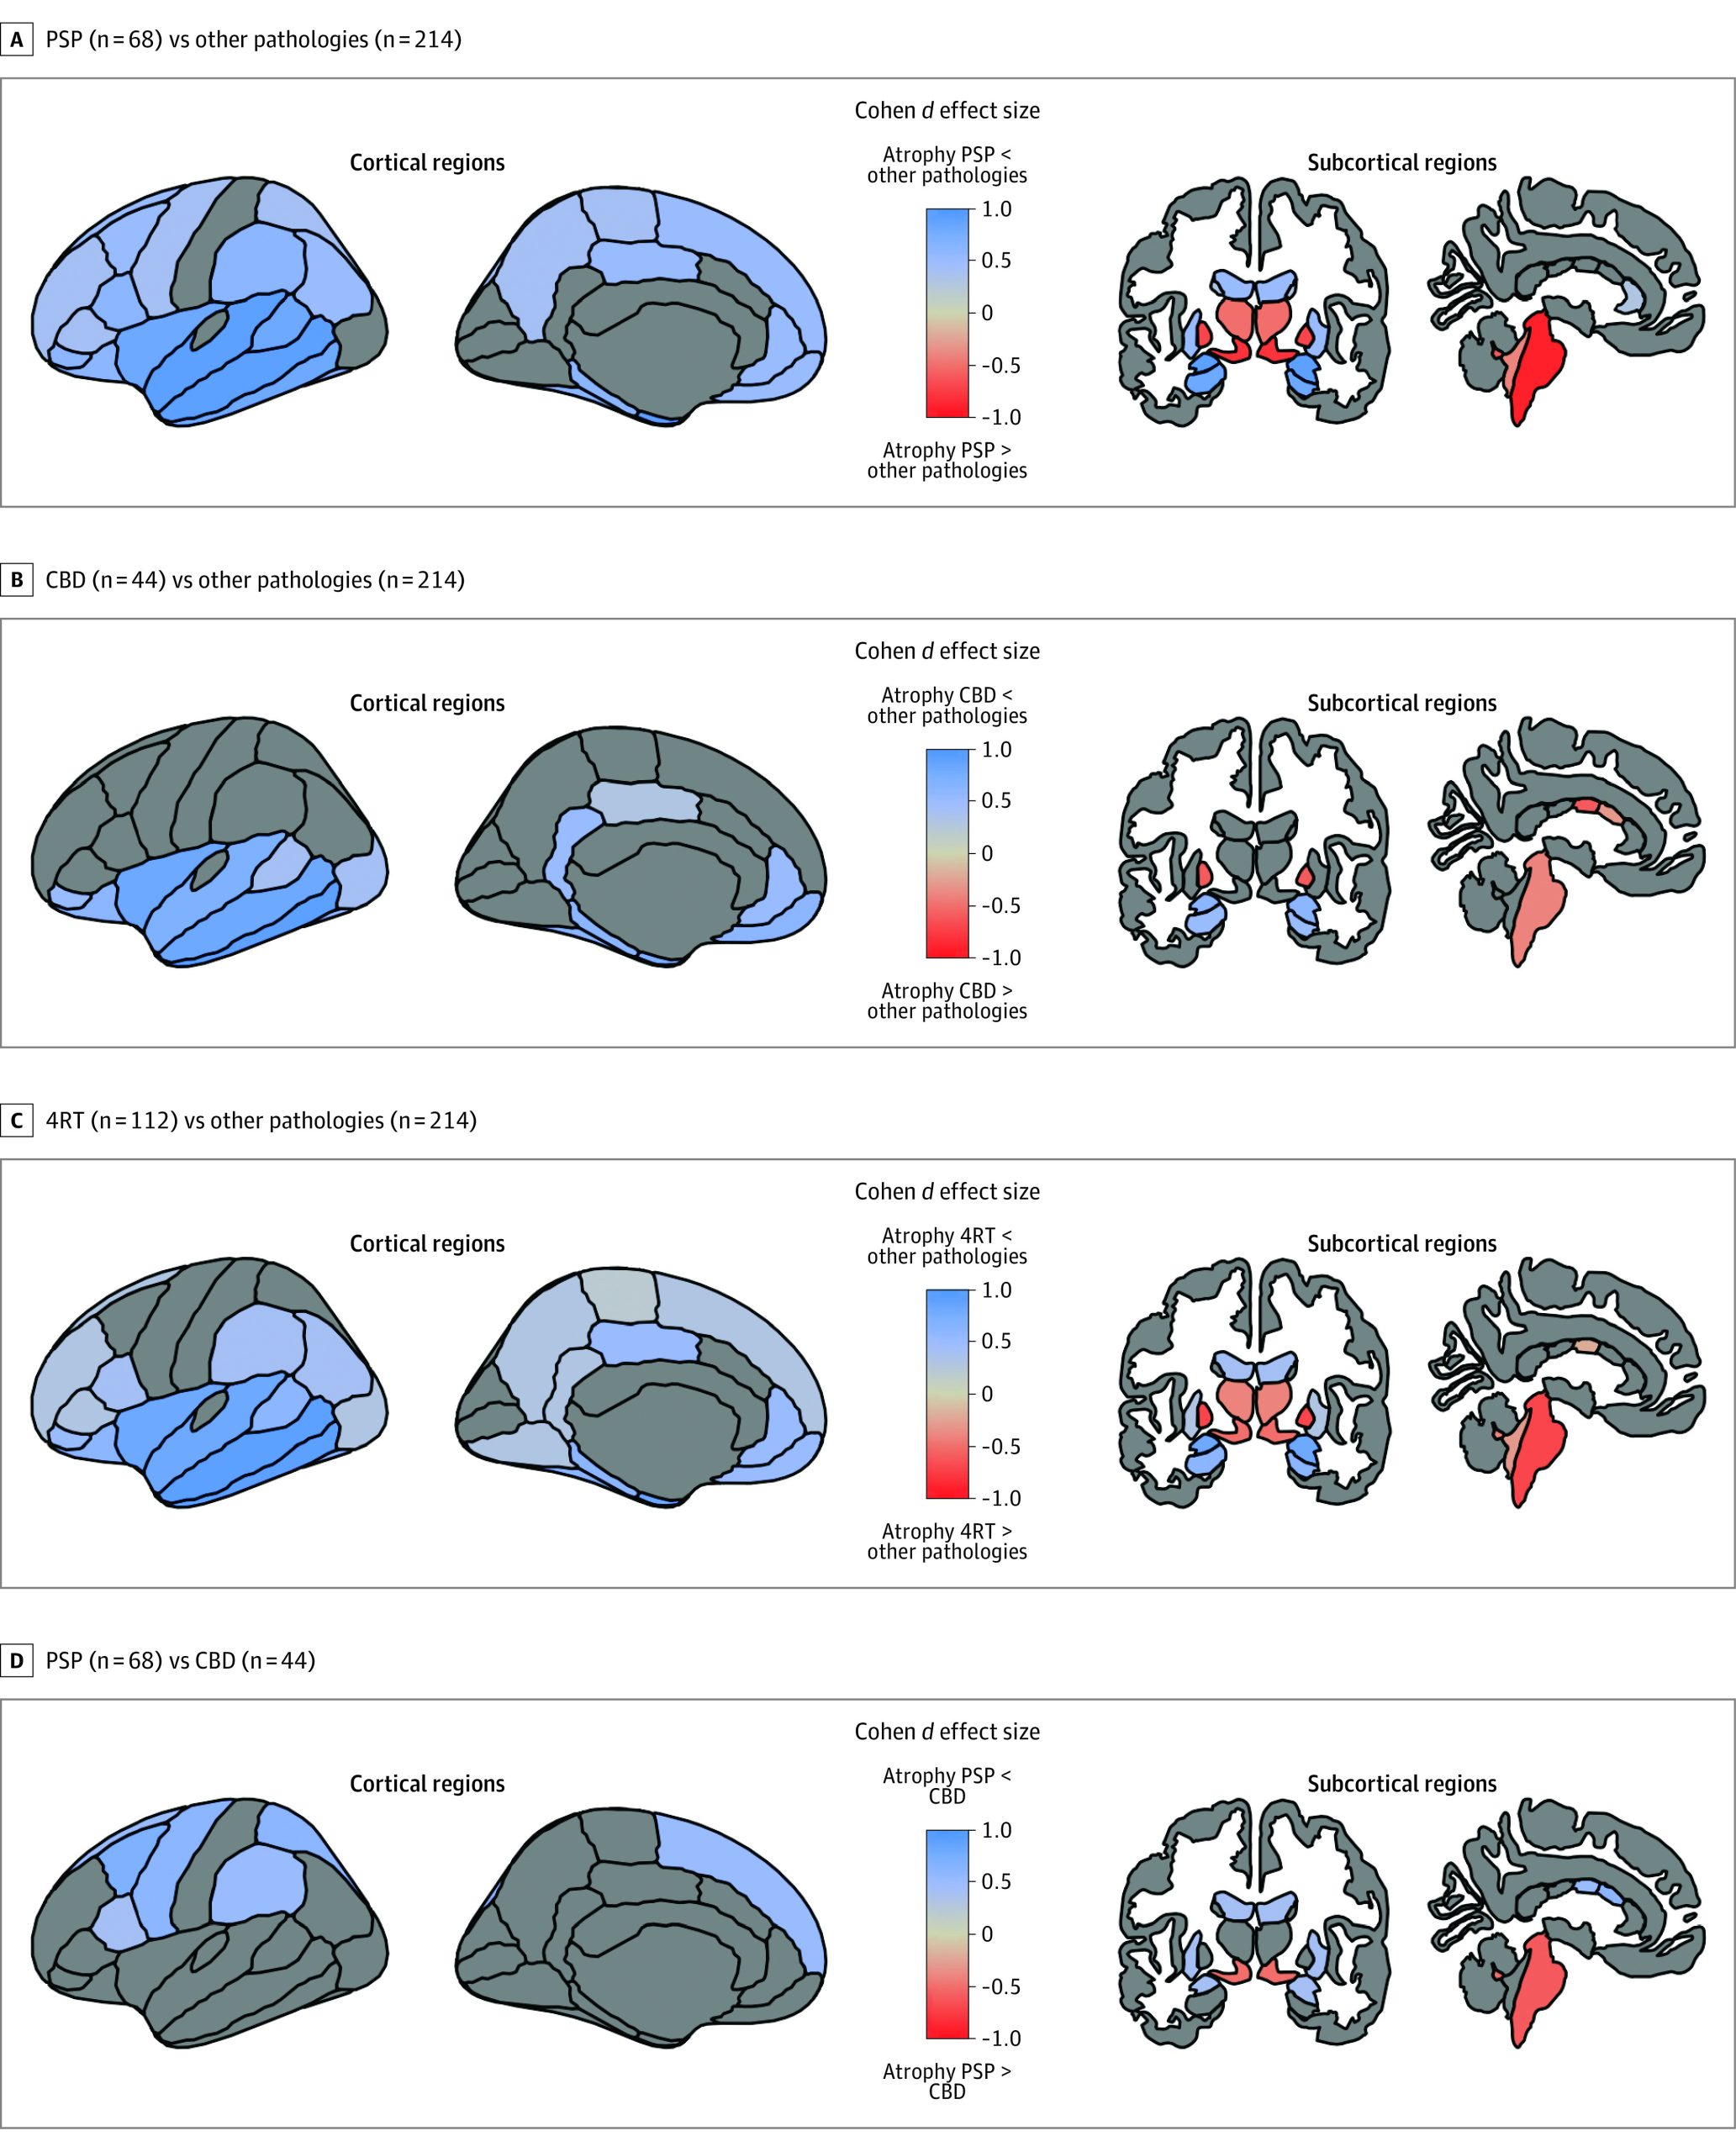
We observed a continuum of cortical atrophy between PSP and CBD with relative sparing of the cortex in PSP and intermediate levels of cortical atrophy in CBD. Participants with CBD showed relative preservation of the temporal lobe (d = 1.1) but similar atrophy to other pathologies in the perirolandic cortex (d = 0.1) (Figure 2). When compared with all other pathologies combined, both PSP and CBD showed relative preservation of the amygdala (d = 0.7), hippocampus (d = 0.6), the orbitofrontal cortex (d = 0.5), the insula (d = 0.9), and the inferior temporal cortex (d = 1.1), middle temporal cortex (d = 1.1), and superior temporal cortex (d = 0.8) (Figure 2). Participants in the 4RT group, however, had more atrophy in the brainstem (d = −0.8), ventral diencephalon (d = −0.8), thalamus (d = −0.7), and pallidum (d = −0.8). Despite showing partially overlapping cortical and subcortical atrophy patterns, some relevant differences between PSP and CBD groups were noted. Individuals with PSP had more atrophy than CBD in the brainstem (d = −0.8) and ventral diencephalon (d = −0.8) (Figure 2; eTable 3 in the Supplement). Conversely, CBD had more atrophy than PSP in the perirolandic cortex (d = −0.5), putamen (d = −0.2), and central and mid anterior portions of the corpus callosum (central: d = −0.5; mid anterior: d = −0.5) (Figure 2; eTable 3 in the Supplement).
Diagnostic Accuracy of the MRPI
The MRPI showed high diagnostic accuracy for the discrimination between PSP and all other pathologies (accuracy, 87%; AUROC, 0.90; 95% CI, 0.86-0.95) but only moderate diagnostic accuracy for the discrimination between PSP and CBD (accuracy, 78%; AUROC, 0.83; 95% CI, 0.76-0.91) and 4RT vs other pathologies (accuracy, 80%; AUROC, 0.82; 95% CI, 0.76-0.87). Table 2 shows robust cutoffs that could be applied in clinically relevant scenarios. The MRPI score alone was not useful to discriminate between CBD vs all other pathologies because CBD showed intermediate levels of the MRPI score compared with PSP (highest scores) and other pathologies (lower scores).
Table 2. : Optimal Cutoffs for MRPI and MLRM
| Measurezoi220292t2n1 | % | |||
|---|---|---|---|---|
| PSP vs other pathologies (including CBD) | CBD vs other pathologies (including PSP) | 4RT (PSP and CBD) vs other pathologies | PSP vs CBDzoi220292t2n2 | |
| MRPI | ||||
| Cutoff | >14.97 | NAzoi220292t2n3 | >13.31 | >16.13 |
| Accuracy | 87 | NAzoi220292t2n3 | 80 | 78 |
| Sensitivity | 79 | NAzoi220292t2n3 | 74 | 72 |
| Specificity | 89 | NAzoi220292t2n3 | 83 | 88 |
| MLRM-BA | ||||
| Cutoff | >0.30 | >0.13 | >0.32 | >0.48 |
| Accuracy | 95 | 79 | 89 | 91 |
| Sensitivity | 96 | 96 | 90 | 90 |
| Specificity | 94 | 76 | 89 | 92 |
| MLRM-BV | ||||
| Cutoff | >0.32 | >0.18 | >0.32 | >0.48 |
| Accuracy | 92 | 83 | 86 | 88 |
| Sensitivity | 92 | 81 | 89 | 85 |
| Specificity | 92 | 83 | 85 | 93 |
Magnetic resonance imaging–derived measurements with the highest potential to discriminate PSP, CBD, and other pathologies are shown. The MRPI and the brainstem areas considered for its calculation can be obtained online following an automated and previously validated method. To calculate estimated probabilities for MLRM-BA, MRPI-derived brainstem measures should be combined with other cortical and subcortical measures obtained following Freesurfer segmentation (Methods section and eFigure 12 in the Supplement). The calculation of estimated probabilities for MLRM-BV only requires cortical and subcortical measures obtained following Freesurfer segmentation (Methods section and eFigure 13 in the Supplement. For each biomarker and comparison of interest, the optimal cutoff and their corresponding global accuracy, sensitivity, and specificity were determined by bootstrapping 1000 samples (keeping the proportion of positives and negatives constant in every resample). In all samples, the optimal cutoff was determined with Youden index.
Cutoffs for the discrimination between PSP and CBD could be applied in samples with increased certainty of underlying PSP and CBD (ie, patients diagnosed with PSP–Richardson syndrome and probable corticobasal syndrome, after the exclusion of Alzheimer disease pathophysiology and mutations in the GRN gene).
Participants with CBD showed intermediate levels of the MRPI score compared with participants with PSP (highest scores) and participants with other pathologies (lower scores). Hence, the MRPI score was not useful to discriminate between participants with CBD and participants with other pathologies (including PSP).
Abbreviations: 4RT, 4-repeat tau isoform tauopathy; CBD, corticobasal degeneration; MRPI, magnetic resonance parkinsonism index; MLRM-BA, multinomial logistic regression model including MRPI-derived brainstem areas; MLRM-BV, multinomial logistic regression model including Freesurfer-derived brainstem volumes; NA, not assessed; PSP, progressive supranuclear palsy.
Comparison of Measures for the Diagnosis of Either PSP or Probable CBD
As shown in Figure 3A and Table 2, MLRM including different cortical and subcortical regional composites yielded the highest diagnostic accuracies for the discrimination between participants with PSP and all other pathologies (MLRM-BA: accuracy, 95%; AUROC, 0.98; 95% CI, 0.97-0.99; MLRM-BV: accuracy, 92%; AUROC, 0.97; 95% CI, 0.95-0.99). Details on the characteristics of MLRM can be found in eFigures 10 to 13 in the Supplement. The AUROC for PSP vs other pathologies for MLRM were higher than for MRPI (DeLong test, MLRM-BA: P < .001; MLRM-BV: P = .01).
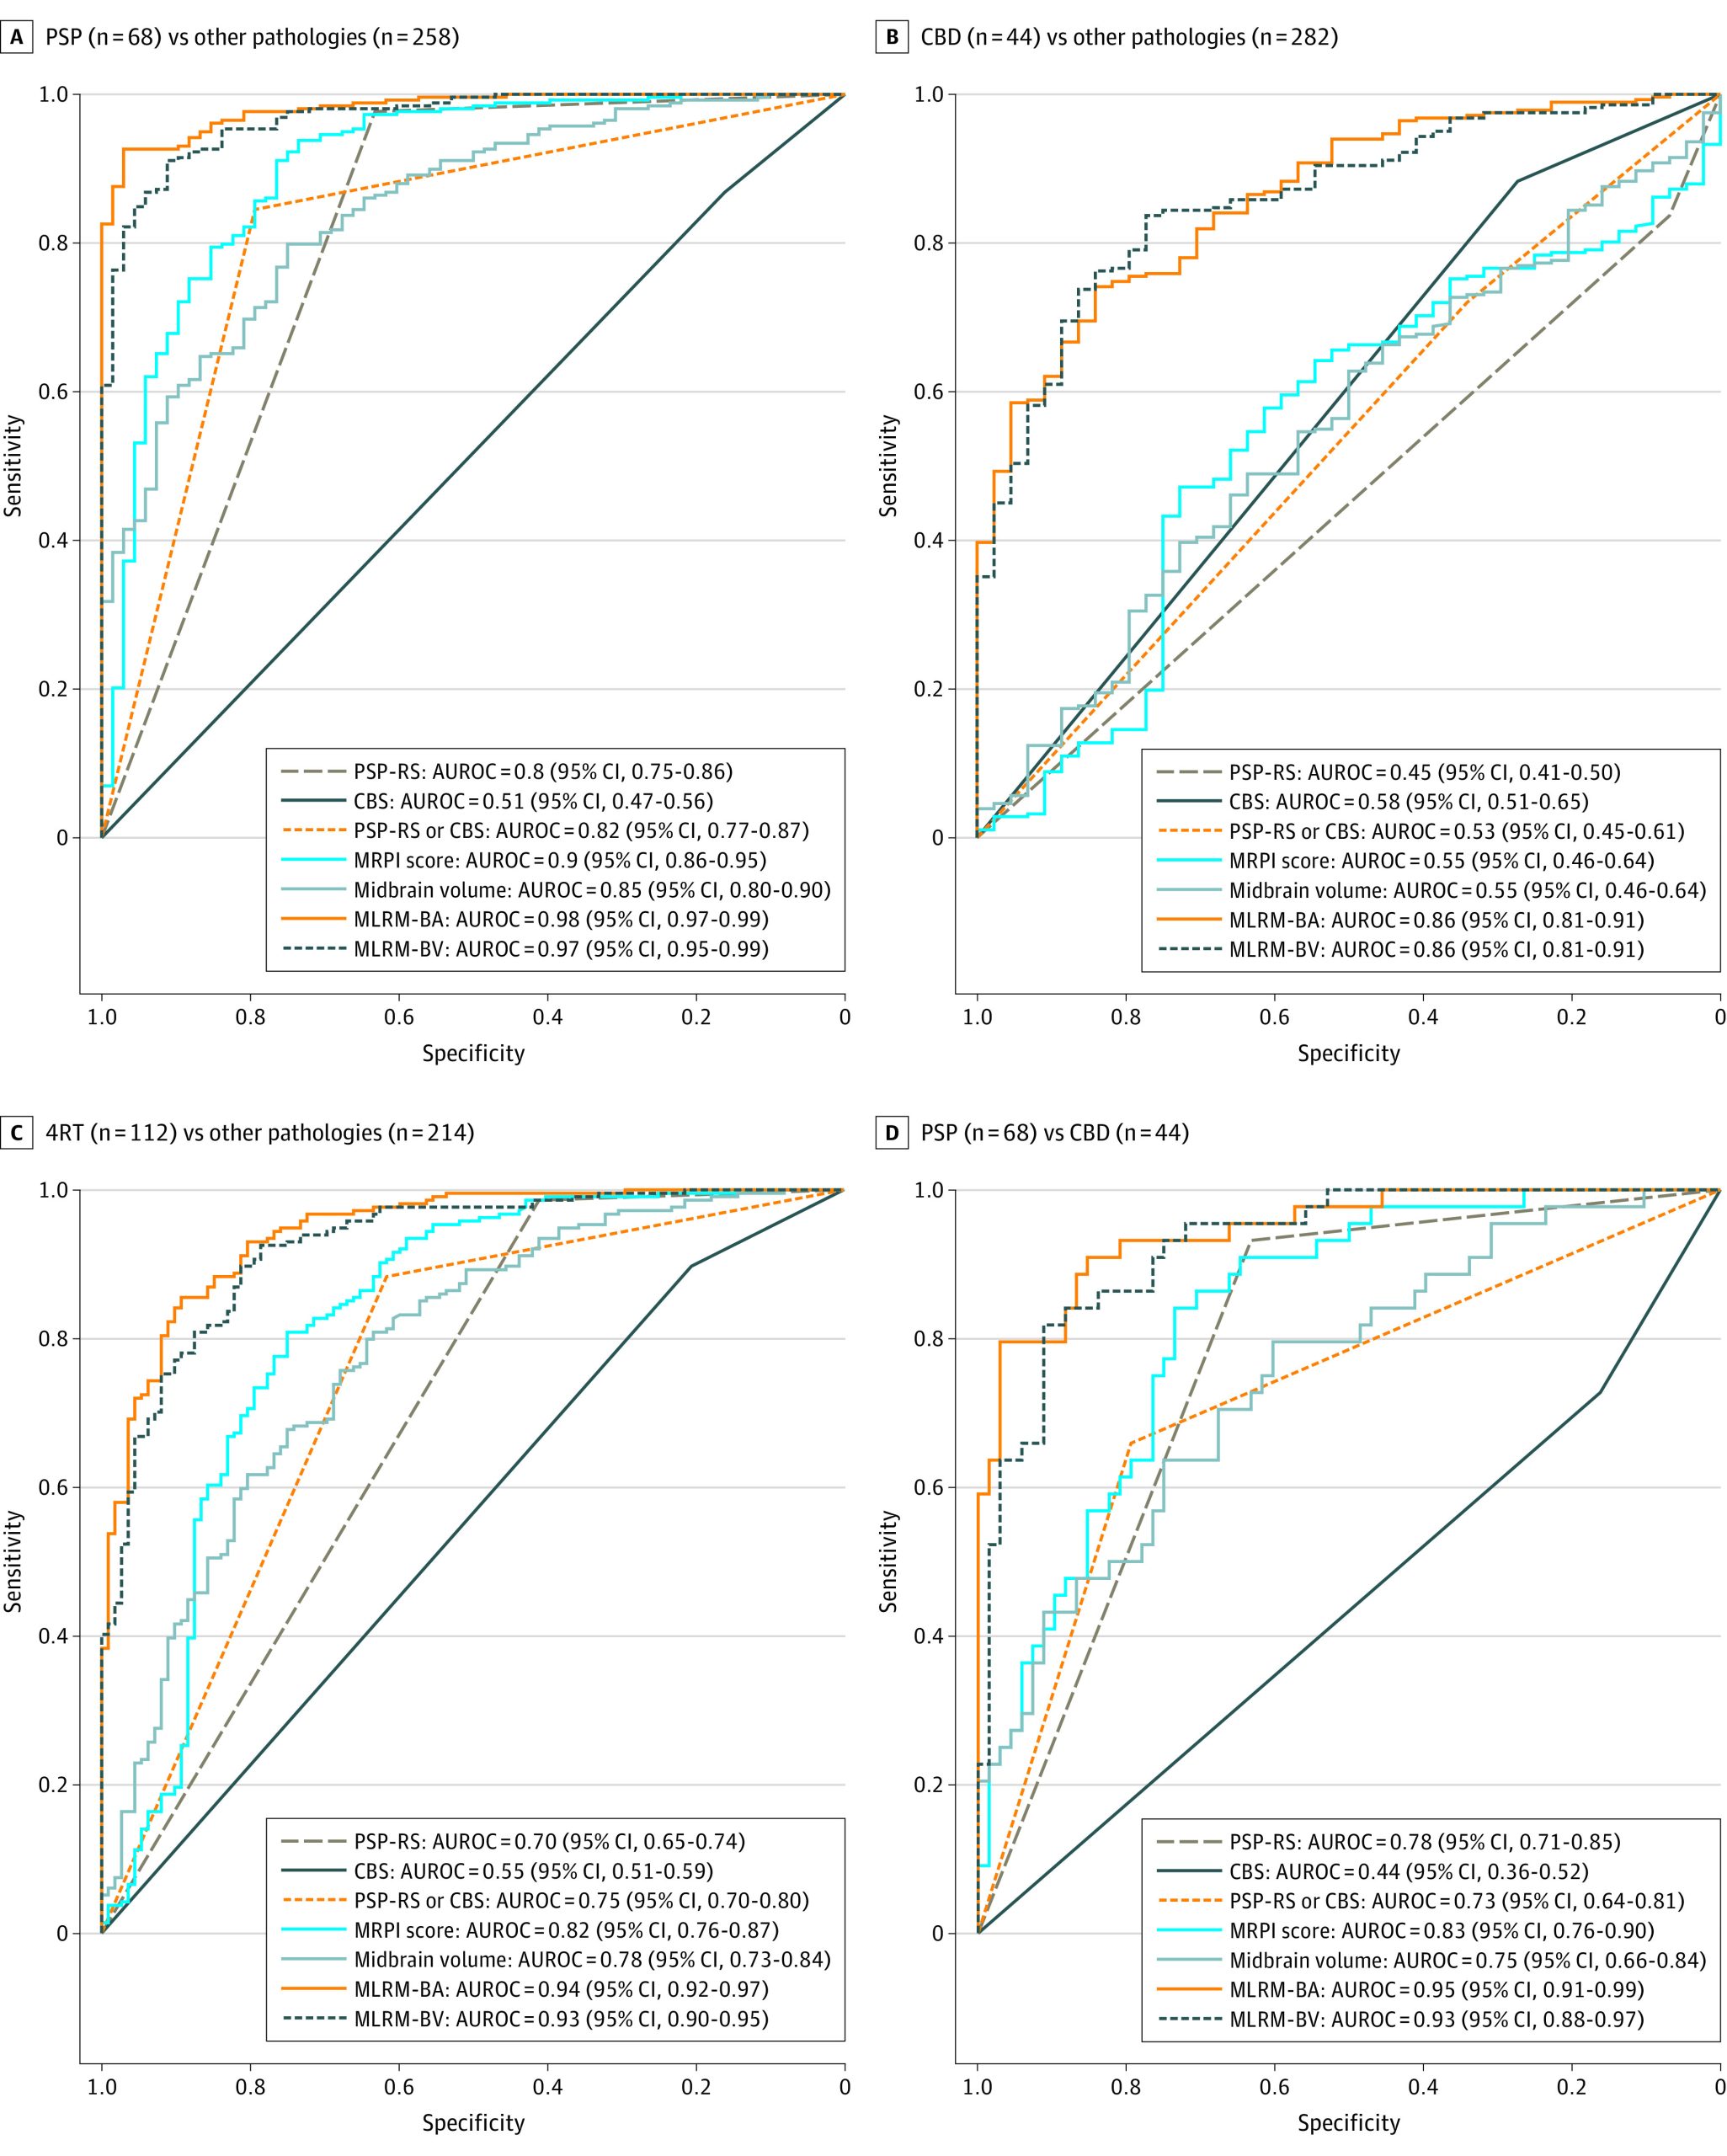
As shown in Figure 3B and Table 2, MLRM also showed good performance for the discrimination between CBD and the rest of the participants (MLRM-BA: accuracy, 79%; AUROC, 0.86; 95% CI, 0.81-0.91; MLRM-BV: accuracy, 83%; AUROC, 0.86; 95% CI, 0.81-0.91).
Comparison of Measures for the Diagnosis of 4RT
When considered together, PSP and CBD were discriminated from other pathologies with high diagnostic accuracy. As shown in Figure 3C, MLRM, including cortical and subcortical atrophy measures, had excellent diagnostic accuracy for the discrimination between 4RT and other pathologies (MLRM-BA: accuracy, 89%; AUROC, 0.94; 95% CI, 0.92-0.97; MLRM-BV: accuracy, 86%; AUROC, 0.93; 95% CI, 0.90-0.95). The AUROC for 4RT vs other pathologies for the MLRM were higher than for MRPI (DeLong test, MLRM-BA: P = <0.001; MLRM-BV: P < .001).
Comparison of Measures for the Differentiation Between PSP and CBD
As shown in Figure 3D, when restricting the analyses to the subsample of participants with either PSP or CBD, PSP-RS and CBS at MRI demonstrated a low diagnostic accuracy for the discrimination between PSP and CBD (PSP-RS: accuracy, 75%; AUROC, 0.78; 95% CI, 0.71-0.85; CBS: accuracy, 39%; AUROC, 0.44; 95% CI, 0.36-0.52). In this subsample, MLRM also showed the highest diagnostic value for the differentiation between PSP and CBD (MLRM-BA: accuracy, 91%; AUROC, 0.95; 95% CI, 0.91-0.99; MLRM-BV: accuracy, 88%; AUROC, 0.93; 95% CI, 0.88-0.97). The AUROC were also higher for MLRM vs MRPI (DeLong test, MLRM-BA: P = .02; MLRM-BV: P < .001).
Comparison of Measures in Patients With and Without PSP-RS or CBS at MRI
We also explored whether neuroimaging measures could differentiate between underlying 4RT vs non-4RT pathologies in individuals with and without PSP-RS or CBS at MRI (eFigure 14 in the Supplement). In participants without PSP-RS or CBS, the MRPI had a lower diagnostic accuracy (accuracy, 77%; AUROC, 0.73; 95% CI, 0.63-0.83) for the detection of participants with 4RT than MLRM (MLRM-BA: accuracy, 84%; AUROC, 0.93; 95% CI, 0.90-0.97; MLRM-BV: accuracy, 84%; AUROC, 0.89; 95% CI, 0.84-0.95).
Discussion
In this cohort study, we contrasted different MRI quantitative analyses and found that the combination of cortical and subcortical measures of atrophy had excellent diagnostic accuracy for the differentiation among participants with PSP, CBD, and other pathologies. Our findings highlight the value of automated morphometric analyses of structural MRI to support the diagnosis of PSP and CBD in diverse, clinically relevant scenarios. This may help to identify 4RT at earlier or nonmotor stages and enable accurate patient selection in clinical trials of disease-modifying therapies.
To our knowledge, this study represents the largest neuropathological validation of MRI-based biomarkers for PSP and CBD. Validating biomarkers in autopsy-proven samples is essential because clinical-pathological correlations are far from perfect. For example, in a recent clinicopathological study applying the 2017 Movement Disorders Society diagnostic criteria for PSP, as many as 32% of patients with suspected PSP did not have PSP on autopsy.33 The ability to determine underlying neuropathology is particularly important in CBS, for which clinical-pathological correlations are more challenging than for PSP. Previous studies have shown that the use of clinical diagnoses instead of neuropathological diagnoses may lead to a significant underestimation of the real accuracy of the biomarkers being tested and may shift diagnostic cutoffs.34
We observed differences in the patterns of atrophy between PSP, CBD, and other pathologies across several key subcortical structures including the midbrain, dorsal diencephalon, and pallidum. PSP showed the greatest degrees of atrophy in these subcortical structures, whereas CBD showed intermediate levels of atrophy. Individuals with other pathologies had the most prominent cortical atrophy in the frontotemporal cortices. In contrast, cortical atrophy was minimal in PSP and variable in CBD. Compared with other pathologies, both PSP and CBD had relative preservation of the temporal lobe. These observations are consistent with previous studies reporting partially overlapping patterns of neurodegeneration involving both cortical and subcortical structures5,6,7 in PSP and CBD and converging patterns of atrophy during follow-up.35
This study also provides diagnostic threshold values for the MRPI score based on autopsy confirmed cases. The MRPI score is a robust imaging biomarker developed for the detection of the typical pattern of brainstem atrophy associated with PSP.36 The MRPI can be obtained with a fully automated approach and has been validated in large multicenter studies.22 Compared with classical MRI signs, such as the so-called hummingbird and morning glory signs,37 the MRPI has proven to be a robust imaging biomarker for differentiating PSP-RS from PD or multiple-system atrophy.22 In PSP-RS and CBS, the MRPI offers good diagnostic performance for the identification of participants with underlying PSP. However, our results indicate that previously proposed diagnostic thresholds derived from clinically defined samples may identify some CBD cases presenting as PSP-RS. For example, a cut-off of 13.3 at the MRPI score was found to accurately discriminate (AUROC, 0.95) between PSP-RS from other patients presenting with parkinsonism in a large multicenter clinical cohort study.22 In our autopsy-proven sample, the same cutoff yielded a sensitivity of 78% and a specificity of 85% for the discrimination between PSP and other pathologies (data not shown). Our results suggest that the use of MRPI alone may not prevent the misdiagnosis of participants with CBD presenting as PSP-RS.
We also found that using only the MRPI for PSP diagnosis may miss a sizeable proportion of PSP cases, particularly in the subgroup of participants without PSP-RS or CBS. In this group, the diagnostic accuracy of the combination of cortical and subcortical measures of atrophy was superior to the diagnostic accuracy of subcortical measures alone. This result is consistent with our previous observation in participants with bvFTD who developed PSP-RS during follow-up or had PSP or CBD on autopsy.38 This result is also consistent with a previous study suggesting that PSP variants with prominent nonmotor signs at diagnosis may benefit from specific neuroimaging signatures, including cortical regions.39 Taken together, our results support the view that the MRPI can be used to increase the diagnostic certainty of either PSP or CBD in participants presenting with PSP-RS or CBS. Nonetheless, its ability to differentiate CBD from other pathologies and PSP from CBD remains limited. Of note, brainstem measurements obtained with Freesurfer (ie, midbrain or pons volumes) were highly correlated and showed similar diagnostic performance as the corresponding measurements obtained for the automated calculation of the MRPI (ie, midsagittal area of the midbrain or pons), suggesting that these 2 approaches could be used interchangeably for the diagnosis of 4RT.
The limitations of the MPRI and the other markers of subcortical atrophy together with the relative preservation of certain cortical areas in PSP and CBD justified testing alternative methods to improve the discrimination between 4RT and other pathologies. Most studies validating PSP neuroimaging biomarkers were based on clinically defined groups, focused on subcortical measurements, or only considered broad cortical regions (ie, frontal lobe or whole cerebral volume).20 However, this study observed a significant increase in the diagnostic performance of imaging biomarkers for the differentiation between autopsy-proven 4RT and other pathologies by combining subcortical measurements with cortical thickness in regions that are selectively affected (or spared) in PSP and CBD.
In this autopsy-confirmed cohort, we included a large sample of participants with 4RT with a wide range of clinical syndromes in addition to the canonical movement disorders associated with these diseases. Recent evidence from large multicenter studies applying modern criteria for the recognition of PSP and CBD clinical presentation suggests that focusing on classical motor presentations may either delay or miss the diagnosis of PSP or CBD.40 In this study, nearly half of the participants (43 [48%]) with a definitive diagnosis of 4RT did not present with PSP-RS or CBS. This observation is consistent with previous neuropathological series describing a substantial proportion of 4RT in patients presenting as bvFTD, nfvPPA, and even amnestic dementia.7,11,15,41 Thus, the inclusion of a substantial proportion of participants presenting with a wide range of phenotypes provides a robust validation of neuroimaging measures for the in vivo recognition of the 2 main 4RT.
Limitations
This study has several limitations. First, we did not include detailed clinical classification according to updated PSP and CBD criteria, but we included a substantial proportion of PSP or CBD cases without a diagnosis of PSP-RS or CBS, which is still informative and avoids the selection bias of previous studies enriched with canonical motor presentations of 4RT.42 Second, we did not obtain cross-validation in an independent autopsy cohort because a comparable pathology-proven data set to replicate these findings is exceedingly rare. However, we performed 5-fold cross-validation to test the robustness of our results, and we provide details on logistic regression models using raw neuroimaging measures to facilitate the replication of our results in different cohorts (eFigure 12 and eFigure 13 in the Supplement). Notwithstanding, more work is needed to ensure the standardization and reproducibility of MRI-based measurements combining cortical and subcortical structures before their translation to clinical practice. Furthermore, we included a relatively small proportion of participants with alpha-synucleinopathies. Very mild cortical and brainstem changes are expected in PD or dementia with Lewy bodies, and thus, we would expect similar diagnostic accuracies in a sample enriched with alpha-synucleinopathies.
Conclusions
In this study, the combination of widely available cortical and subcortical measures of atrophy on MRI discriminated among PSP, CBD, and other pathologies. These measures could be used to increase the recognition of 4RT as a cause of diverse neurodegenerative syndromes in clinical practice.
References
- Neurodegenerative tauopathies.. Annu Rev Neurosci., 2001. [DOI | PubMed]
- Multiple isoforms of human microtubule-associated protein tau: sequences and localization in neurofibrillary tangles of Alzheimer’s disease.. Neuron., 1989. [DOI | PubMed]
- Four-repeat tauopathies: current management and future treatments.. Neurotherapeutics., 2020. [DOI | PubMed]
- Molecular neuropathology of frontotemporal dementia: insights into disease mechanisms from postmortem studies.. J Neurochem., 2016. [DOI | PubMed]
- Clinicopathological correlations in corticobasal degeneration.. Ann Neurol., 2011. [DOI | PubMed]
- Voxel-based morphometry in autopsy proven PSP and CBD.. Neurobiol Aging., 2008. [DOI | PubMed]
- Clinicopathological correlations in behavioural variant frontotemporal dementia.. Brain., 2017. [DOI | PubMed]
- Progressive supranuclear palsy. a heterogeneous degeneration involving the brain stem, basal ganglia and cerebellum with vertical gaze and pseudobulbar palsy, nuchal dystonia and dementia.. Arch Neurol., 1964. [DOI | PubMed]
- Corticodentatonigral degeneration with neuronal achromasia.. Arch Neurol., 1968. [DOI | PubMed]
- Clinicopathologic analysis of frontotemporal and corticobasal degenerations and PSP.. Neurology., 2006. [DOI | PubMed]
- The phenotypic spectrum of progressive supranuclear palsy: a retrospective multicenter study of 100 definite cases.. Mov Disord., 2014. [DOI | PubMed]
- Clinical research criteria for the diagnosis of progressive supranuclear palsy (Steele-Richardson-Olszewski syndrome): report of the NINDS-SPSP international workshop.. Neurology., 1996. [DOI | PubMed]
- The evolution of primary progressive apraxia of speech.. Brain., 2014. [DOI | PubMed]
- Atrophy, hypometabolism and clinical trajectories in patients with amyloid-negative Alzheimer’s disease.. Brain., 2016. [DOI | PubMed]
- Typical and atypical pathology in primary progressive aphasia variants.. Ann Neurol., 2017. [DOI | PubMed]
- Early vs late age at onset frontotemporal dementia and frontotemporal lobar degeneration.. Neurology., 2018. [DOI | PubMed]
- New directions in clinical trials for frontotemporal lobar degeneration: methods and outcome measures.. Alzheimers Dement., 2020. [DOI | PubMed]
- Advances in progressive supranuclear palsy: new diagnostic criteria, biomarkers, and therapeutic approaches.. Lancet Neurol., 2017. [DOI | PubMed]
- 19US Food and Drug Administration. Context of use. FDA. July 7, 2021. Accessed September 6, 2021. https://www.fda.gov/drugs/biomarker-qualification-program/context-use
- Radiological biomarkers for diagnosis in PSP: where are we and where do we need to be?. Mov Disord., 2017. [DOI | PubMed]
- Clinical diagnosis of progressive supranuclear palsy: the Movement Disorder Society criteria.. Mov Disord., 2017. [DOI | PubMed]
- Automated MRI classification in progressive supranuclear palsy: a large international cohort study.. Mov Disord., 2020. [DOI | PubMed]
- Measuring the thickness of the human cerebral cortex from magnetic resonance images.. Proc Natl Acad Sci U S A., 2000. [DOI | PubMed]
- Bayesian segmentation of brainstem structures in MRI.. Neuroimage., 2015. [DOI | PubMed]
- Clinical and pathological diagnosis of frontotemporal dementia: report of the Work Group on Frontotemporal Dementia and Pick’s Disease.. Arch Neurol., 2001. [DOI | PubMed]
- Nomenclature for neuropathologic subtypes of frontotemporal lobar degeneration: consensus recommendations.. Acta Neuropathol., 2009. [DOI | PubMed]
- Nomenclature and nosology for neuropathologic subtypes of frontotemporal lobar degeneration: an update.. Acta Neuropathol., 2010. [DOI | PubMed]
- World Medical Association Declaration of Helsinki: ethical principles for medical research involving human subjects.. JAMA., 2013. [DOI | PubMed]
- Cognition and neuropsychiatry in behavioral variant frontotemporal dementia by disease stage.. Neurology., 2016. [DOI | PubMed]
- Patterns of brain atrophy that differentiate corticobasal degeneration syndrome from progressive supranuclear palsy.. Arch Neurol., 2006. [DOI | PubMed]
- Comparing the areas under two or more correlated receiver operating characteristic curves: a nonparametric approach.. Biometrics., 1988. [DOI | PubMed]
- cutpointr: Improved estimation and validation of optimal cutpoints in R.. J Stat Softw., 2021. [DOI]
- Brainstem biomarkers of clinical variant and pathology in progressive supranuclear palsy.. Mov Disord., 2021. [DOI | PubMed]
- CSF biomarkers cutoffs: the importance of coincident neuropathological diseases.. Acta Neuropathol., 2012. [DOI | PubMed]
- Progression of brain atrophy in PSP and CBS over 6 months and 1 year.. Neurology., 2016. [DOI | PubMed]
- MR imaging index for differentiation of progressive supranuclear palsy from Parkinson disease and the Parkinson variant of multiple system atrophy.. Radiology., 2008. [DOI | PubMed]
- Conventional magnetic resonance imaging in confirmed progressive supranuclear palsy and multiple system atrophy.. Mov Disord., 2012. [DOI | PubMed]
- Diagnostic utility of measuring cerebral atrophy in the behavioral variant of frontotemporal dementia and association with clinical deterioration.. JAMA Netw Open., 2021. [DOI | PubMed]
- Brain volume and flortaucipir analysis of progressive supranuclear palsy clinical variants.. Neuroimage Clin., 2020. [DOI | PubMed]
- Diagnosis across the spectrum of progressive supranuclear palsy and corticobasal syndrome.. JAMA Neurol., 2020. [DOI | PubMed]
- Criteria for the diagnosis of corticobasal degeneration.. Neurology., 2013. [DOI | PubMed]
- The phenotypic spectrum of progressive supranuclear palsy.. Parkinsonism Relat Disord., 2016. [DOI | PubMed]