
The impact of cannabidiol (CBD) in hyperglycemic zebrafish (Danio rerio)
Abstract
Diabetes Mellitus (DM) is a serious medical condition that impacts the lives of millions of people around the world. Complications of both micro- and macro-vascular nature occur later in life due to prolonged hyperglycemia. Hyperglycemia increases inflammation throughout the CNS and, more locally, in retina leading to the downregulation of tight-junction proteins at the blood retinal barrier and visual decline in Type 2 DM (T2DM) patients. Cannabidiol (CBD) is a cannabinoid known to lower inflammation and reduce blood glucose levels. These characteristics suggest that CBD could be used to mitigate hyperglycemic complications. To assess this, we examined if concurrent use of CBD (5 mg/L) during hyperglycemic induction would lower the risk for visual deficits in a zebrafish T2DM model. Using behavioral (optomotor response), molecular (RT-qPCR and Western Blot), and physiological (electroretinogram) techniques, we measured the response of CBD treatment on vision after a 4-week hyperglycemic period. After glucose treatment, zebrafish showed elevated blood sugar, reduced optomotor responses and compromised retinal electroretinogram recordings. Co-exposure with CBD increased performance on optomotor responses but did not significantly lower blood glucose levels. Glucose + CBD delayed photoreceptor a-wave and OFF-bipolar d-wave response times but did not restore the reduced b-wave and d-wave amplitudes observed in ERGs recorded from Glucose treated fish. Retinal homogenates from hyperglycemic fish with and without CBD co-exposure had decreased claudin-5 but increased occludin protein levels. Together, these results suggest that the CBD exposure protocol used here may broadly impact hyperglycemic sequelae but not specifically protect against microvascular complications.
Affiliations: Department of Biology, American University, Washington, District of Columbia, United States of America; Center for Neuroscience and Behavior, American University, Washington, District of Columbia, United States of America; Department of Anatomy, Physiology, and Genetics, Uniformed Services University of the Health Sciences, Bethesda, Maryland, United States of America
License: © 2026 McCarthy et al CC BY 4.0 This is an open access article distributed under the terms of the Creative Commons Attribution License, which permits unrestricted use, distribution, and reproduction in any medium, provided the original author and source are credited.
Article links: DOI: 10.1371/journal.pone.0348975 | PubMed: 42118736 | PMC: PMC13166913
Relevance: Relevant: mentioned in keywords or abstract
Full text: PDF (104 KB)
Introduction
Diabetes Mellitus (DM) is a serious metabolic condition that, as of 2021, impacted ~38.1 million US adults [ref. 1]. DM is characterized by an inability to regulate blood sugar levels, particularly the increase in blood sugar (hyperglycemia) that occurs after eating. DM can overall be described as a disease of insulin insufficiency or impaired insulin action [ref. 2]. Type 2 DM (T2DM) is characterized by an inability to regulate blood sugar levels due to impaired insulin action and accounts for 90–95% of all diagnoses [ref. 2,ref. 3].
Hyperglycemia caused by insulin insensitivity is a major risk factor for the onset and progression of the complications associated with T2DM. Diabetic neuropathy, nephropathy, retinopathy, and cognitive decline are the four main microvascular (small blood vessel) complications. Diabetic retinopathy (DR) is the most common of these complications and is the leading cause of blindness and visual impairments among the working-age population [ref. 4]. Patients with DR have an elevated chance to be diagnosed with diabetic nephropathy, neuropathy, and cognitive impairments [ref. 5–ref. 8], suggesting a common pathology across tissue types.
Hyperglycemia-induced retinal inflammation causes neuronal and vascular damage, increases blood retinal barrier (BRB) permeability, and triggers inflammatory pathways promoting the progression of DR. The increase in cell adhesion molecules reported in diabetic patients and animal models [ref. 9] causes leukocyte adhesion within retinal vessels prior to microaneurysms and capillary damage [ref. 10]. Hyperglycemic zebrafish [ref. 11] and 6-week-old T2DM Zucker Fatty Diabetic Rats [ref. 12] display increased retinal levels of inflammatory cytokines, some of which (IL-6, IL-1β, TNFα) are correlated with the severity of DR [ref. 9,ref. 13]. Elevation of MAPK (JNK) and NFκB pathways is also positively correlated with increased apoptosis and DR progression [ref. 12,ref. 13].
Cannabidiol (CBD) is a phytocannabinoid derived from the cannabis plant with anti-inflammatory properties. CBD acts by binding to, and activating, PPARα, PPARγ, and TRPV1 receptors [ref. 14,ref. 15]. CBD also targets the NFκB pathway by reducing phosphorylation of p38 MAPK, which decreases levels of inflammatory cytokines such as TNFα, IL-1β, IL-6, IFN-γ [ref. 16–ref. 18]. While this paper primarily focuses on the anti-inflammatory properties of CBD, it is important note that CBD also has broader modulatory effects such as anti-convulsant or antiepileptic, antidepressant, antipsychotic and antioxidant properties [ref. 15,ref. 19,ref. 20]. CBD treatment also helps reduce anxiety in humans [ref. 21], rodents [ref. 22,ref. 23], and zebrafish [ref. 24,ref. 25].
Previously, our lab used a zebrafish (Danio rerio) T2DM model to study the impact of hyperglycemia on retinal function. We have reported that 4-weeks of hyperglycemia causes thinning of the retina [ref. 26], reduces electroretinogram and red cone responses [ref. 27,ref. 28], increases retinal GFAP, IκB, and NFκB levels [ref. 11,ref. 28], reduces levels of the tight junction protein claudin-5 in retina [ref. 11,ref. 29], and changes optomotor responses [ref. 11,ref. 29]. Behavioral differences are apparent for up to 12-weeks of hyperglycemia, and recovery (return to normglycemic conditions) does not completely reverse these deficits [ref. 29].
Here, we employ a multistep approach to investigate whether a 20-minute co-exposure to CBD administered during prolonged hyperglycemia minimizes hyperglycemia-driven visual decline in zebrafish. We hypothesized that CBD administered during hyperglycemic insult would mitigate the visual decline and improve visual performance by reducing inflammation and the loss of retinal tight junction proteins.
Materials and methods
Animals
Adult wild-type zebrafish (Danio rerio) aged 4−12 months were obtained from either a commercial supplier (Live Aquaria, www.liveaquaria.com, or Carolina Biological, Burlington, NC), or bred in-house, and kept in the Aquatics Facility at American University. Zebrafish aged 4−12 months are considered adults as zebrafish reach sexual maturity between 2−3 months and old age by two years of age. Fish were held in an Aquatic Habitat (AHAB) (Pentair, Apopka, FL) system at ~28°C and on a 14−10hr light-dark cycle. Zebrafish were fed daily using commercial flakes (TetraMinTM, Blacksburg,VA). All fish were randomly chosen for participation and randomly separated into condition groups, with both males and females in each group. Upon the completion of the experiment, animals were anesthetized in 0.02% tricaine (tricaine-S, Western Chemical, Ferndale, WA) for 2 minutes (min) or until a lack of motor coordination and reduced gill movement were noted, at which point the fish were decapitated and tissue was collected for later investigation. All experimental procedures were approved by the Institutional Animal Care and Use Committee (IACUC) at American University (protocols #19−02 and 22−08).
Hyperglycemia induction and CBD exposure
To induce hyperglycemia, zebrafish were placed in 2 L tanks maintained at 28–29°C. Fish were fed daily before transfers, at which time pH and temperature were recorded. Experimental groups were divided based on the treatment and the exposure regimen they received.
Treatment refers to the type of solution the fish were maintained in over the 4-week period (i.e., Water, Mannitol, or Glucose). Exposure refers to what type of drug the zebrafish were placed into for 20 min every other day (i.e., Water, Methanol, or CBD). These parameters resulted in seven Treatment + Exposure groups: (1) Water + Water (stress control, n = 8), (2) Mannitol + Water (Osmotic Control, n = 6), (3) Water + Methanol (Vehicle Control, n = 19), (4) Water + CBD (Drug Control, n = 21), (5) Mannitol + CBD (Osmotic Drug Control, n = 21), (6) Glucose + Water (Hyperglycemic, n = 24), (7) Glucose + CBD (Experimental Group, n = 20) (Fig 1). Within the text we abbreviate these as Control (groups 1 and 2, not statistically different from each other for any parameter), Vehicle (group 3), CBD or Drug Control (group 4), Mannitol + CBD (group 5), Glucose or hyperglycemic (group 6), and Glucose + CBD (group 7). Glucose (D-glucose, #G8270) was purchased from Sigma (St. Louis, MO); mannitol (D-mannitol, #AC125340050) was purchased from ThermoFisher (Waltham, MA). CBD (C6395; #13956-29-1) was purchased from Millipore Sigma (Damstadt, Germany).
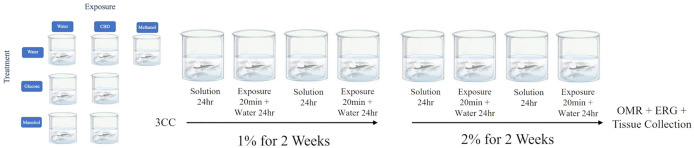
Hyperglycemia was induced using a stepwise alternate immersion protocol developed in our lab [ref. 30,ref. 31]. In brief, every day, during the same 3-hour time block, zebrafish were transferred from a tank containing one of the three treatment solutions (Water, Glucose, or Mannitol) to a tank containing only water (Fig 1). The subsequent day, the fish were transferred from the tank containing water to a new tank containing treatment solution (Water, Glucose, or Mannitol). For the first 2 weeks, the fish were maintained in a 1% solution (20 grams of Mannitol or Glucose dissolved in 2 L water). For the next 2 weeks, fish were maintained in a 2% (40 grams in 2 L water) solution, for a total treatment duration of 4 weeks [ref. 31]. Alternating immersion mimics the increase and decrease in blood sugar observed in diabetics, while the stepwise induction (1% to 2%) allows for a constant and steady increase of blood sugar [ref. 31]. After removing fish from a given treatment tank, the tank was cleaned and set-up for the next day. Solutions within the treatment tanks were the same temperature and photoperiod as stock tanks.
On the days when zebrafish were transferred out of treatment tanks, and before they were moved to water tanks, 20 min of drug exposure (Water, Methanol, or CBD) was administered (Fig 1). For each exposure, zebrafish, as either pairs or individuals were placed into a glass petri dish (3” diameter, 0.5’ deep) containing 50 mL of one of the exposure solutions (5 mg/L CBD or 0.005% Methanol or Water). Fish were allowed to swim freely for 20 min. After 20 min, the fish were placed back into water treatment tanks for 24 hr. CBD exposure solutions were made fresh from a stock solution every four exposure days and fresh system water was used for each exposure. To make the exposure solutions, 250 μL of Methanol (Vehicle; catalog #34860; Sigma) or the CBD stock (1 mg/mL) were mixed with 50 mL system water, resulting in a 5 mg/L (0.005%) exposure concentration. A 5 mg/L CBD dose was chosen based on the literature [ref. 25,ref. 32]. Blood sugar levels were the highest when exposures were performed (i.e., when the animals were removed from treatment tanks). This mimics a possible route of treatment for CBD as therapeutic drug vs a prophylactic drug.
Optomotor response
Behavior was recorded on treatment day 28. To record the optomotor response (OMR) no more than two fish were placed in a 12-inch cylindrical glass dish that was set on top of a flat-panel computer monitor (Dell, Round Rock, TX), as in LeFauve et al., 2021 [ref. 33]. The monitor was connected to a Macbook Pro laptop (Apple, Cupertino, CA) located outside the behavioral chamber. The monitor and glass dish were housed in an all-black behavioral chamber, with a door, to prevent disruptions during recordings. Zebrafish were allowed to acclimate to the dish for 3 min and 30 sec before stimulus presentation. The stimulus, projected onto the monitor from the laptop, was a rotating black and white radial grating stimulus projected beneath fish [ref. 33]. The stimulus rotated first clockwise for 30 sec, followed by 30 sec of counterclockwise rotation, repeated twice. A gray screen was projected for 30 sec between each stimulus to act as both a control and a rest for the fish. Responses to the stimulus were recorded from above using a Canon (Melville, NY) video camera (VIXIA HFR700, 32x optical zoom, 57x advanced zoom, HD). Videos were scored, blinded to treatment, by watching the recording and counting the number of complete revolutions made by each fish during each stimulus presentation. A positive OMR occurred when the fish swam in the direction of the stimulus for one full rotation. Average values for each treatment group were compared.
Electroretinograms
Four to eight retinal eyecups (2–4 fish) per group were prepared for ERG recordings. The remaining fish were sacrificed immediately, and brain, retina, and liver tissue were collected for later [ref. 11,ref. 28] use.
Following tricaine anesthesia, as noted above, fish were decapitated and blood sugar measurements were taken from the heart using a FreeStyle Lite Blood Glucose Meter (Abbot Diabetes Care, Alameda, CA). The eyes were then removed from the head and placed corneal side up on a piece of 0.45 µm black filter paper (#HABP02500; Millipore, Burlington, MA). Using Vannas Spring Scissors (#15044−08, Fine Scientific Tools, Foster City, CA), the lens and cornea were removed. The eyecup + filter paper were then transferred to the recording chamber and superfused with oxygenated MEM solution without glutamine (catalog #11090099; Thermofisher) equilibrated with 95%O2/5%CO2. A perfusion needle (28 gauge; catalog #MF28G67; World Precision Instruments, Sarasota, FL) was placed near the eye with a perfusion inflow rate of 0.3 ml/min (4 ml/min outflow), and a tungsten recording electrode (catalog #30031; FHC, Bowdoin, ME) was inserted directly into the vitreal space of the eyecup. The recording chamber was mounted on a fixed stage Olympus (Center Valley, PA) BX51WI compound microscope and imaged using an IR camera (Teledyne QImaging, Surrey, British Columbia) and Metamorph Imaging software (Molecular Devices, San Jose, CA).
Eyes were dark adapted in the chamber for 10–20 min. Retinal responses were evoked as in [ref. 34]. Specifically, a 300 msec white light pulse was administered at 7 irradiance levels ranging from ND 6.0 (dimmest) to ND 3.0 (brightest) in 0.5 increments. The white-light source was a 150 W Xenon arc lamp, imaged through UV compliant optics. Responses were amplified using a DAM80 amplifier (World Precision Instruments, Sarasota, FL), a bandpass from 0.1 Hz to 1 kHz, and a Digidata 1440A (Axon Instruments, Union City, CA) with a sampling rate of 2 kHz. Mean response component amplitudes and peak times were obtained from different treatment groups for the a-wave (photoreceptor response), b-wave (ON-bipolar response), and d-wave (OFF-bipolar response). ERG a-waves are a downward (corneal-negative) response immediately after light-ON; b-waves immediately follow a-waves and are a large corneal-positive response. Immediately after the end of the light pulse, a corneal positive d-wave was observed [ref. 34]. We determined differences in ERG responses by measuring differences in peak amplitude and implicit times for all three components, as in Jensen et al., 2025 [ref. 35]. Data were collected with pCLAMP 10 software (Molecular Devices, San Jose, CA) and analyzed using Origin 2021 (OriginLab, Northampton, MA). Graphs were made in Excel (Microsoft, Redmond, WA).
Each white-light protocol generated a total response dataset with 70, 4-trace-averaged ERGs, or 280 recordings. Each ERG (i.e., every eye) had 10 technical replicates at each of the 7-step irradiance level (ND 6.0 – ND 3.0). Our overall biological replicates (eyes), n = 3–8, per treatment group, generated 30–80 ERG traces at each brightness level. Technical replicates were removed from the analysis if the b-wave amplitude was negative or if the response occurred outside the appropriate interval. If more than five technical replicates had to be excluded from an eye, the eye was considered “dead” and was removed from analysis.
To conduct statistical analysis for ERGs, the 280 response waveforms from each eye were combined. Amplitudes (µV) and peak times (ms) for a-, b-, and d-waves were measured within fixed time intervals. ERG a- and b-wave components were measured in the interval 51–200 msec after stimulus onset. a-wave amplitudes were measured from baseline to the lowest point of the a-wave trough; b-wave amplitudes were measured from the lowest point of the trough to the peak of the b-wave response. ERG d-wave amplitude and peak times were measured in the interval 25–250 msec after stimulus offset [ref. 35].
Molecular assays
RT-qPCR.
RNA extraction: RNA was extracted using the RNeasy Plus Mini Kit (Qiagen, Hilden, Germany) according to the manufacturer’s protocol for animal tissue. In brief, 1 brain or 2 combined retinas (roughly 25 mg of tissue) were lysed and homogenized in a solution of Buffer RLT Plus (Qiagen Kit) and 1% β-mercaptoethanol (catalog #M6250; Sigma). The lysate was spun through a gDNA Eliminator column (Qiagen Kit) whereby 1 volume of 70% ethanol was added to the flow-through, and samples were added to RNeasy spin columns (Qiagen Kit). A series of washes were performed with differing buffers, ending in RNA being elucidated in 40μl of RNAse-free water. Samples were quantified and stored at −80°C. Purity and concentration levels were quantified by measuring the A260/A280 absorbance ratios using a NanoVue PlusTM spectrophotometer (Biochrom, Cambridge, UK). A260/A280 ratios between 1.9 and 2.2 were considered indicators of pure RNA and were selected for use. Gene-specific primer pairs (S1 Table) used for this study were designed using NCBI Blast (https://blast.ncbi.nlm.nih.gov/Blast.cgi) to span exon-exon junctions to avoid possible amplification of genomic DNA.
RT-qPCR: Isolated RNA was used in quantitative reverse transcription PCR (RT-qPCR) to measure the relative mRNA expression of the genes used. Reactions were performed using qScript One-Step SYBR green RT-qPCR, Low ROX Kit (Quantabio, Beverly, MA) in an AriaMx Real-time PCR system (Agilent, Santa Clara, CA). Reactions were prepared in a 96-well plate consisting of 10 μl of total volume. RNA was diluted using nuclease free water to total 15–25 ng. To create 9 μL of total reaction volume, 5 μL 2X One-Step Master Mix, 0.2 μL 1X qScript One-step Reverse transcriptase, 0.2 μL forward primer, 0.2 μL reverse primer, and 3.4 μL nuclease-free water were combined. To bring total reaction volume to 10 μL, 1 μL RNA was added to each well. The thermal cycling conditions consisted of the following: cDNA synthesis − 1 cycle/10 min/50°C, initial denaturation and Taq Polymerase activation − 1 cycle/5 min/95°C, denaturation − 40 cycles/10sec/95°C, annealing/extension − 1 cycle/30 sec/62°C. At the end of the cycling, a melt curve analysis was performed at 95°C for 1 min, 55°C for 30 sec, and 95°C for 30 sec. Dissociation curves were analyzed for primer specificity and absence of primer dimer formation.
Ribosomal protein L13A (rpl13a) was chosen as the housekeeping (hkg) gene because rpl13a has been previously identified as the most stable hkg in zebrafish for chemical treatment studies using qPCR analysis [ref. 36,ref. 37]. All samples were run in technical triplicate, and each plate contained all treatment groups (n = 2–7) (S1 Table).
RT-qPCR results were quantified using averaged cycle threshold (Ct) values from each technical replicate, which were determined after calculating a coefficient of variation (CV) for each qPCR reaction. CV was assessed for any inconsistency across replications. Comparative Ct values (ΔΔCt) were then determined for relative quantification of gene expression based on expression of the hkg gene. ΔΔCt values were then transformed to 2ΔΔCt to obtain the expression fold change for each treatment relative to the water control. Statistics comparing biological replicates were run using ΔCt.
Western blot.
For changes in protein levels, frozen single brains (n = 3 fish) or pooled retinal tissue (n = 6–12 retinas from 3–6 different fish) were analyzed using Western Blots. Protein samples were isolated and centrifuged using an NP-40 lysis buffer (catalog #J60766.AP; ThermoFisher). A BCA Protein Assay (catalog #23225, ThermoFisher) was performed to determine the amount of protein in the sample. 20 μg protein by volume was loaded into each well. 25 μL was loaded into each gel lane by loading the correct ratio of NP-40:Protein, and 5 μL of 4X loading dye (NuPage #NP007). PageRulerTM Plus prestained protein ladder (catalog #26620, ThermoFisher) was chosen to identify the proteins. The gel was transferred to a membrane using an iBlot 2 PVDF mini transfer stack (IB24002; ThermoFisher), and iBlot2 Gel transfer device (Invitrogen, Carlsbad, CA). The membrane was blocked in a 5% milk TBST solution (catalog #97062–370, VWR, Radnor, PA) for 30 minutes. Primary antibodies were then applied for either 1 hr at room temperature on a shaker table (80 rpm) or overnight at 4°C. Primary antibodies, and their dilution factors, were: claudin-5 1:500 (Invitrogen, Waltham, MA; #35–2500; RRID:AB_2533200), Occludin 1:750 (Invitrogen #71–1500; RRID:AB_2533977), JNK 1:1000 (Cell Signaling, Canvers, MA; #9252; RRID:AB_2250373), pJNK 1:750 (Cell Signaling #4668; RRID:AB_823588), AKT 1:1000 (Cell Signaling #9272; RRID:AB_329827), pAKT, 1:500 (Cell Signaling #9271; RRID:AB_329825), β-Actin (HKG) 1:1000 (Cell Signaling #4967; RRID:AB_330288).
Using TBST, the membrane was washed three times. A conspecific secondary antibody, diluted in 5% milk TBST, was applied and incubated for 45 minutes at room temperature. Claudin-5 received anti-mouse secondary antibody (Cell Signaling, 7076; RRID: AB_330924), while all other secondary antibodies were anti-rabbit (Cell Signaling, 7074; RRID:AB_2099233). All secondary antibodies were used at 1:2000 dilution. Using TBST, the membrane was washed an additional three times, after which the protein was stained with SuperSignal™ West Dura Extended Duration Chemiluminescent Substrate (ThermoFisher) for visualization. Blots were visualized using the ChemiDoc-It® Imaging System (UVP; Dallas, TX) with VisionWorks software.
Once the image was collected, the membrane was stripped using RestoreTM PLUS Western Blot Stripping Buffer (catalog #21059, ThermoFisher) before the next antibody was applied. Subsequent antibody exposure followed the above protocol. No more than four antibodies were used on a given blot.
Western blots were quantified using densitometry analysis in Image J software (https://imagej.net/ij/), and values were normalized to the β-Actin band. Fold change compared to Control (i.e., Water/Mannitol + Water) was calculated prior to statistical analysis. Each protein was considered its own dependent factor compared across the different groups.
Statistics
For all analyses, differences across treatment + exposure groups were assessed using Kruskal Wallis nonparametric ANOVA followed by pairwise comparisons. Data was analyzed using SPSS software (IBM, ver. 26, 27). All p-values were evaluated at an α-level of 0.05. Because of the multiple pairwise comparisons, p-values were adjusted using Bonferroni’s correction. For all figures * < 0.05, ** < 0.01, and *** < 0.001.
Results
A 20-min CBD treatment altered liver cytokine levels and lowered stress levels
To confirm that a 20-min CBD exposure was sufficient for tissue uptake, we performed two analyses. First, we examined expression of cytochrome P450 (cyp) genes in liver homogenates collected from exposed fish. Cyp genes aid in liver detoxification and are involved in metabolism of CBD. cyp3 is the most prominent gene in vertebrates [ref. 38], while cyp2aa2 is dominant in zebrafish [ref. 39]. Pregnane X receptor (PXR) regulates the expression of these cytochromes [ref. 40]. CBD is an agonist of PXR receptors and, in humans, cyp3a4 is a target gene of PXR [ref. 41]. RT-qPCR results identified significantly lower expression of PXR in CBD treated fish compared to controls (p = 0.04), with no change in expression for either cyp3c1 or cyp2aa2 genes (Fig 2A).
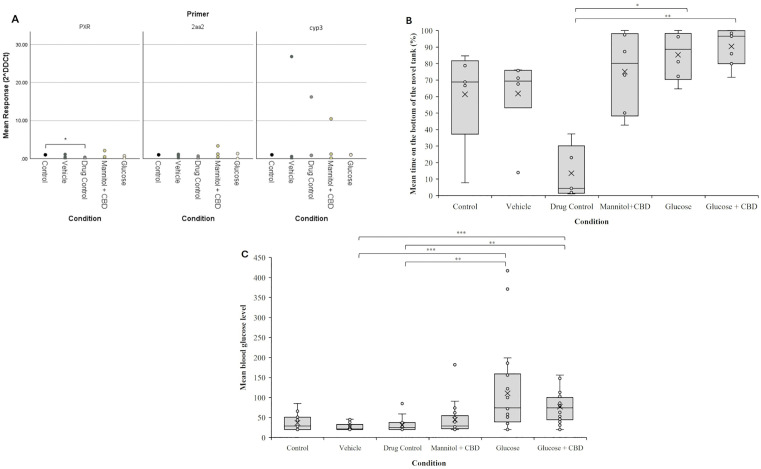
Second, we performed the Novel Tank Test as a behavioral analysis of CBD uptake [ref. 25]. Novel tank is a stress test in fish characterized by the fish staying at the bottom of the tank when first placed into the tank. How long the fish remains at the bottom and/or the time spent at the top of the tank are metrics used to identify stress responses. An increase in stress is characterized by more time at the bottom of the tank. Following 4-weeks of treatment and exposure conditions, CBD exposed fish spent an average of 14% of their time at the bottom of the tank, or 86% at the top of the tank (Fig 2B). This Novel Tank response of Drug Control (CBD exposed) fish was reduced compared to all other treatment + exposure groups, with significance observed compared to hyperglycemic zebrafish (p = 0.023), which averaged 85% of the time on the bottom, and Glucose + CBD fish (p = 0.002), which averaged 90% of the time on the bottom. Fish in Control and Vehicle groups spent between 75–80% of their time on the bottom of the tank. The results of this behavioral test identify an anxiolytic effect of CBD exposure, as previously reported in zebrafish [ref. 24,ref. 25] and indicate the exposure protocol was sufficient for compound uptake and efficacy.
Elevated blood glucose levels were not significantly reduced by CBD treatment
There was an overall significant effect of treatment on blood glucose levels (p < 0.001). Hyperglycemic zebrafish had significantly higher blood glucose levels than Vehicle (p = 0.003) and Drug Control (p = 0.002) groups (Fig 2C). However, blood glucose values for the Glucose group were not significantly different from either the Glucose + CBD or Mannitol + CBD groups. Thus, after 4-weeks of treatment, blood sugar levels were significantly elevated in hyperglycemic fish (mean ± SE; 110.58 ± 21.39 mg/dL), consistent with our previous findings [ref. 26,ref. 31]. Fish co-exposed to Glucose + CBD had mean blood glucose levels of 77.15 ± 9.3 mg/dL, a trending difference.
CBD co-exposure restored optomotor responses
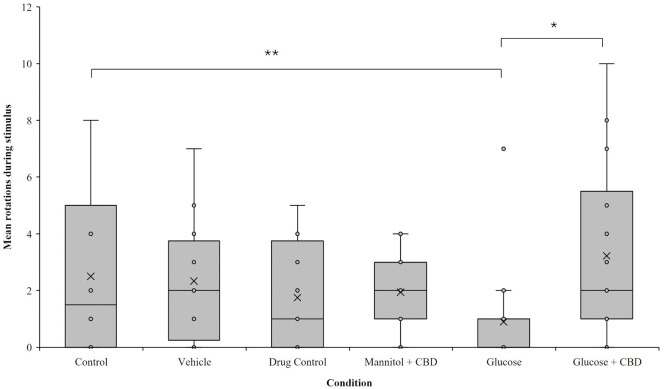
Optomotor responses (OMRs) measured visual-based behaviors. There was a significant overall effect of treatment + exposure on OMR response (p = 0.004). Pairwise analysis revealed that the hyperglycemic fish completed fewer rotations in the direction of the stimulus compared to fish in the Glucose + CBD (p = 0.023) and Control (p = 0.006) groups (Fig 3). Thus, OMR performance was reduced in hyperglycemic zebrafish and co-exposure with CBD prevented this result.
CBD co-exposure did not restore Glucose-induced changes in retinal ERG responses
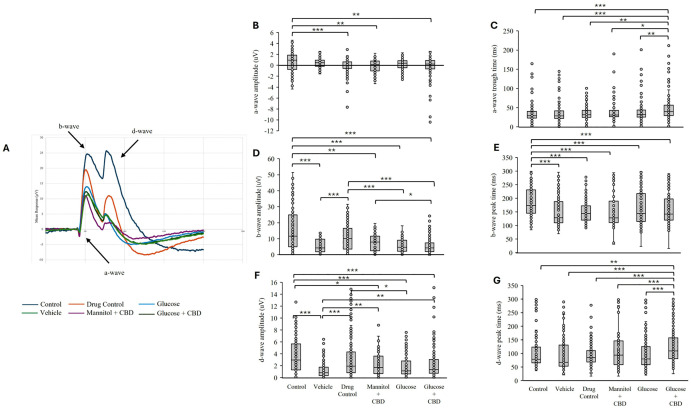
We previously observed a decrease in ERG b-wave amplitudes in hyperglycemic fish [ref. 28]. Here, we questioned whether the overall decreases in ERG responses could be mitigated by CBD co-exposure. Overall, we saw that Glucose treatments (both Glucose and Glucose + CBD) decreased ERG b- and d-wave amplitudes (Fig 4), indicating CBD co-exposure did not alter these ERG response components in Glucose treated fish.
Photoreceptor a-waves.
ERG a-waves measure the cone photoreceptor response at light ON. Examining a-wave amplitude and timing revealed significant differences in both parameters (amplitude: p < 0.001| timing p < 0.001) across all treatment + exposure groups. Individual pairwise comparisons revealed that the mean a-wave amplitude in the Glucose + CBD co-exposure group was significantly larger (more negative) than Control (p = 0.003); however, there was no difference in a-wave amplitude between the Glucose and Glucose + CBD groups (Fig 4A–4C). Timing of the a-wave trough was significantly delayed in the Glucose + CBD co-exposure group compared to all other treatments (p ≤ 0.04, Fig 4C). Thus, Glucose treatment alone did not change a-wave responses, but Glucose + CBD co-exposure delayed the a-wave response time.
ON-bipolar cell b-waves.
The most significant difference in ERG responses was observed for the b-wave. This represents the large depolarizing response of ON-bipolar cells in response to light [ref. 34]. We identified a significant effect of treatment + exposure on b-wave response amplitude (p < 0.001). Pairwise comparisons revealed significantly reduced b-wave amplitudes in both the Glucose (p ≤ 0.001) and Glucose + CBD (p ≤ 0.001) groups compared to the Control (Fig 4D). However, the b-wave amplitudes in these two groups were not significantly different from each other. ERG b-wave amplitude recorded from Glucose + CBD fish was also significantly different from CBD (Drug Control, p ≤ 0.001) and Mannitol + CBD (p = 0.046) exposure groups; b-wave amplitude in the Glucose group was reduced compared to amplitudes recorded from Drug Control fish (p ≤ 0.001). There was also a significant effect of treatment + exposure on the timing of the b-wave peak (p < 0.001; Fig 4E), with all treatment groups showing faster b-wave peak times compared to the Control (p ≤ 0.001).
Together, these results indicate hyperglycemic animals had decreased b-wave amplitudes consistent with our previous findings [ref. 28]. Glucose treatment also quickened the time to b-wave peak and co-exposure with CBD (Glucose + CBD) did not return these values to control levels.
Off-bipolar cell d-waves.
ERG d-waves represent the OFF-bipolar cell response. We observed a significant effect of treatment + exposure on d-wave amplitudes (p < 0.001) across all treatment groups (Fig 4F and 4G). However, there was no difference in d-wave amplitude between Glucose and Glucose + CBD groups (Fig 4F), though both were reduced compared to Control values (p ≤ 0.001). ERG d-wave amplitude in Glucose treated fish was also reduced compared to the Drug Control group (p = 0.013) and the d-wave amplitude in Glucose + CBD fish were reduced compared to Vehicle (p = 0.007) exposed fish. Similar to a-wave implicit times, Glucose + CBD delayed d-wave peak time compared all other groups (Fig 4G), including hyperglycemic fish (p < 0.001).
Thus, hyperglycemic fish receiving CBD had decreased d-wave amplitudes and delayed peak times compared to Drug Control fish that received only CBD, whereas hyperglycemia alone only decreased d-wave amplitude. This suggests impaired d-wave responses in Glucose + CBD zebrafish.
Expression of inflammatory markers was not changed by treatment or exposure
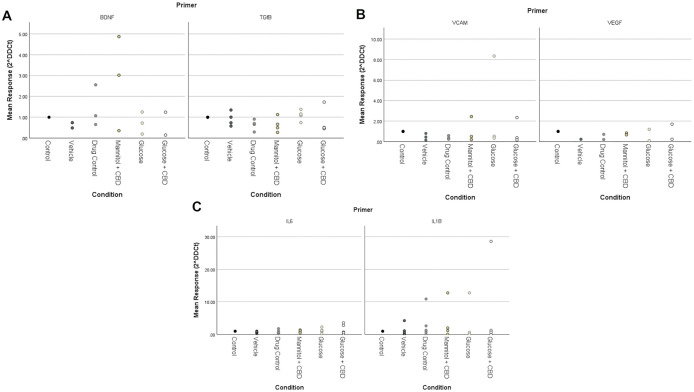
We used RT-qPCR to examine differences in mRNA expression of inflammatory cytokines (IL-1β, IL-6, TGFβ) and endothelial cell growth markers (BDNF, VEGF, and VCAM) known to be affected by hyperglycemia and/or altered NfκB levels [ref. 13]. We found no statistically significant differences in expression of either inflammatory or endothelial cell growth markers across treatment + exposure groups in zebrafish retinal tissue (Fig 5).
CBD co-exposure did not significantly affect protein levels
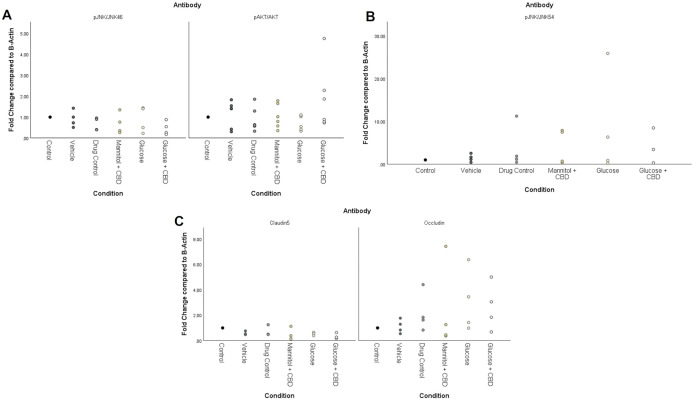
Across treatment groups, there was no statistically significant effect of treatment + exposure for any target protein (pJNK/JNK, pAKT/AKT, occludin, claudin-5) in retina homogenates (Fig 6). Representative Western Blots are shown in S1 Fig. However, results with a fold change of 2x (strong upregulation) or 0.5x (strong downregulation) were considered meaningful increases or decreases in protein, respectively [ref. 42]. Glucose + CBD had an average 2x fold increase in pAKT/AKT protein (Fig 6A) and a strong upregulation (average 4x fold change) in pJNK/JNK54 expression (Fig 6B). Expression of a different JNK isoform, JNK46, was not changed by treatment or exposure condition (Fig 6A). The AKT pathway promotes cell survival, therefore an upregulation in this pathway could be protective against increased inflammation seen in the JNK54 pathway. Similarly, both hyperglycemic and Glucose + CBD fish show downregulated claudin-5 (<0.5x fold change), but upregulated occludin levels (average 2x fold change). An increase in protein levels of the tight-junction occludin could be acting as compensatory for the loss of claudin-5.
Discussion
We assessed behavioral, molecular, and physiological endpoints of retinal function to determine the impact of CBD exposure on hyperglycemic complications in a zebrafish T2DM model. After 4-weeks of treatment, hyperglycemic zebrafish had significantly elevated blood glucose levels, as described previously [ref. 26,ref. 31]. CBD exposure was not effective in significantly lowering blood glucose levels compared to hyperglycemic fish. However, mean blood glucose levels were reduced in the Glucose + CBD group (Fig 2C), resulting in values similar to the Control, Vehicle, and Drug Control groups and identifying a trend in lowering blood glucose levels, as reported in the literature [ref. 43–ref. 45].
We have previously reported decreased OMRs in hyperglycemic zebrafish after up to 12-weeks of glucose treatment [ref. 29]. Our current results noted significantly decreased visual discrimination after 4-week of hyperglycemia in zebrafish, while Glucose + CBD showed significant protection against these visual deficits (Fig 3). To determine if the deficits observed in the OMRs were specific to the retina, we recorded ERGs. ERGs directly measure the responses of photoreceptors and bipolar cells in distal retina. As the OMR depends on the animal seeing the stimulus, we asked if the reduced positive OMRs in Glucose fish could be correlated with ERG changes (i.e., [ref. 46–ref. 48]) suggesting a retinal deficit. Previous work has reported reductions in a-wave, b-wave, and d-wave response amplitudes in zebrafish after 1-month of hyperglycemia [ref. 27,ref. 28]. Decreased b-wave amplitude was also reported in pdx1-/- zebrafish, a transgenic model of Type 1 DM [ref. 49]. Consistent with these reports, we found decreased b- and d-wave amplitudes in hyperglycemic fish. However, decreased b- and d-waves were also observed in Glucose + CBD fish, suggesting CBD exposure did not help restore bipolar cell responses (Fig 4D and 4F). Further, implicit times for a-wave and d-wave components were significantly delayed in the Glucose + CBD, but not Glucose, fish (Fig 4C and 4G). Thus, ERG deficits in hyperglycemic fish were not rescued by co-exposure with CBD, as we observed for OMRs. Given this difference, it is not likely that a distal retinal (i.e., ERG) difference underlies the treatment-specific changes in behavioral OMRs. While OMRs require retinal processing (to see the stimulus), they also involve brain and spinal cord circuits [ref. 50]. Thus, the observed differences in physiological vs. behavioral outcomes could reflect the differential sensitivity retinal vs. non-retinal areas of the CNS (such as the brain and the spinal cord [ref. 51,ref. 52]) to CBD. The anxiolytic effects of CBD, for example, are attributed to interactions between CBD and serotonin (5-HT1A) receptors in brain [ref. 53]. We observed reduced anxiety in CBD treated fish (Fig 2B), with no change in total distance traveled (data not shown), suggesting a CBD-specific effect on individual brain circuits. Such a CBD-specific effect could be impacting circuits involved in generating the OMR. Hyperglycemia, therefore, may impact the broader CNS, over which CBD exposure may have a protective influence on generalized circuits.
We previously reported changes in NFκB (Rel-A) and GFAP protein in retinal homogenates after 4-weeks of hyperglycemia [ref. 11,ref. 28] suggesting inflammation. Here, we focused on other cytokines known to be altered by high blood sugar [ref. 54,ref. 55]. Surprisingly, we observed few statistical differences for any gene of interest across our treatment + exposure groups. In fact, examination of the fold changes in Glucose vs. Glucose + CBD groups (Fig 5), shows the same trends for four of the six genes examined (exceptions are due to the large outliers for VCAM and IL1β in Glucose and/or Glucose + CBD tissue), suggesting a similar outcome across groups. Similarly, comparisons of Control vs. Drug Control (i.e., fish receiving CBD or not) shows trending decreases in expression of TGFβ, VCAM, VEGF, and IL6 in CBD-exposed fish, possibly reflecting a drug effect. We acknowledge that these differences only suggest interesting trends and that future studies with a larger sample size, and less variability, are needed. However, the results could also indicate that CBD has pathway- or cytokine-specific effects or that the inability of CBD co-exposure to significantly lower blood sugar levels prevents correction of gene expression changes triggered by hyperglycemia.
We assessed the efficacy of our CBD exposure protocol at both molecular and behavioral levels. Behaviorally, we observed that Drug Control fish spent significantly less time at the bottom of the tank during the Novel Tank Test (Fig 2B). This suggests that CBD was having an anxiolytic impact, as previously reported in zebrafish [ref. 24,ref. 25], rats [ref. 22], and mice [ref. 23] and indicating uptake of CBD by the fish in our exposure conditions. At the molecular level, we assessed expression of three genes in the liver, pxr, cyp2aa2, and cyp3c1, which are involved in metabolism/breakdown of potential toxins. In mammals, liver metabolism of CBD occurs by activating cytochrome 450 (CYP) enzymes such as CYP3A4 and CYP2C19 [ref. 56]. These enzymes, particularly cyp3a4, are downstream target genes of activated PXR [ref. 38] and CBD is an agonist of PXR [ref. 41]. Zebrafish liver also expresses cyp3a [ref. 40] or cyp3c1 (according to GeneBank) and cyp2aa2 [ref. 39], both of which are downstream of PXR activation [ref. 39,ref. 40]. Thus, we reasoned that CBD exposure should increase expression of pxr, cyp3c1, and cyp2aa2 in zebrafish liver, indicating compound metabolism. However, we observed a decrease in pxr expression and no change in either cyp2aa2 or cyp3c1 in zebrafish liver homogenates (Fig 2A). We suggest three possible explanations for these results. First, the absence of an increase in cyp expression could be due to the short CBD exposure time. CBD uptake in zebrafish larvae peaked after 60 minutes of exposure with the subsequent decline attributed to CBD metabolism/excretion [ref. 24]. Our exposure duration of 20 minutes may not have been sufficiently long enough to induce changes in gene expression associated with CBD metabolism, though compound uptake occurred. Alternatively, CBD is reported to inhibit CYP3A activity in untreated mouse livers [ref. 57]. If CBD inhibition of CYP enzymes was occurring in our study, it could be represented as no change in gene expression. Finally, as an agonist of PXR, CBD binding PXR could have triggered a negative feedback pathway leading to reduced pxr expression and little or no changes in either cyp3c1 or cyp2aa2 expression levels. PXR is a nuclear receptor that forms heterodimers prior to binding to DNA response elements [ref. 58]. Reduced numbers of PXR, due to negative feedback, would reduce heterodimer formation which would inhibit subsequent gene expression.
DR progression upregulates the MAPK pathway(s), increasing phosphorylation of JNK and NFκB [ref. 12,ref. 13]. Based on our previous findings [ref. 11,ref. 28], we expected to observe changes in JNK protein levels. However, expression of pJNK/JNK46 was consistent across retinal homogenates from all treatment + exposure groups (Fig 6A). We also observed no statistical differences for either the pJNK/JNK54 isoform or pAKT/AKT (Fig 6A and 6B). However, pAKT/AKT levels were larger in the Glucose + CBD group compared to the Glucose group; while pJNK/JNK54 showed the opposite trend. This data suggests that AKT signaling (cell survival) is increased in Glucose + CBD conditions, whereas JNK54 signaling (inflammation) is increased in hyperglycemic retinas.
Inflammation induced by hyperglycemia compromises the BRB [ref. 59,ref. 60] by altering the availability of tight junction proteins [ref. 9,ref. 12]. We found overall higher levels of occludin protein (vs. claudin-5) in zebrafish retinal homogenates (Fig 6C), suggesting occludin may play a larger role in this tissue. Interestingly, occludin protein levels were observed to increase for both Glucose and Glucose + CBD fish, suggesting that CBD did not negate the impact of hyperglycemia on retinal occludin levels. Conversely, claudin-5 levels were reduced in both Glucose and Glucose + CBD fish (0.52x and 0.36x, respectively), suggesting CBD does not alter hyperglycemia-induced decreases in this protein. The opposite effects of hyperglycemia on these proteins could be due to their different roles within the junctional complex [ref. 61]. A decrease in claudin-5 may cause an increase in occludin to protect the integrity of the BRB [ref. 61]. The observed effects in our retinal tissue could be due to this compensatory mechanism triggered by hyperglycemic insult.
In summary, CBD significantly mitigated the hyperglycemia-induced visual deficits within the OMR task in Type 2 DM zebrafish, however, the impact of CBD exposure depended on the outcome measured. CBD co-exposure did not significantly impact protein levels of inflammatory markers nor did CBD exposure restore ERG deficits in b-wave and d-wave amplitudes observed in Glucose treated retinas. Likewise, both Glucose + CBD and Glucose treated fish showed similar changes to claudin-5 and occludin protein levels with the latter showing greater variation in responses. Therefore, we cannot conclude that CBD co-exposure was able to prevent the onset of visual deficits associated with hyperglycemia. Rather, we identify differential effects of CBD on hyperglycemia-associated behavioral vs. cellular outcomes. The overall increase in OMR score, lowered inflammation, lowered blood-glucose levels, and protected tight junction markers, suggest that CBD co-exposure could be considered to prevent the progression of microvascular complications.
Limitations and future directions
While we tried to address the experimental constraints throughout the project, we can identify some limitations of the current work. First, cytokine expression was examined at the gene level at specific experimental time points. Cytokines may only be expressed for a short duration of time at the gene level, which may/may not correspond to our experimental timepoints, making differences and specificity hard to detect. Additionally, the mode of CBD administration may have been limiting. Bath administrations, over three trials, leads to unregulated uptake of CBD by the fish. Future studies with more chronic exposure or assessments immediately after exposure could resolve this issue. We also note uneven sample sizes across experiments. While our initial sample size was robust (based on a power analysis with an ANOVA design, 0.8 power, effect size of 0.5, and α = 0.05), these fish were subdivided for the molecular analyses, and we were not always successful in extracting enough pure RNA or protein from the retinas. Finally, another limitation is the use of the OMR vs. ERG analysis. While both assess vision, the ERG is a retina-specific analysis, while the OMR uses the retina as well as circuits in both the brain and the spinal cord. Some ERG responses were unexpected, such as the large variability in Control a-wave responses due to some positive values. It was also not uncommon to see fish swimming in the opposite direction of the OMR, though they also swam with the stimulus, suggesting more than one neuronal circuit is used for this response. A retina-specific behavior, such as the optokinetic response (OKR), would be a better behavioral correlate to the ERG. However, OKRs are difficult to do in adult animals because they require the animal to be immobilized during recordings.
Future experiments should continue to look at the different pathways implicated by inflammation such as the NFκB pathway and the p38 MAPK pathway. Furthermore, brain regions correlated to learning and memory, such as the lateral pallium and the telencephalon [ref. 62–ref. 64] could be examined for evidence of CBD recovery that might not be evident in other analyses. Given the wide range of effective CBD dosages studied in zebrafish [ref. 65], a higher dose could be considered. Overall, this research suggests that CBD may be a very powerful tool to prevent the progression of retinal microvascular complications associated with hyperglycemia, though the specific mechanisms are not yet uncovered.
Supplementary Materials
- Primer Pair sequences used for qPCRs.Each gene has a forward and backward primer associated with it. Each primer pair runs from the 5’ to the 3’ end. We had six genes of interest and one housekeeping gene (HKG). All genes were standardized to the HKG upon analysis.(DOCX) (DOCX)
- Western Blot analysis of inflammatory pathways.Representative Western Blots for (A) JNK, pJNK (B) AKT, pAKT and (C) occludin, claudin-5. Each blot contained all treatment groups, and each treatment group was run in biological duplicate. β-actin was used as the housekeeping protein on the blots and researchers normalized densitometry values to B-actin prior to analysis. Densitometry of blots was used to identify differences in protein levels.(PDF) (PDF)
- Representative optomotor response (OMR) video.OMRs were recorded by projecting a spinning pinwheel stimulus beneath the fish for 30 sec, followed by a white light stimulus for 30 sec. This sequence was repeated 3 times for a total recording duration of 3 minutes. While the fish could move with or against the stimulus, a positive OMR response was assessed by counting each complete rotation made in the same direction of the stimulus.(MP4) (MP4)
References
- 1CDC. Diabetes [Internet]; 2024 [cited 2024 Aug 8]. National Diabetes Statistics Report. Available from: https://www.cdc.gov/diabetes/php/data-research/index.html
- S Demir, PP Nawroth, S Herzig, B Ekim Üstünel. Emerging targets in type 2 diabetes and diabetic complications.. Adv Sci (Weinh)., 2021. [DOI | PubMed]
- F Zaccardi, DR Webb, T Yates, MJ Davies. Pathophysiology of type 1 and type 2 diabetes mellitus: a 90-year perspective.. Postgrad Med J., 2016. [DOI | PubMed]
- GN Gelcho, FS Gari. Time to diabetic retinopathy and its risk factors among diabetes mellitus patients in Jimma University Medical Center, Jimma, Southwest Ethiopia.. Ethiop J Health Sci., 2022. [DOI | PubMed]
- W Crasto, V Patel, MJ Davies, K Khunti. Prevention of microvascular complications of diabetes.. Endocrinol Metab Clin North Am., 2021. [DOI | PubMed]
- K Papatheodorou, N Papanas, M Banach, D Papazoglou, M Edmonds. Complications of diabetes.. J Diabetes Res., 2016. [DOI | PubMed]
- DC Saini, A Kochar, R Poonia. Clinical correlation of diabetic retinopathy with nephropathy and neuropathy.. Indian J Ophthalmol., 2021. [DOI | PubMed]
- R Simó, C Hernández. New insights into treating early and advanced stage diabetic retinopathy.. Int J Mol Sci., 2022. [DOI | PubMed]
- W Wang, ACY Lo. Diabetic retinopathy: pathophysiology and treatments.. Int J Mol Sci., 2018. [DOI | PubMed]
- K Noda, S Nakao, S Ishida, T Ishibashi. Leukocyte adhesion molecules in diabetic retinopathy.. J Ophthalmol., 2012. [DOI | PubMed]
- CJ Rowe, M Delbridge-Perry, NF Bonan, A Cohen, M Bentley, KL DeCicco-Skinner. Time dependent effects of prolonged hyperglycemia in zebrafish brain and retina.. Front Ophthalmol (Lausanne)., 2022. [DOI | PubMed]
- PM Pitale, MS Gorbatyuk. Diabetic retinopathy: from animal models to cellular signaling.. Int J Mol Sci., 2022. [DOI | PubMed]
- T Yue, Y Shi, S Luo, J Weng, Y Wu, X Zheng. The role of inflammation in immune system of diabetic retinopathy: molecular mechanisms, pathogenetic role and therapeutic implications.. Front Immunol., 2022. [DOI | PubMed]
- SC Britch, S Babalonis, SL Walsh. Cannabidiol: pharmacology and therapeutic targets.. Psychopharmacology (Berl)., 2021. [DOI | PubMed]
- MS García-Gutiérrez, F Navarrete, A Gasparyan, A Austrich-Olivares, F Sala, J Manzanares. Cannabidiol: a potential new alternative for the treatment of anxiety, depression, and psychotic disorders.. Biomolecules., 2020. [DOI | PubMed]
- S Atalay Ekiner, A Gęgotek, E Skrzydlewska. The molecular activity of cannabidiol in the regulation of Nrf2 system interacting with NF-κB pathway under oxidative stress.. Redox Biol., 2022. [DOI | PubMed]
- M Rajesh, P Mukhopadhyay, S B átkai, V Patel, K Saito, S Matsumoto. Cannabidiol attenuates cardiac dysfunction, oxidative stress, fibrosis, and inflammatory and cell death signaling pathways in diabetic cardiomyopathy.. JACC., 2010. [DOI | PubMed]
- A Vallée, J-N Vallée, Y Lecarpentier. Potential role of cannabidiol in Parkinson’s disease by targeting the WNT/β-catenin pathway, oxidative stress and inflammation.. Aging (Albany NY)., 2021. [DOI | PubMed]
- S Atalay, I Jarocka-Karpowicz, E Skrzydlewska. Antioxidative and anti-inflammatory properties of cannabidiol.. Antioxidants., 2019. [DOI | PubMed]
- HM Jensen, R Korbut, PW Kania, K Buchmann. Cannabidiol effects on behaviour and immune gene expression in zebrafish (Danio rerio).. PLoS One., 2018. [DOI | PubMed]
- M Wright, P Di Ciano, B Brands. Use of cannabidiol for the treatment of anxiety: a short synthesis of pre-clinical and clinical evidence.. Cannabis Cannabinoid Res., 2020. [DOI | PubMed]
- H Zlatanova-Tenisheva, M Georgieva-Kotetarova, N Vilmosh, I Kandilarov, D Delev, T Dermendzhiev. Exploring the anxiolytic, antidepressant, and immunomodulatory effects of cannabidiol in acute stress rat models.. Appl Biosci., 2025. [DOI]
- G Shu, Y He, J Suo, C Wu, X Gong, Y Xiang. Cannabidiol exhibits anxiolytic-like effects and antipsychotic-like effects in mice models.. Neurosci Lett., 2024. [DOI | PubMed]
- JC Achenbach, J Hill, JPM Hui, MG Morash, F Berrue, LD Ellis. Analysis of the uptake, metabolism, and behavioral effects of cannabinoids on zebrafish larvae.. Zebrafish., 2018. [DOI | PubMed]
- LR Nazario, Jr Antonioli R, KM Capiotti, JEC Hallak, AW Zuardi, JAS Crippa. Caffeine protects against memory loss induced by high and non-anxiolytic dose of cannabidiol in adult zebrafish (Danio rerio).. Pharmacol Biochem Behav., 2015. [DOI | PubMed]
- M Gleeson, V Connaughton, LS Arneson. Induction of hyperglycaemia in zebrafish (Danio rerio) leads to morphological changes in the retina.. Acta Diabetol., 2007. [DOI | PubMed]
- Y Alvarez, K Chen, AL Reynolds, N Waghorne, JJ O’Connor, BN Kennedy. Predominant cone photoreceptor dysfunction in a hyperglycaemic model of non-proliferative diabetic retinopathy.. Dis Model Mech., 2010. [DOI | PubMed]
- Z Tanvir, RF Nelson, K DeCicco-Skinner, VP Connaughton. One month of hyperglycemia alters spectral responses of the zebrafish photopic electroretinogram.. Dis Model Mech., 2018. [DOI | PubMed]
- E McCarthy, J Dunn, K Augustine, VP Connaughton. Prolonged hyperglycemia causes visual and cognitive deficits in Danio rerio.. Int J Mol Sci., 2022. [DOI | PubMed]
- E McCarthy, CJ Rowe, M Crowley-Perry, VP Connaughton. Alternate immersion in glucose to produce prolonged hyperglycemia in zebrafish.. J Vis Exp., 2021. [DOI | PubMed]
- VP Connaughton, C Baker, L Fonde, E Gerardi, C Slack. Alternate immersion in an external glucose solution differentially affects blood sugar values in older versus younger zebrafish adults.. Zebrafish., 2016. [DOI | PubMed]
- A Hasumi, H Maeda, KI Yoshida. Analyzing cannabinoid-induced abnormal behavior in a zebrafish model.. PLoS One., 2020. [DOI | PubMed]
- MK LeFauve, CJ Rowe, M Crowley-Perry, JL Wiegand, AG Shapiro, VP Connaughton. Using a variant of the optomotor response as a visual defect detection assay in zebrafish.. J Biol Methods., 2021. [DOI | PubMed]
- RF Nelson, N Singla. A spectral model for signal elements isolated from zebrafish photopic electroretinogram.. Vis Neurosci., 2009. [DOI | PubMed]
- JS Jensen, P Owrang, A Sherffius, C Selby, NR Fleming, L Ouellette. Early life tributyltin exposure has long term physiological effects on the zebrafish (Danio rerio) visual system.. Comp Biochem Physiol C Toxicol Pharmacol., 2026. [DOI | PubMed]
- R Tang, A Dodd, D Lai, WC McNabb, DR Love. Validation of zebrafish (Danio rerio) reference genes for quantitative real-time RT-PCR normalization.. Acta Biochim Biophys Sin (Shanghai)., 2007. [DOI | PubMed]
- H Xu, C Li, Q Zeng, I Agrawal, X Zhu, Z Gong. Genome-wide identification of suitable zebrafish Danio rerio reference genes for normalization of gene expression data by RT-qPCR.. J Fish Biol., 2016. [DOI | PubMed]
- L Shaya, C Dejong, JY Wilson. Expression patterns of cytochrome P450 3B and 3C genes in model fish species.. Comp Biochem Physiol C Toxicol Pharmacol., 2014. [DOI | PubMed]
- A Kubota, ACD Bainy, BR Woodin, JV Goldstone, JJ Stegeman. The cytochrome P450 2AA gene cluster in zebrafish (Danio rerio): expression of CYP2AA1 and CYP2AA2 and response to phenobarbital-type inducers.. Toxicol Appl Pharmacol., 2013. [DOI | PubMed]
- T Bresolin, M De Freitas Rebelo, A Celso Dias Bainy. Expression of PXR, CYP3A and MDR1 genes in liver of zebrafish.. Comp Biochem Physiol Part C Toxicol Pharmacol., 2005. [DOI]
- AJ Lau, TKH Chang. Species differences in pregnane X receptor activation by Δ-9-tetrahydrocannabinol, cannabidiol, and cannabinol.. Biochem Biophys Res Commun., 2026. [DOI | PubMed]
- L Pillai-Kastoori, AR Schutz-Geschwender, JA Harford. A systematic approach to quantitative Western blot analysis.. Anal Biochem., 2020. [DOI | PubMed]
- J Gorelick, T Assa-Glazer, G Zandani, A Altberg, N Sela, A Nyska. THC and CBD affect metabolic syndrome parameters including microbiome in mice fed high fat-cholesterol diet.. J Cannabis Res., 2022. [DOI | PubMed]
- JA Kajero, S Seedat, J Ohaeri, A Akindele, O Aina. Investigation of the effects of cannabidiol on vacuous chewing movements, locomotion, oxidative stress and blood glucose in rats treated with oral haloperidol.. World J Biol Psychiatry., 2020. [DOI | PubMed]
- MRT Zorzenon, AN Santiago, MA Mori, S Piovan, CA Jansen, ME Perina Padilha. Cannabidiol improves metabolic dysfunction in middle-aged diabetic rats submitted to a chronic cerebral hypoperfusion.. Chem Biol Interact., 2019. [DOI | PubMed]
- DN Weber, VP Connaughton, JA Dellinger, D Klemer, A Udvadia, MJ Carvan. Selenomethionine reduces visual deficits due to developmental methylmercury exposures.. Physiol Behav., 2008. [DOI | PubMed]
- R Bahadori, M Huber, O Rinner, MW Seeliger, S Geiger-Rudolph, R Geisler. Retinal function and morphology in two zebrafish models of oculo-renal syndromes.. Eur J Neurosci., 2003. [DOI | PubMed]
- A Avanesov, J Malicki. Approaches to study neurogenesis in the zebrafish retina.. Methods Cell Biol., 2004. [DOI | PubMed]
- Z Ali, J Zang, N Lagali, N Schmitner, W Salvenmoser, A Mukwaya. Photoreceptor degeneration accompanies vascular changes in a zebrafish model of diabetic retinopathy.. Invest Ophthalmol Vis Sci., 2020. [DOI | PubMed]
- EA Naumann, JE Fitzgerald, TW Dunn, J Rihel, H Sompolinsky, F Engert. From whole-brain data to functional circuit models: the zebrafish optomotor response.. Cell., 2016. [DOI | PubMed]
- KJ Nabata, EK Tse, TE Nightingale, AHX Lee, JJ Eng, M Querée. The therapeutic potential and usage patterns of cannabinoids in people with spinal cord injuries: a systematic review.. Curr Neuropharmacol., 2021. [DOI | PubMed]
- PA Thomas, GT Carter, CH Bombardier. A scoping review on the effect of cannabis on pain intensity in people with spinal cord injury.. J Spinal Cord Med., 2022. [DOI | PubMed]
- AW Zuardi, JA Crippa, JEC Hallak. The anxiolytic effects of cannabidiol (CBD). In:. Handbook of cannabis and related pathologies [Internet]., 2017. [DOI]
- K Alexandraki, C Piperi, C Kalofoutis, J Singh, A Alaveras, A Kalofoutis. Inflammatory process in type 2 diabetes.. Ann N Y Acad Sci., 2006. [DOI | PubMed]
- S Biswas, M Sarabusky, S Chakrabarti. Diabetic retinopathy, lncRNAs, and inflammation: a dynamic, interconnected network.. J Clin Med., 2019. [DOI]
- O Zendulka, G Dovrtělová, K Nosková, M Turjap, A Šulcová, L Hanuš. Cannabinoids and cytochrome P450 interactions.. CDM., 2016. [DOI]
- LM Bornheim, MA Correia. Selective inactivation of mouse liver cytochrome P-450IIIA by cannabidiol.. Mol Pharmacol., 1990. [DOI | PubMed]
- JM Pascussi, S Gerbal-Chaloin, L Drocourt, P Maurel, MJ Vilarem. The expression of CYP2B6, CYP2C9 and CYP3A4 genes: a tangle of networks of nuclear and steroid receptors.. Biochim Biophys Acta., 2003. [DOI | PubMed]
- H-Z Xu, Z Song, S Fu, M Zhu, Y-Z Le. RPE barrier breakdown in diabetic retinopathy: seeing is believing.. J Ocul Biol Dis Inform., 2011. [DOI | PubMed]
- C Zhang, H Wang, J Nie, F Wang. Protective factors in diabetic retinopathy: focus on blood-retinal barrier.. Discov Med., 2014. [PubMed]
- M Rudraraju, SP Narayanan, PR Somanath. Regulation of blood-retinal barrier cell-junctions in diabetic retinopathy.. Pharmacol Res., 2020. [DOI | PubMed]
- R-K Cheng, SJ Jesuthasan, TB Penney. Zebrafish forebrain and temporal conditioning.. Philos Trans R Soc Lond B Biol Sci., 2014. [DOI | PubMed]
- K Reemst, H Shahin, OD Shahar. Learning and memory formation in zebrafish: protein dynamics and molecular tools.. Front Cell Dev Biol., 2023. [DOI | PubMed]
- T Ruhl, K Moesbauer, N Oellers, G von der Emde. The endocannabinoid system and associative learning and memory in zebrafish.. Behav Brain Res., 2015. [DOI | PubMed]
- R Licitra, M Marchese, V Naef, A Ogi, M Martinelli, C Kiferle. A review on the bioactivity of cannabinoids on zebrafish models: emphasis on neurodevelopment.. Biomedicines., 2022. [DOI | PubMed]